78% of the Bitcoin Supply is Not Liquid
Quantifying the amount of liquid and illiquid BTC supply and its relationship to Bitcoin's price.

TL;DR We analyse Bitcoin entities and classify them into one of three liquidity categories: highly liquid, liquid, and illiquid. Our methodology suggests that currently 14.5 million BTC (78% of the circulating Bitcoin supply) is held by illiquid entities. Our analyses show a clear relationship between Bitcoin liquidity and the BTC market. The metrics introduced here are live on Glassnode Studio.

By Kilian Heeg and Rafael Schultze-Kraft
The amount of available BTC at any given point in time is preprogrammed according to Bitcoin's design. With 88.5% of the total supply already mined, at the time of writing, the circulating supply of Bitcoin is ~18,6 million.
However, the number of bitcoins actually available for buying and selling, is much lower. Not only can we expect that a substantial amount of mined BTC is lost forever (we estimate this number to be ~3M BTC), but as Bitcoin continues to become more and more a Store of Value and investors increasingly HODL making use of it as a safe haven asset to store wealth, the actual "liquid" Bitcoin supply can be expected to be considerably lower.
Quantifying Bitcoin's liquidity is essential to understand its market. If many bitcoins are illiquid, a supply-side crisis emerges – which has a weakening effect on BTC's selling pressure in the market. Or put differently: A sustained rise of illiquid bitcoins is an indication of strong investor hodling sentiment and a potential bullish signal.
Quantifying Bitcoin Liquidity
In order to quantify the state of Bitcoin liquidity, we focus on Bitcoin entities. Entities are individuals or institutions that control a set of addresses in the Bitcoin network. Since it is the entities that control the supply, it is their behavior that determines whether their BTC contributes to the total liquidity or not.
For example, consider long-term investors who keep their BTC locked in a cold wallet with the intention of holding it for long periods of time: Their BTC is practically removed from the liquid portion of the Bitcoin supply that is in circulation and accessible for trading. In contrast, exchanges with constant in- and outflows directly contribute to the pool of liquid supply.
As a measure of an entity's liquidity, we use the ratio of the cumulative outflows and cumulative inflows over the entity's lifespan. This ratio yields a number L between zero and one, with larger values indicating higher liquidity. Liquidity is therefore the extent to which an entity spends the assets it receives. Illiquid entities are those that hoard coins in anticipation of a long-term BTC price appreciation.
Hence, a HODLer that never sells (i.e. spends their bitcoin on-chain) has L = 0. On the other hand, a very active entity which buys and sells BTC on a regular basis, such as an exchange, has an asymptotic value of L ~ 1.
Note that an entity which sells its entire position will have a value of L = 1. However, since its supply becomes zero (because the entity spent its entire stack), it won't contribute to the analysis.
We emphasize that "in-house" transfers are not included in our calculation of L. In-house (or internal) transfers are bitcoins moved/transferred within addresses controlled by the same entity. Taking this into account gives a more accurate picture of the actual liquidity, as a single entity cannot artificially bump its L solely via internal transfers. An example is the movement of large amounts of BTC within an exchange – this happens when new cold wallets are created or funds are reshuffled internally.
We define three different liquidity categories. An entity is considered to be:
- illiquid if:
L < 0.25 - liquid if:
0.25 ≤ L < 0.75 - highly liquid if:
L ≥ 0.75
However, as we have already discussed in our previous work on "Quantifying Short-Term and Long-Term Holder Bitcoin Supply", such sharp classification thresholds can give rise to artifacts in the resulting data when important entities suddenly cross the threshold. While related approaches have been put forward, we use a superior methodology by employing weights from logistic functions with midpoints centered around the thresholds (Figure 1) to attribute the liquidity classes to each entity, and obtain a smooth transition between liquidity categories.
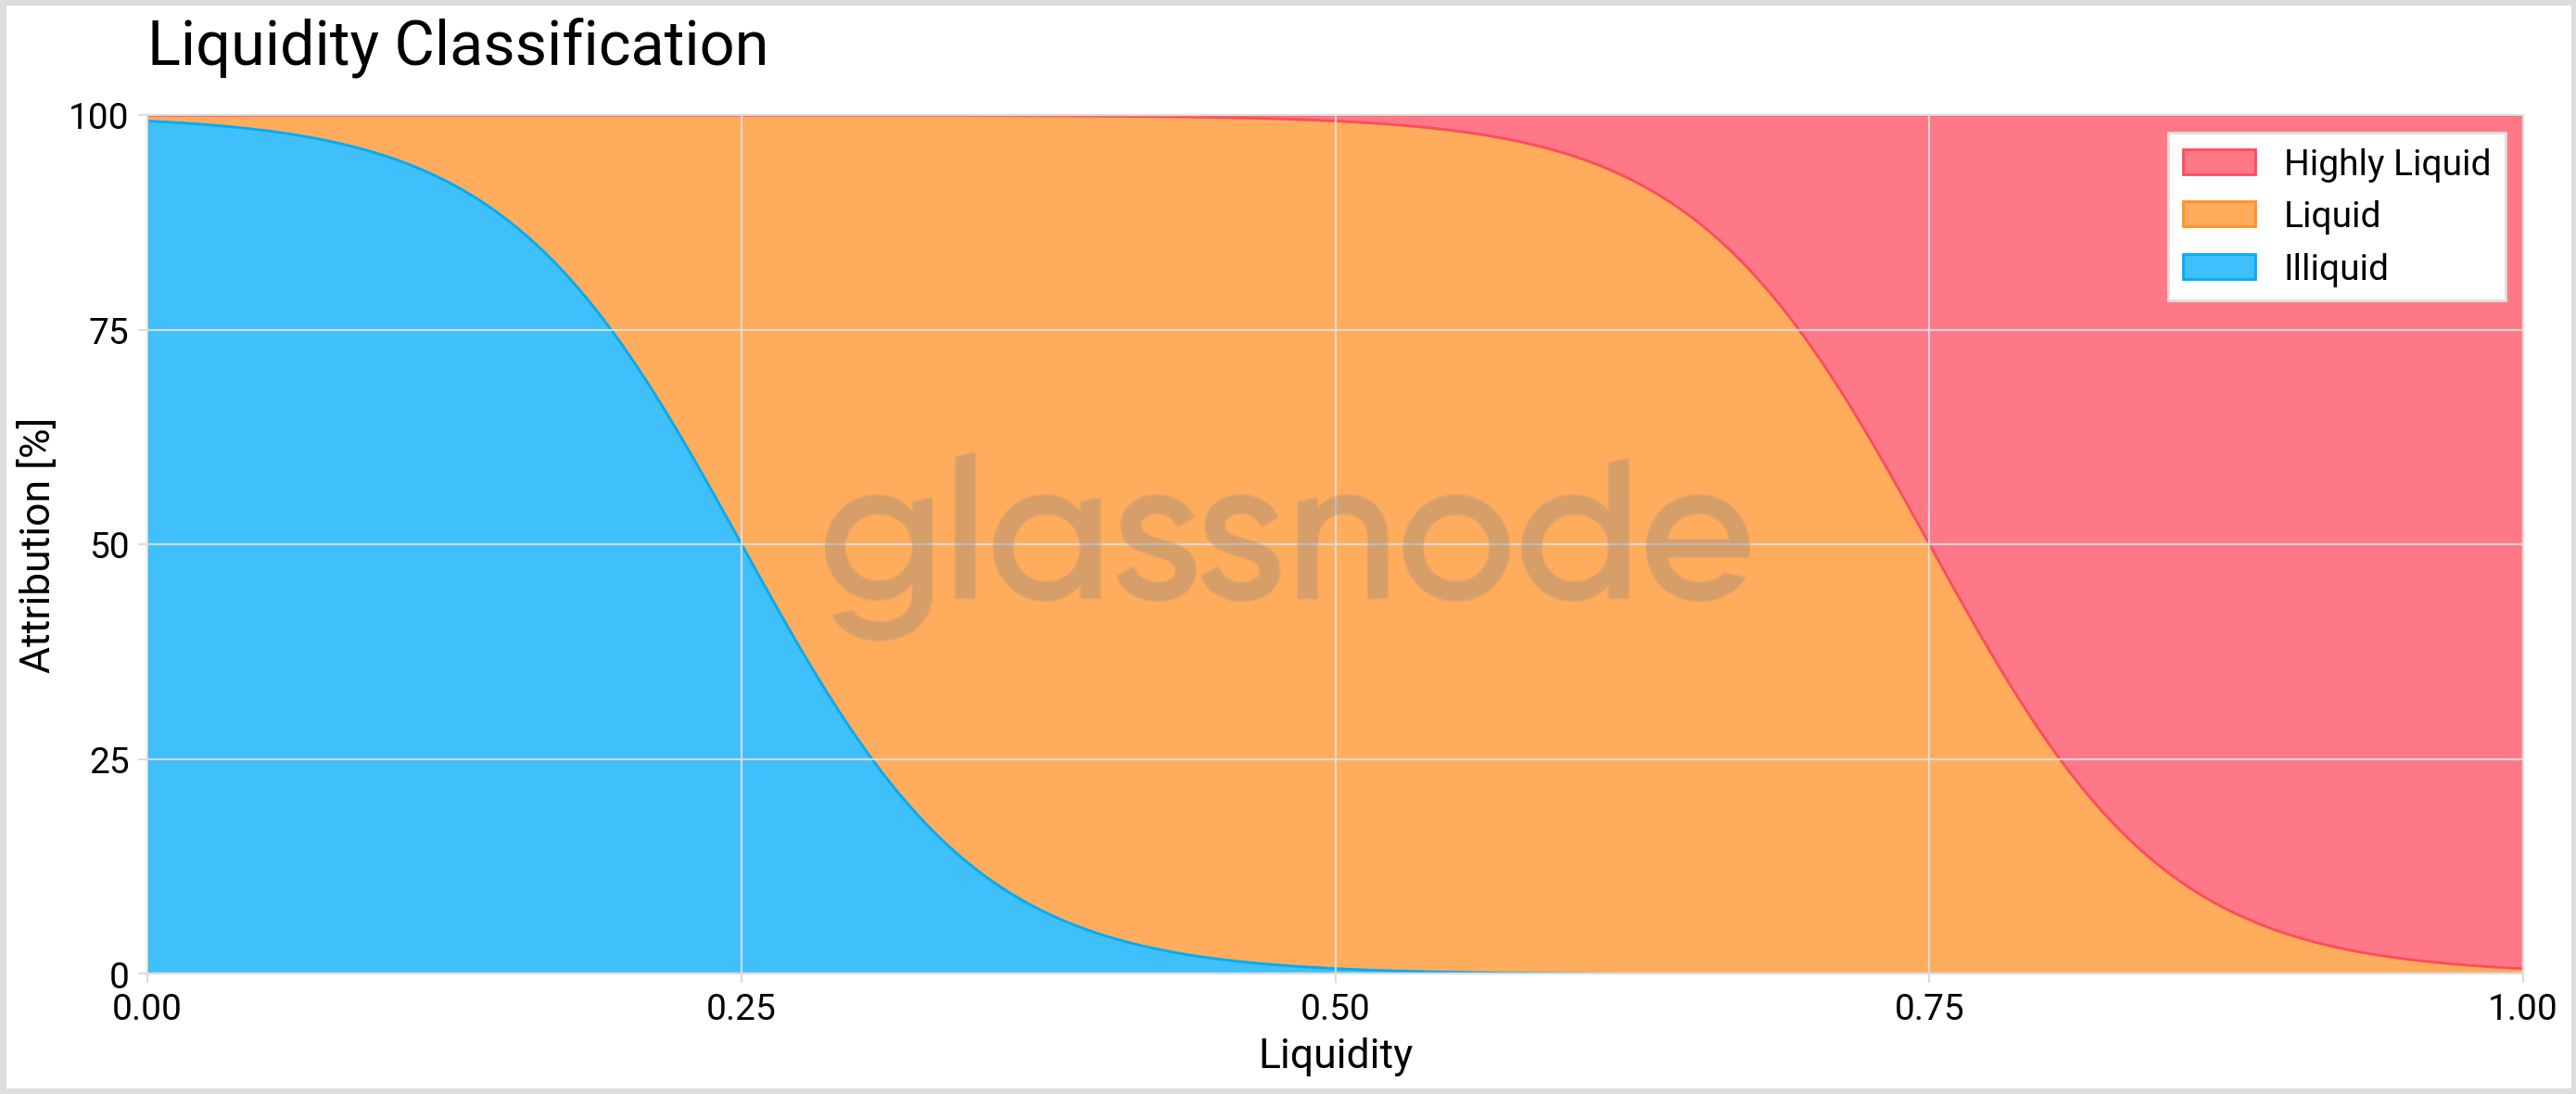
By distributing an entity's supply into the three liquidity buckets according to these weights, we obtain the amount of illiquid, liquid, and highly liquid BTC supply. For instance, if an entity has spent 25% of all BTC it has received over the course of its lifespan, the amount they hold will contribute 50% to the liquid and 50% to the illiquid bucket.
Results
Quantifying the entire circulating Bitcoin supply with the above methodology, we end up with the following figure:
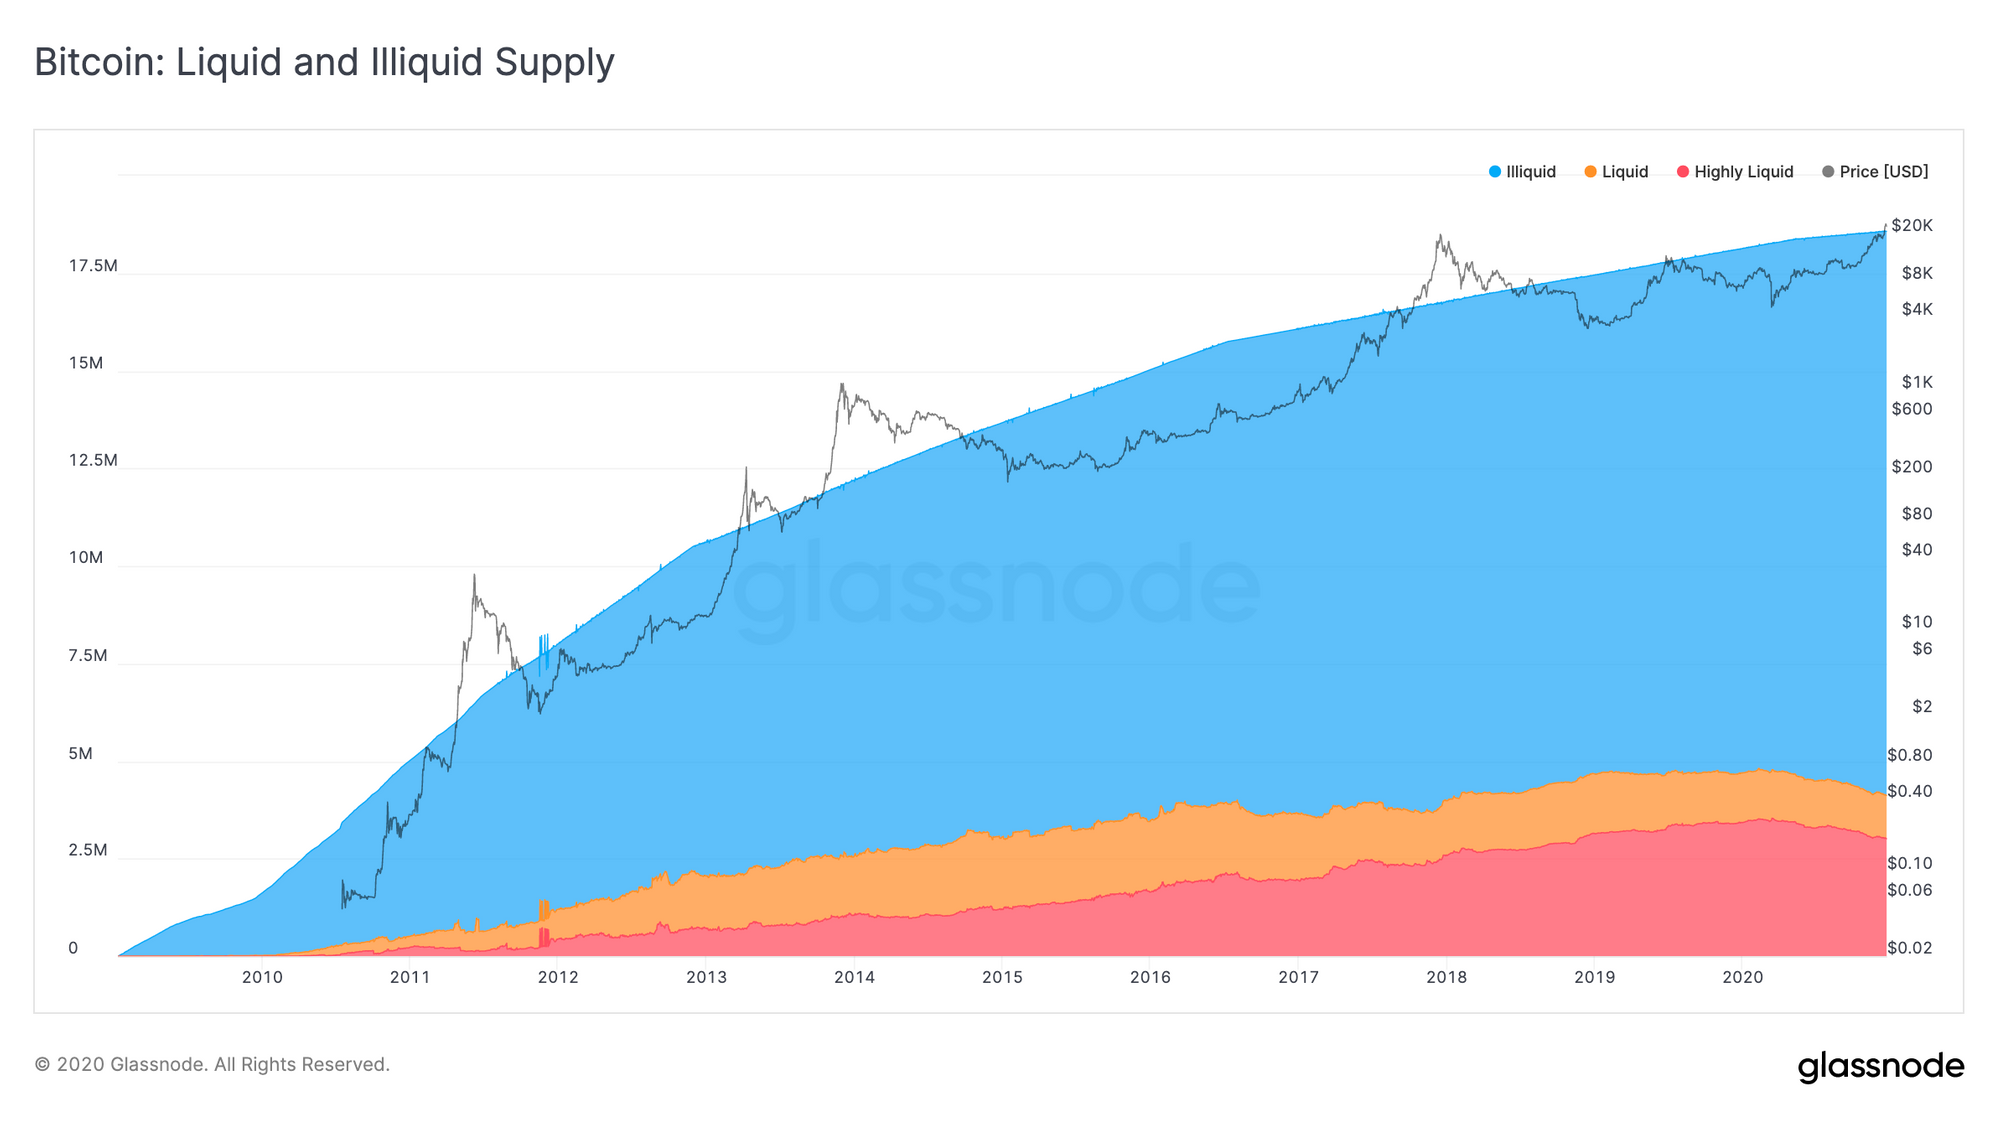
At the time of writing the numbers are:
- Illiquid supply: 14.5 million BTC
- Liquid supply: 1.2 million BTC
- Highly liquid supply: 3 million BTC
That means that around 78% of the circulating Bitcoin supply is considered illiquid.
Only 4.2 million BTC (22%) are currently in constant circulation and available for buying and selling.
It's worth looking at how this trend has evolved in the past. Looking at the change of supply in each categoy from the beginning of the year, we can see a clear upwards trend of Bitcoin illiquidity. This is indicates that the present bull market is driven by the staggering amount of illiquidity.
More than 1 million BTC has become illiquid in the course of 2020.
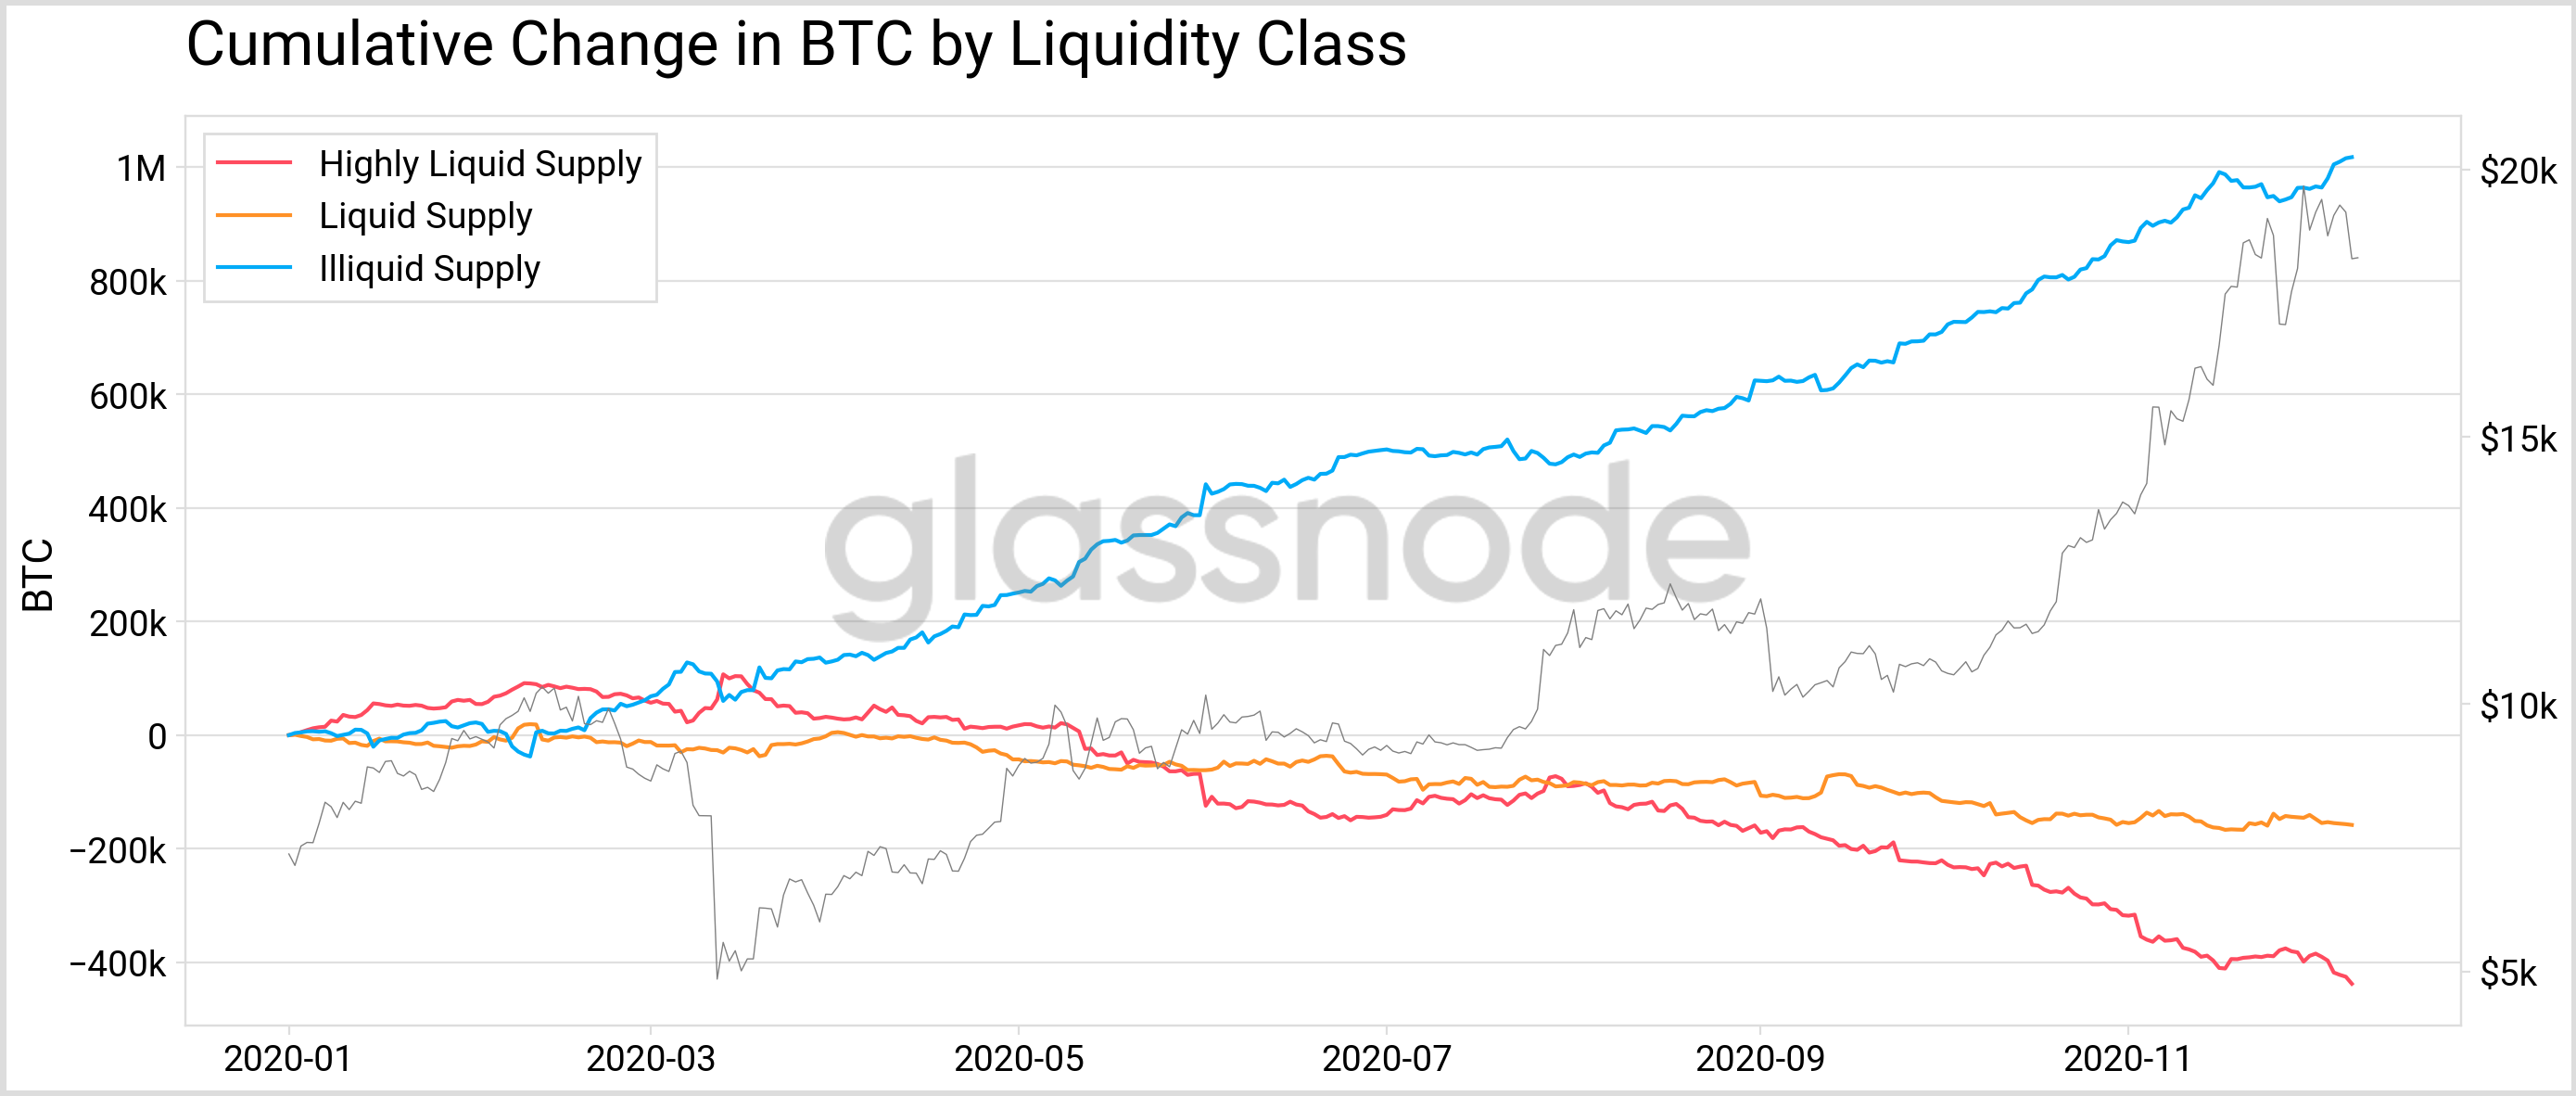
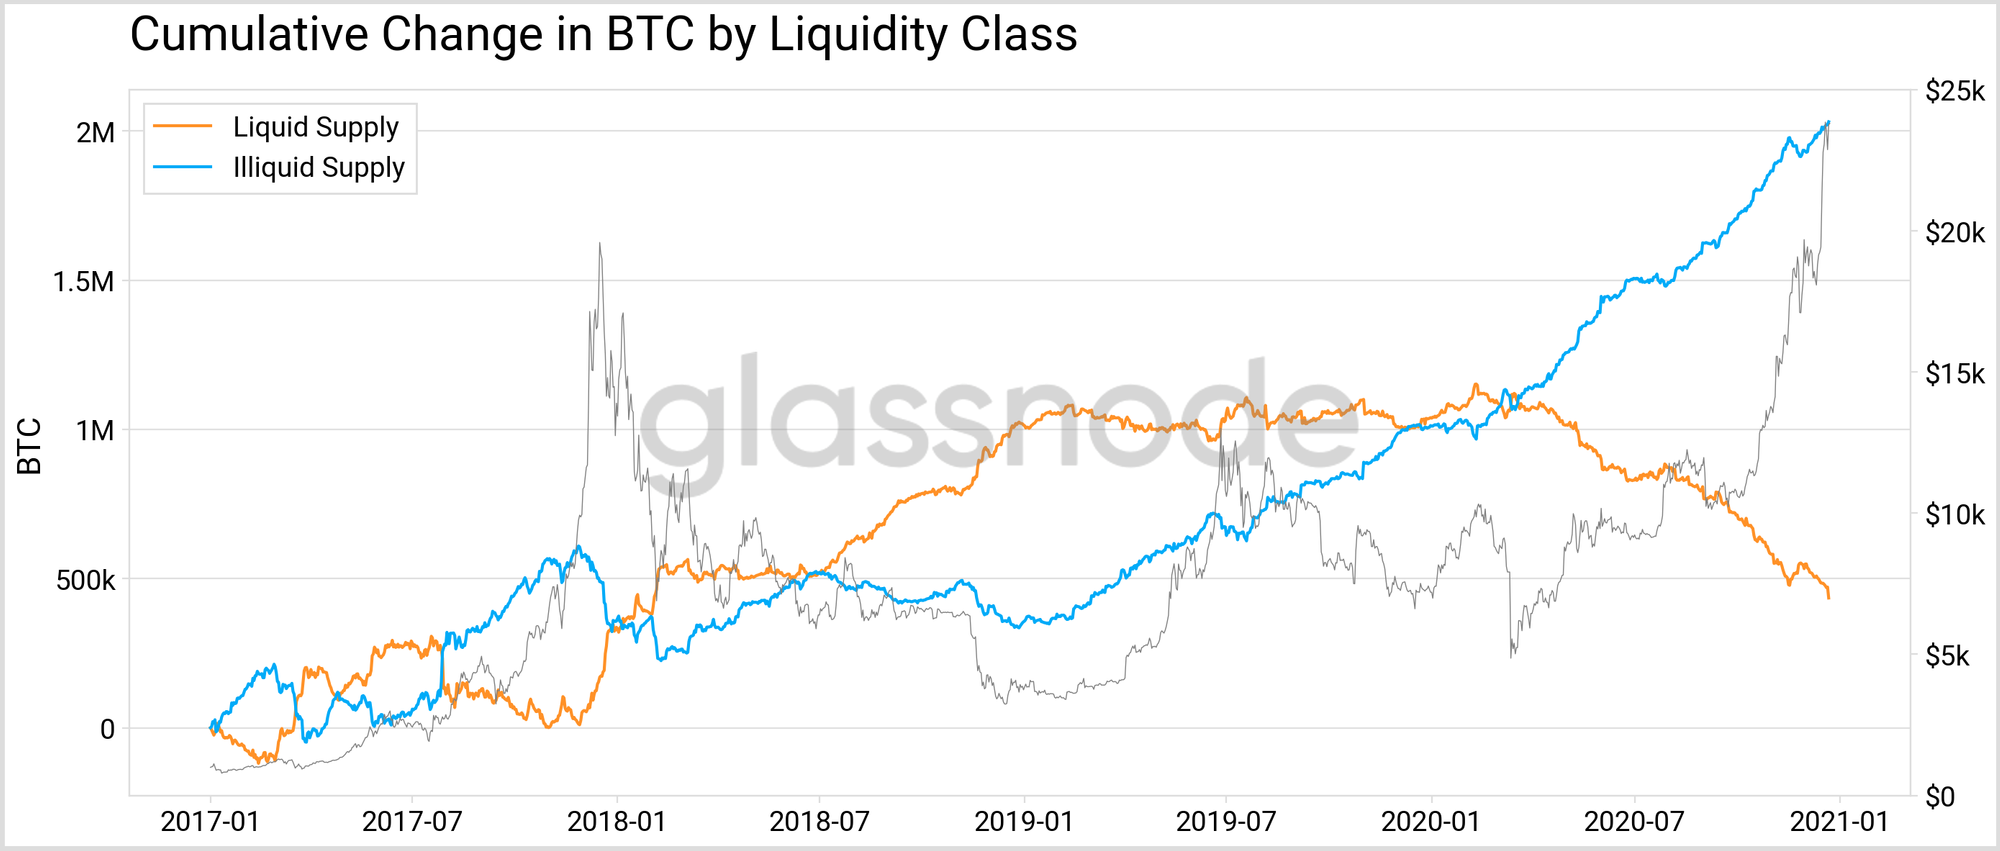
Liquidity as measured through our methodology has a clear relationship with the BTC market. Looking at the cumulative change of liquid vs. illiquid BTC since 2017 (Figure 4), shows that illiquid supply tends to decrease during bear markets, and increase during bull markets (and vice versa for the liquid supply). Note in the graph below the orange liquid supply curve contains both the liquid and highly liquid portions as defined above.
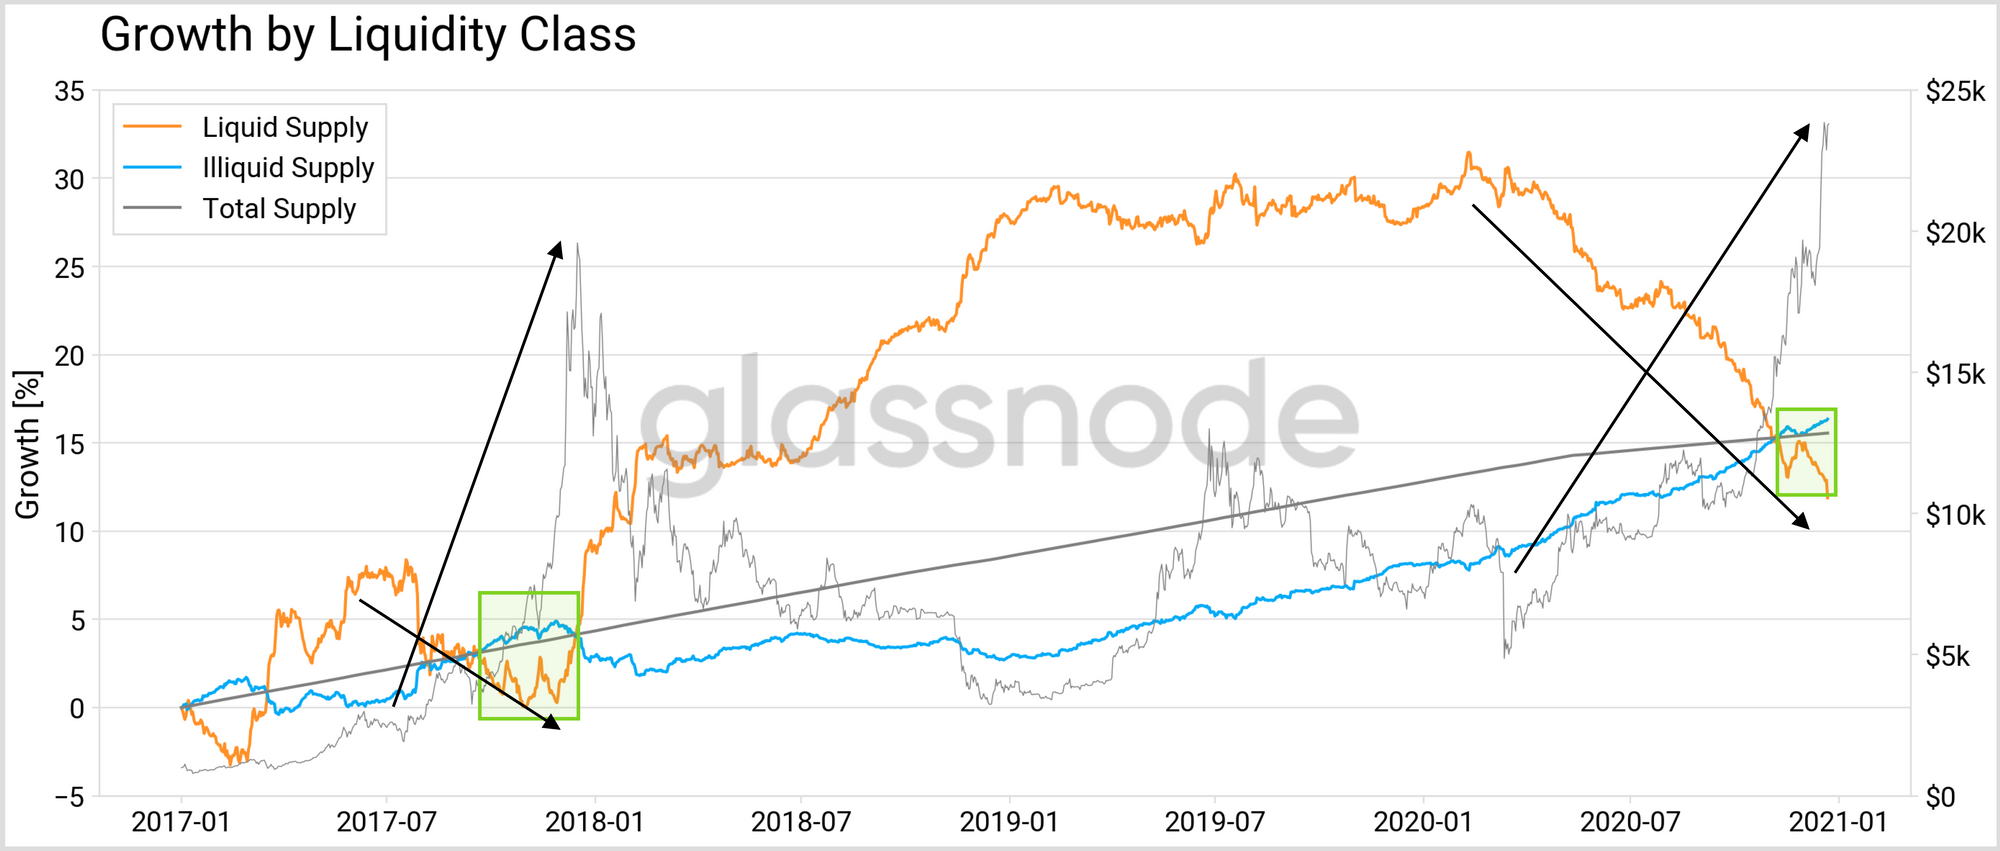
Another way to look at this is through the relative growth (%) of liquid and illiquid supply, and how it relates to the growth of the total circulating supply (Figure 5) . Note how the liquid portion of the supply has been in a constant downwards trends since 9 months, decreasing its growth from 30% to 12% (measured since 2017).
Currently we are at a stage in which the illiquid supply is growing more than the total circulating supply. An pattern we have similarly observed during the bull run of 2017.
Conclusion
We introduce a new methodology in order to quantify the amount of illiquid Bitcoin – and therefore the liquidity available for trading at any given point in time.
Our analysis shows that currently 78% of the circulating Bitcoin supply (14.5 million BTC) can be classified as being illiquid. A trend that has been increasing over the course of 2020 and paints a potential bullish picture for Bitcoin in the upcoming months, as less BTC are available in the network to be bought.
Understanding Bitcoin liquidity is an important macro signal that demonstrably has a clear relationship with the BTC's price.
Liquidity metrics here are live in Glassnode Studio as of today.

- Follow us and reach out on Twitter
- Join our Telegram channel
- For on–chain metrics and activity graphs, visit Glassnode Studio
- For automated alerts on core on–chain metrics and activity on exchanges, visit our Glassnode Alerts Twitter