Breaking up On–Chain Metrics for Short and Long Term Investors
We introduce variations of the SOPR and MVRV on-chain metrics that serve as indicators to assess the behaviour of short and long term investors.

Introducing SOPR and MVRV for Long and Short Term Holders
Bitcoin’s UTXO–based system allows for analyses of on–chain data based on the “age” of bitcoins in the network, i.e. the categorization of bitcoins depending on the last time they moved.
This allows for instance to assess information on investors’ hodling behaviour, and to gauge whether coins that have been dormant for a long time are currently being moved.
Popular example of on–chain metrics incorporating coin age are, amongst others, HODL waves, Spent Output Age Bands, MSOL/ASOL, Coin Days Destroyed, and Bitcoin Dormancy.
Identifying Industry Stakeholders: Short and Long Term Holders
In the present work, we make use of coin age information with the goal of classifying market players into meaningful actor groups. This allows us to obtain a refined understanding of on–chain activity that can be associated to investors that are characterized by different hodling behaviours.
In particular, our approach is to break up on–chain activity according to two major industry stakeholders: Short Term Holders (STH) and Long Term Holders (LTH). We categorise these two investor types using information on coin age.
Take a look at Figure 1: It shows the cumulative amount of dormant UTXOs as a function of their creation date.
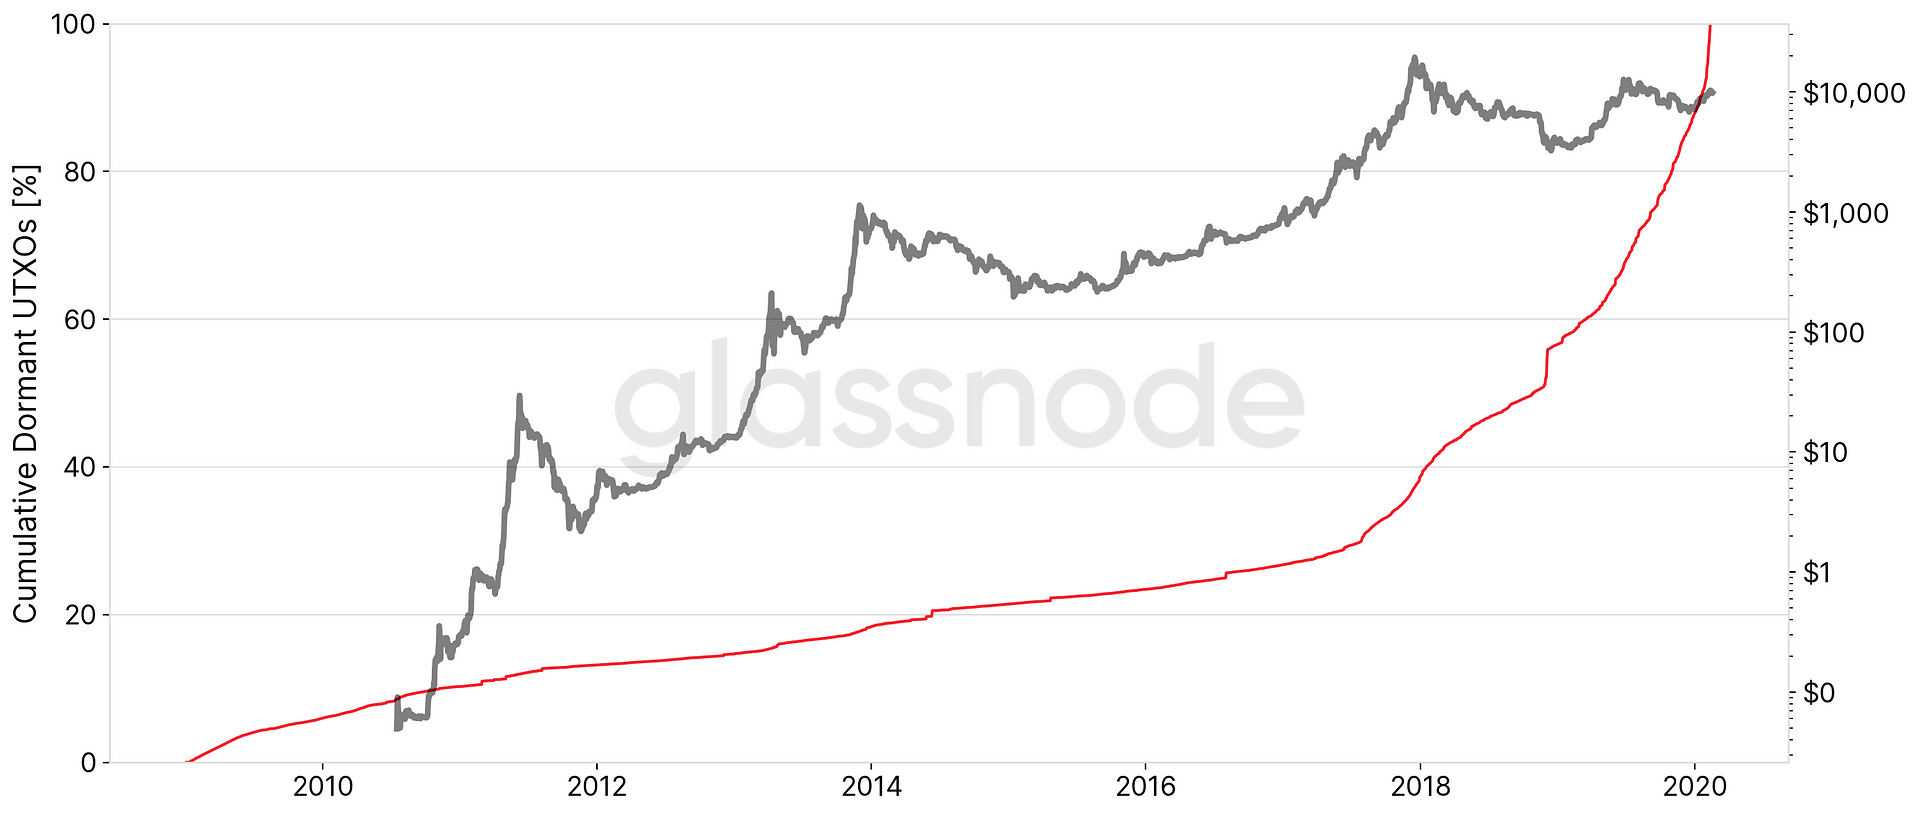
The graph can be read as: How many bitcoins have not moved since a certain date?
For instance, around 37% (~7 million) of the existing Bitcoin supply hasn’t moved since the last ATH in December 2017. Similarly, more than half of circulating bitcoins (55%) have not moved since the market bottom in late 2018 more than a year ago.
Clearly, these numbers illustrate that there is a substantial amount of investors committed to hodl over long periods of time, i.e. Long Term Holders (LTH).
Conversely, given that the current on-chain transaction volume is in the range of around 1 million BTC per day, we can infer that, to a large extent it is the same set of coins that are being transferred in the network over and over again. Otherwise the complete circulating Bitcoin supply would be spent at least once in a matter of a few weeks. The above chart shows that this is clearly not the case and points to the fact that there are market players that act in short timeframes, i.e. Short Term Holders (STH).
What is the Probability of Spending a UTXO?
By looking at historical UTXO movements, we can calculate the probability of a UTXO being spent as a function of its age/lifespan.
To put it differently: Given that a bitcoin has a certain age (time since it last moved), what is the probability that it will move within the next X days?
Figure 2 shows the probability of a UTXO to be spent within the next 14 days.
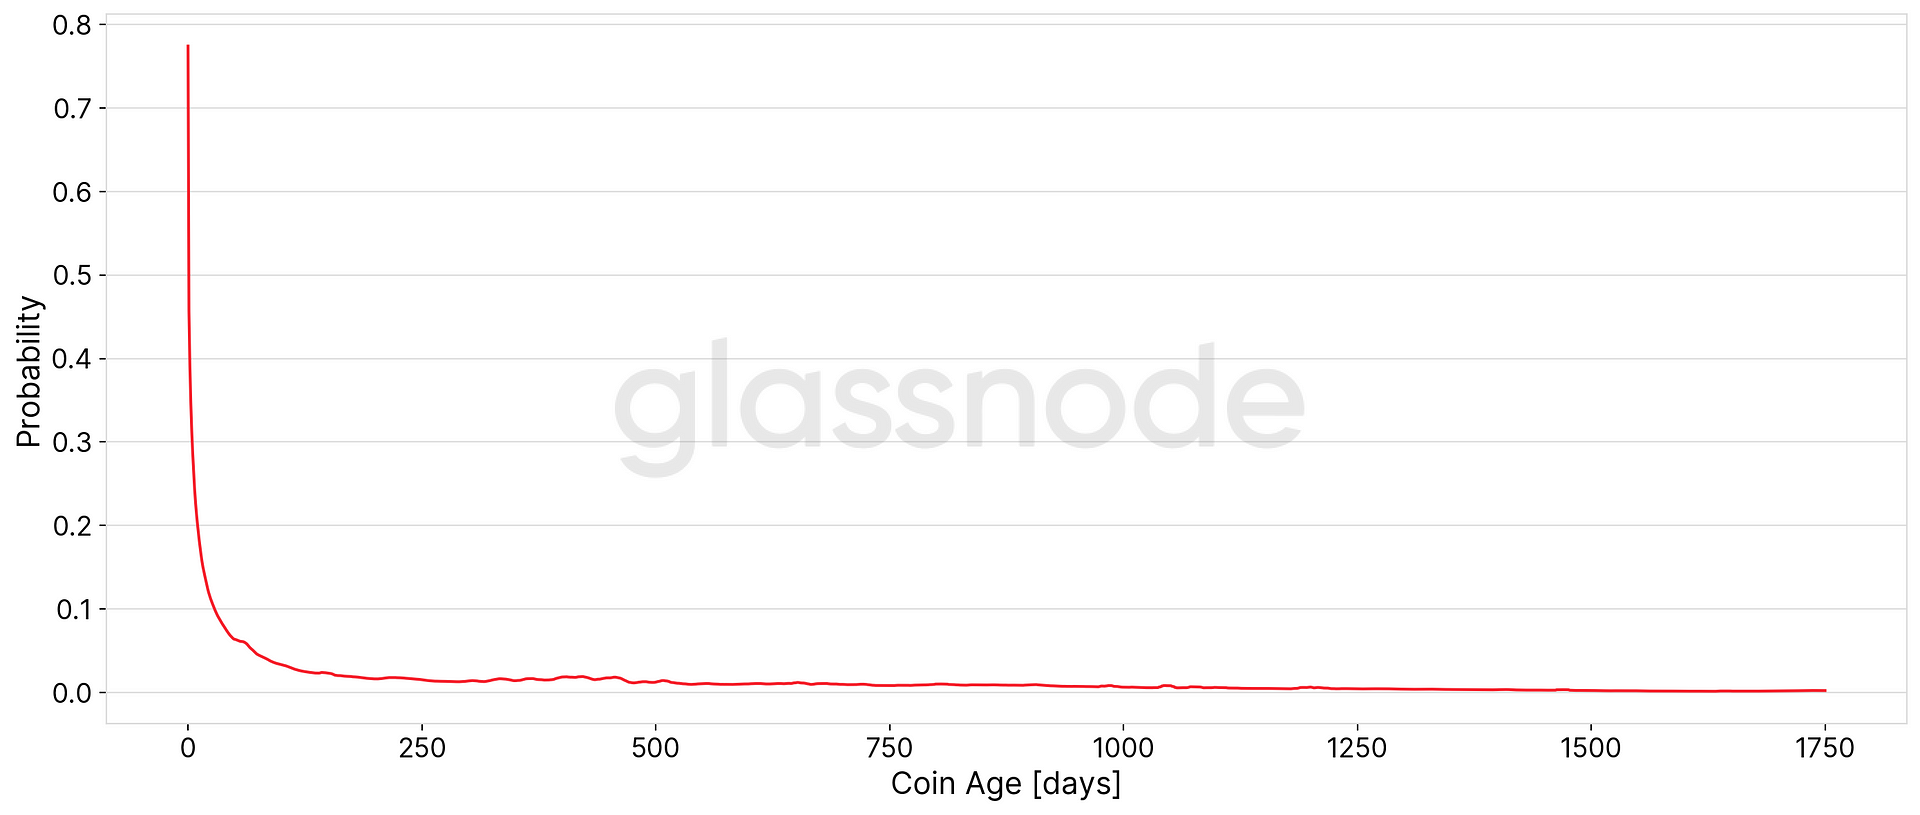
The graph shows a fast exponential decline, indicating that in the early days of their existence (remember that when a UTXO is spent, it is destroyed and a new one is created), coins tend to move a lot, i.e. the probability that a newly created UTXO is spent, is very high.
However, this number declines with increasing coin age, rapidly converging to very low probabilities. Somewhere in the range of around 100–200 days, the curve seems to stabilise and its slope becomes more or less constant.
Thus, our assumption is that if a UTXO exceeds a certain lifespan threshold in the ballpark of 100–200 days, those coins are in the hands of market players that are less prone to speculate and trade based on short timeframes — Long Term Holders. Conversely, UTXOs that are spent earlier, are owned by Short Term Holders.
Defining Long and Short Term Holders based on Coin Age
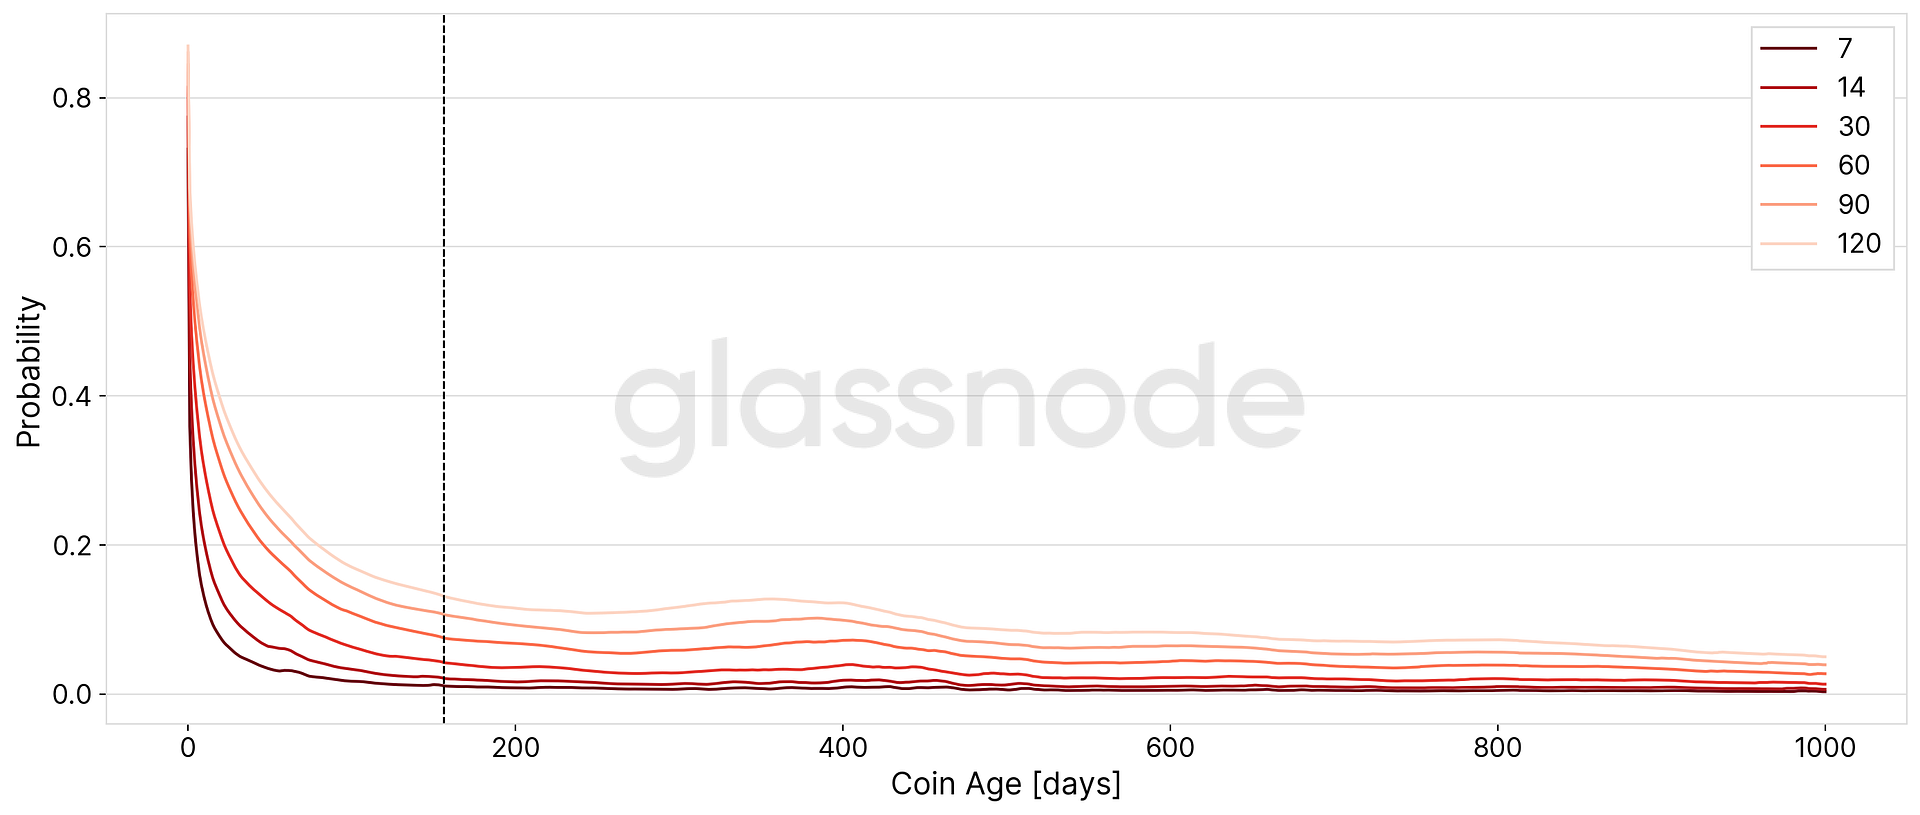
In order to define the exact threshold that separates short term and long term investors based on coin age, we analyse the slope of the probability curves of a UTXO being spent within 7, 14, 30, 60, 90, and 120 days.
Our approach is to a) first identify the maximum slope of all data points older than a year and b) then determine the last point within the first year in which this maximum slope is exceeded. The resulting coin age is the threshold we use to distinguish long and short terms holders.
Figure 3 shows the results of this analysis.
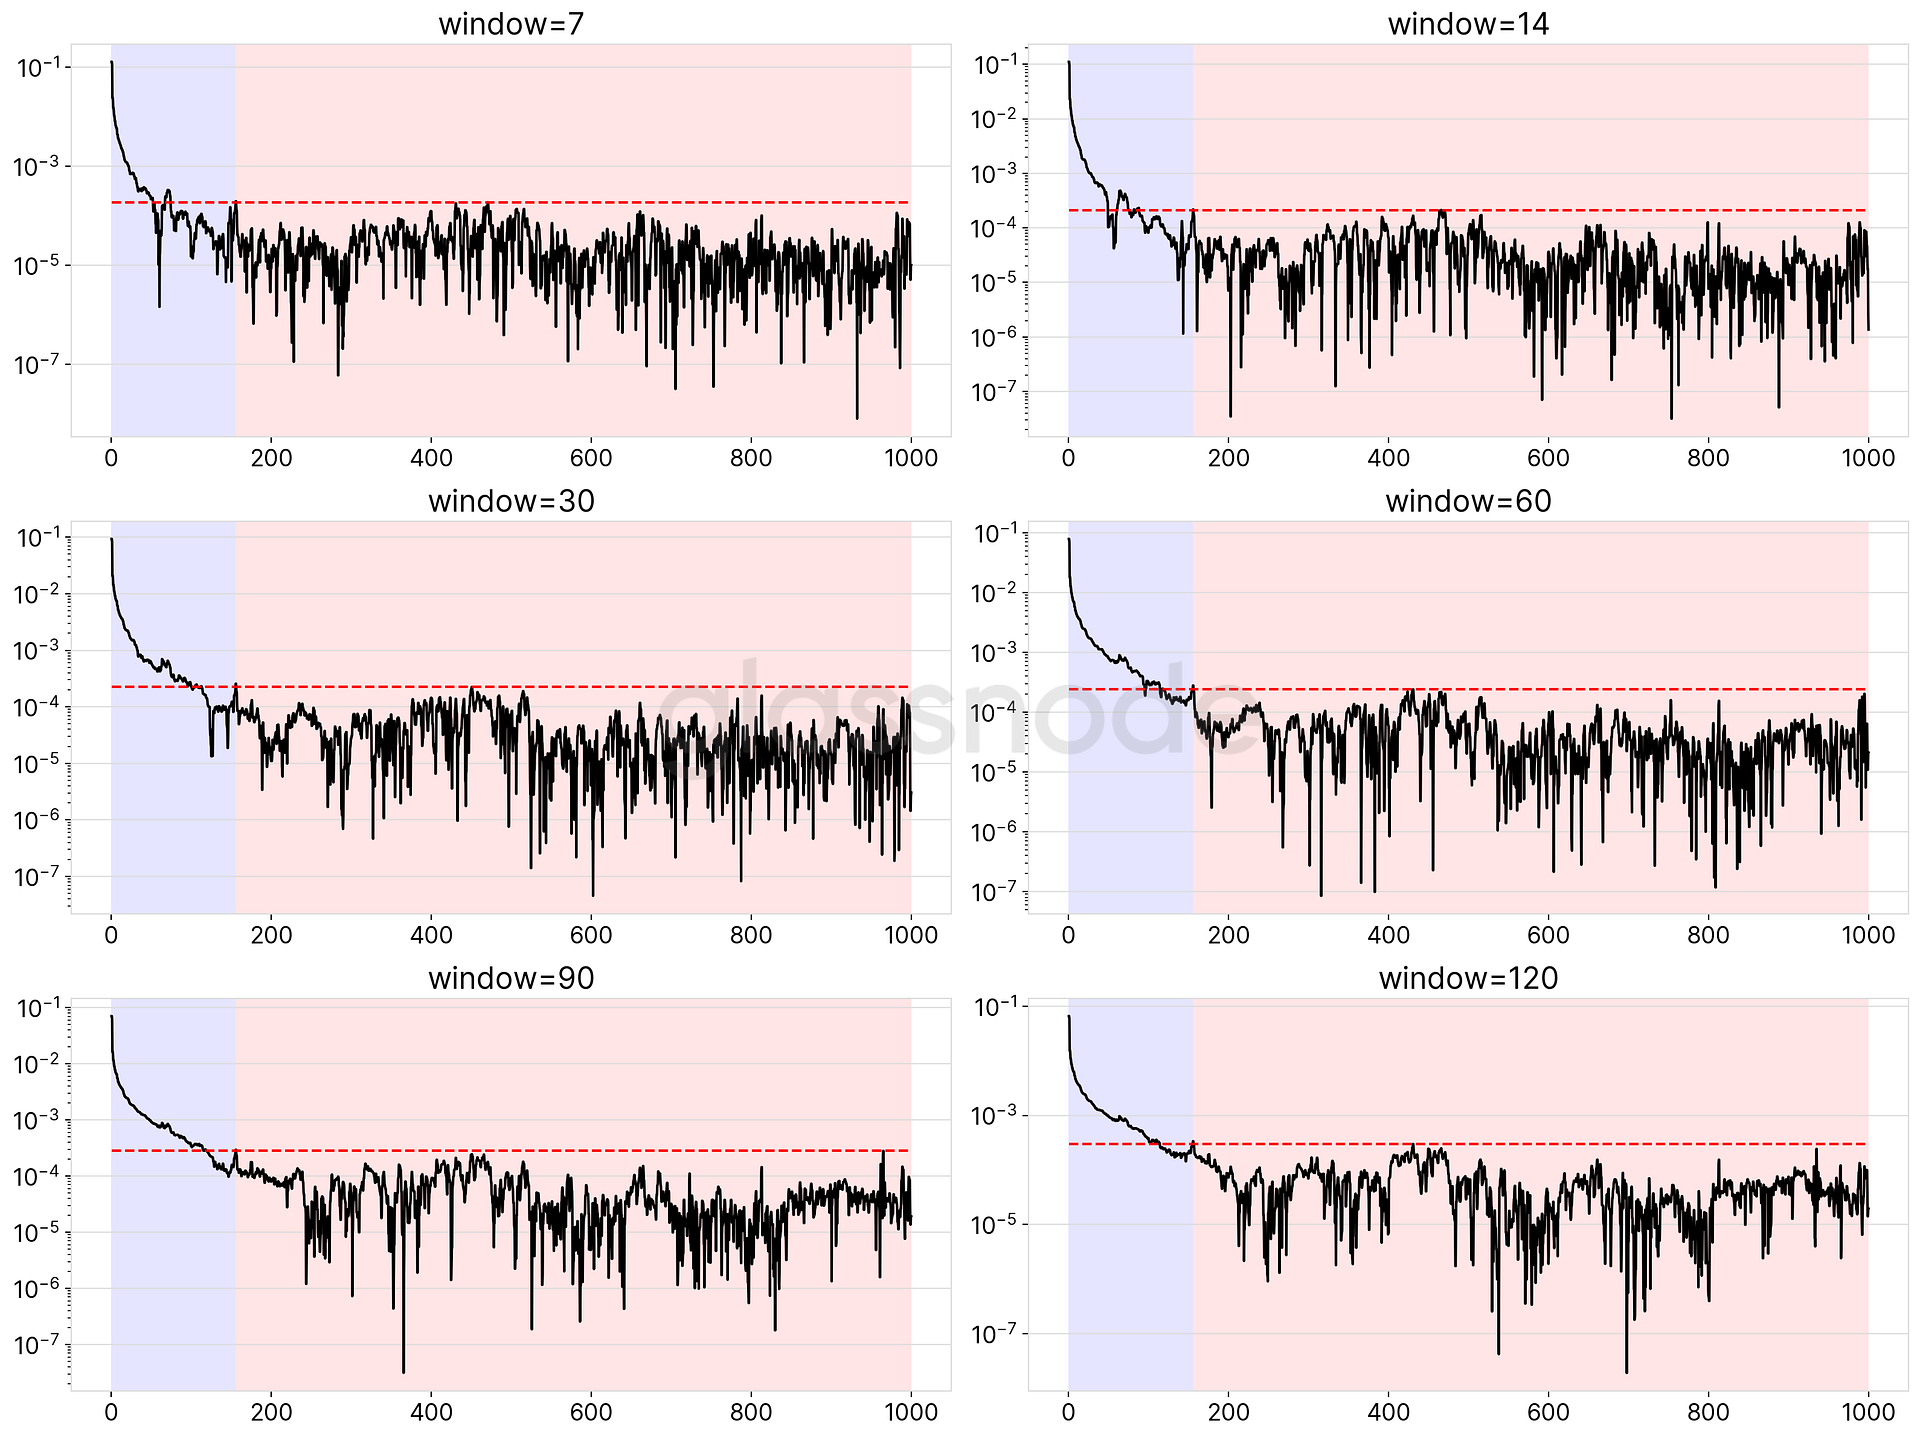
The outcome is unambiguous: In each case, the maximum coin age within the first year that exceeds the maximum slope of all points older than a year is at exactly 155 days.
Therefore, we define 155 days as the minimum age at which we consider that a UTXO is controlled by a Long Term Holder (LTH).
Conversely, Short Term Holders (STH) are defined by all UTXOs with a lifespan of less than 155 days.
Figure 4 shows the probabilities for each time window, and the identified threshold at 155 days.
Adjusting SOPR and MVRV for Long Term and Short Term Holders
With the newly identified coin age threshold we create new versions of Spent Output Profit Ratio (SOPR) and the MVRV Ratio that represent long term holder and short term holder perspectives, respectively.
In particular:
- Long Term Holder SOPR and MVRV (LTH-SOPR & LTH-MVRV)
SOPR/MVRV that takes into account only UTXOs with a lifespan of at least 155 days and serves as an indicator to assess the behaviour of long term investors. - Short Term Holder SOPR (STH-SOPR & STH-MVRV)
SOPR/MVRV that takes into account only UTXOs younger than 155 days and serves as an indicator to assess the behaviour of short term investors.
Long Term Holders
LTH-SOPR
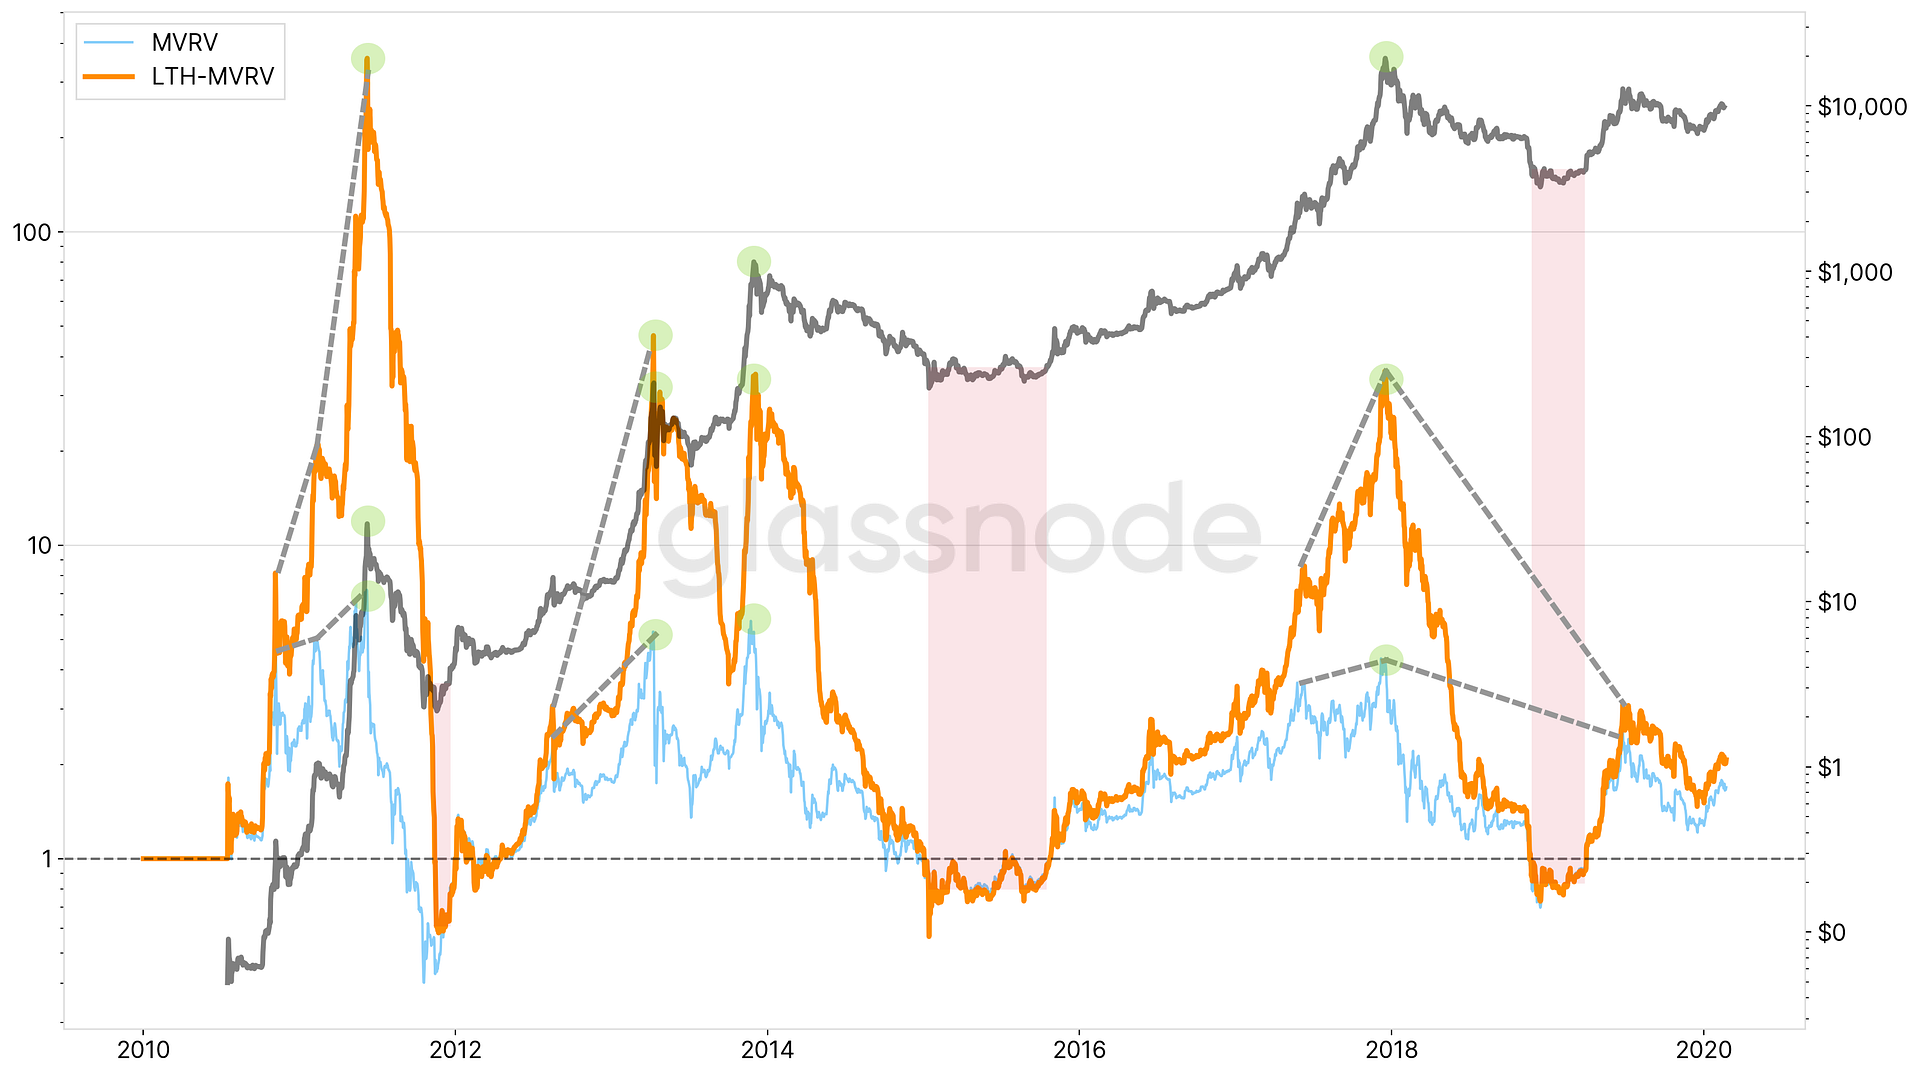
SOPR for LTH represents a signal that can be used to navigate macro cycles (see Figure 5).
As compared to SOPR and aSOPR, LTH-SOPR moves in much lower frequencies and shows significantly larger deviations from the 1-line. While aSOPR barely exceed values larger than 1.3, LTH-SOPR can extend into double (and even triple) digit numbers, showing a consistent low-frequency signal that moves with macro cycles of the market like a pendulum.
LTH-SOPR shows very clear periods in which long term investors capitulate (red zones), nicely coinciding with major market bottoms. Similarly, when LTH-SOPR exceeds values of 10 and above, those periods have been shown to be tops of market cycles.

LTH-MVRV
Similarly, LTH-MVRV serves as an additional macro cycle indicator that helps identify tops/bottoms.
Figure 8 depicts LTH-MVRV and compares to the original MVRV.
While both metrics serve to indicate market tops, note that MVRV has much more attenuated amplitudes, while LTH-MVRV reveals a signal that is much more distinct and significant in representing Bitcoin’s market cycles.
Especially when comparing the differences between global and local tops, it becomes evident that LTH-MVRV is capable of making that distinction much more evident (denoted by the slopes of the grey dotted lines in the chart in Figure 6) and therefore providing investors with a more confident signal.
Short Term Holders
STH-SOPR
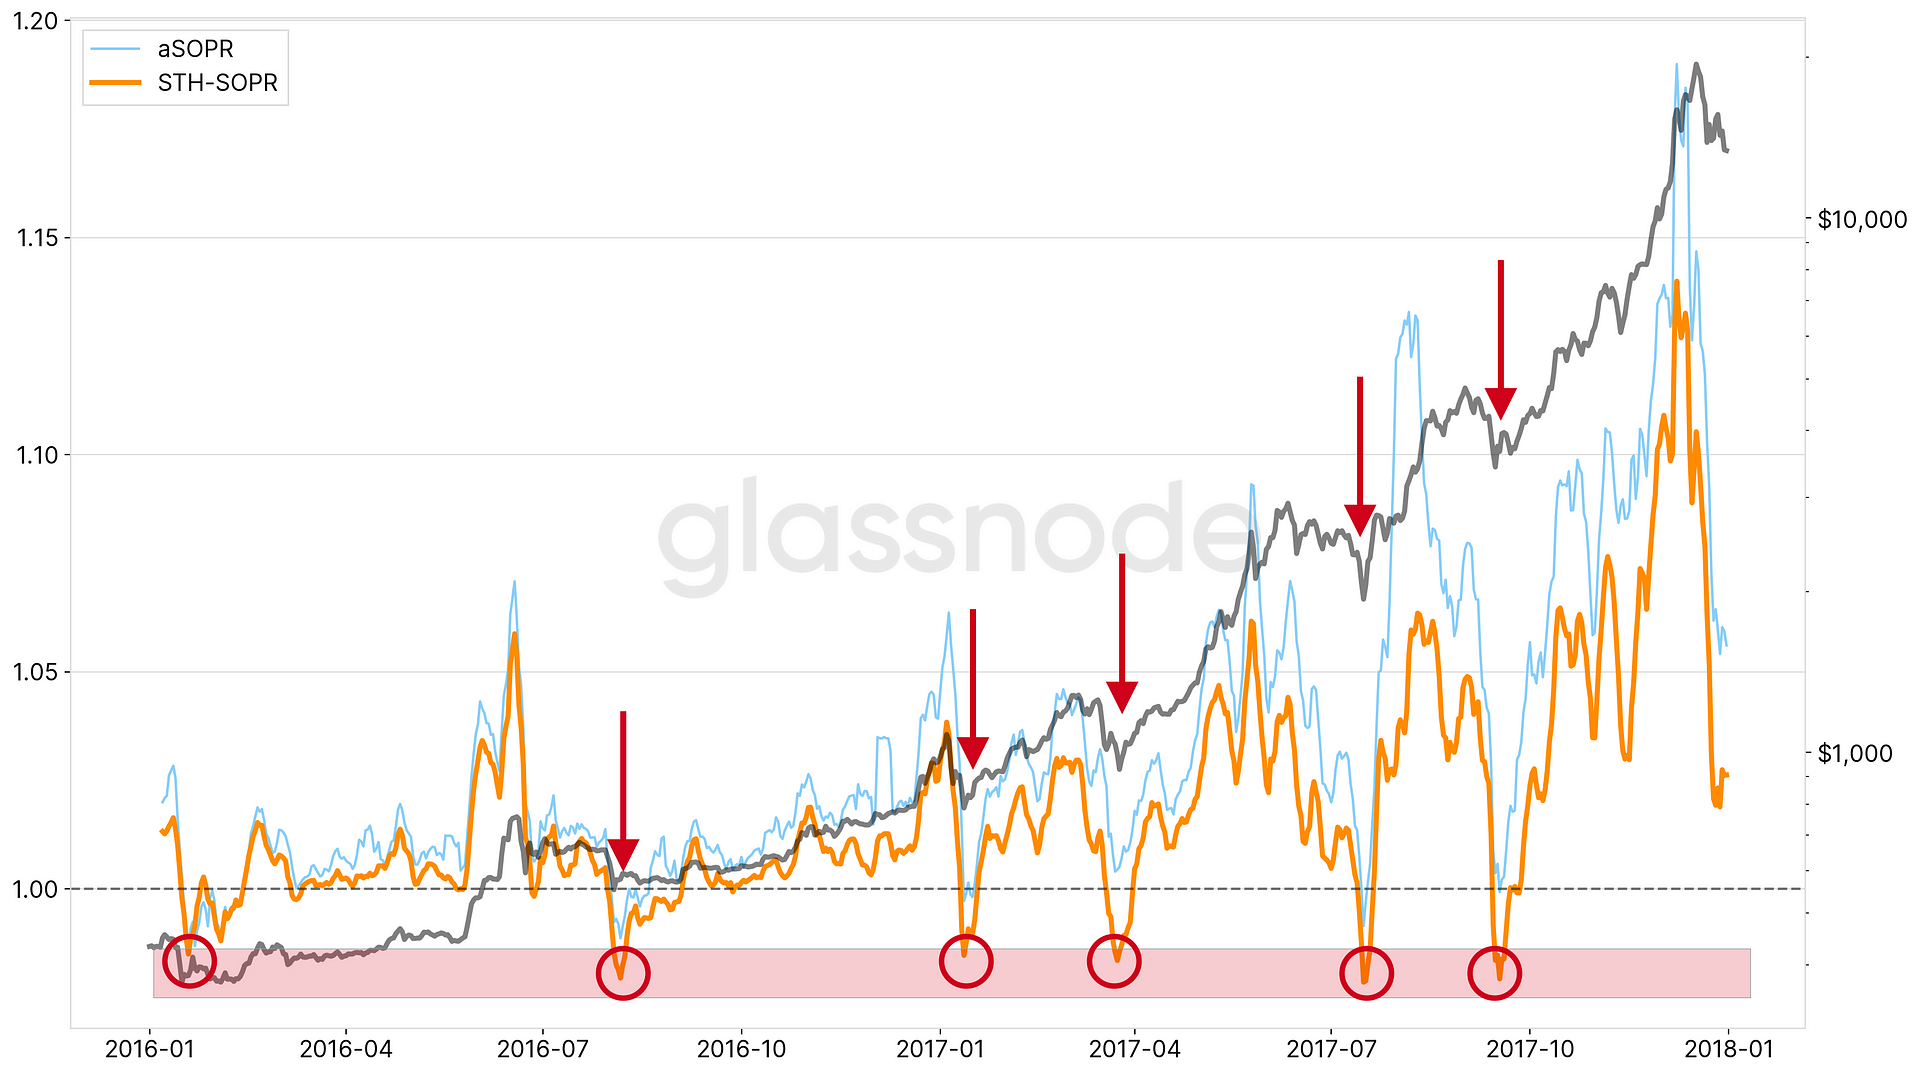
While Short Term Holder SOPR is very similar to aSOPR (in fact STH-SOPR also is also adjusted by discarding all spent outputs with a lifespan of less than one hour), it is less susceptible to sudden spikes/outliers both positive and negative. Generally it provides a more stationary signal over time, closely oscillating around 1.
Figure 7 shows an exemplary comparison of aSOPR and STH-SOPR during the bull run in 2016/2017. As can be seen in the chart, within this time period STH-SOPR shows consistent dips close below 1, clearly marking local bottoms indicating good entry points into the market.
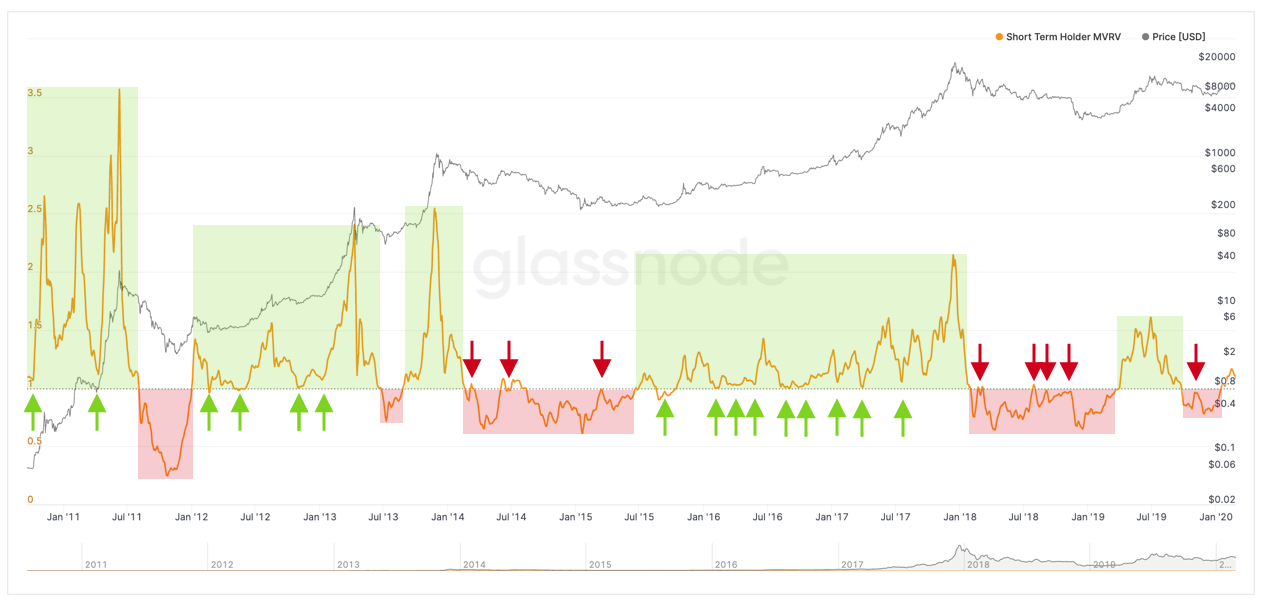
STH-MVRV
Short Term MVRV nicely removes long-term trends from the original MVRV signal, making it a metric robustly representing movements on shorter time frames. In particular, STH-MVRV represents a more accurate take on a short-term overvaluation and undervaluation of Bitcoin.
Figure 8 shows STH-MVRV over the course of Bitcoin’s history. Because longer term valuation biases are removed, the signal oscillates closely around 1 and can be used as a technical on–chain indicator that clearly showing when the signal breaks above and below one.
Historically, the STH-MVRV 1-line has worked as a resistance/support line — breaking through it has shown to be a good indication for market reversals, i.e. start and end of bull and bear markets. Specifically, because long–term trends are removed, STH-MVRV confirms bull and bear markets prior to the traditional MVRV ratio.
Many thanks to Renato Shirakashi and Tom Fiodorov.
All metrics presented in this work are live on Glassnode Studio as of today:
- Long Term Holder SOPR (LTH-SOPR)
- Short Term Holder SOPR (STH-SOPR)
- Long Term Holder MVRV (LTH-MVRV)
- Short Term Holder MVRV (STH-MVRV)

- Follow us and reach out on Twitter
- For on–chain metrics and activity graphs, visit Glassnode Studio
- For automated alerts on core on–chain metrics and activity on exchanges, visit our Glassnode Alerts Twitter
Disclaimer: This report does not provide any investment advice. All data is provided for information purposes only. No investment decision shall be based on the information provided here and you are solely responsible for your own investment decisions.