The Week On-chain (Week 28, 2021)
The Bitcoin market squeezes into a tight trading range and we assess a range of market indicators for sentiment and volatility triggers.


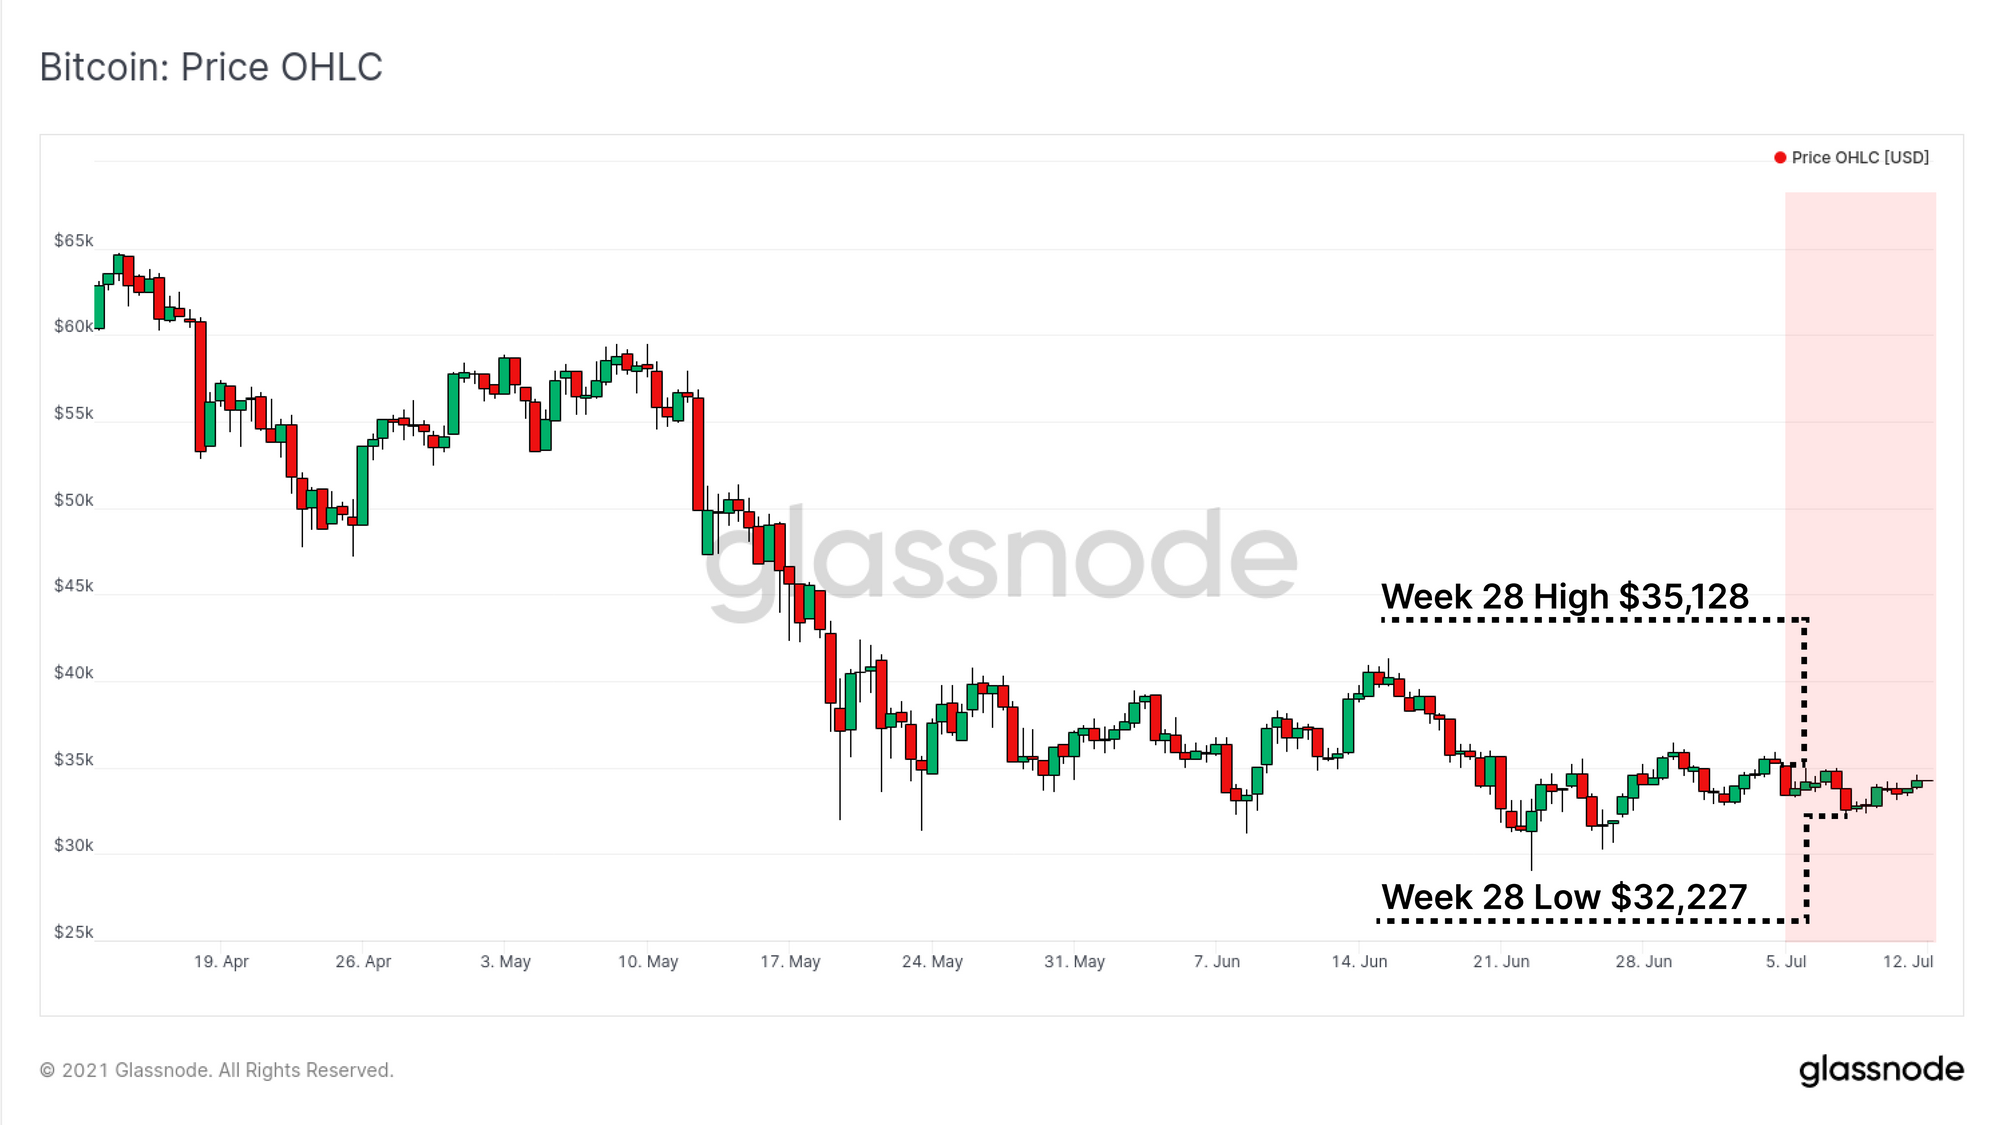
It has been an impressively quiet week in the Bitcoin market as volatility continues to seep out, and prices squeeze into a tight consolidation range. The week opened at a high of $35,128, and traded down to a low of $32,227. It is starting to feel like the calm before the storm as muted and quiet activity appears across both spot, derivative, and on-chain metrics.
This week we will explore a broad range of metrics and indicators across the entire Bitcoin market to establish overall sentiment, volatility triggers, and models for investor behaviour.
Early Signs of Miner Recovery
A key theme of the previous two editions of this newsletter have focused on the changing conditions across the Bitcoin mining market (see Weeks 26 and 27). A key takeaway in establishing a bullish or bearish bias is the speed at which hash-rate recovers.
- Rapid hash-rate recovery may suggest offline miners have successfully relocated or re-established their hardware, recovering costs and likely reducing the risk of treasury liquidation sell-pressure.
- Slow hash-rate recovery may suggest the converse, where costs and outage continues to take a financial toll, and thus increases the risk of treasury sales.
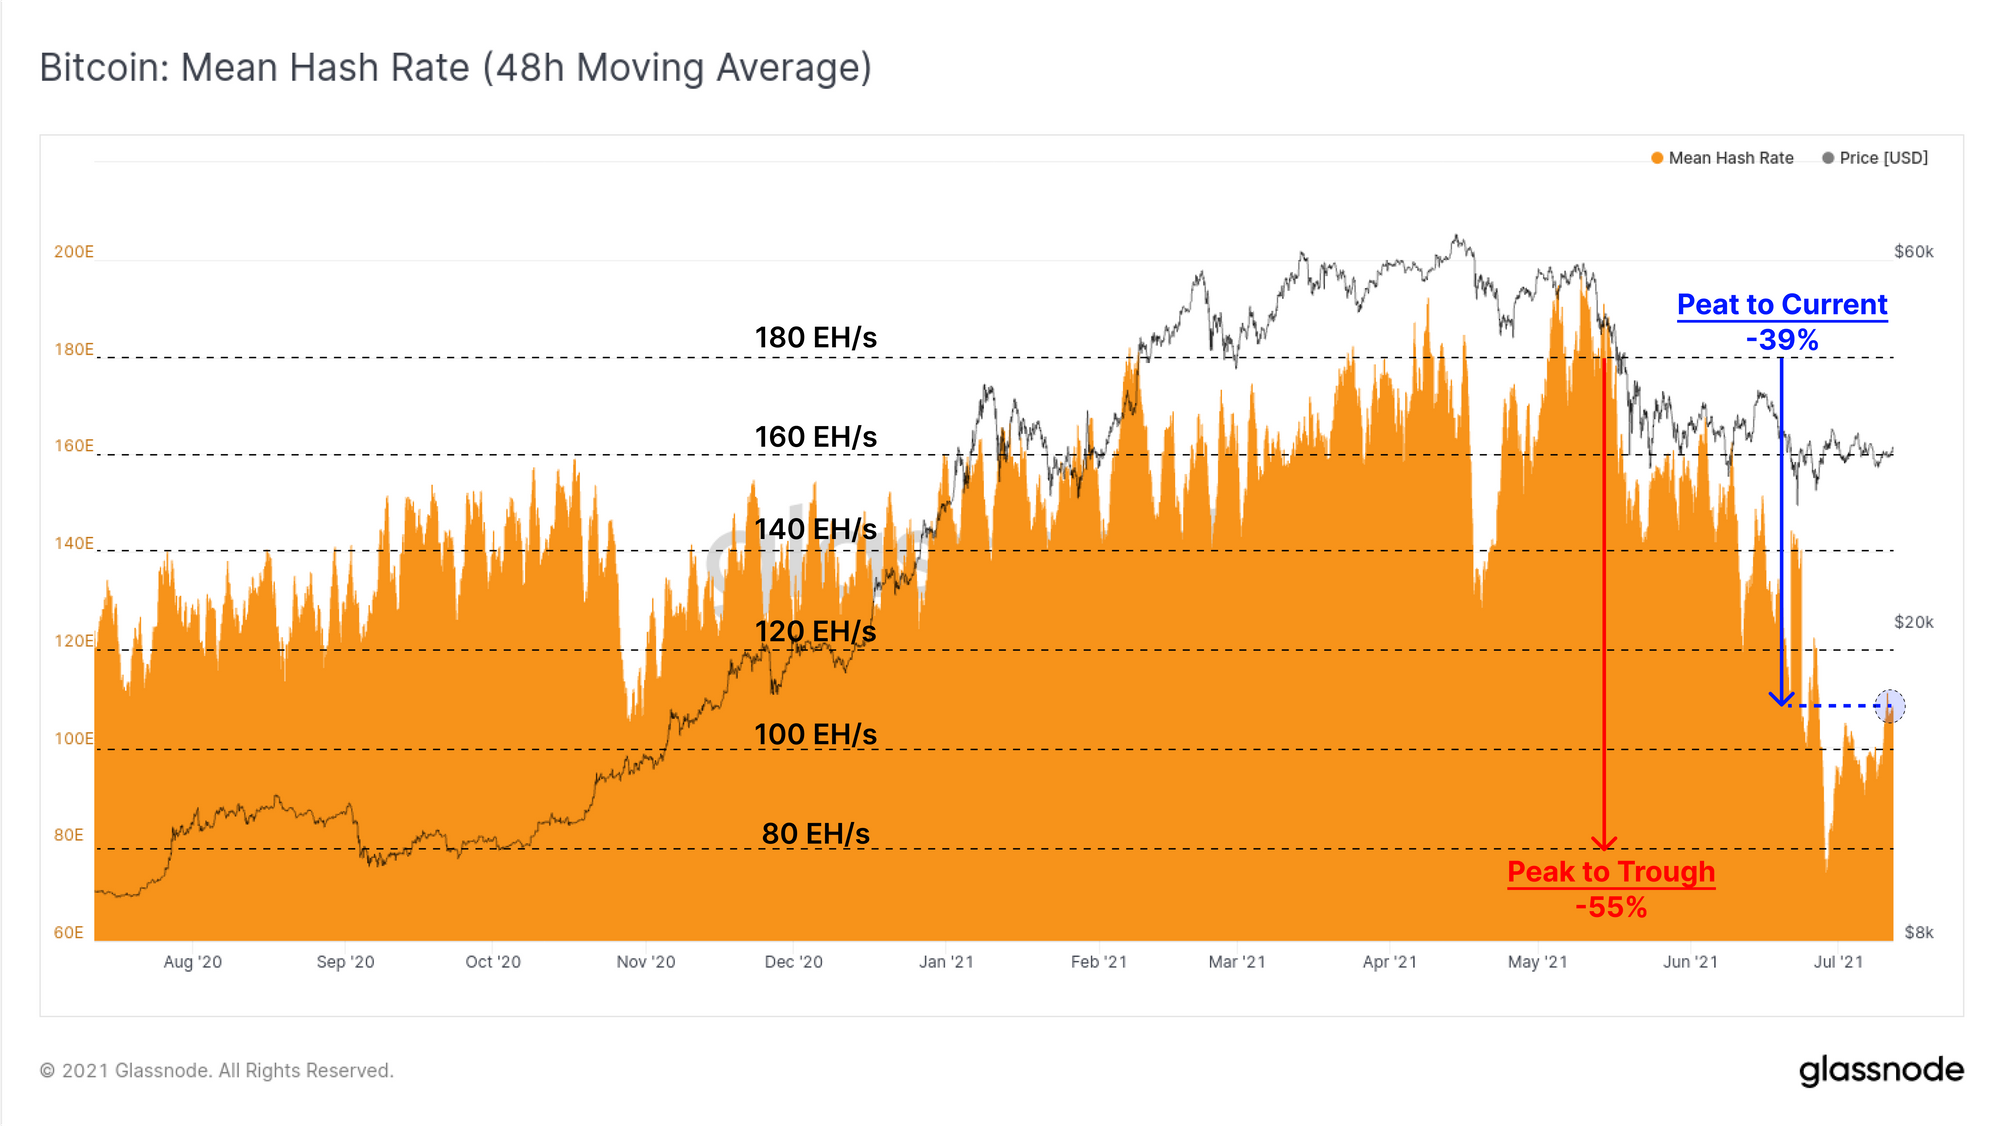
This week, the hash-rate has recovered from the peak-trough decline of 55%, to around a 39% decline. Should this level hold and be representative, it would indicate that hash-power equivalent to around ~29% of the affected hash-power has come back online. This could be due to:
- Miners in China that have successfully relocated hardware,
- Previously obsolete hardware has been dusted off and found a new lease on life.
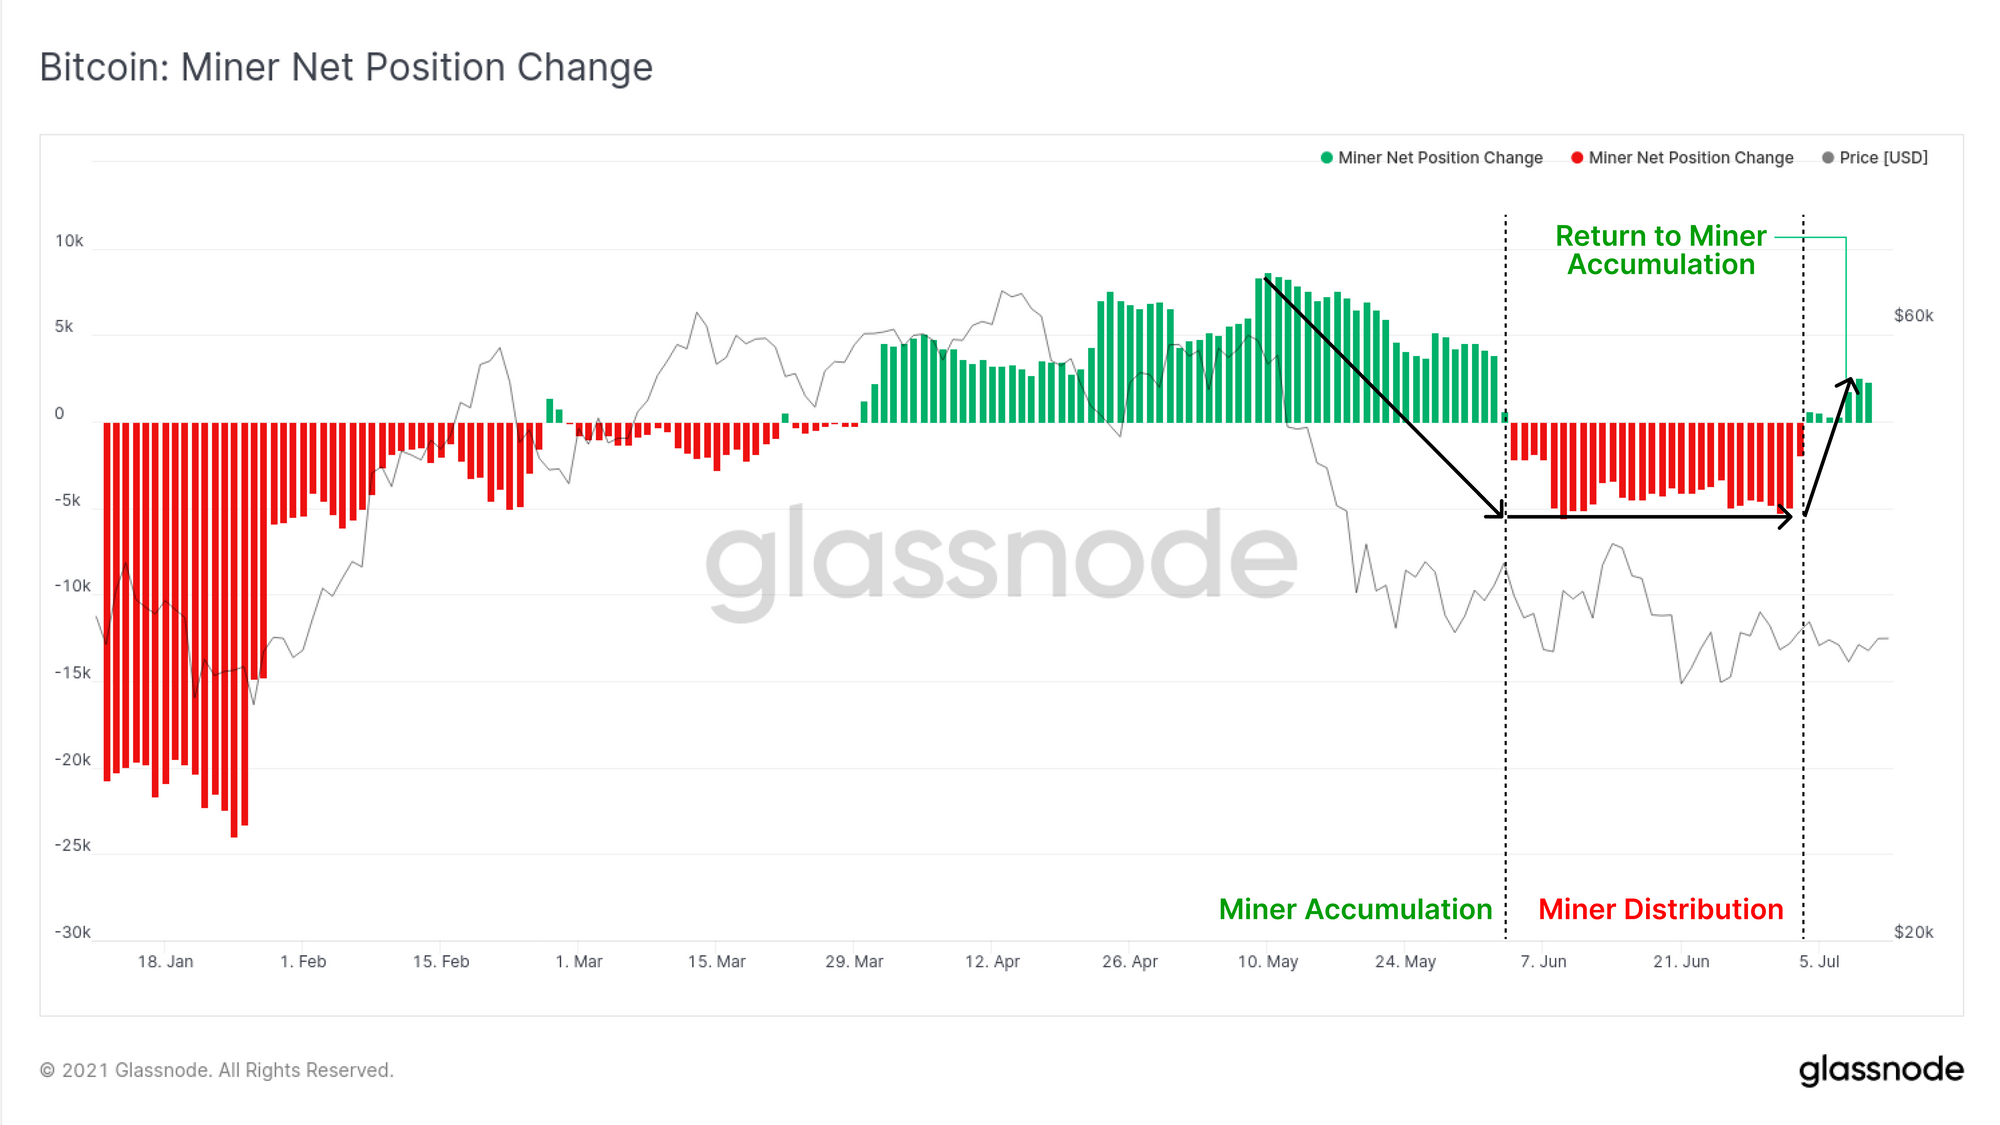
We previously noted that miners who remained operational at this time would experience a dramatic boost in profitability, minimising the compulsory sell-pressure. To support this thesis, the Miner Net Position Change metric has returned to accumulation. This indicates that what sell-side pressure is coming from offline miners, is more than offset by accumulation by the operational miners.
A major downside change to this metric would suggest financial stress is affecting the mining market and likely foreshadow an increase in liquid supply.
Depletion of Exchange Reserves
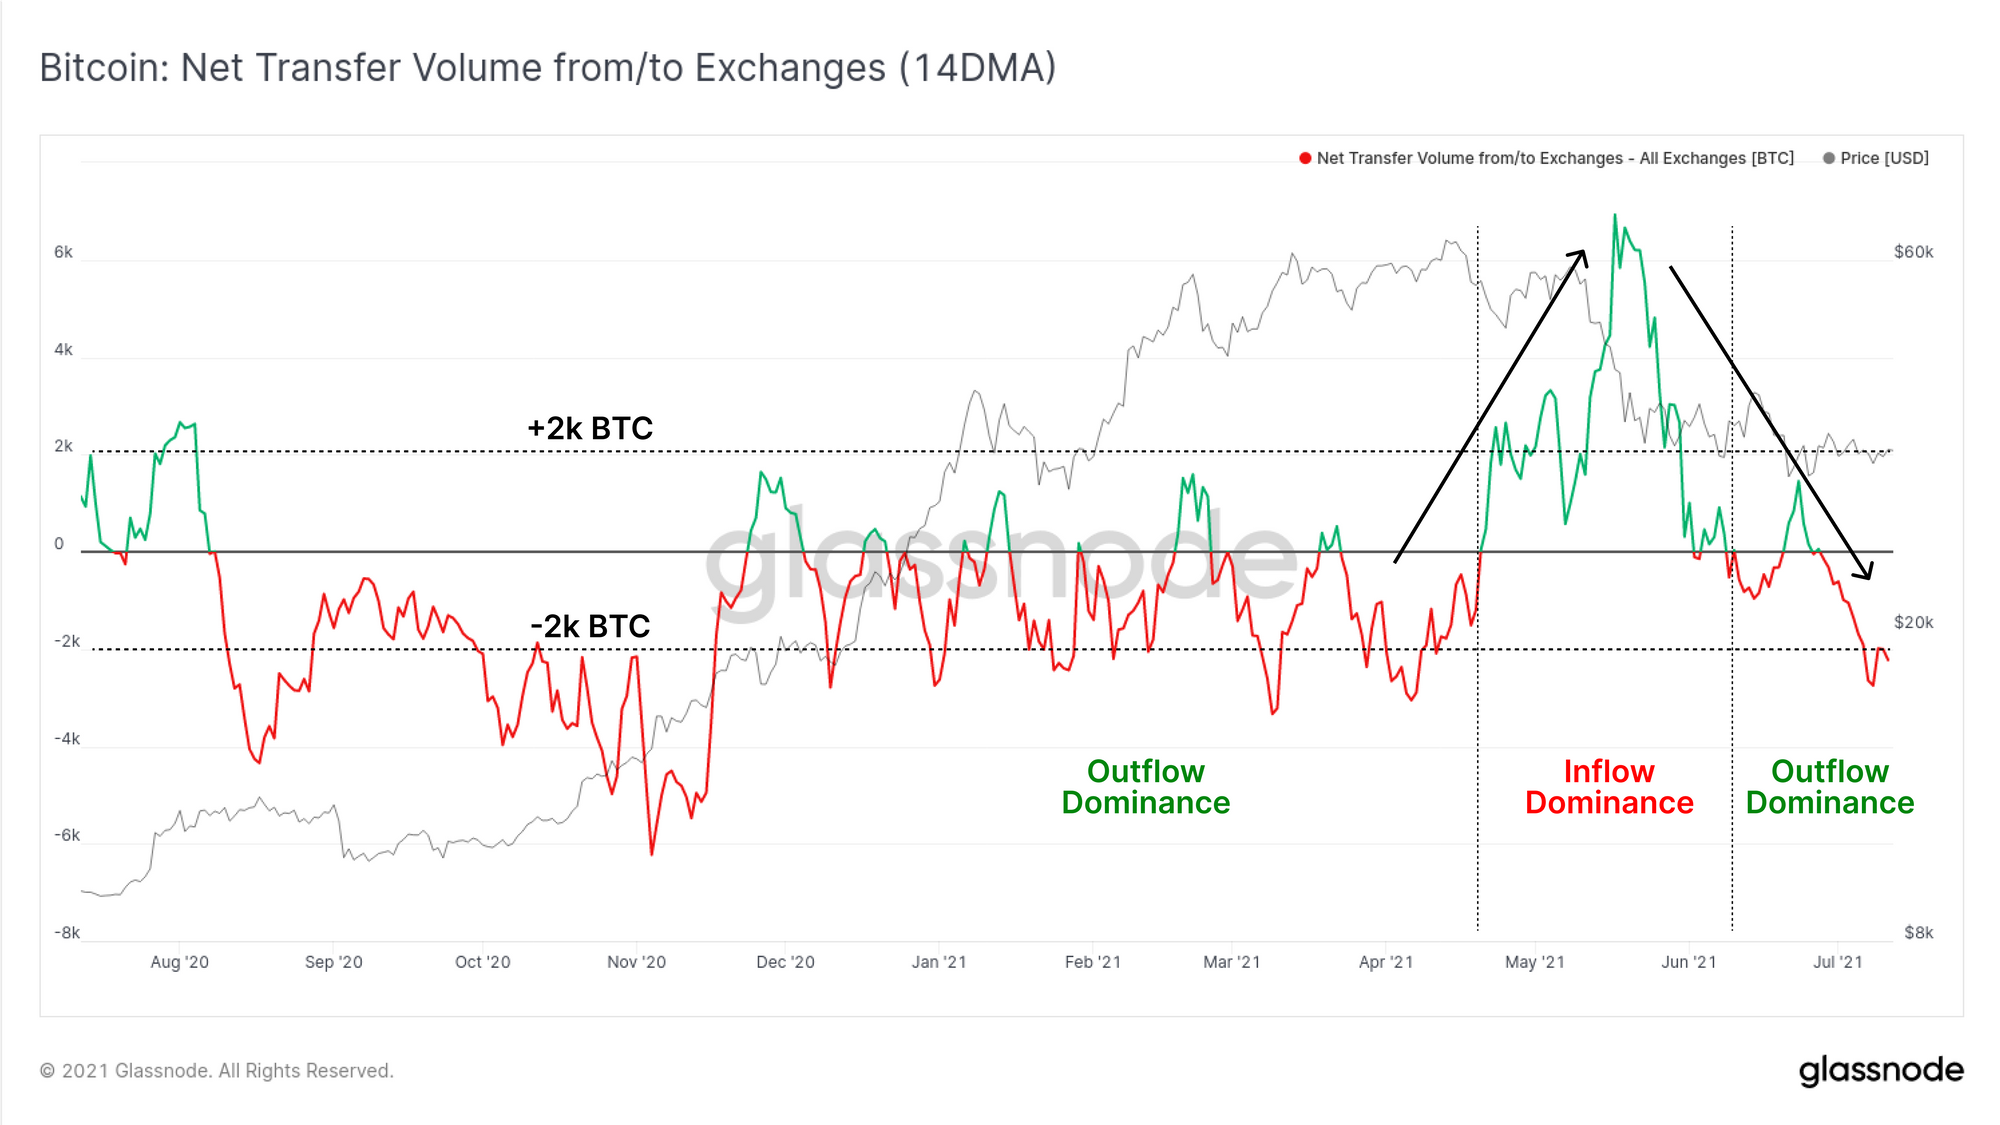
A key theme throughout 2020 and Q1 2021 was relentless depletion of exchange coin reserves, with many of them en route to the Grayscale GBTC Trust, or accumulated by institutions. This showed up as a persistent net outflow from exchanges.
Throughout May, this trend dramatically reversed as a flood of BTC was deposited to exchanges, alongside the market selling off by ~50%. On a 14-day moving average basis, the last two weeks in particular have seen a more positive return to exchange outflows, at a rate of ~2k BTC per day.
As volatility squeezes out of the market, it is common for mempools to clear and demand for block-space to decline. As such, the transactions that are executed tend to represent a less speculative and more 'purposeful' sample compared to a frothy bull market.
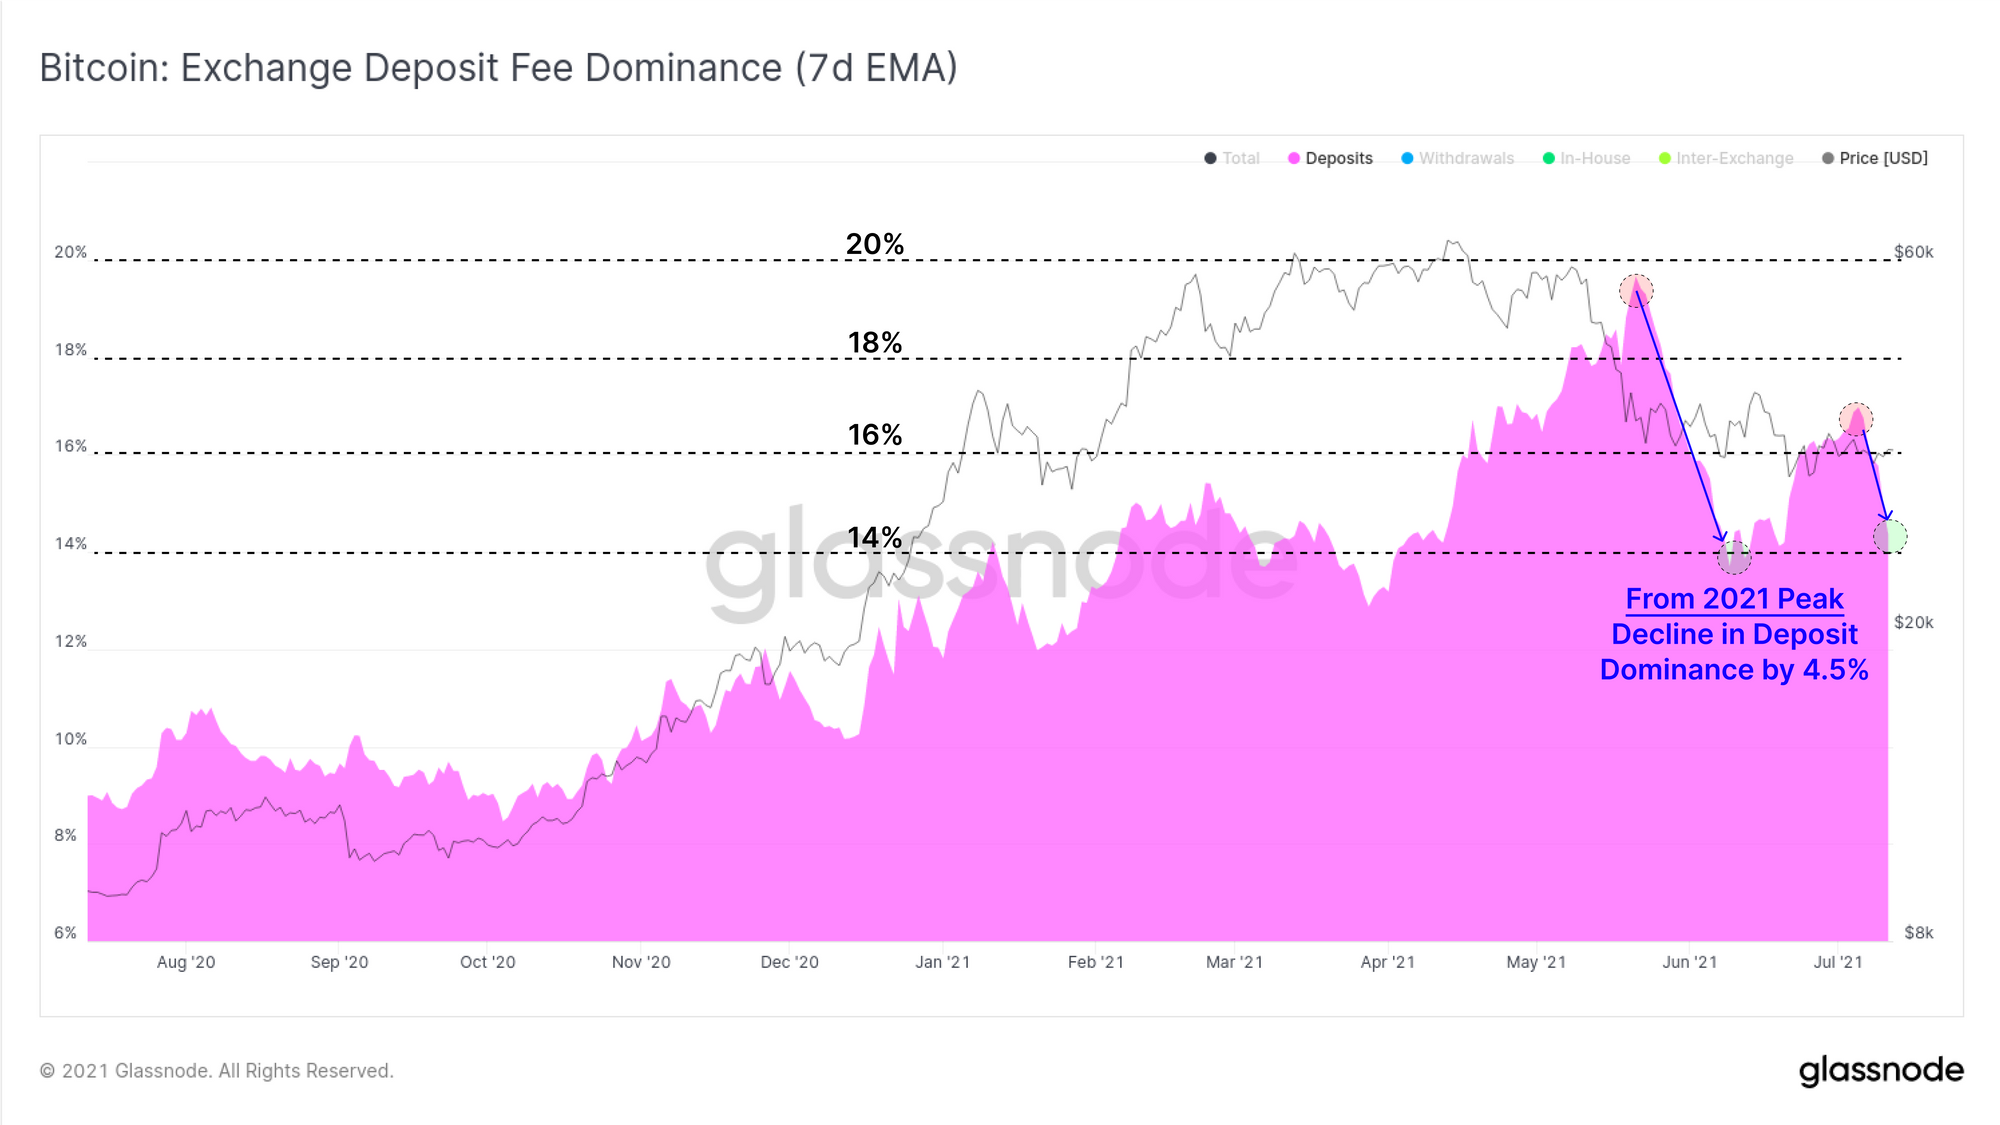
This week, the proportion of on-chain transaction fees associated with exchange deposits declined to 14% dominance after a brief peak to around 17%. Continuation of this as a structural trend may reinforce a thesis sell-side pressure is subsiding.
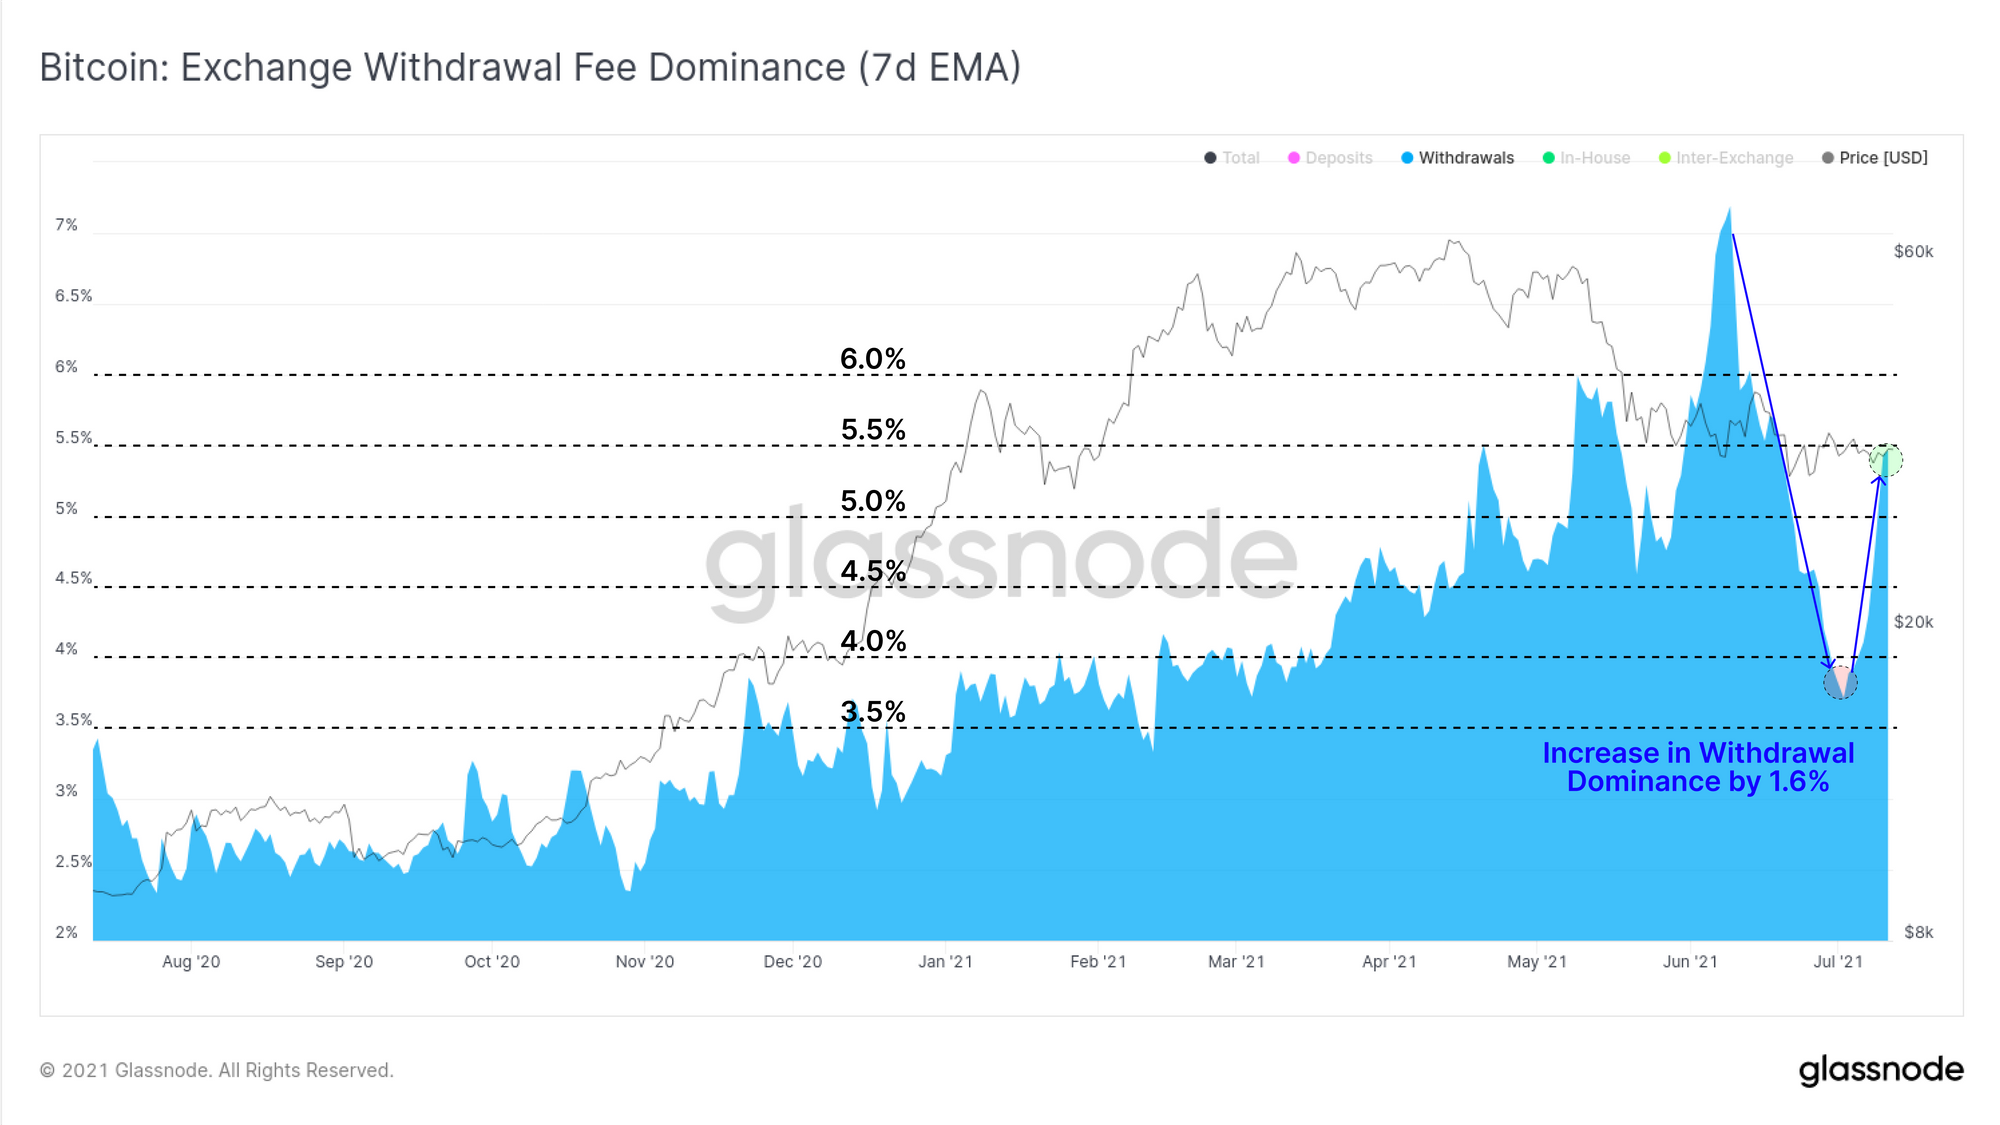
Conversely, the proportion of on-chain fees associated with withdrawals saw a notable bounce from 3.7% up to 5.4%, a 43% boost in relative dominance. This too suggests a rising preference for accumulation over sales.
Note that deposit fee dominance will generally be larger than withdrawals in magnitude, generally as a result of exchanges deploying batching techniques for efficiency, including many customer withdrawals under a single transaction and fee.
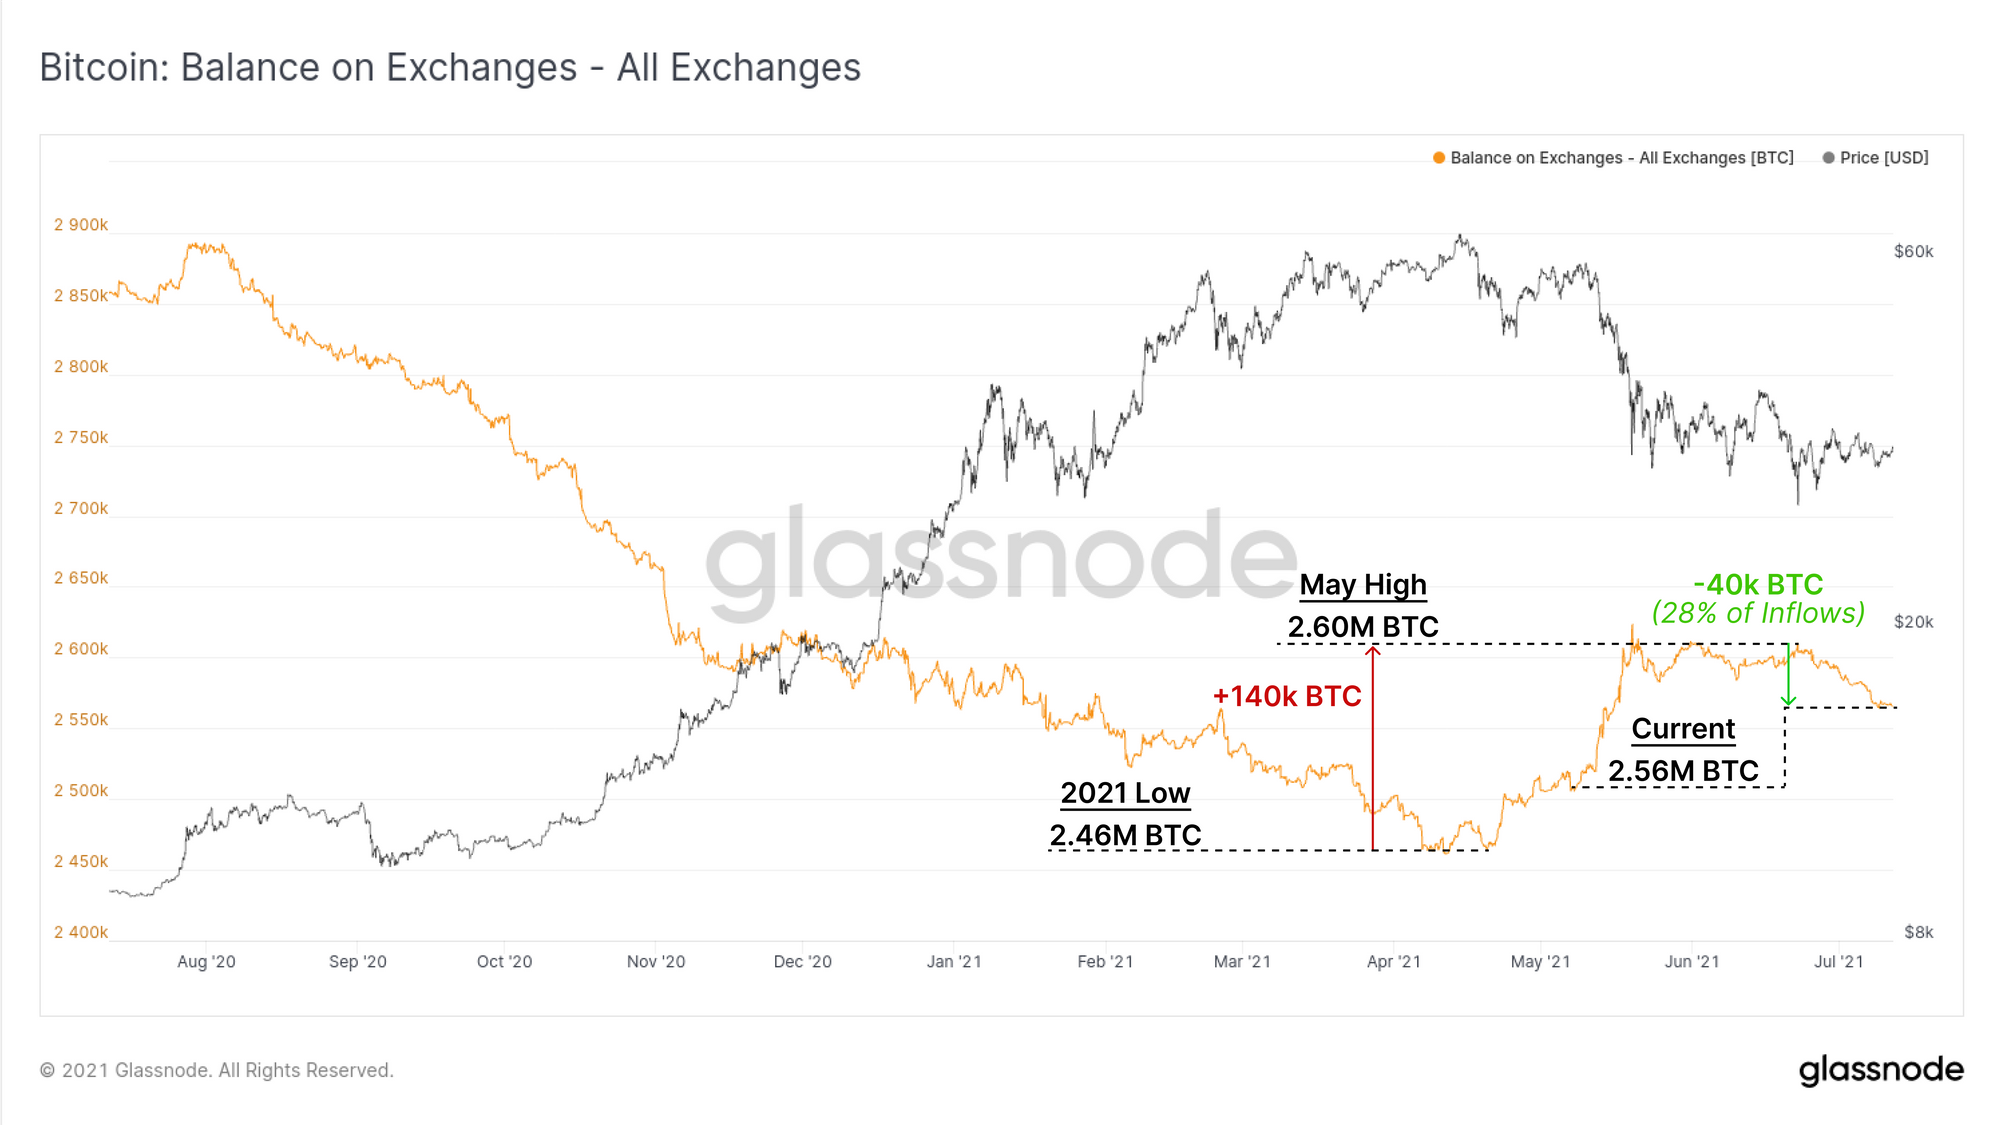
Last on exchanges, the aggregate balance has fallen by around 40k BTC over the past three weeks. This represents approximately 28% of the total inflow of 140k BTC observed since the local low set in April. Exchange balances we track are currently holding 2.56M coins.
Derivatives Quieten Off
Across derivative markets, we see relatively quiet conditions as open interest stalls, and trading volumes continue to decline. Given the heavy influence of derivatives markets in the leverage flush back in May, this suggests a reduced appetite for leveraged speculation.
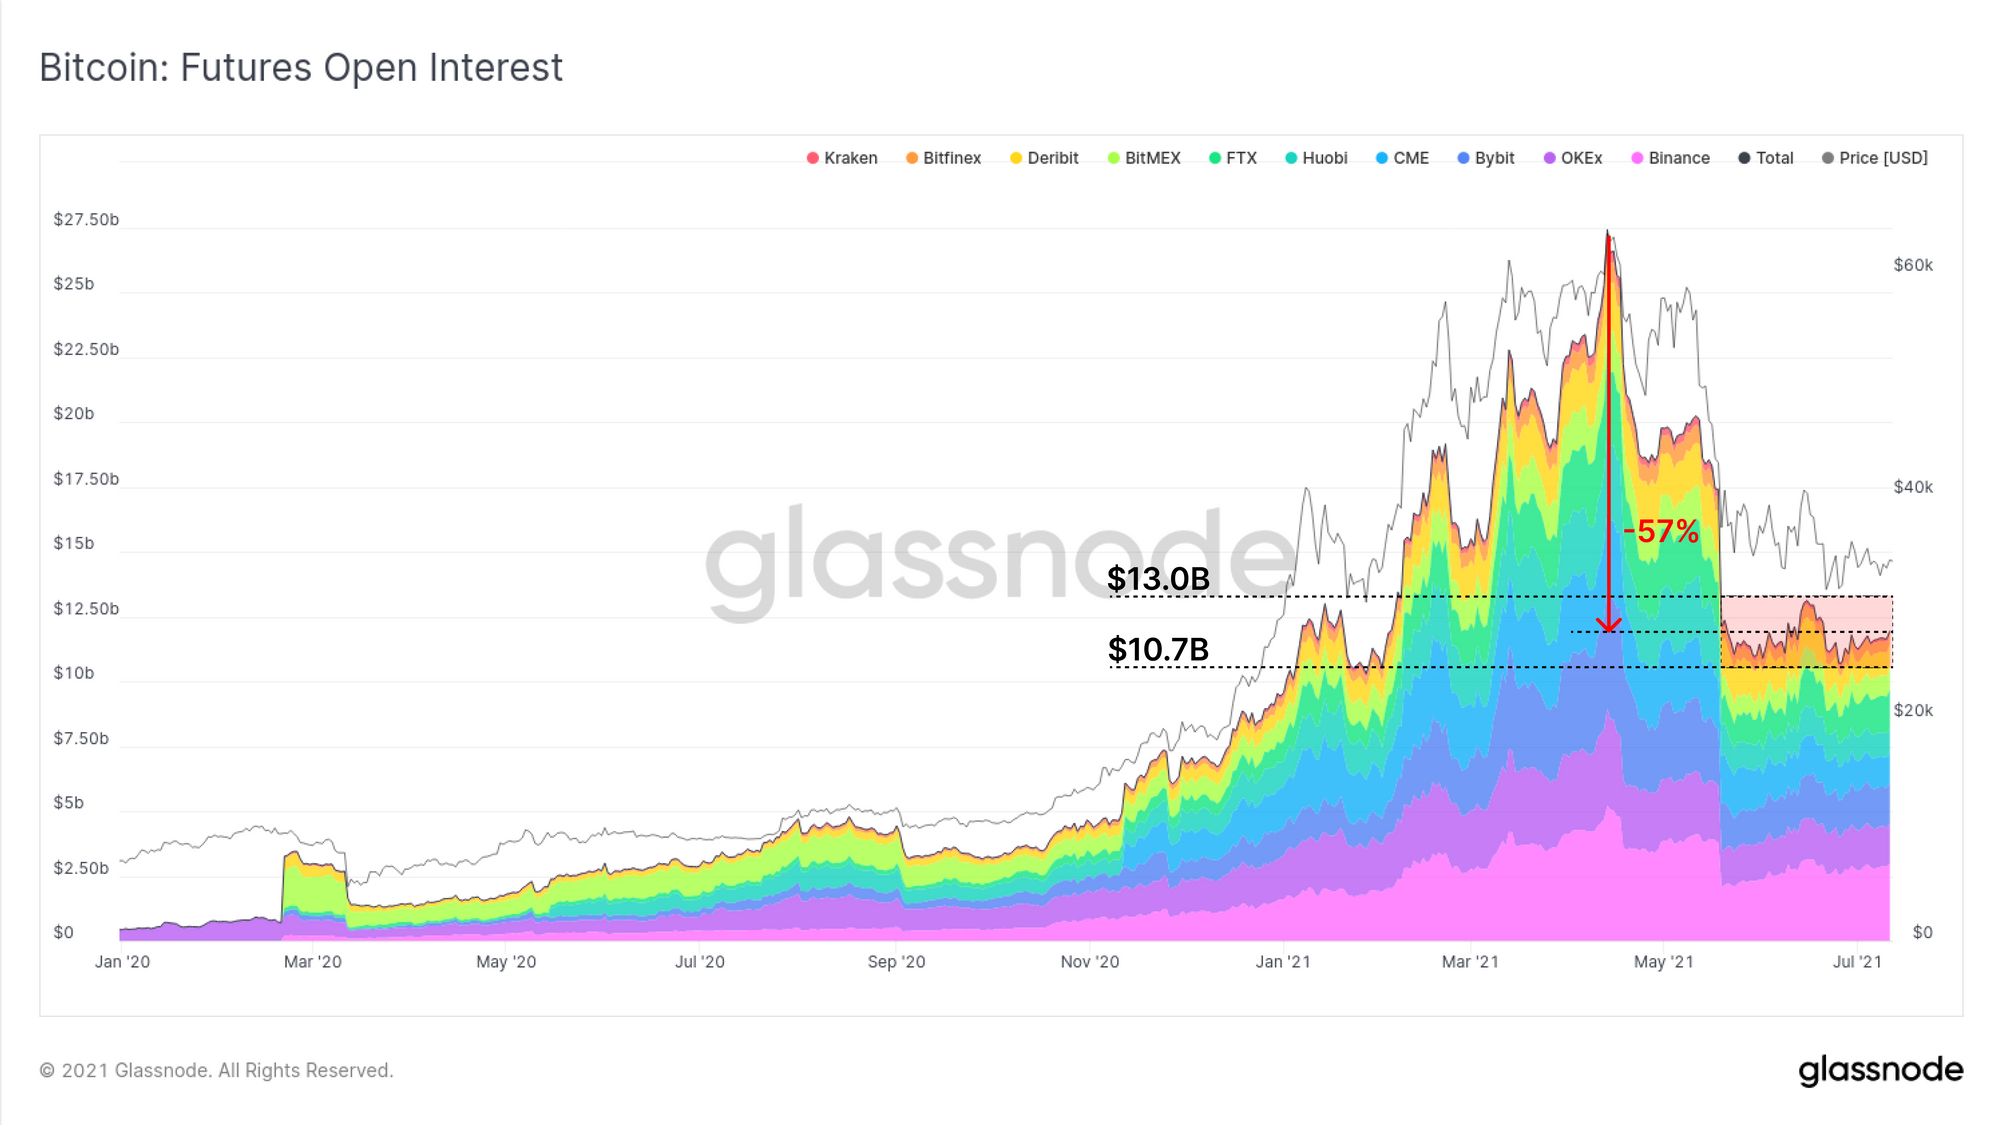
Since the sell-off in May, futures open interest has remained bound between $10.7B and $13.0B with only a handful of notable builds or declines within that range. Open interest remains 57% below the ATH set in April as Coinbase went public.
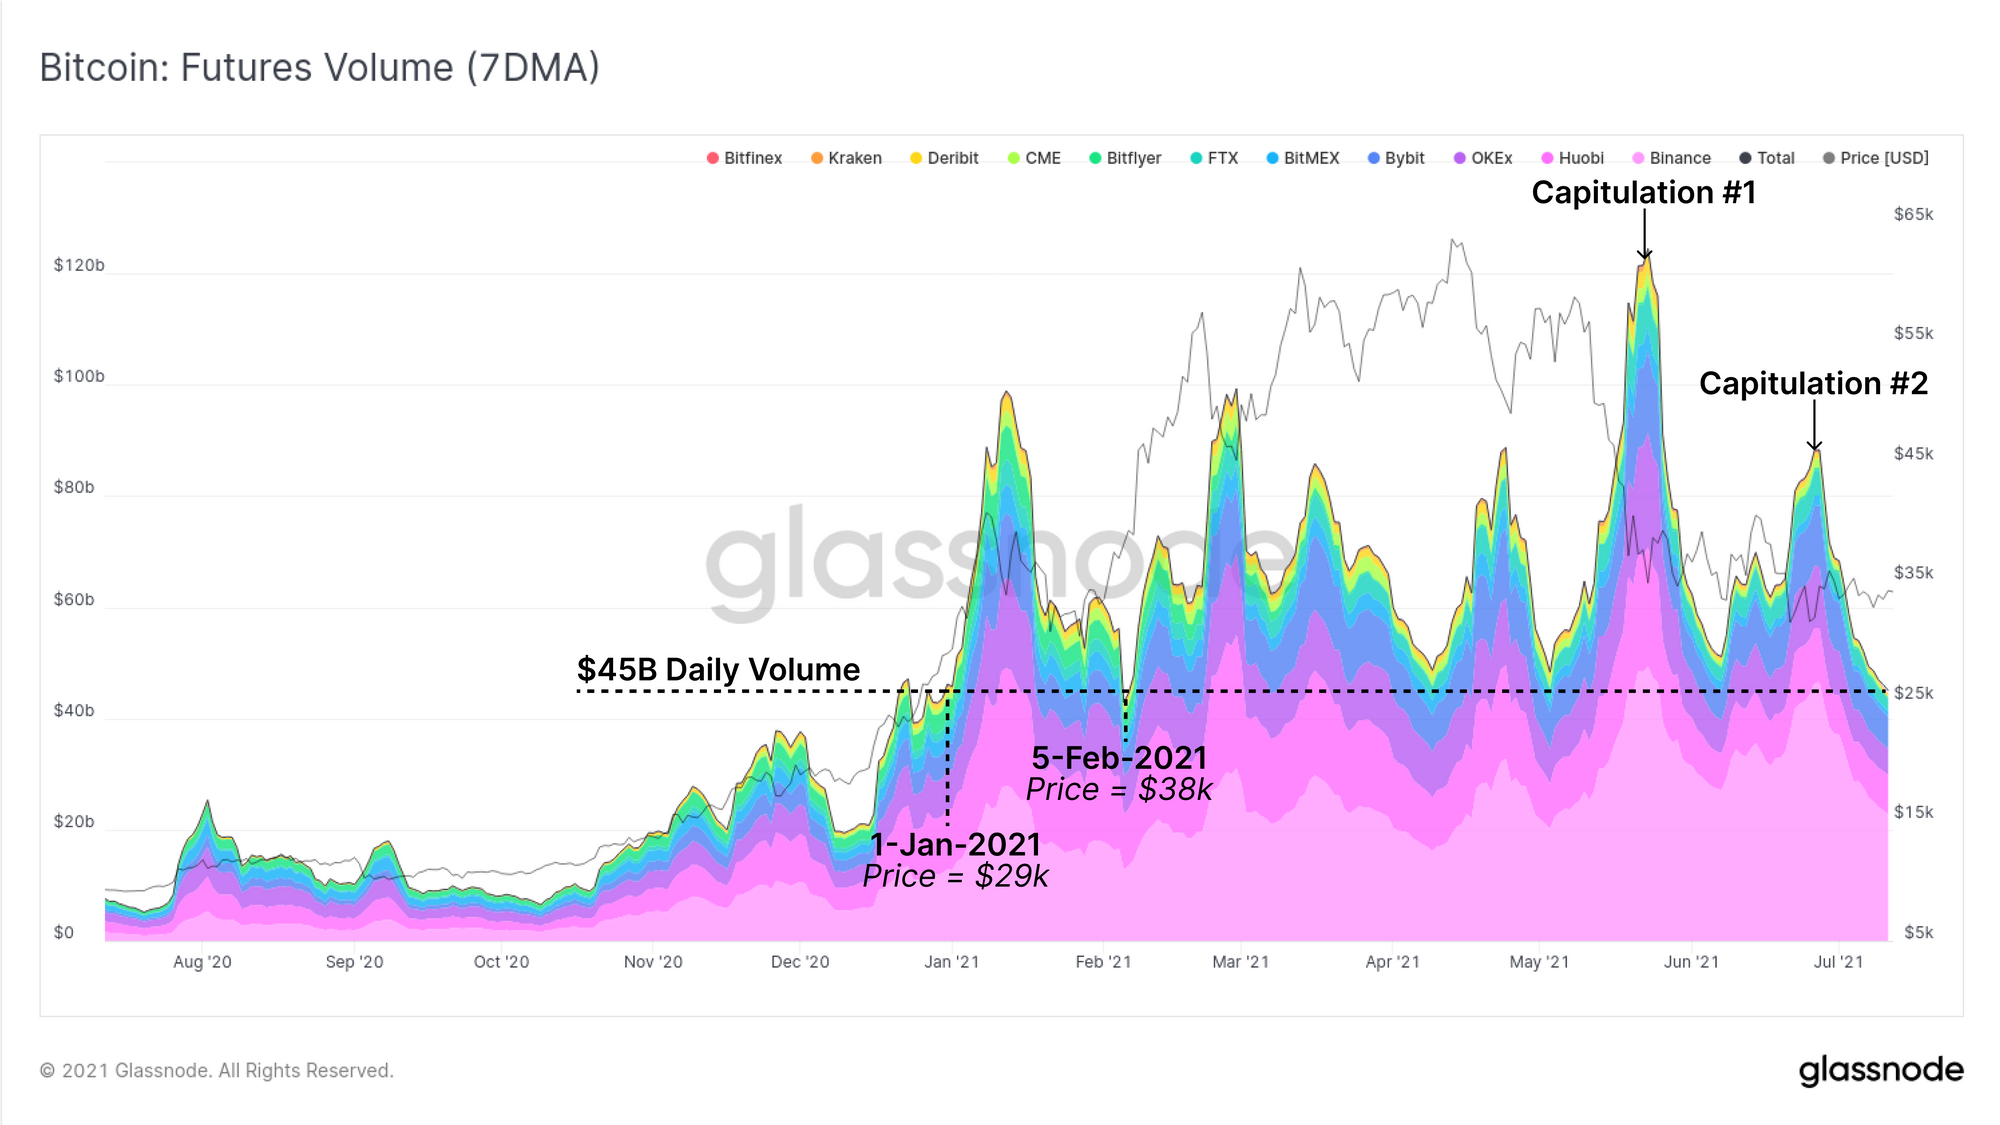
Volumes across futures markets are also in decline, falling back to $45B traded per day. These volume levels were last seen in Q1 2021 where prices were trading in a similar range ($29k to $38k). This puts current volumes 62.5% and 49% lower than the May (#1) and June (#2) capitulations, respectively.
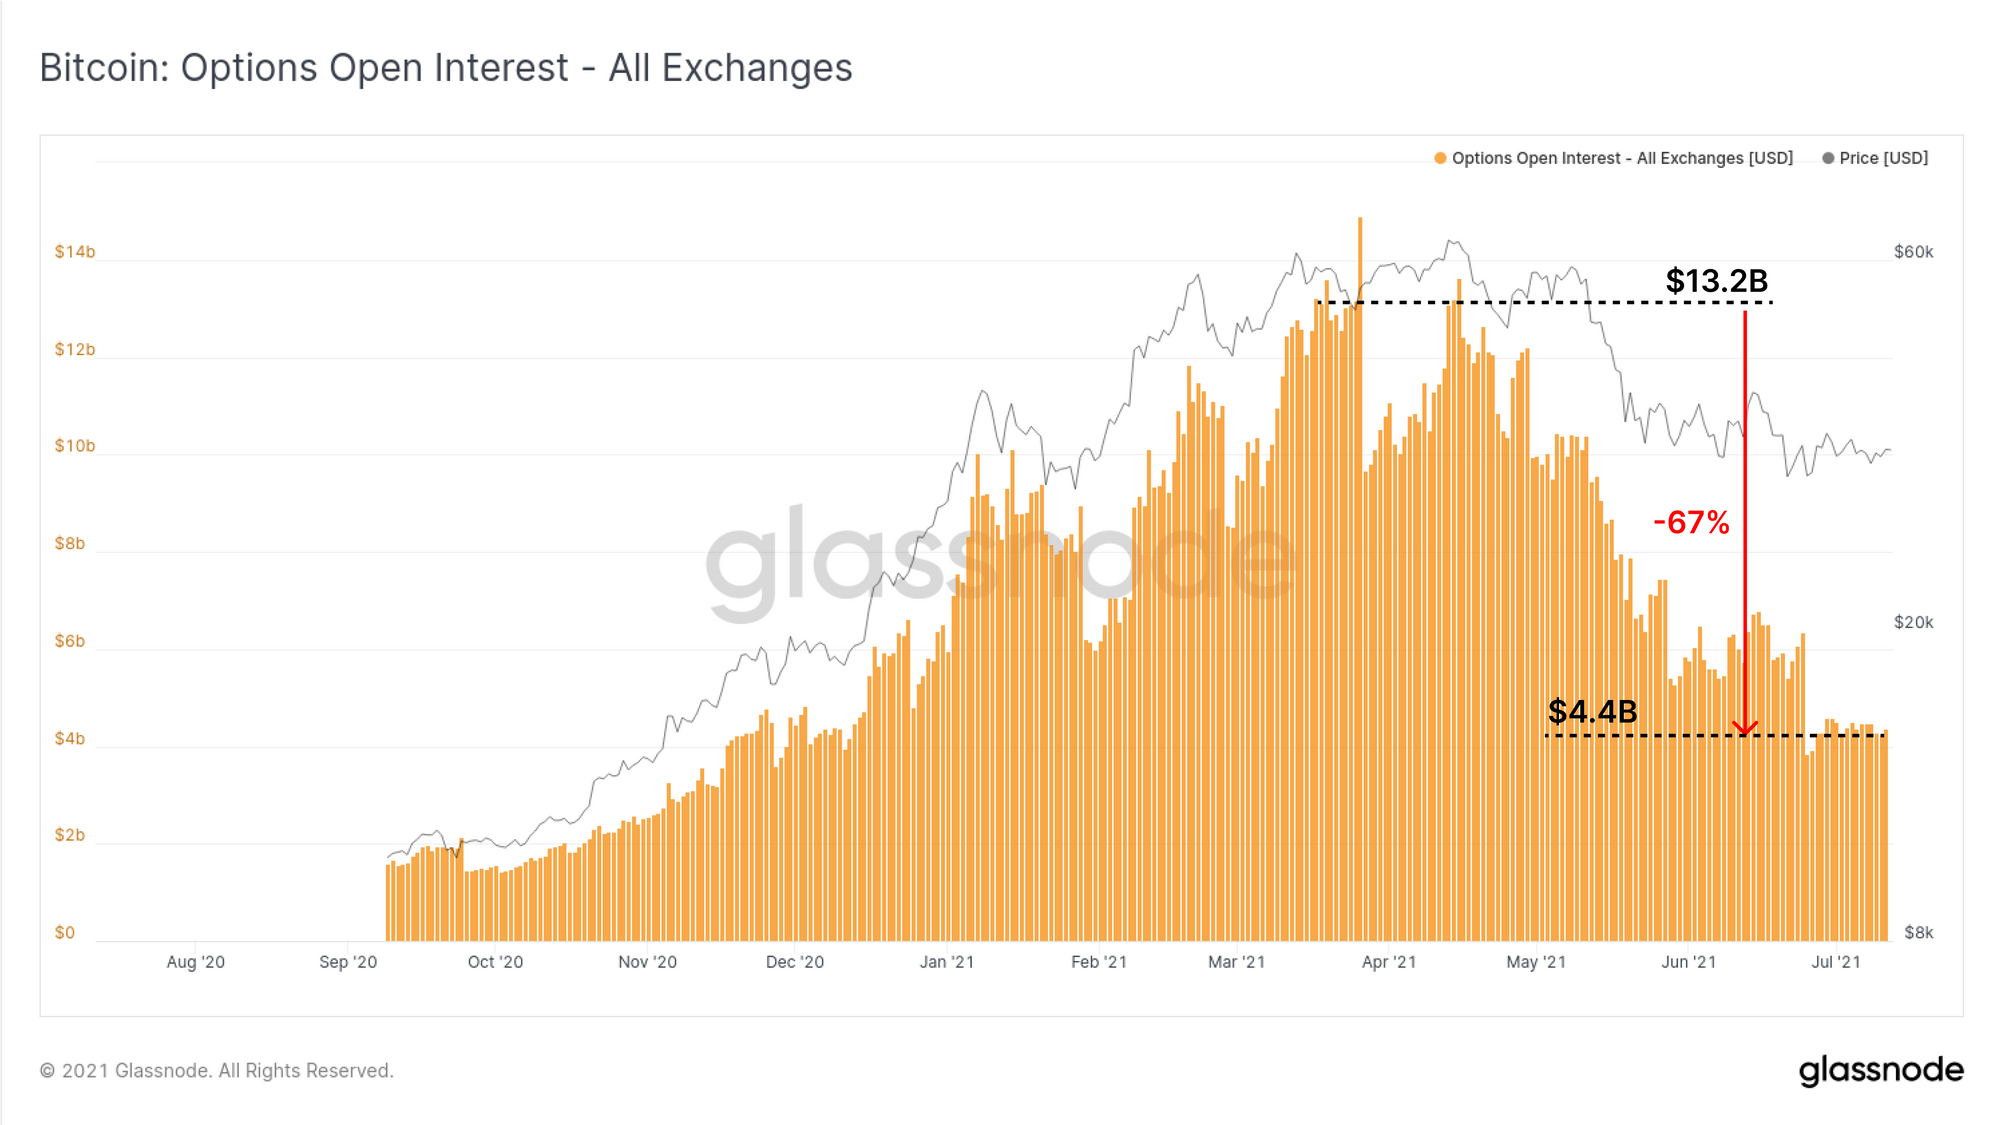
Options markets are experiencing a similar slow-down, with open interest falling by over 67% since typical highs of $13.2B in March and April. Current options open interest is at $4.4B, returning to December 2020 levels.
With such a significant decline across all derivatives markets, it becomes increasingly likely that market volatility will be driven by spot volumes, rather than short/long squeezes or leveraged liquidations. Thus the direction of the next large move is likely to strongly reflect underlying supply and demand (rather than a speculative premium/discount).
Supply Dynamics
Now that we have covered miners, exchange flows, and derivatives markets, we finally turn to dynamics of existing holders of the coin supply. Here we are looking for the balance of spending and holding patterns to assess investor sentiment and conviction.
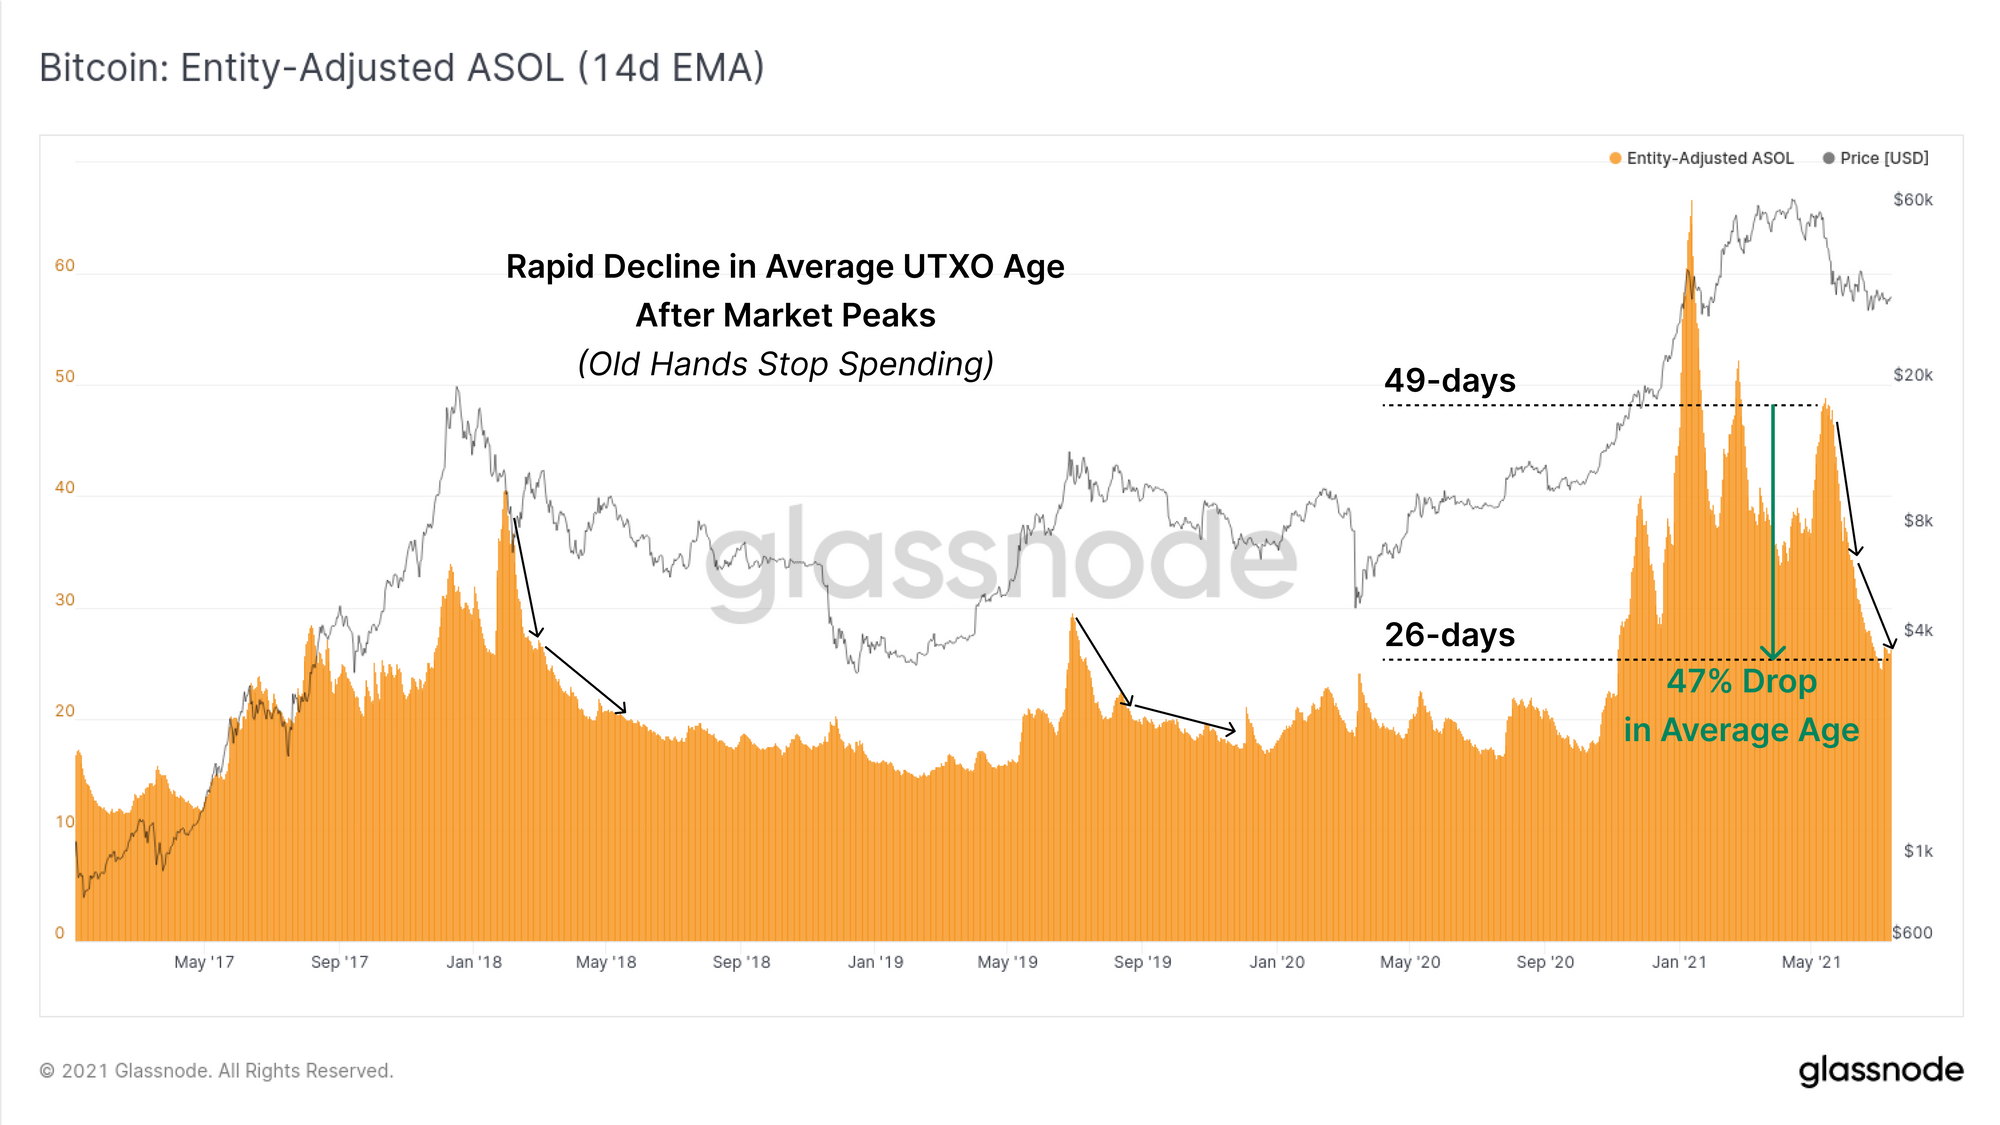
The ASOL metric captures the average age of spent outputs in a daily basis. Being that ASOL considers only the average age of spent outputs (not coin volumes), it is largely unaffected by quiet mempools. The chart below also uses entity adjustment to filter out exchanges and similar economic entities who often use low on-chain fee environments for wallet consolidation and management.
Similar to the 2017 and 2019 peaks, the average age of spent outputs is rapidly collapsing, indicative of a return to higher conviction HODLing and likely accumulation (noting it takes time for a subsequent accumulation supply squeeze to manifest).
ASOL suggests that overall, older coins are increasingly dormant. The HODL waves provide more data-points to support this thesis.
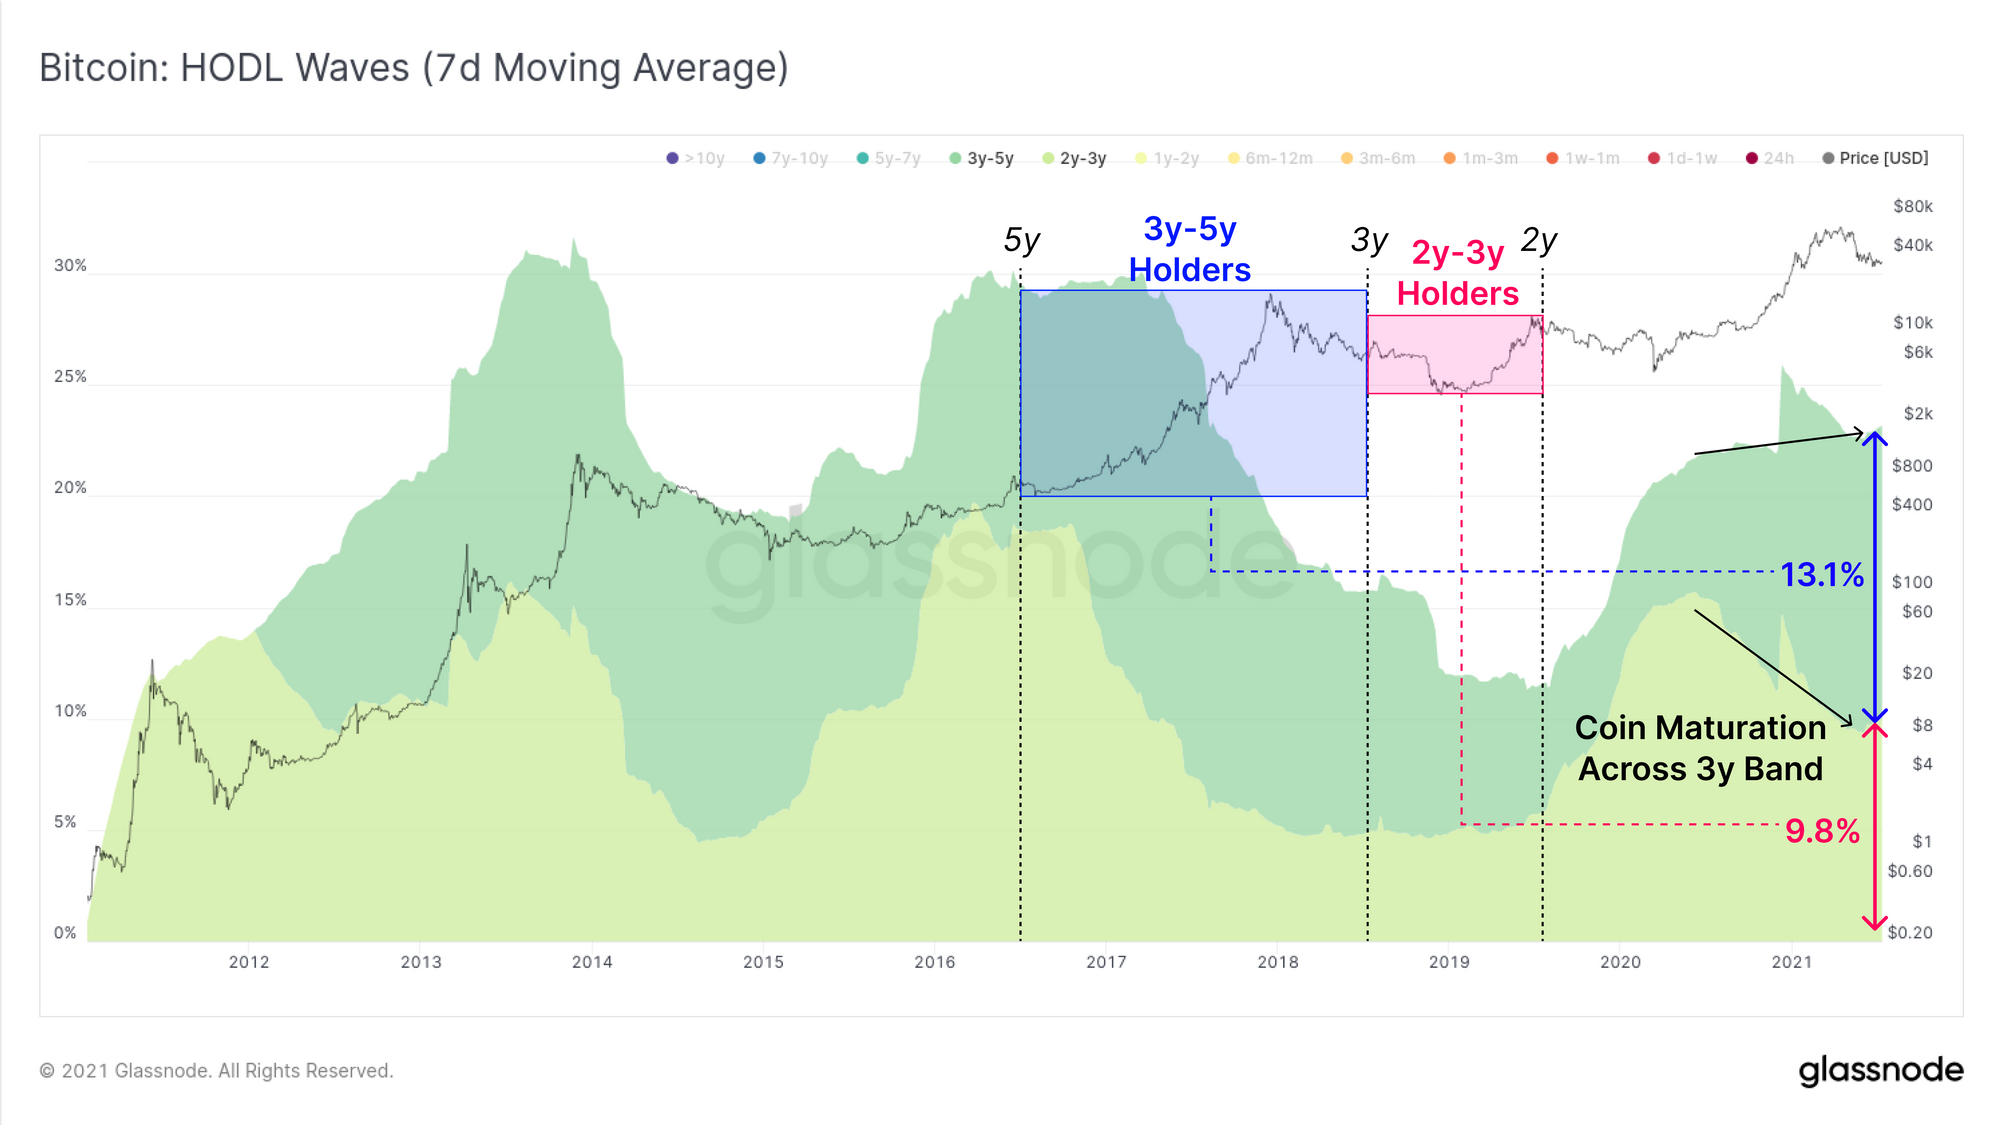
The chart below filtered for coins aged between 2y and 5y. These age bands reflect two groups of strong conviction buyers, both of which held through significant volatility:
- 2y-3y Holders accumulated in the bear market from late 2018 through to the 2019 peak. These investors currently hold 9.8% of the supply.
- Since March 2020, 5.2% of the circulating supply has 'matured' from the 2y-3y band into the 3y-5y band.
- 3y-5y Holders accumulated between July 2016 and July 2018, and thus represent last cycles bull market buyers. This cohort continues to grow, now representing 13.1% of the supply. These investors bought between $640 and the previous ATH at $20k and have held through significant volatility.
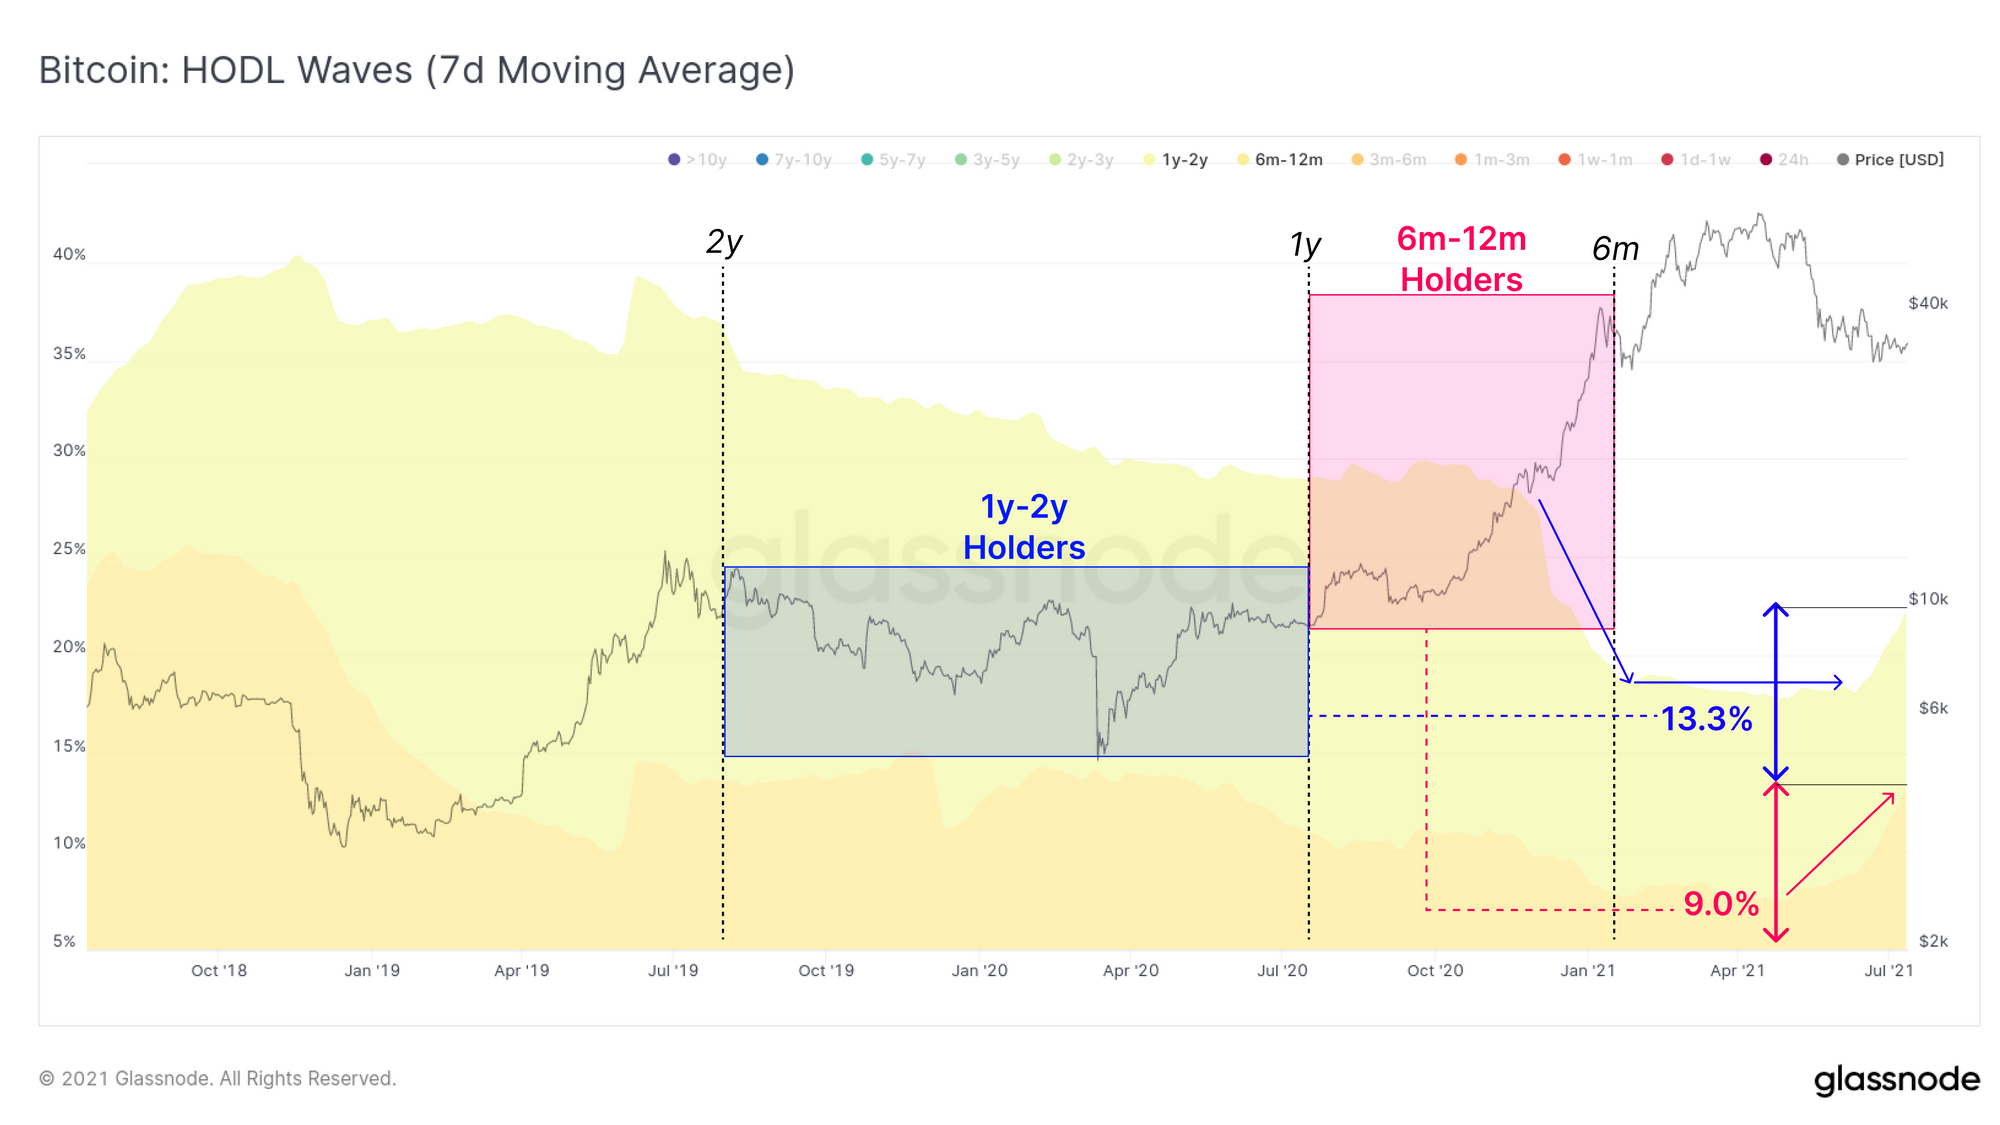
For middle aged coins (6m to 2y old), we can see that through Q1 of this year, these investors were largely distributing (declining waves). The accumulation range for those Q1 sellers extends as far back as January 2019 after the 2018 capitulation to $3k (thus capturing a tidy profit multiple).
These cohorts appear to have recently commenced a switch in behaviour, from spending, into a holding pattern. Coins aged 1y-2y currently represent 13.3% of the supply and were accumulated from mid-2019 to mid-2020. After a distributing heavily in Q1, their holdings plateaued, indicating a slow down of spending.
Coins aged 6m-12m are this cycles bull market buyers and now hold 9% of the coin supply. This age band has started to notably swell starting in early April, indicating that a large proportion of buyers from Nov-Dec 2020 have not spent their coins.
The evolution of these 'middle aged' HODL waves over the next three months will be key to appreciating how much of the 'early institutional supply' remains tightly held, or conversely, was sold over recently.
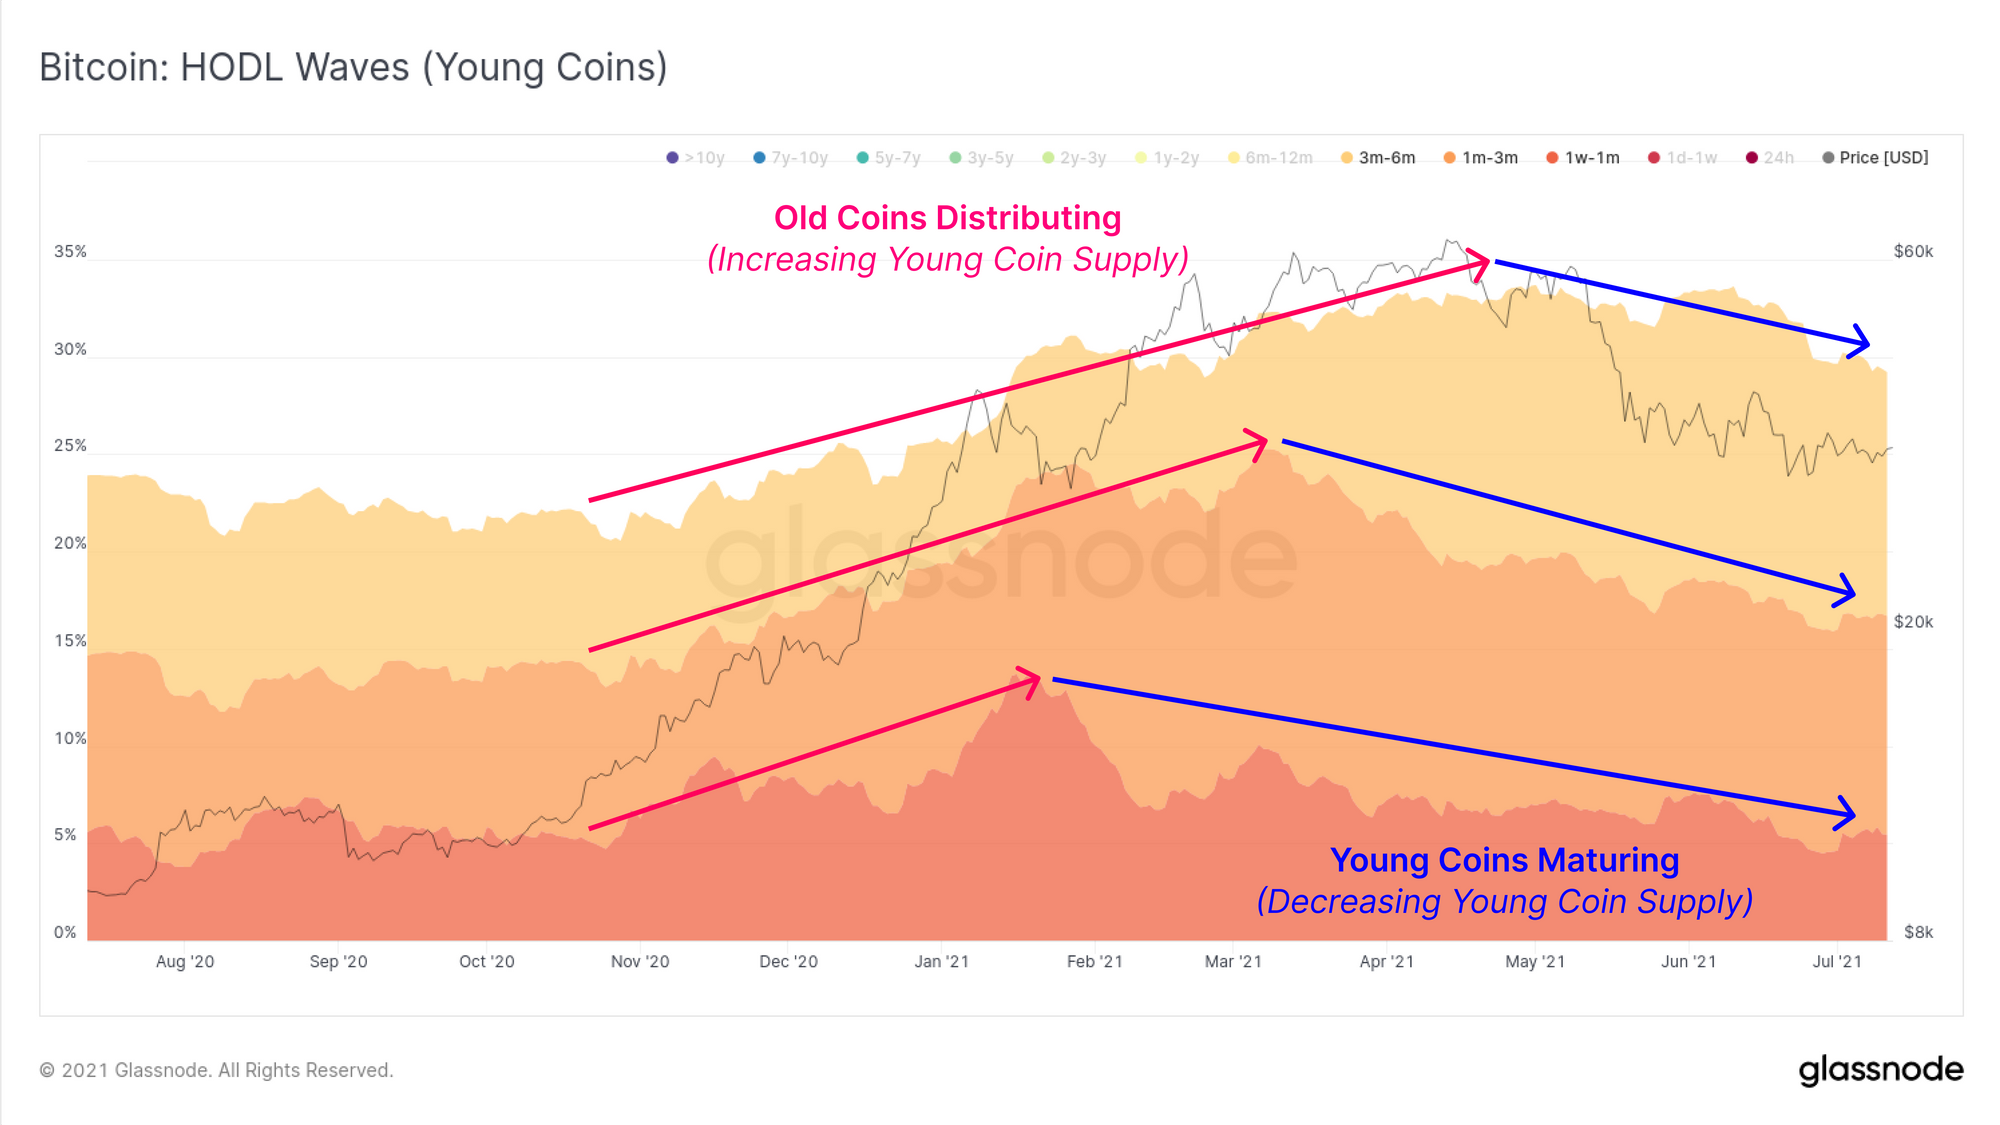
Finally, we investigate the youngest economically meaningful coins, those aged between 1m and 6m. These represent bull market buyers who were generally buying coins off older hands realising profits. This behaviour is evident from Nov 2020 to May 2021 as young coin supply swelled from ~22% to over 32%.
However, since the sell-off in May, the young coin supply has commenced a structural downtrend which indicates coins are maturing, HODLing is taking place, and accumulation is likely underway.
It is favourable for price if young coin supply continues to decline (old coins dormant and young coins maturing). Conversely, large spikes in young coin supply suggests renewed distribution and would favour a a bearish bias.
Week On-chain Dashboard
The Week On-chain Newsletter now has a live dashboard for all featured charts