The Week On-Chain (Week 32, 2020)
With BTC now testing the $12k price point, it seems as though the next bull market may have begun. However, with on-chain fundamentals slowing slightly, investors should stay wary.


Bitcoin Market Health
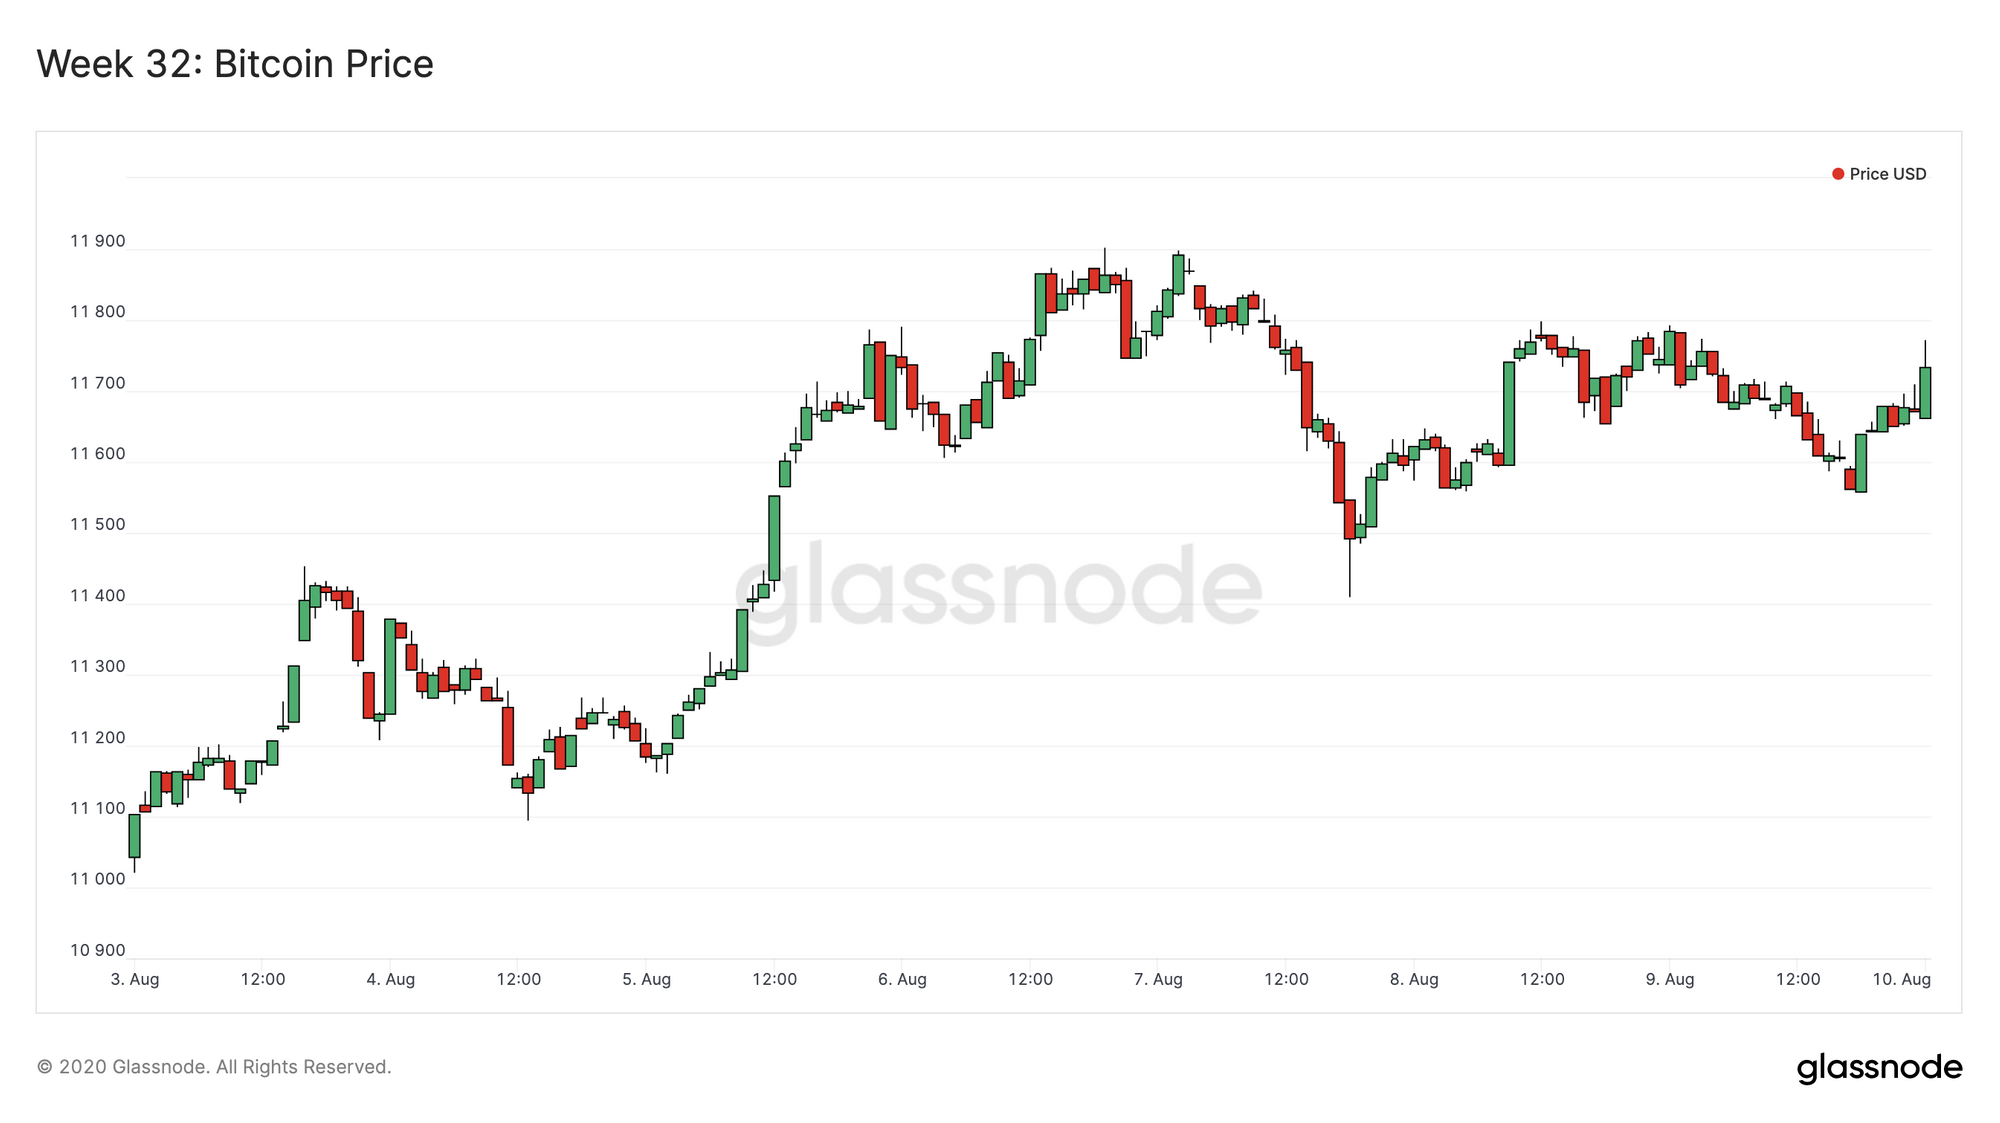
Bitcoin had another high-performing week, starting out Week 32 at around $11,100 and ending the week at $11,650. As of Monday morning, it has spiked up even further, and is currently hovering slightly below $12,000.
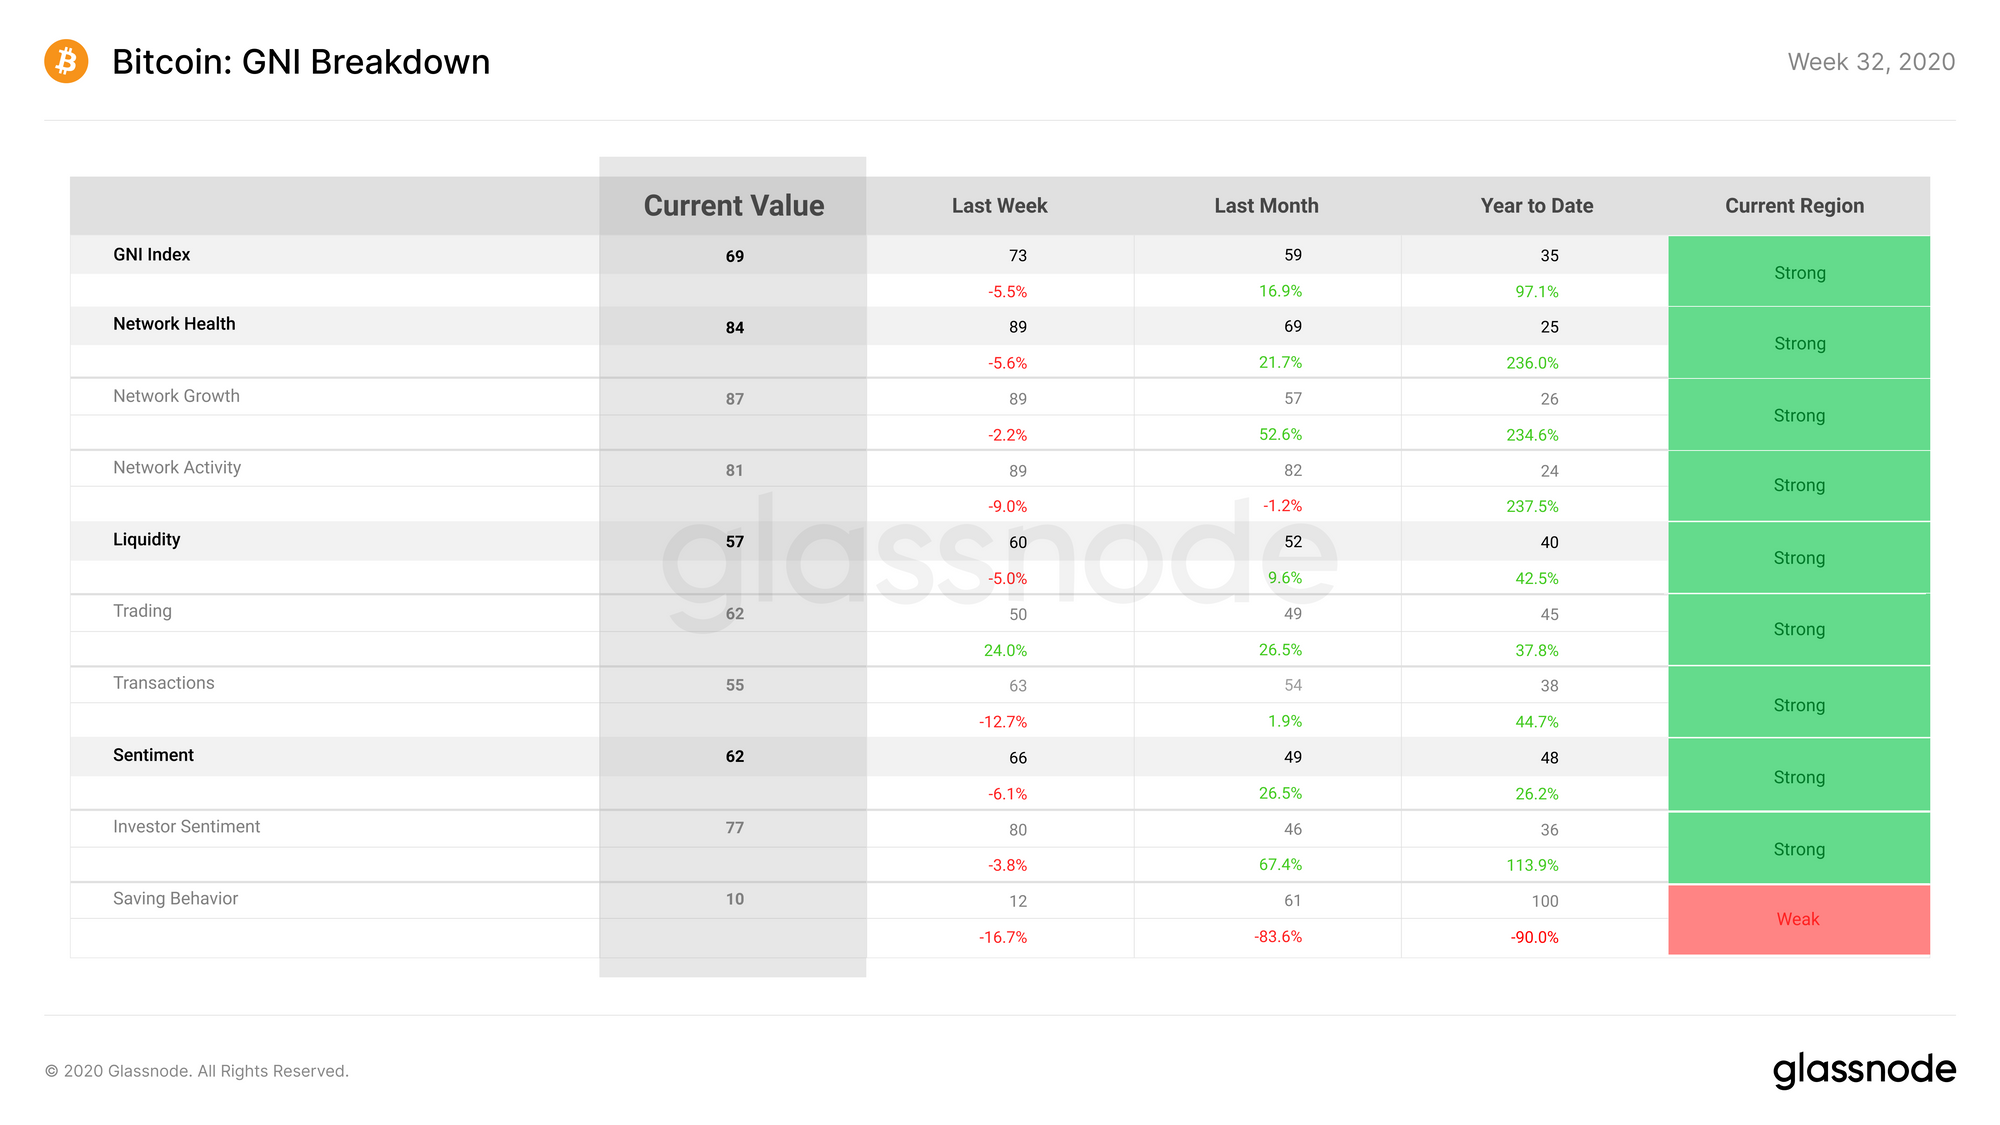
Bitcoin on-chain fundamentals decreased slightly throughout Week 32, with GNI slipping down to 69 points from 73 the previous week. This drop was due to slight decreases in on-chain fundamentals across all subindices - but overall on-chain health remains intact.
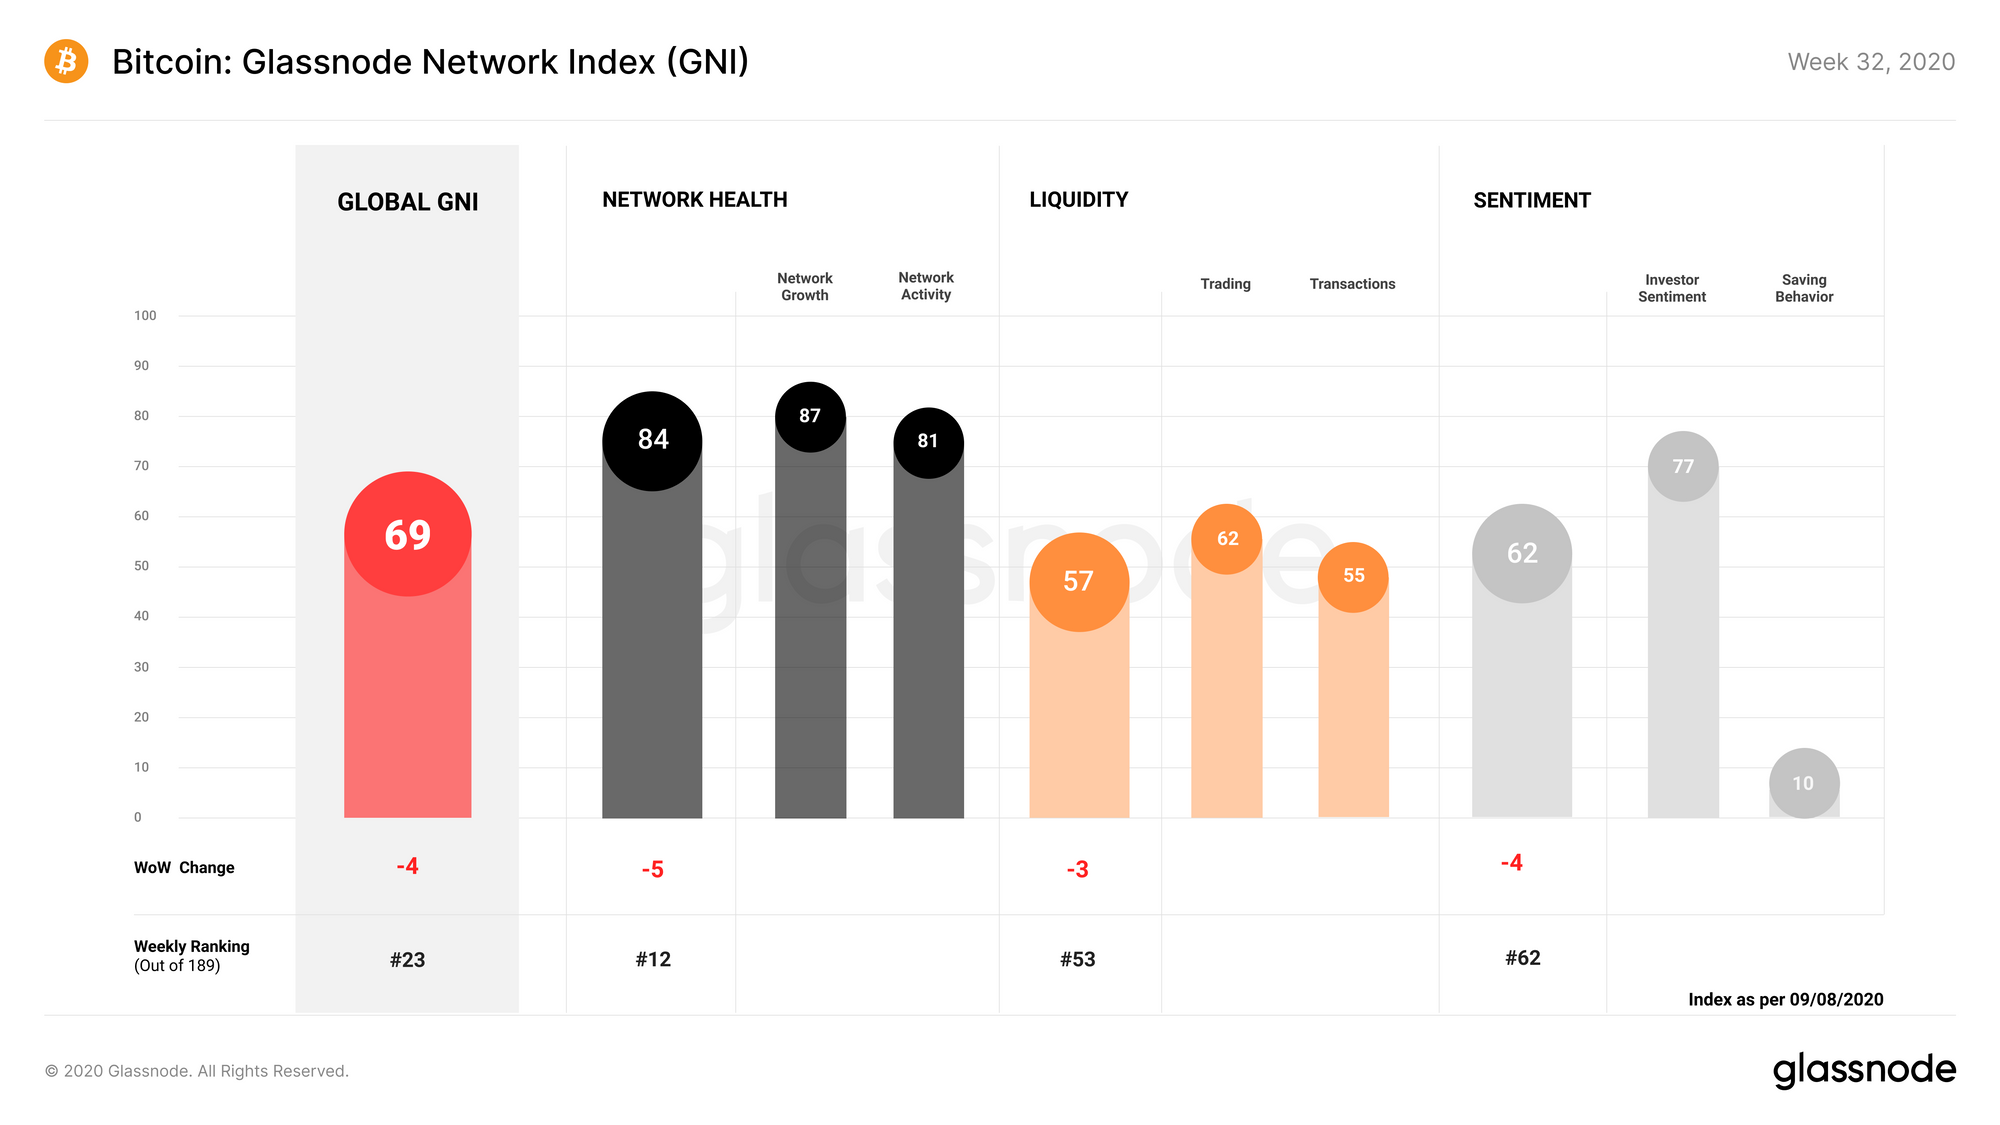
Network Health lost 5 points over the past week, but remains strong at a score of 84 points. Network activity suffered slightly more than network growth during Week 32, as on-chain transactions slowed down relative to the previous week.
Liquidity also saw a slight decrease, losing 3 points due to a drop in the transaction liquidity subcategory. This, in turn, was caused by the above-mentioned decrease in the number of on-chain transactions over the past week. However, overall transaction rates remain high relative to pre-bull market levels.
Sentiment dropped by 4 points during Week 32, as the saving behavior subcategory continued to drop. This was caused by a decrease in the rate at which hodlers are acquiring BTC - but this figure is still in the positive numbers, meaning that hodlers are still doubling down on BTC, but at a slower rate due to the increased price.
Glassnode Compass
Week 32 represents the compass' 11th consecutive week in Regime 1, indicating an ongoing bullish outlook as BTC continues to see price gains.
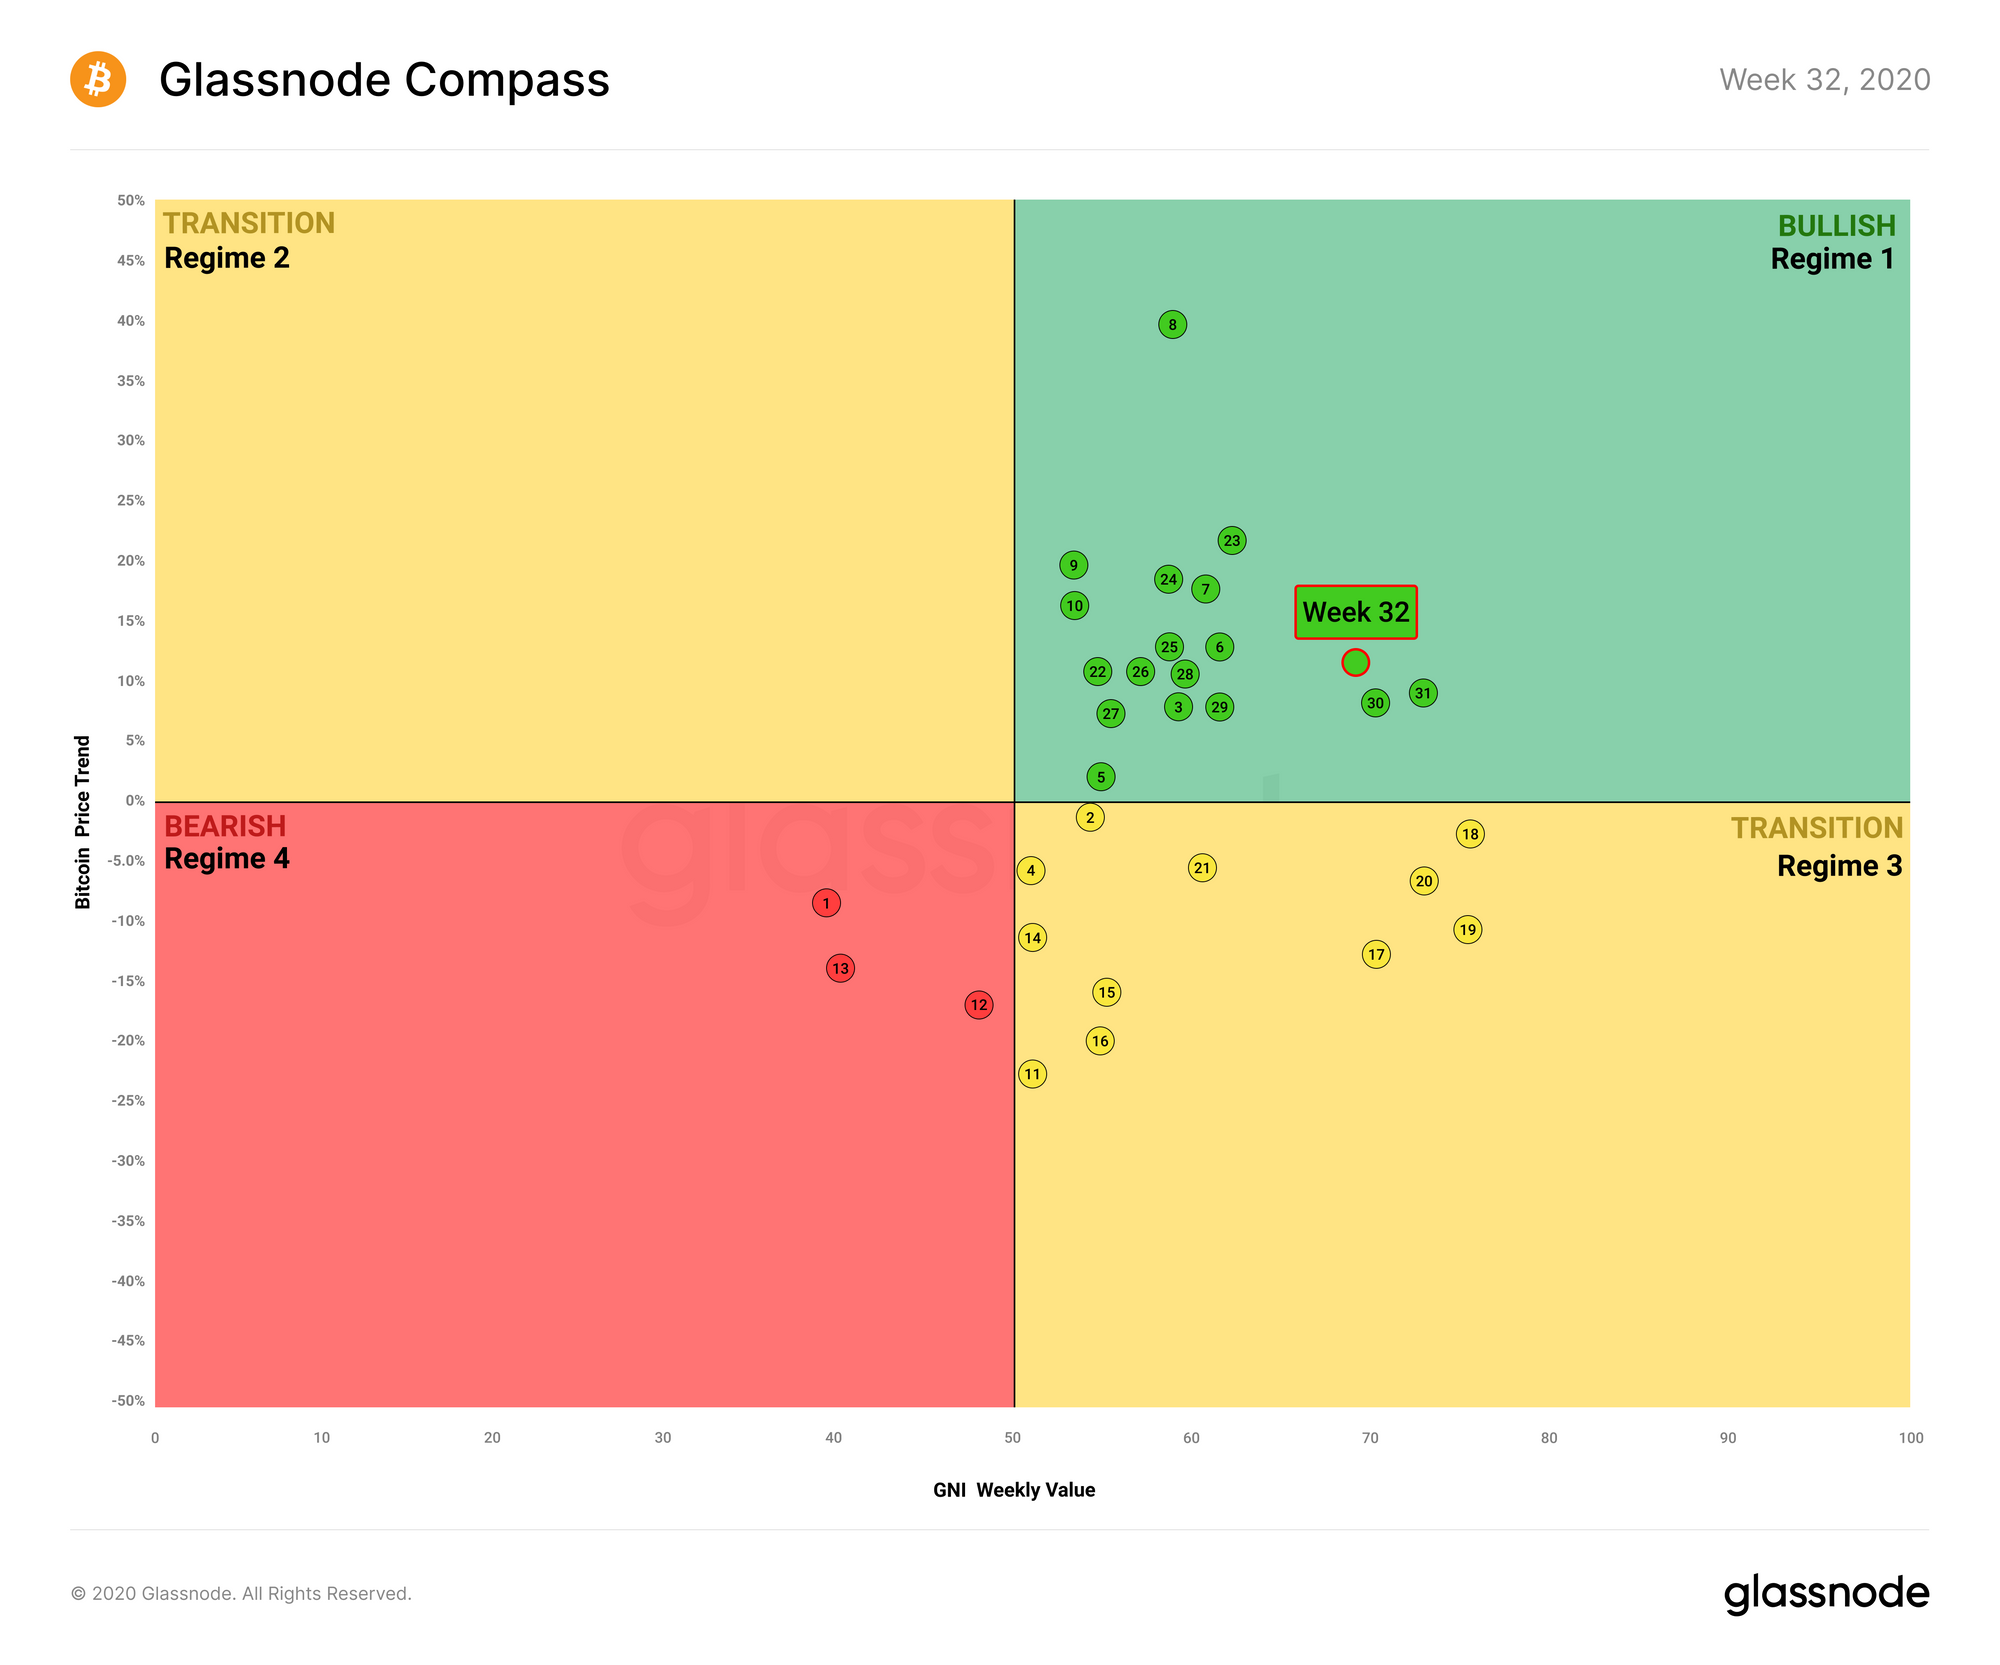
While GNI slid downward slightly this past week, BTC's price performance has improved, leaving the compass safely in the green bullish zone for the time being. Many on-chain signals point to the potential for further price increases - however, with on-chain fundamentals slowing slightly, investors should stay wary and keep a close eye on trends over the next week.
Bitcoin's STH-MVRV Value Supports Bull Market Thesis
MVRV is the ratio between market cap and realized cap. By comparing these two metrics, MVRV can be used to get a sense of when an asset's price is above or below "fair value", thereby helping to spot market tops and bottoms. Short-Term Holder MVRV looks specifically at UTXOs younger than 155 days, indicating the behavior of short-term investors.
Historically, when this metric has emerged from below 1 and reached 1.25, this has marked the start of bull markets. Currently, STH-MVRV is sitting at above 1.26, providing a bullish signal.
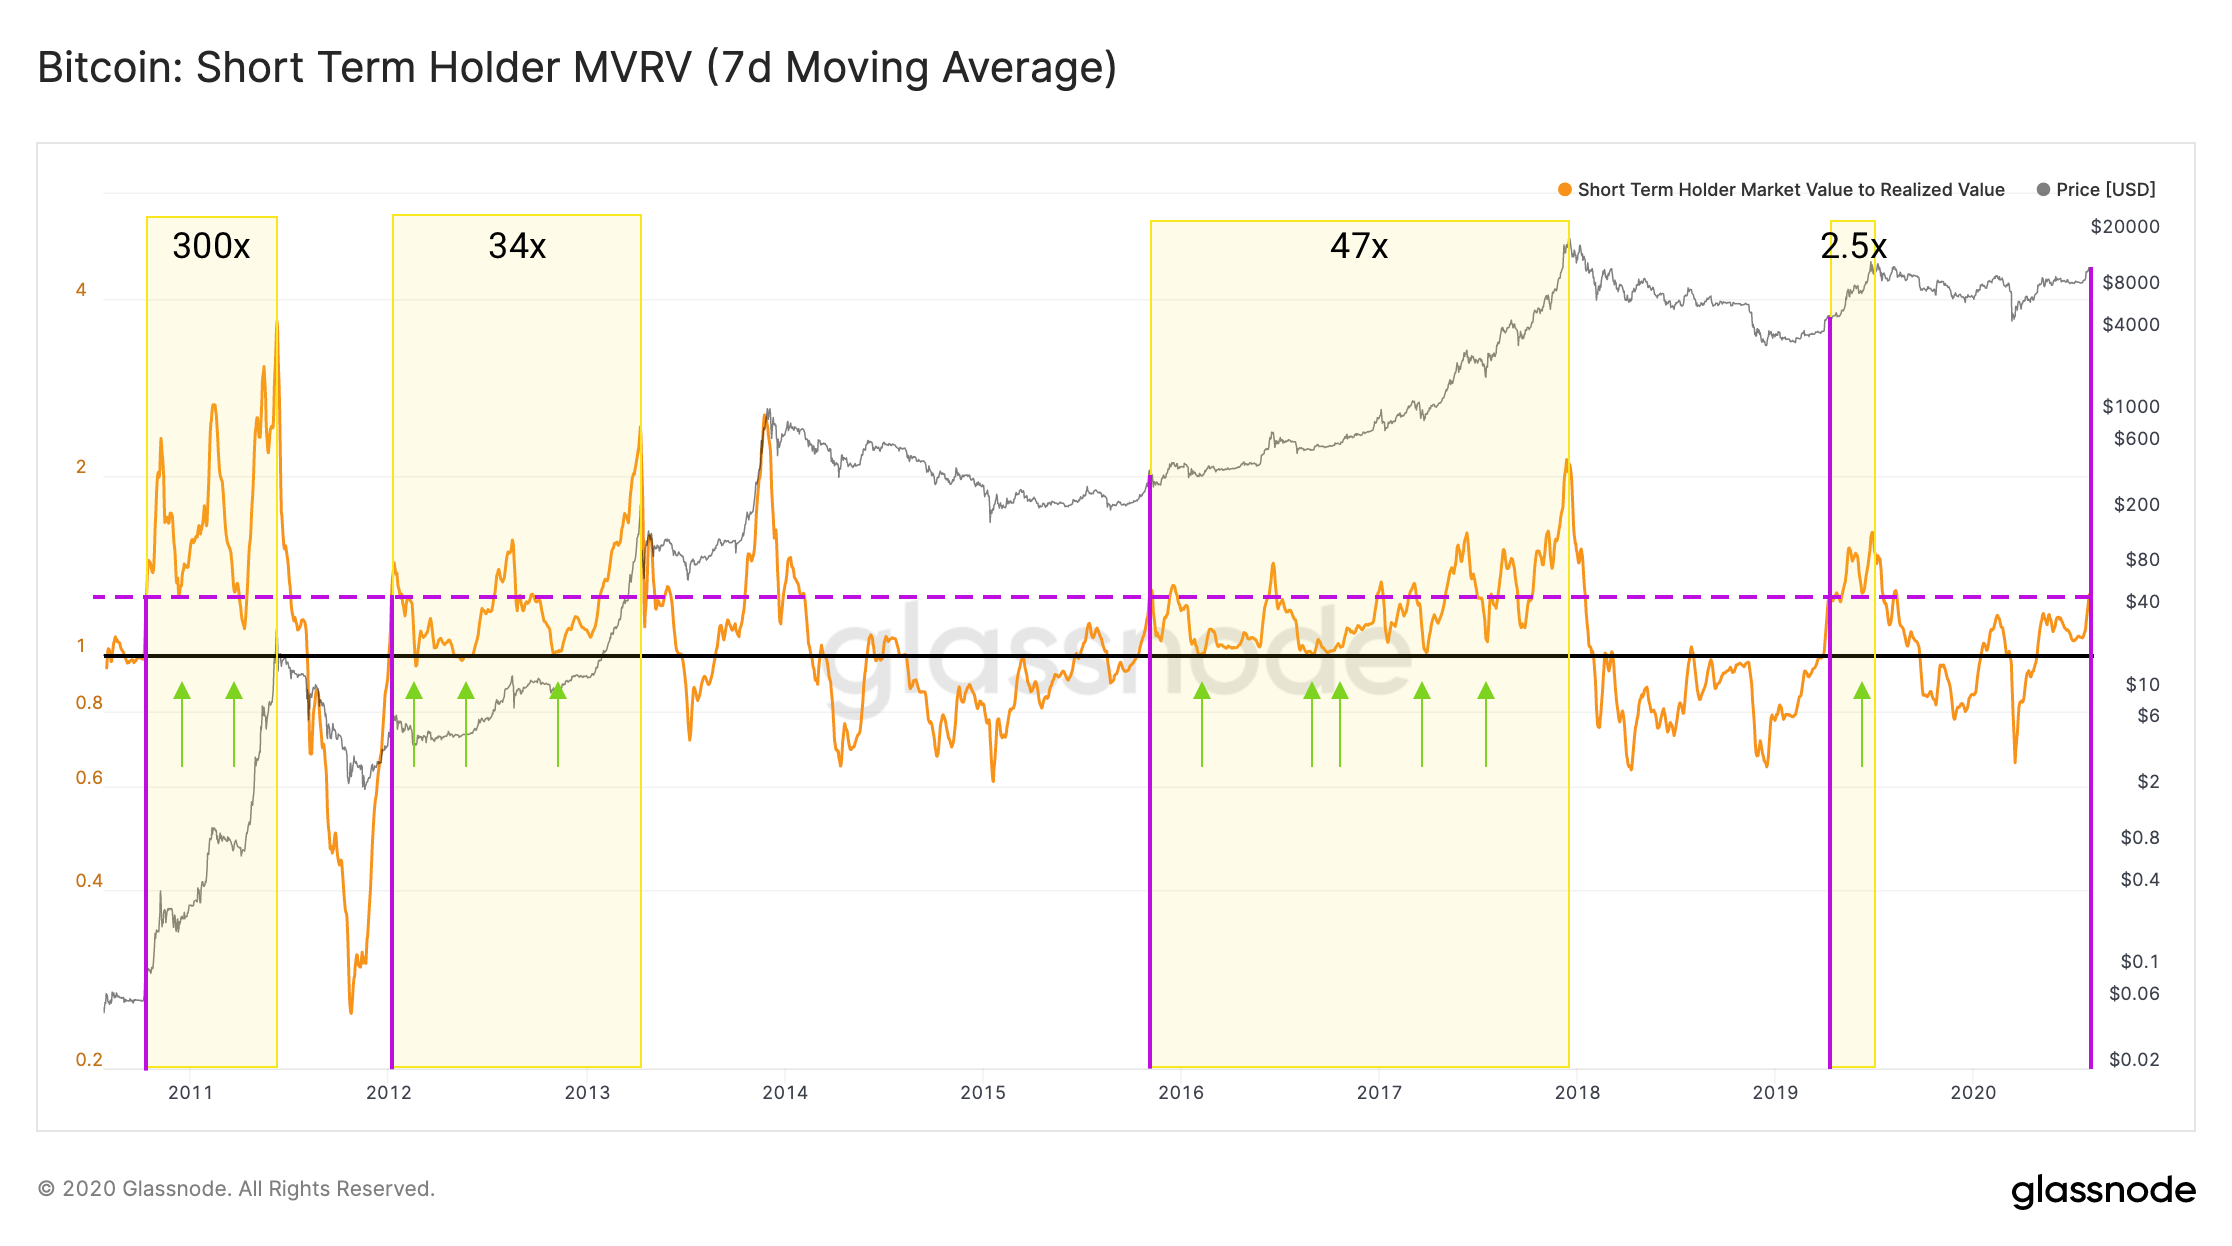
As long as STH-MVRV stays above 1 (as demonstrated by the green arrows above), the bull market has historically tended to stay in effect. As such, it is crucial to watch that we stay above 1 here. As long as this is the case, BTC should be in for a continued bull market.
Keep an eye on STH-MVRV to see if this trend continues. In the meantime, if you haven't already, sign up to our email newsletter to receive the latest updates on the state of BTC and other crypto markets.

We want to make our Glassnode Insights content as high-quality and relevant as possible. In order to tailor our articles to our readers, we have published a short survey to get your feedback.
Complete the survey and be in to win a free Advanced subscription to Glassnode Studio for a year. The winner will be informed via email on 24 August.
Are you subscribed to our Glassnode Insights mailing list? If not, sign up here to receive The Week On-Chain in your inbox each week.
Product Updates
Metrics and Assets
- Market Cap to Thermocap Ratio (BTC, ETH, LTC, BCH) - A new metric used to assess if a given asset's price is currently trading at a premium with respect to total security spend by miners.
- Difficulty Ribbon (BTC) - A metric signaling buying opportunities based on the moving averages of mining difficulty.
- Difficulty Ribbon Compression (BTC) - Quantifies the compression of the Difficulty Ribbon metric.
- Added supports for more tokens (ERC20) - MX, GNO, LEND, RSR, PNK, CHSB, MLN, UMA, STAKE, YFI, MCB, FTT, BZRX, PNT, OCEAN, MTA, BAL, BAND, AMPL, DMG.
Features
- New metric navigation - We have updated the sidebar on Glassnode Studio to make metric navigation and search more intuitive. Metrics that should span over multiple categories (e.g.
Miner Flow to Exchanges) will now be included in both of those categories (e.g.MinersandExchanges), making the process of finding metrics related to a specific topic easier.

- Follow us and reach out on Twitter
- Join our Telegram channel
- For on–chain metrics and activity graphs, visit Glassnode Studio
- For automated alerts on core on–chain metrics and activity on exchanges, visit our Glassnode Alerts Twitter