Market Meets Psychological Resistance
Bitcoin prices have been rejected from a series of psychological on-chain levels, related both to Older hands from the 2021-22 cycle and also for the Whale cohort. Profit-taking and capital flows have started to take place, although they remain low by historical standards.


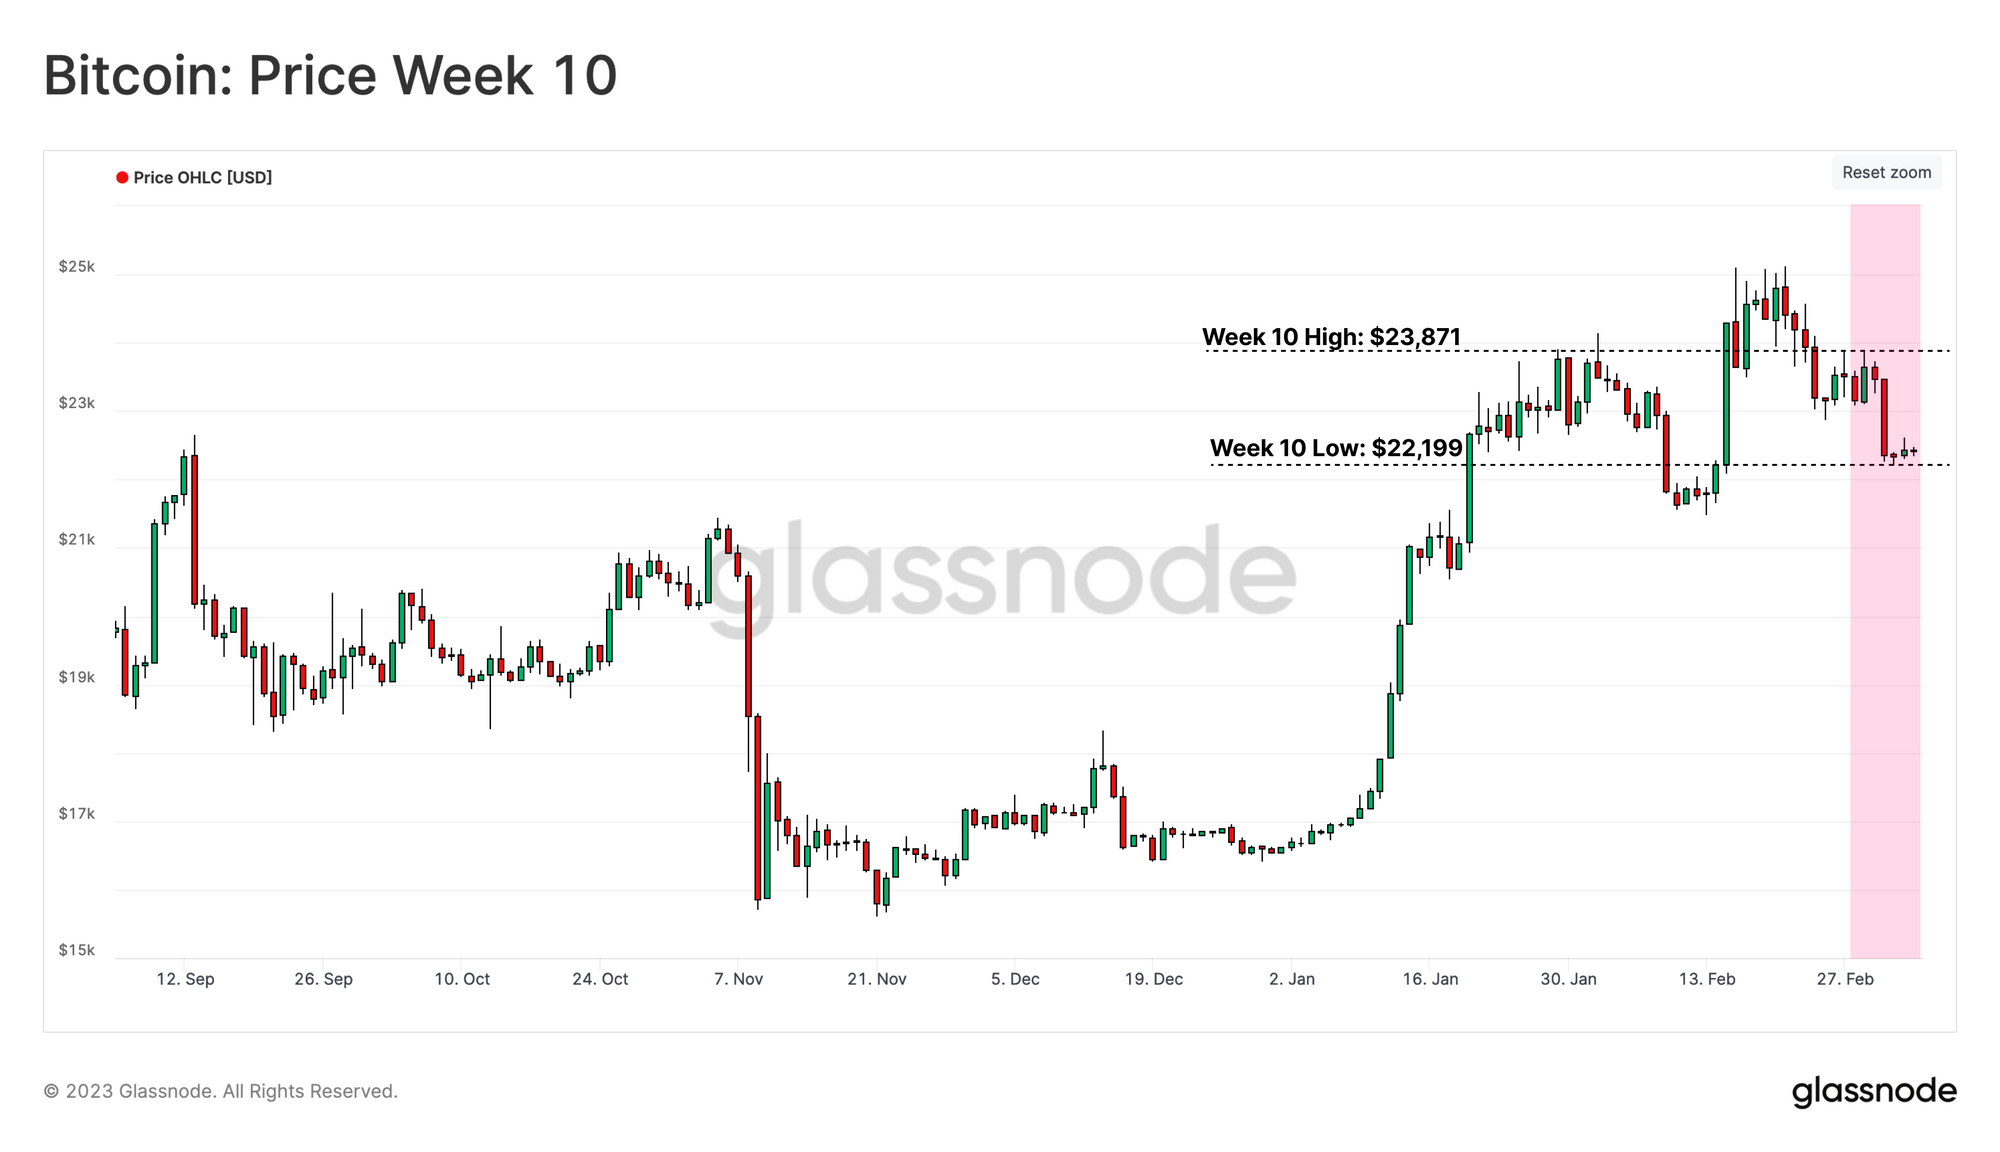
The digital asset market traded lower this week, with Bitcoin coming off a high of $23,871 and falling to a weekly low of $22,199. As we will discuss in this edition, the weekly high is coincident with several psychologically important realized price levels related to both Older holders from the last cycle and Whale entities that have been active since the 2018 cycle.
In this edition, we will explore these various realized prices, as well as indicators relating to capital inflows, transfer volumes, and profit-taking that are emerging as the market attempts to transition out of the bear market territory.
🪟 View all charts covered in this report in The Week On-chain Dashboard.
🔔 Alert Ideas presented in this edition can be set within Glassnode Studio.
🏴☠️ The Week On-chain is translated into Spanish, Italian, Chinese, Japanese, Turkish, French, Portuguese, Farsi, Polish, Arabic, Russian, Vietnamese and Greek.
📽️ Visit and subscribe to our Youtube Channel, or visit our Video Portal for more video content and metric tutorials.
Market Contests with Cost Basis
In addition to traditional technical indicators, pricing models founded on on-chain principles can be powerful tools for estimating supply and demand boundaries.
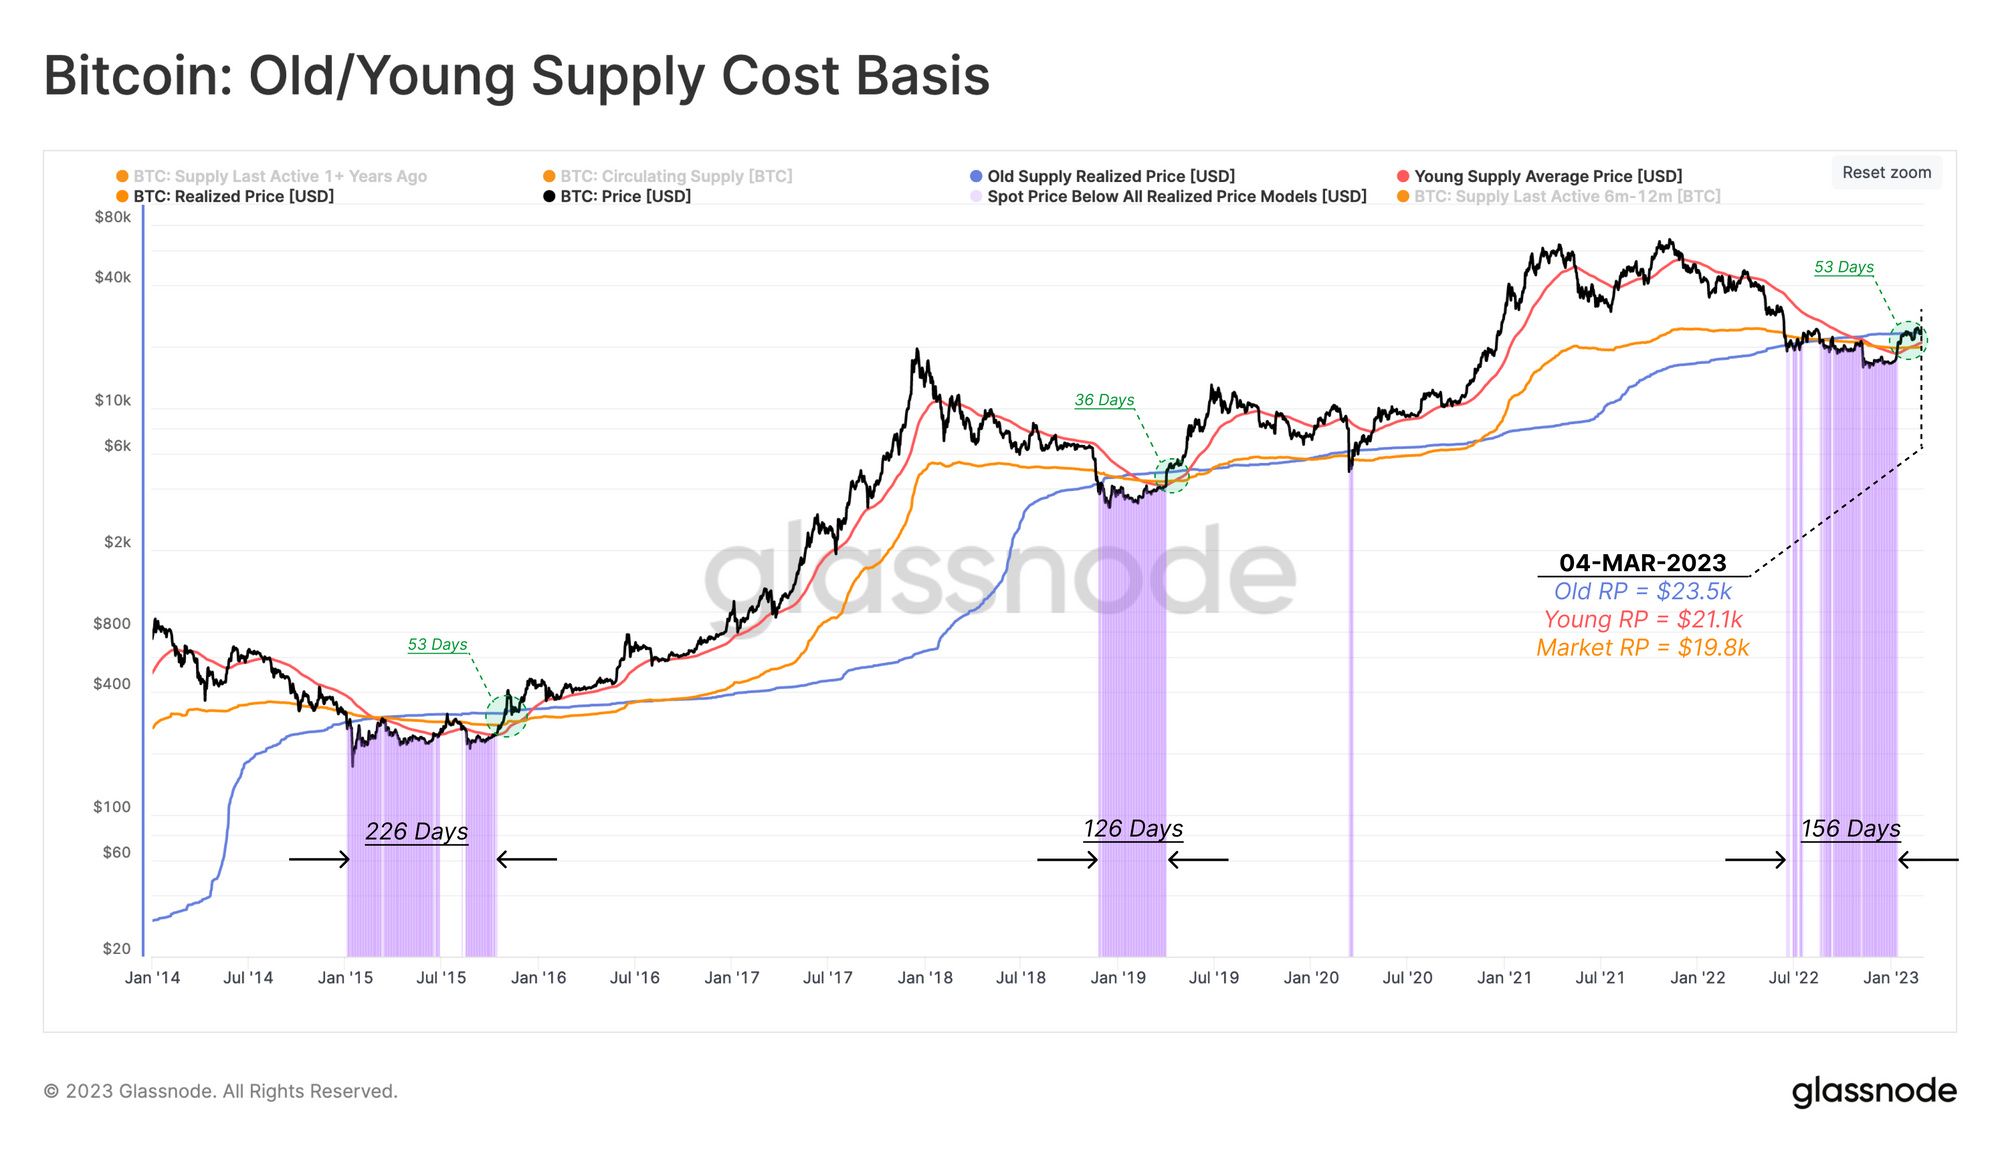
Among various on-chain valuation models, the average acquisition price of various cohorts in the Bitcoin economy provides an estimation of price ranges which are psychologically important. The chart below compares these cost basis estimates (Realized Price) across three cohorts:
- 🔴 Young Supply Realized Price ($21.0k), which is the average price of coins that have changed hands in the last ~6 months.
- 🟠 Market Realized Price ($19.8k), which is the average price of all coin holders.
- 🔵 Old Supply Realized Price ($23.5k), which is the average acquiring cost of coins held for at least ~6 months.
We can see that this week, spot prices were rejected from levels coincident with the Old Supply Realized Price. Many of these older coins are held by 2021-22 cycle buyers, who are underwater in their position.
🔔 Alert Idea: Price breaking above $23.5k would reflect a rally above the Old Supply Realized Price, putting the average holder in all cohorts back into profit.
In addition to the time cohorts, investor behavior can also be assessed based on wallet size cohorts. Among all well-known entities in the Bitcoin ecosystem, Whales (holding over 1k BTC) are always often the centre of speculators’ attention.
The chart below outlines the average acquisition prices for the whale cohort considering only coins flowing in and out of exchanges. The traces start measuring at the following major market bottoms, seeking to provide the most favourable average Whale acquisition price for each cycle era.
- 🟡 Since July 2017 , the launch of Binance
- 🔴 Since December 2018, at the cycle low of the 2018 bear market.
- 🔵 March 2020 at the bottom of the COVID sell-off.
All three Whale sub-groups saw their holdings go into an unrealized loss when the market plunged below ~$18k in early November 2022. Remarkably, the recent recovery stalled at the approximate cost basis of the Dec-2018+ era whales 🔴 ($23.8k), coincident with the Old Supply Realized Price.
🗜️Workbench Tip: The average cost basis can be calculated using the cumulative sum of Exchange Withdrawal Volume [USD] and setting a defined start date cumsum(m1,since?)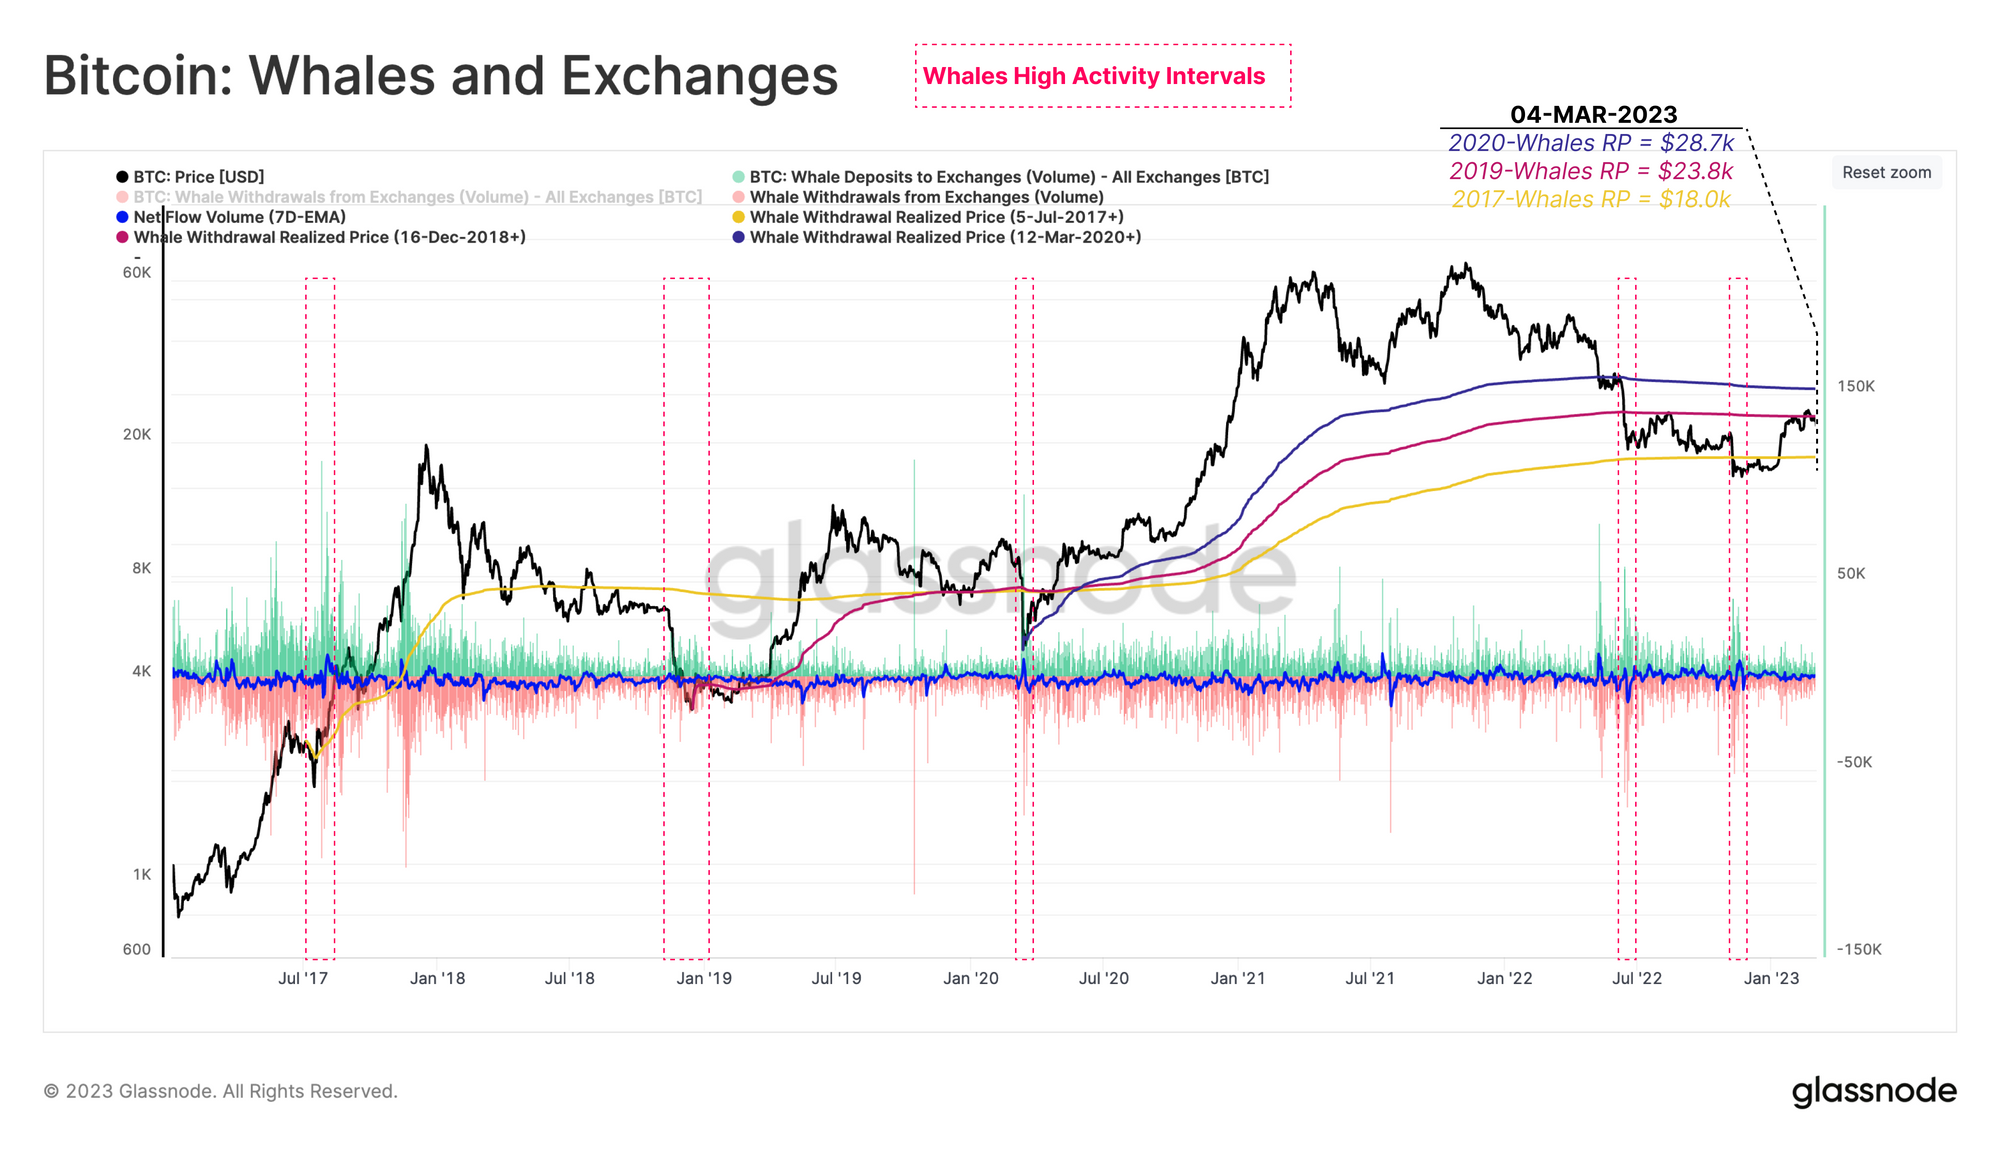
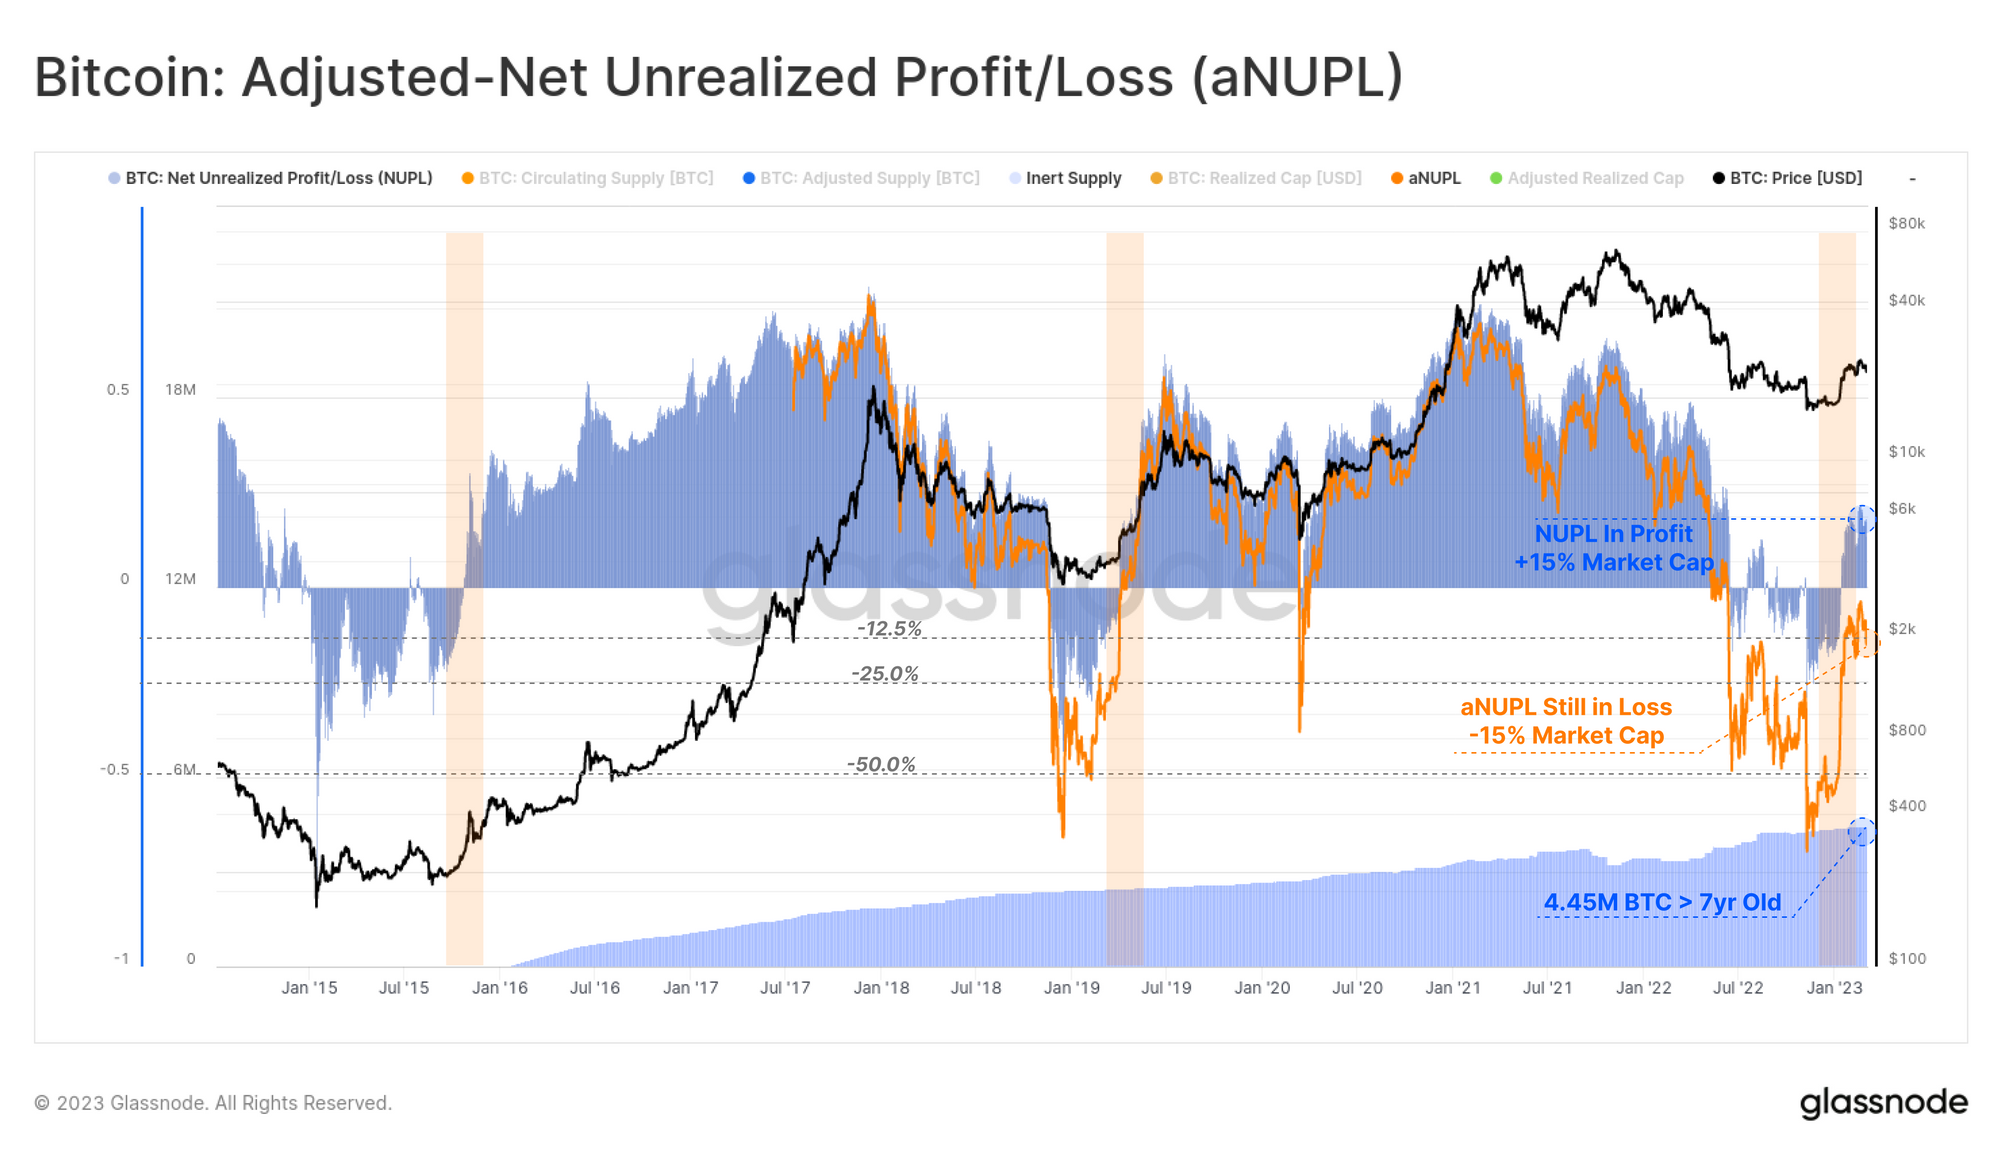
The current state of the market can be reasonably described as resembling a Transitional Phase, typically occurring in the later stages of a bear market. This assertion can be observed in the Net Unrealized Profit/Loss metric (NUPL).
Since mid-January, the weekly average of NUPL has shifted from a state of net unrealized loss to a positive condition. This indicates that the average Bitcoin holder is now holding a net unrealized profit of magnitude of approximately 15% of the market cap. This pattern resembles a market structure equivalent to transition phases in previous bear markets 🟧.
We can also account for lost coins by subtracting the unrealized profit locked in the 7yr+ old portion of the supply, returning an adjusted variation of this metric (aNUPL) 🔵. By this measure, the market is only barely below break-even, and it could be argued is still within a bear market territory.
🪟 Related Dashboard: Our Recovering From a Bitcoin Bear dashboard is designed to track where a sustainable and multi-faceted recovery appears to be underway.
A Nudge in the Right Direction
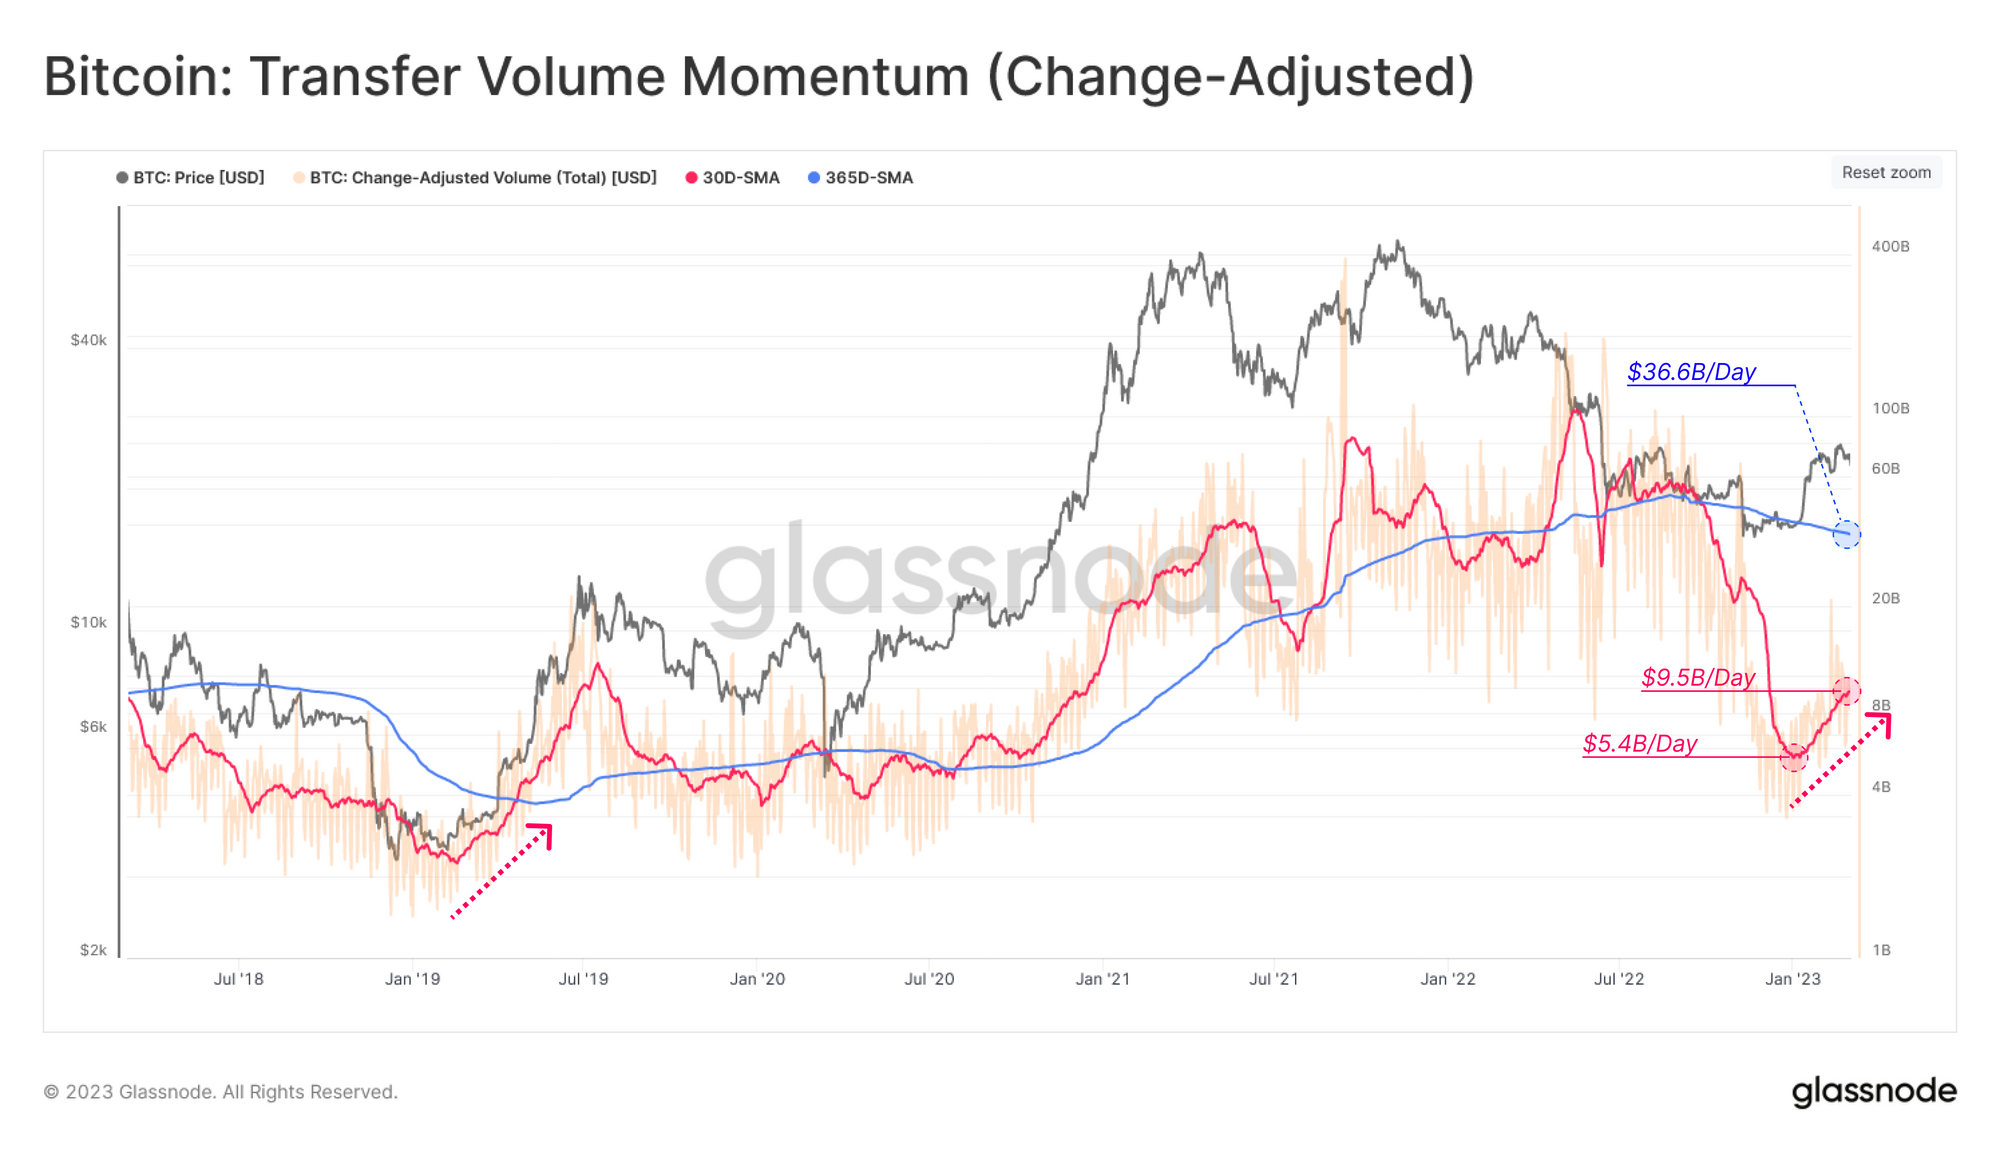
A classic sign of growing adoption within a constructive transition phase is the attraction and inflow of new capital to the market. We can further explore this change in momentum through the lens of Transfer Volume, which tends to fluctuate with the aggregate level of capital in the market.
The metric below compares the monthly average 🔴 transfer volume against the yearly average 🔵 to underline relative shifts in dominant sentiment and help identify when the tides are turning for network activity.
Since early January, the monthly Transfer Volume has increased by 79% to $9.5B per day. However, this remains significantly below the yearly average, although this longer-term average is heavily influenced by an unfortunately large amount of FTX/Alameda-related wash volumes (as noted in WoC 3).
🔔 Alert Idea: Transfer Volume [USD] (30D-SMA) breaking above ~$36B would signal return of strong capital tides.
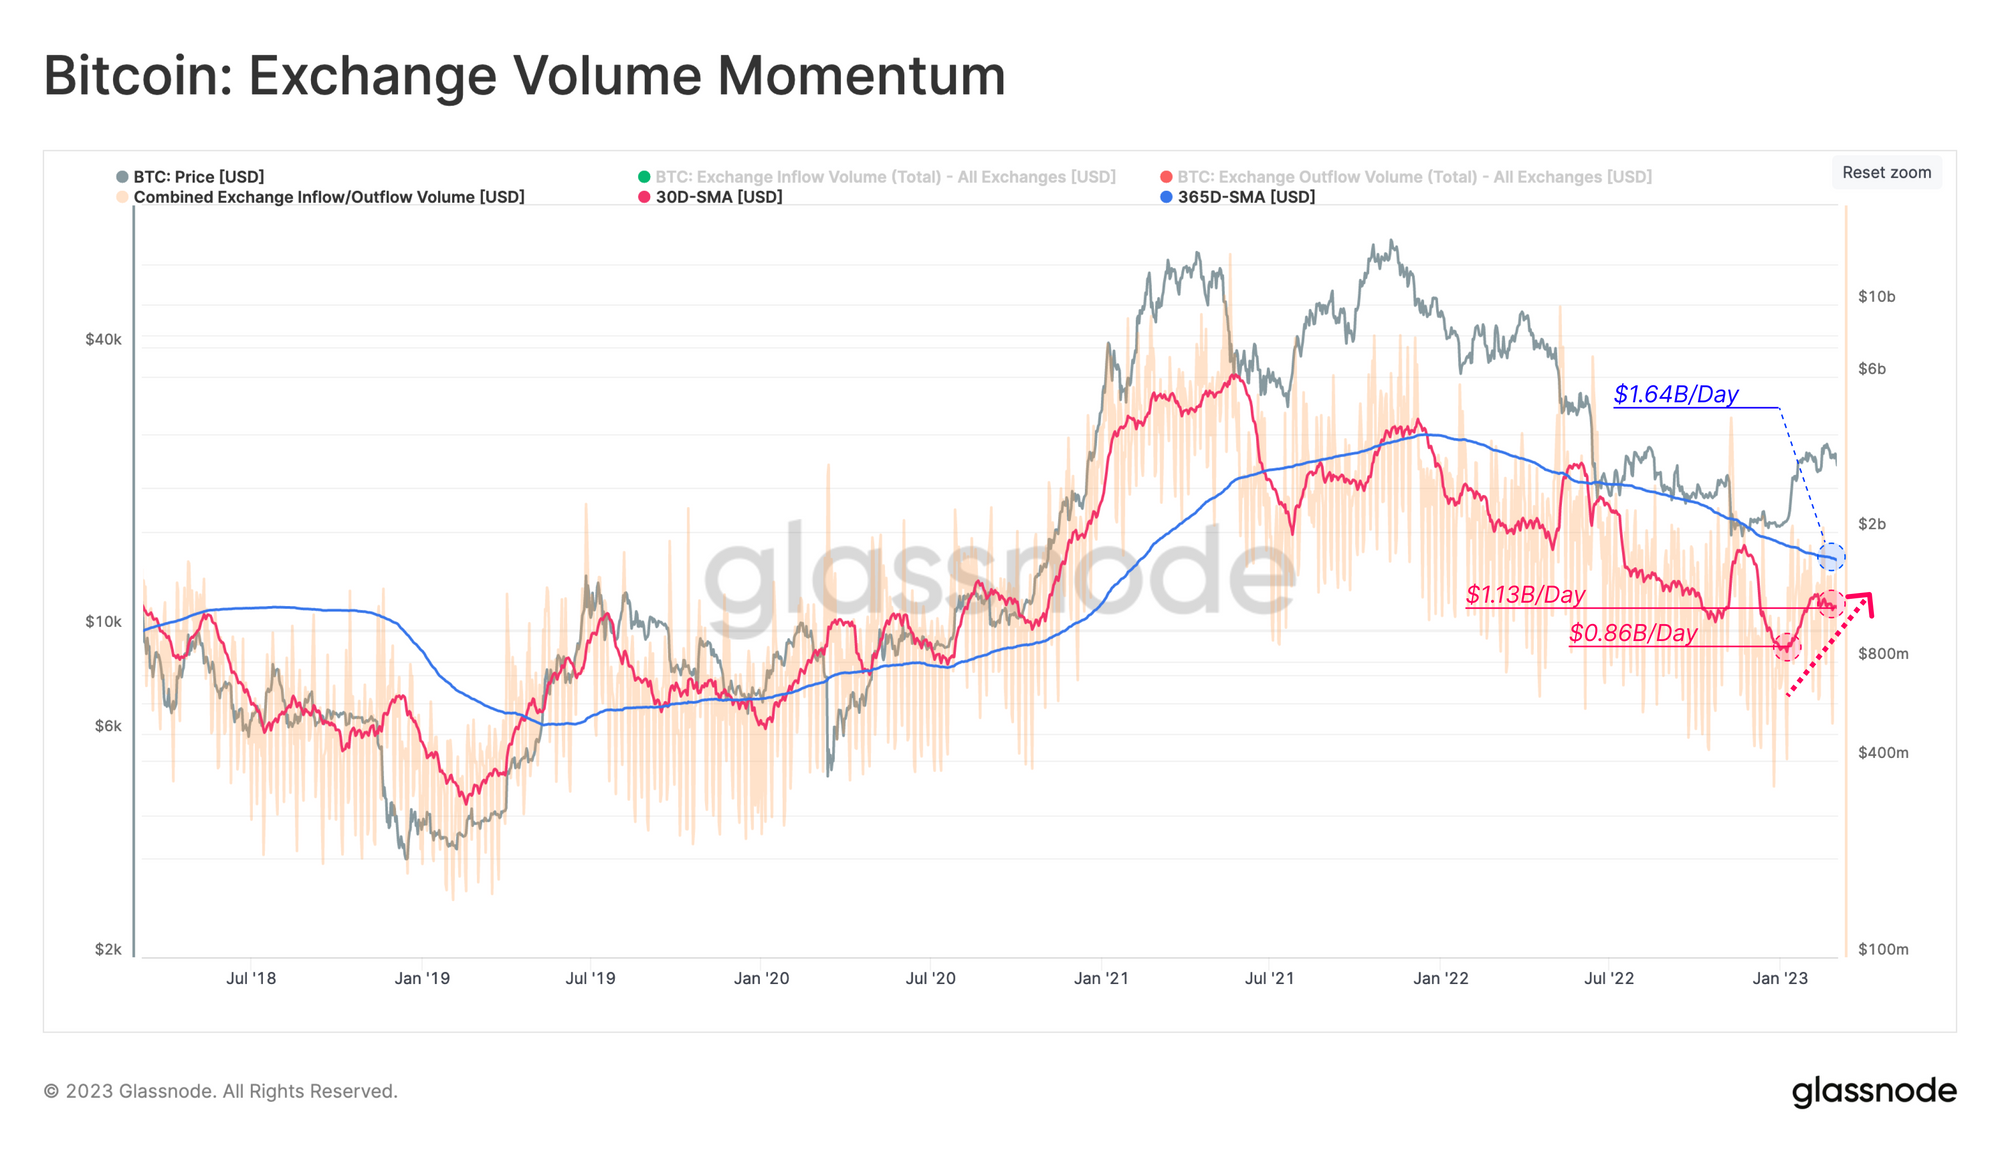
We can supplement this observation with a similar momentum chart related specifically to on-chain exchange volumes, as investors and traders typically become more active as capital enters. By this metric, we can observe a much closer monthly and yearly average, with momentum starting to rise. The monthly average for exchange flows has increased by 34% since early January, however, it remains below the yearly average of $1.64B per day.
🔔Alert Idea: Exchange Inflow or Outflow Volume [USD] (30D-SMA) breaking above $1.6B/day would signal positive momentum in exchange-related flows, back above the yearly baseline.
Taking Profits
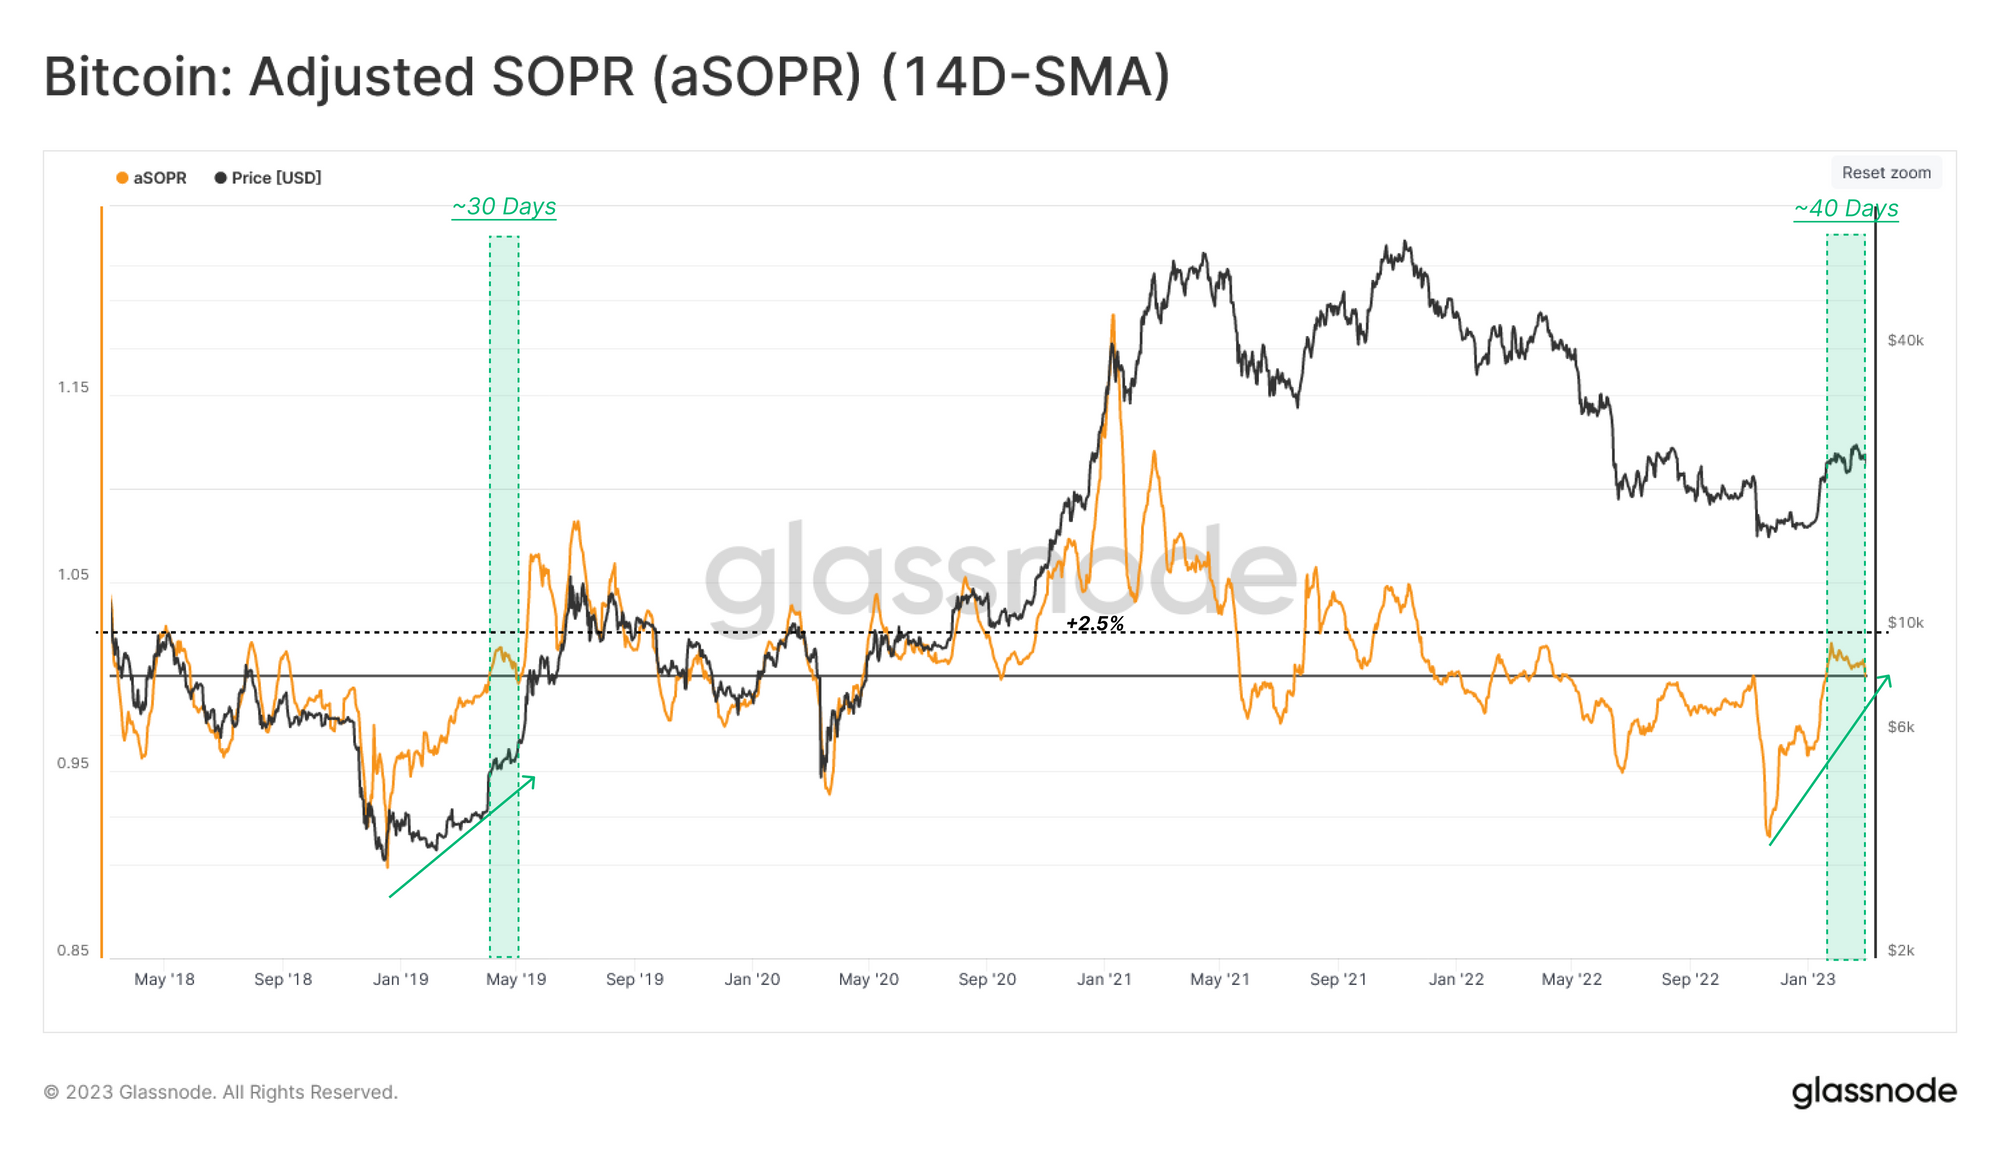
As more coin volumes start to move around the network, we can consult the aSOPR metric to assess the average profit (or loss) realized by transactors. The 14d average of aSOPR is now trading above a value of 1.0 on a sustained basis for 40 days so far 🟩.
This pattern underlines the first sustained burst of profit-taking since March 2022, and reflects a non-trivial return of inflowing capital sufficient to adsorb the profits taken.
The return of aSOPR trading above 1.0 on a sustained basis is a typical characteristic as the market recovered from a period of deep and extended losses.
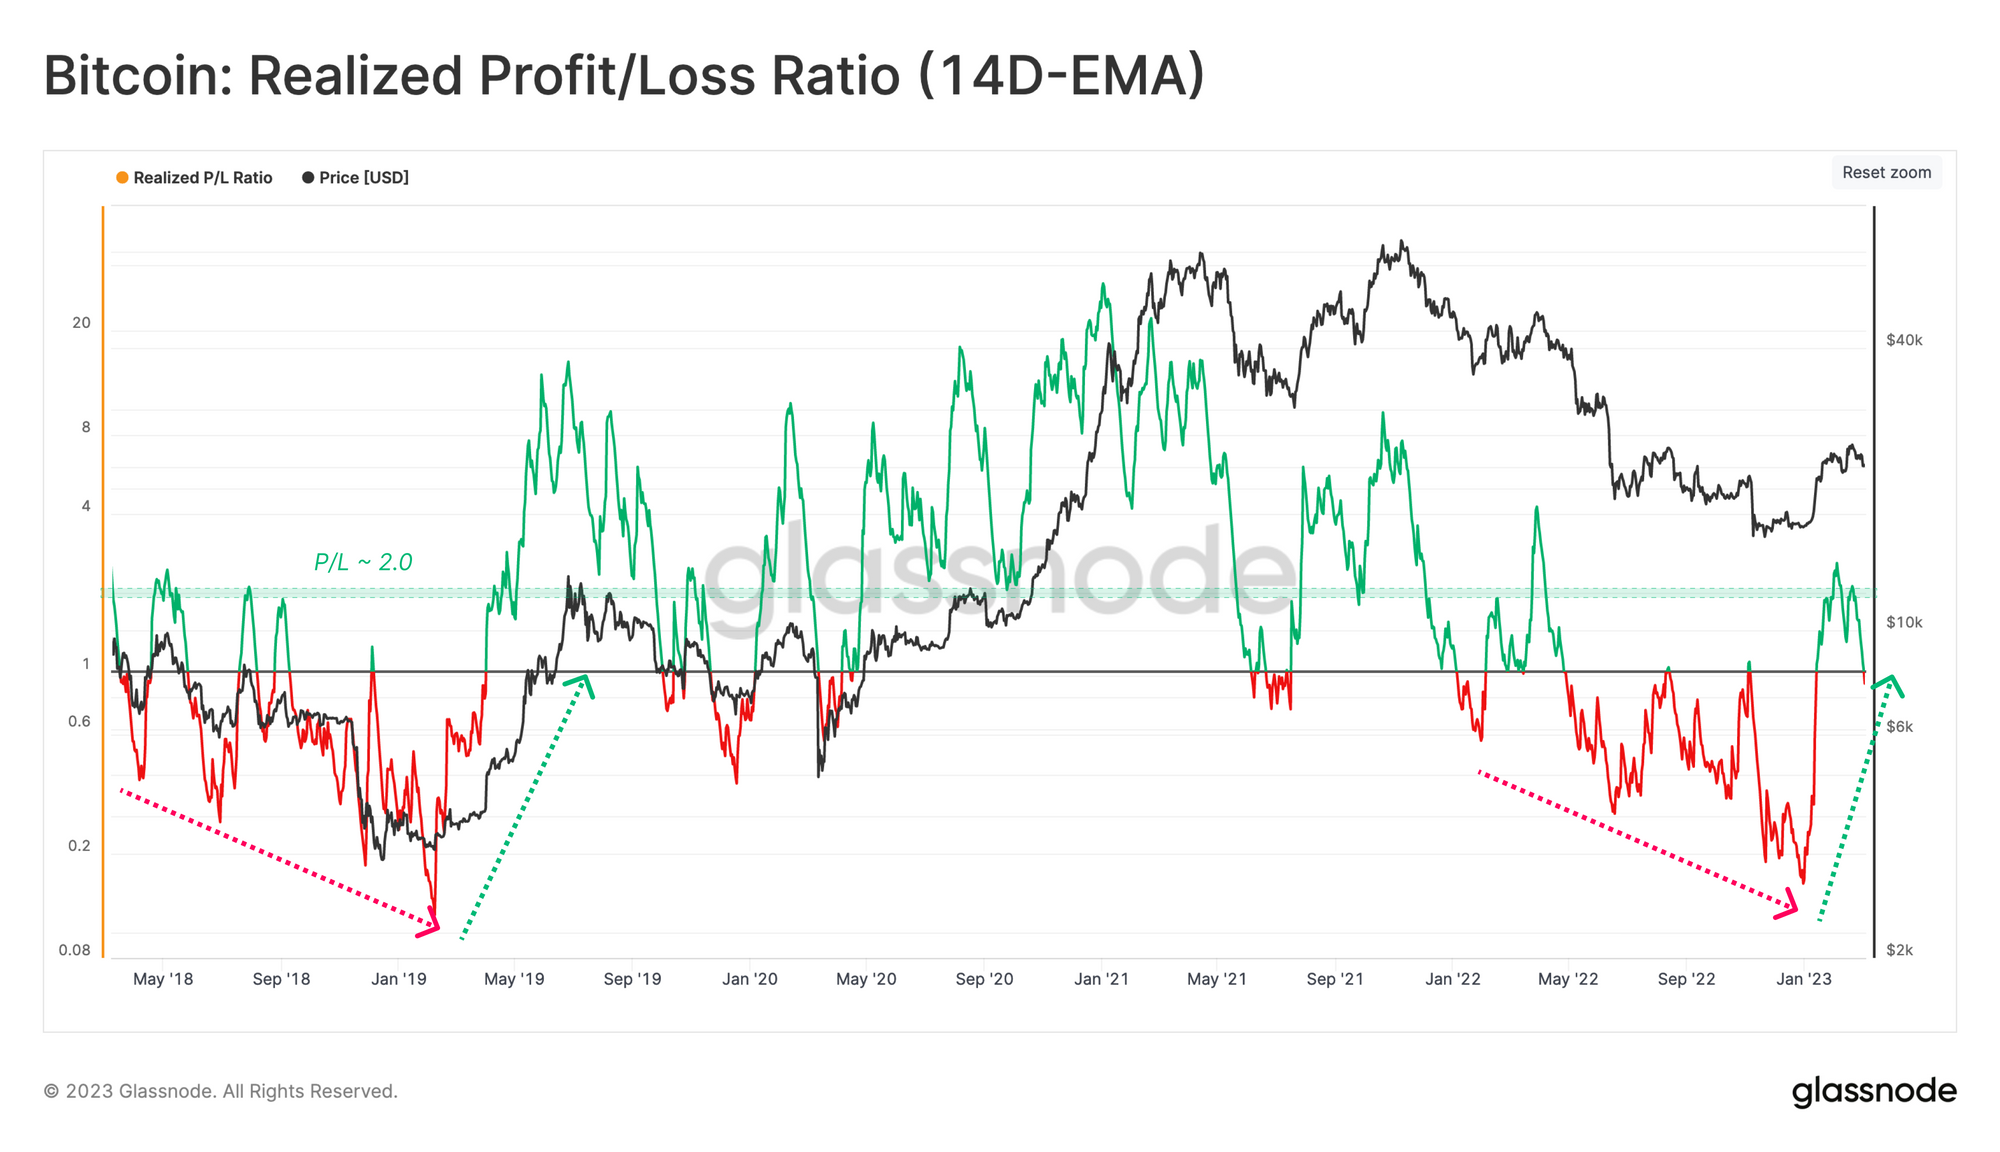
By calculating the ratio between realized profits and losses, we can confirm that profitability has shifted back toward a transition phase. A profit-dominated regime began in mid-January, driving the Realized P/L Ratio above 1.
Interestingly, there is an observable upper threshold for Realized P/L Ratio at around 2.0, which tends to act as a resistance level in bear markets, as profit-taking overwhelms weak demand. Crossing this threshold may provide a more robust indicator for growing capital inflows.
🔔 Alert Idea: Realized P/L Ratio (14D-EMA) crossing above 2.0 may indicates a sustained inflow of new capital is absorbing profit taking. Conversely, falling back below the 1.0 indicates that realized losses are dominant again, potentially indicating weakening sentiment.
Dissecting Selling Side
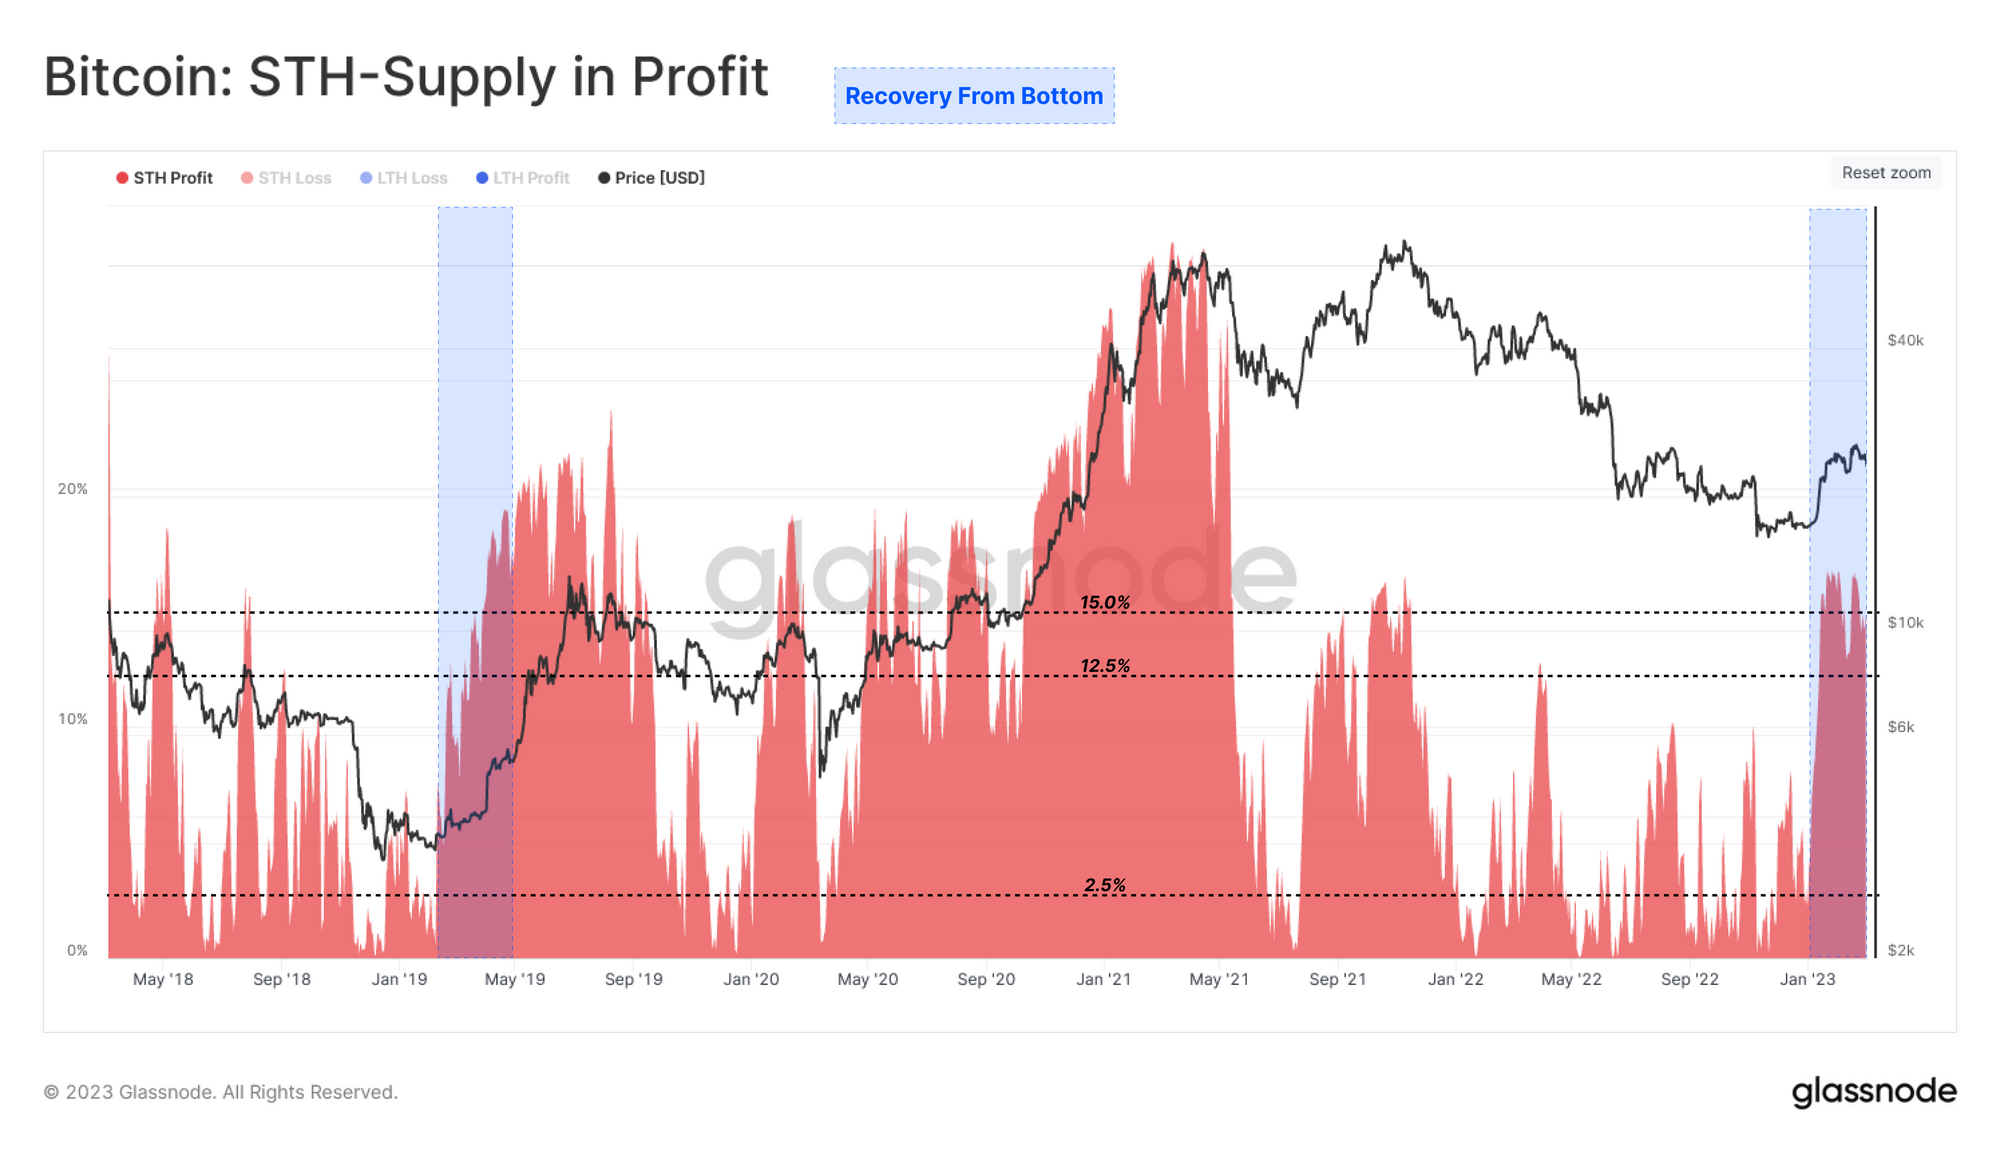
Zooming in on the recent market rally, we can see that the share of supply held by new investors, which is now in profit, surged from around 2.5% (bear market baseline) to more than 15%. This pattern is reminiscent of the previous recovery from the 2018-19 bear low 🟦, and provides a view into the volume of coins which changed hands in recent months.
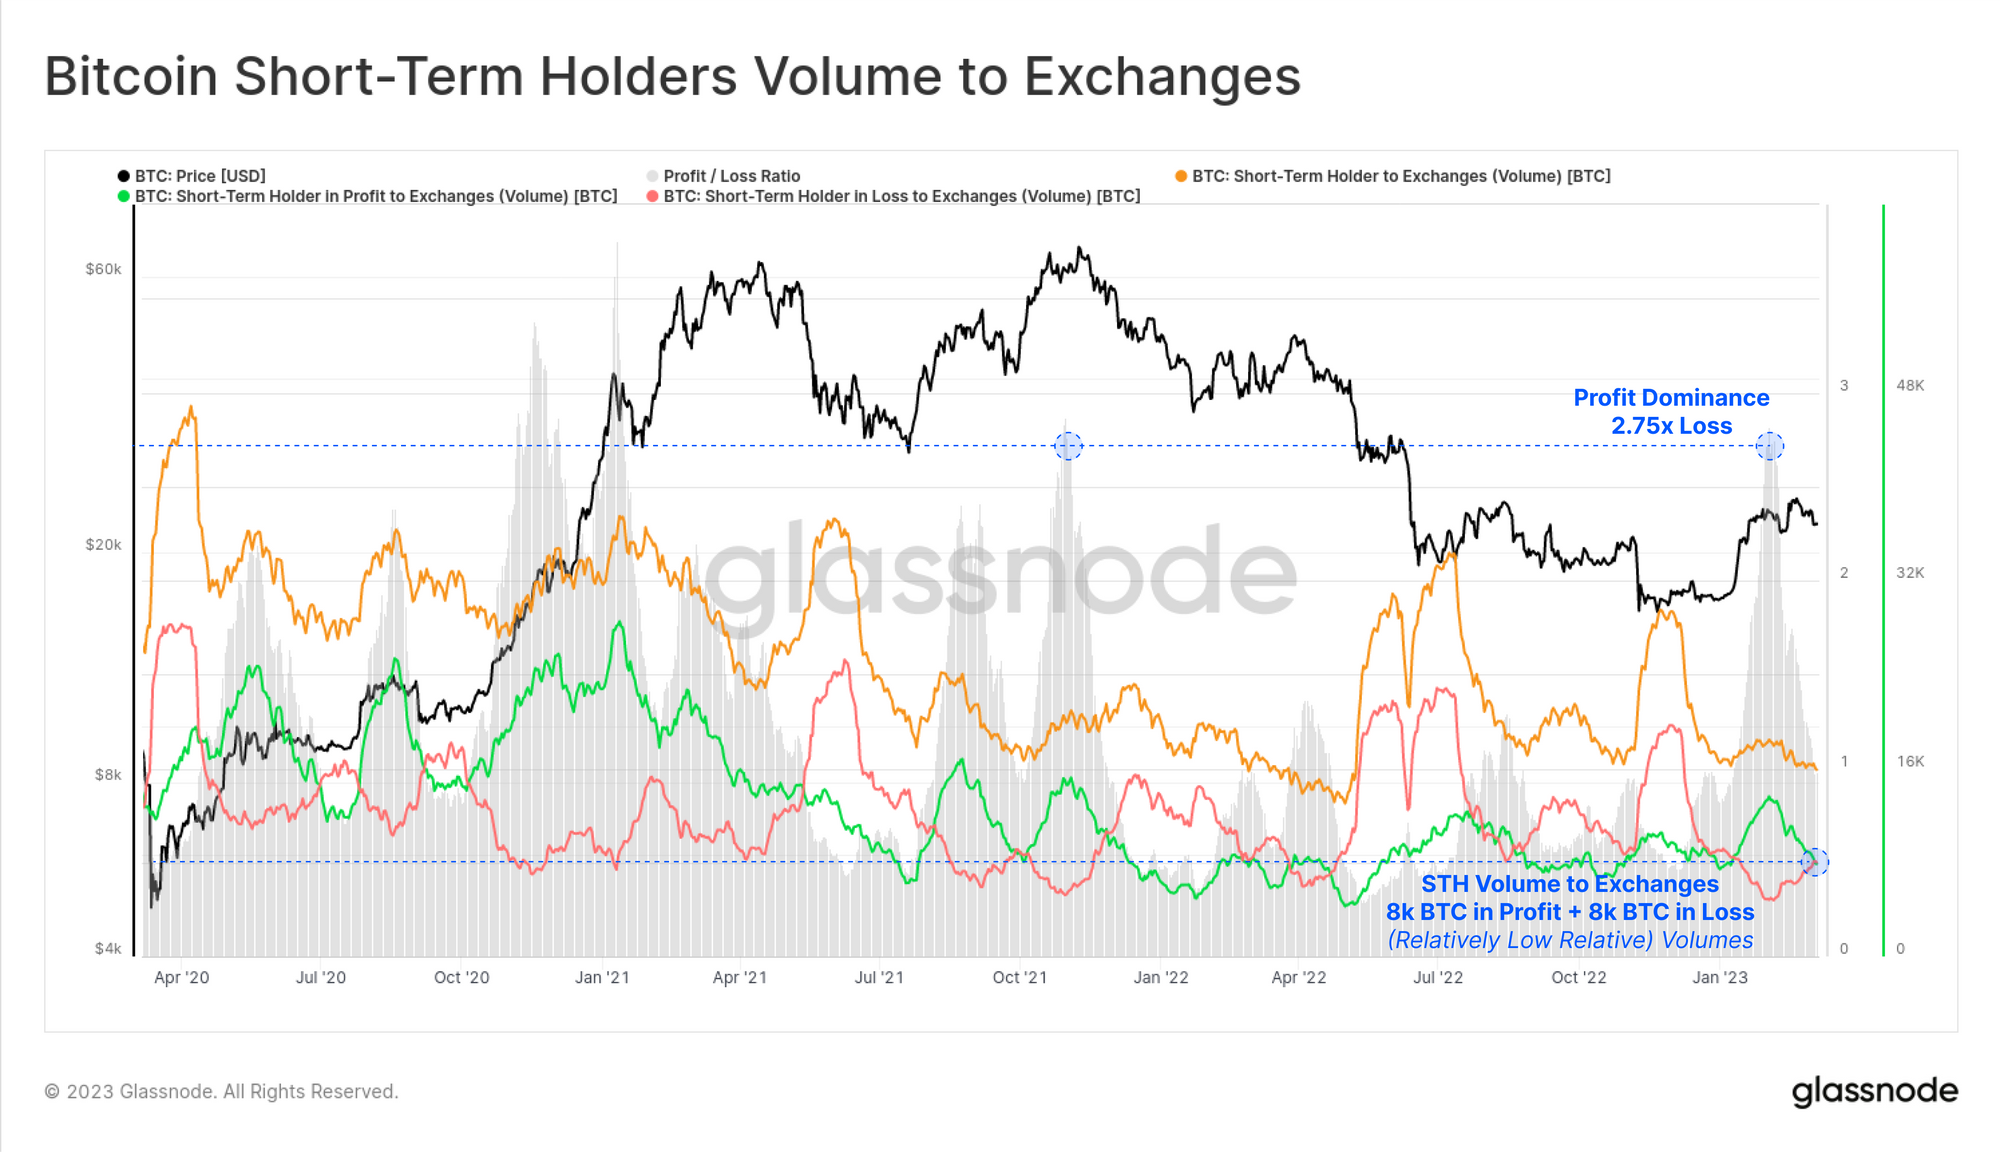
We can also gauge the influence of these new investors by observing the volume sent to exchanges which was either in profit or in the loss. Here we can see the following:
1- The ratio of Short-Term volume in profit vs loss sent to exchanges peaked at 2.75x in early Feb, equivalent to the October 2022 ATH.
2- The total volume of STH coins sent to exchanges today is around 16k BTC per day and split approximately 50:50 in Profit: Loss.
Relatively speaking, this remains a relatively low total coin volume sent to exchanges compared to the 2020-23 cycle.
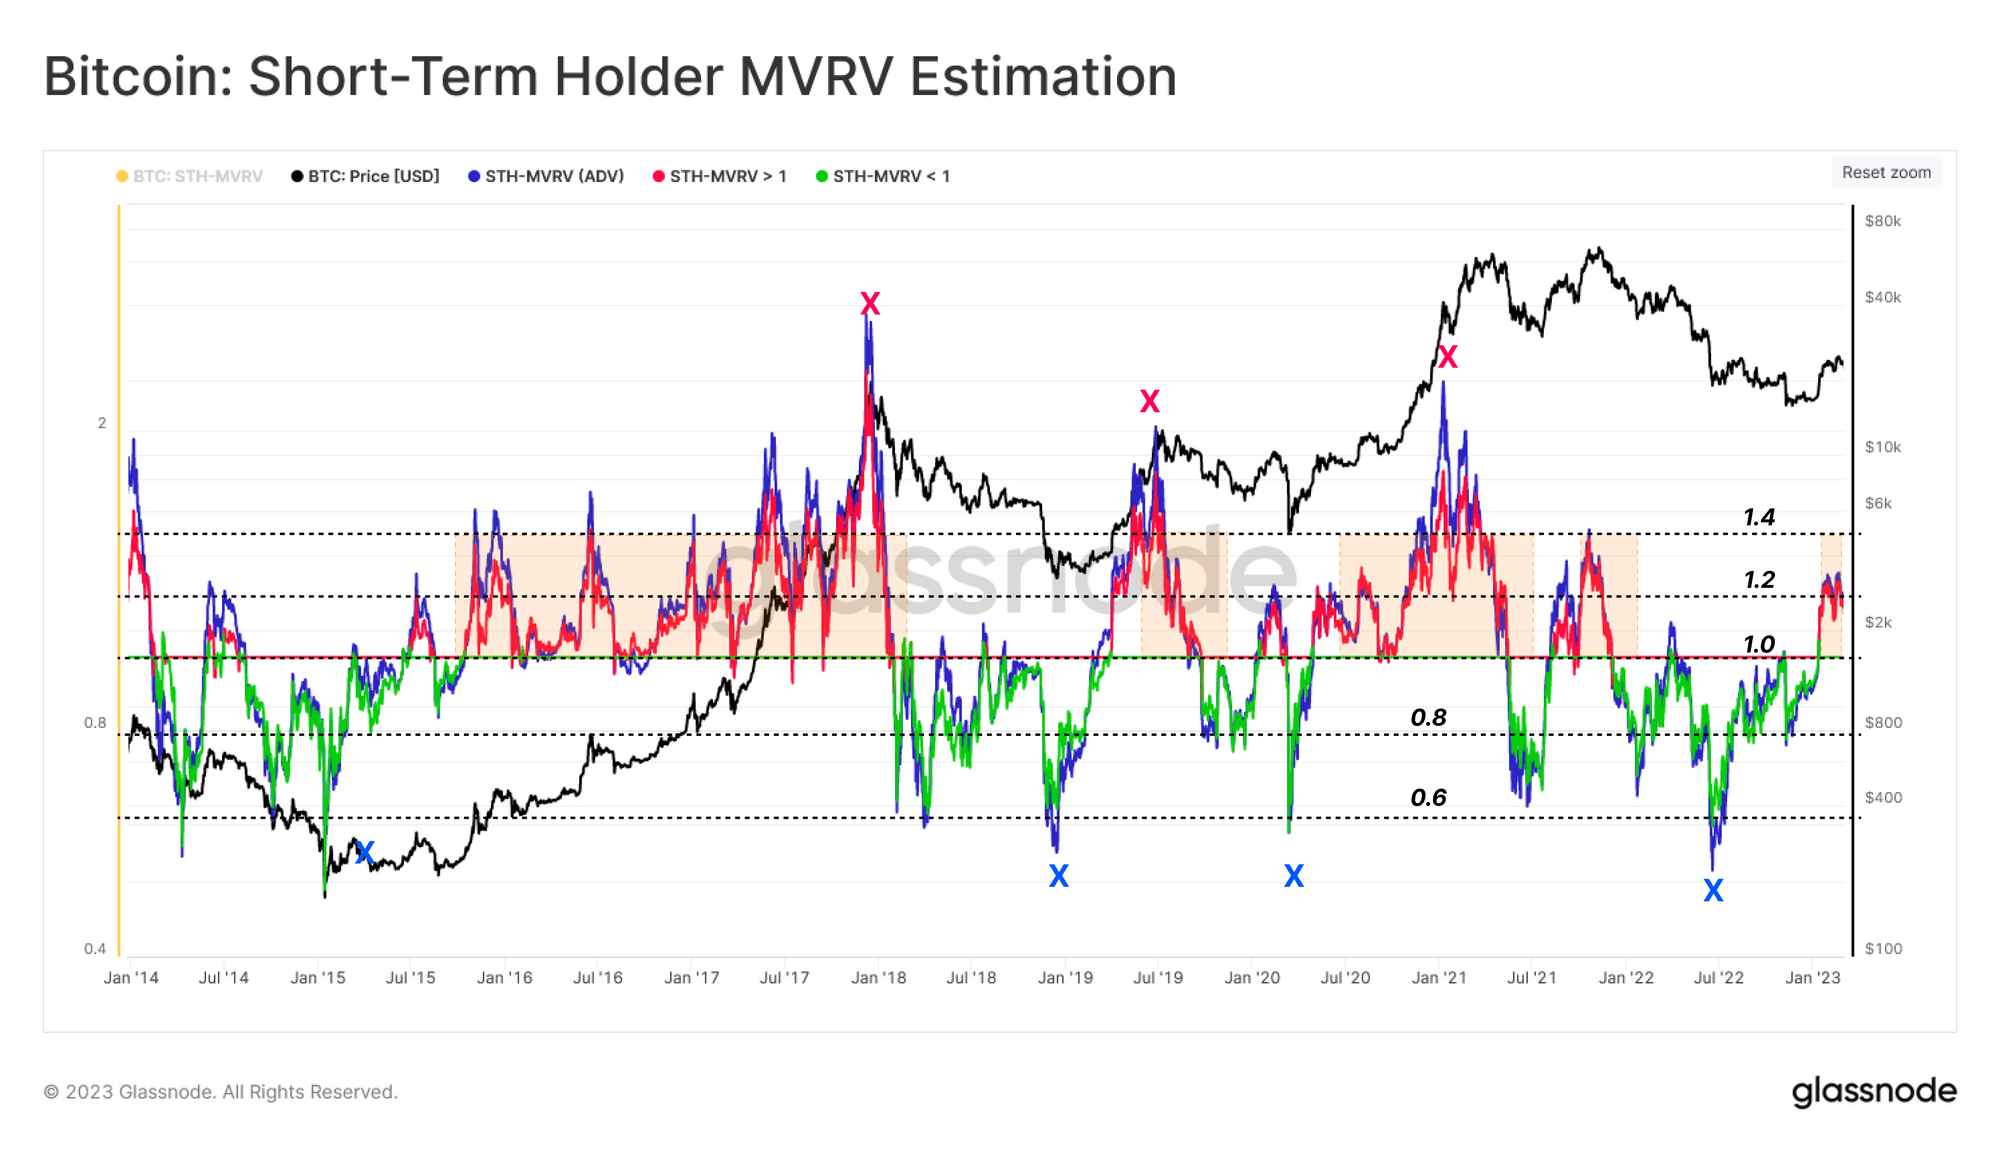
Finally, we can assess the Short-Term Holder MVRV to estimate the relative unrealized profit held by STHs. As discussed in WoC 07, the possibility of STHs taking profits tends to grow during periods where the average STH is 20%+ in money, returning a STH-MVRV above 1.2.
The recent rejection at the $23.8k level resonates with this structure, as the STH-MVRV hit a value of 1.2 before stalling. Should the market return to $19.3k, it would bring STH-MVRV back to the value of 1.0, and indicate that spot prices have returned to the cost basis of this cohort of new buyers.
🔔 Alert Idea: STH-MVRV (7D-SMA) reaching a value of 1.0 would signal price has returned to the average Short-Term Holder cost basis and break even level.
Conclusion
The Bitcoin economy often reacts not only to levels widely observed in traditional technical analysis but also the psychological cost basis levels of various investor cohorts printed on-chain. This takes place not only with respect to their realized price but also regarding the degree of profit and loss held within their supply.
From this lens, the market currently resides in a transitional phase, bounded above by the Realized Price of Older Supply and also by the average Whale that has been active since the 2018 cycle bottom. We have seen an initial wave of capital inflow into the space, observable through profit-taking. However, this capital wave is still infant in scale and remains historically light in total coin volume on the move.
Disclaimer: This report does not provide any investment advice. All data is provided for information and educational purposes only. No investment decision shall be based on the information provided here and you are solely responsible for your own investment decisions.