The Coin Maturity Gauntlet

During the recent capitulation event, Bitcoin migrated from weaker hands, to those stepping in at the lows. In this edition, we explore how we can assess the migration of conviction by use of coin age bands.

The Coin Maturity Gauntlet

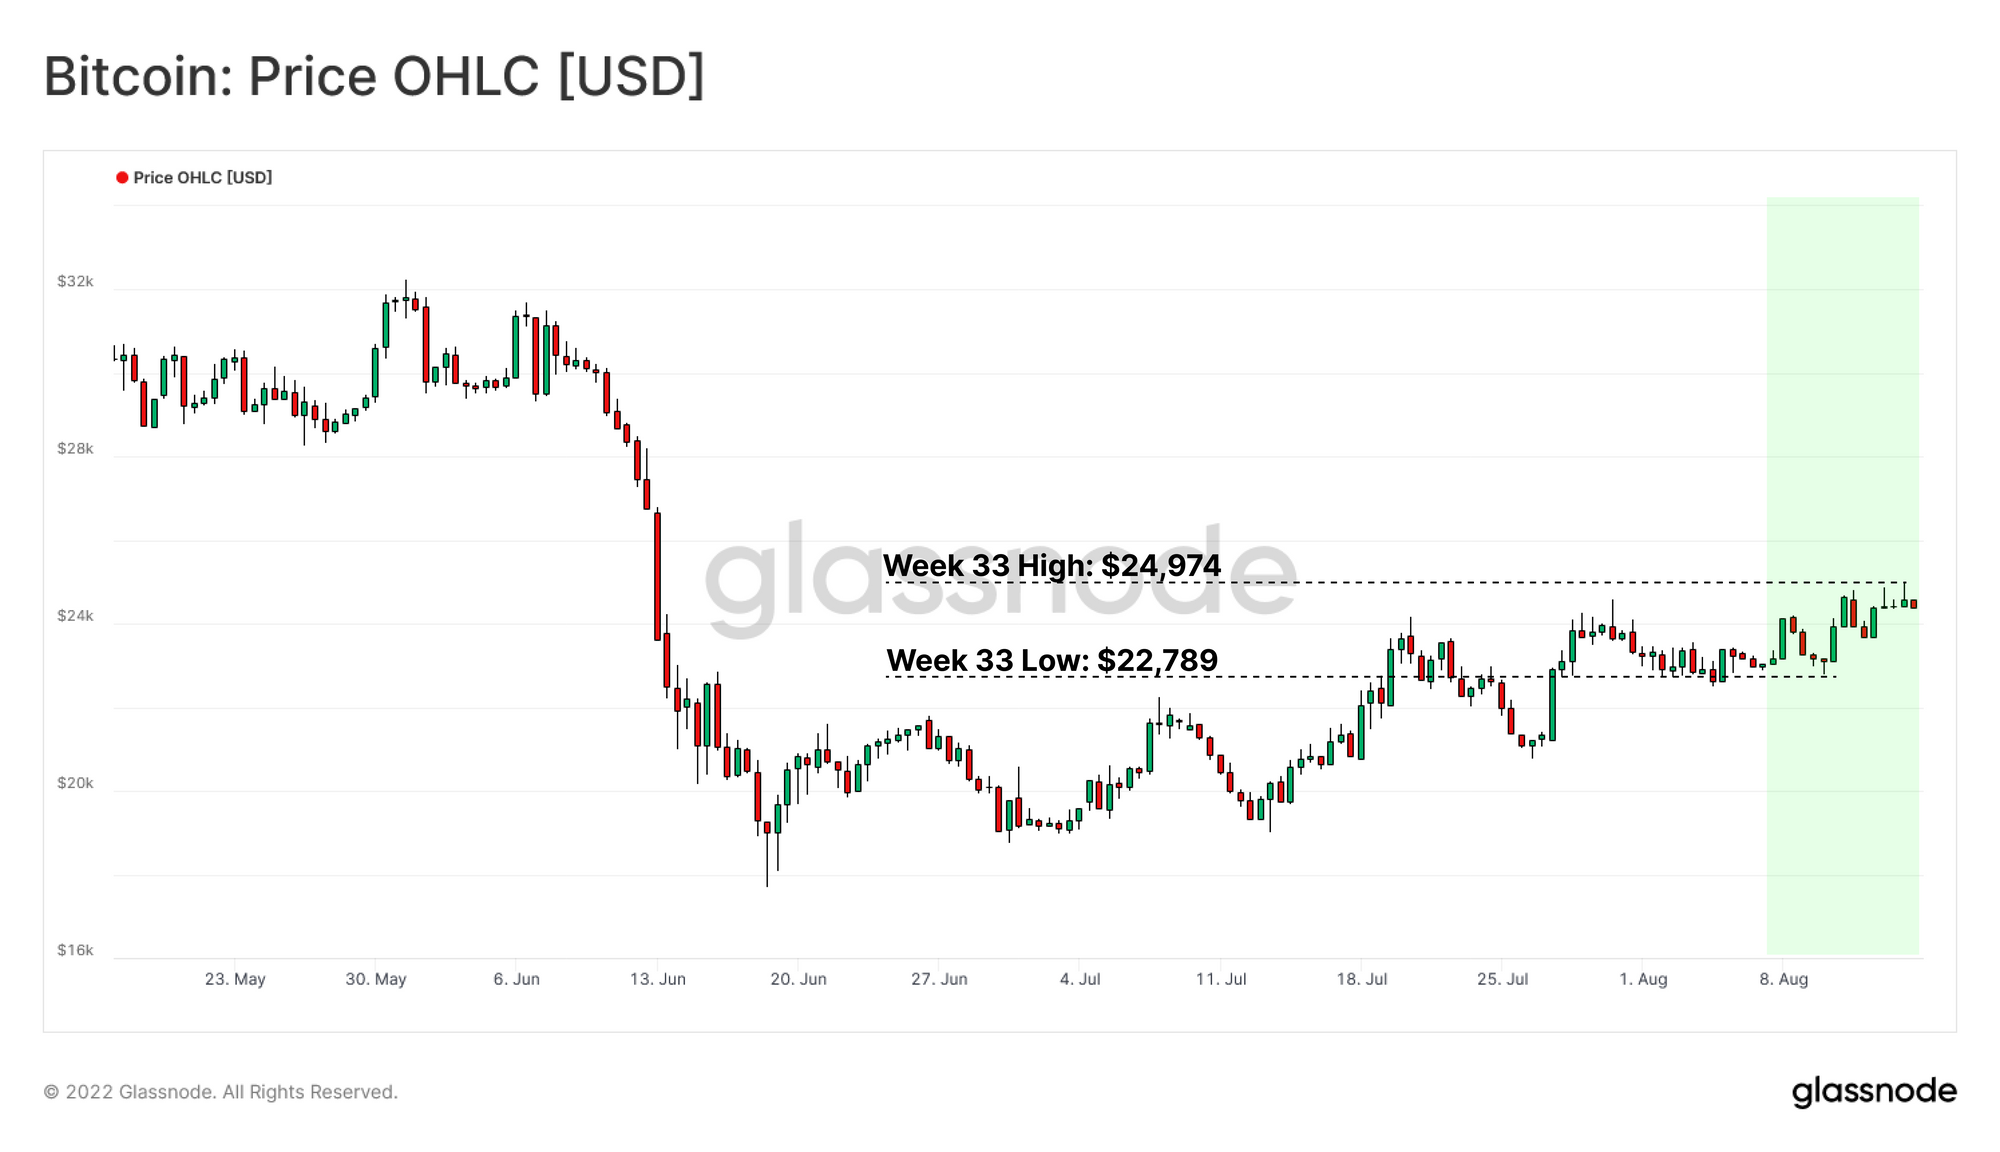
The Bitcoin Market continues its recent rally higher in conjunction with other risk assets in light of a deceleration of inflation prints. Bitcoin prices continue to consolidate within a range, but traded up from the lows of $22,789 to a high of $24,974.

In this weeks edition, we shall explore the Maturity Gauntlet. This is the maturation process of of BTC holdings in investor wallets. Generally, longer hold times signify improving odds of a higher conviction, and cost insensitive owner. After such a deep capitulation, we are seeking to characterize out who sold, and who stepped in at the lows.

We shall explore this concept by via the concept of Lifespan (coin age) and Supply Dynamics for both young and old coins across BTC, and USD denominated wealth bands. We will also dive into a study of  spending behaviors of Long Term and Short Term Holders to assess coin ownership as the dust begins to settle.


Translations

This Week On-chain is now being translated into Spanish, Italian, Chinese, Japanese, Turkish, French, Portuguese, Farsi, Polish, Russian, Arabic and Greek.

The Week Onchain Dashboard

The Week Onchain Newsletter has a live dashboard with all featured charts available here. This dashboard and all covered metrics are explored further in our Video Report, which is released on Tuesdays each week. Visit and subscribe to our Youtube Channel, and visit our Video Portal for more video content and metric tutorials.


Expansion in Maturity

The amount of supply that has been dormant for at least 1yr can be used to provide insight into the cyclical nature of Bitcoin through distribution and accumulation cycles.

  • Distribution Cycles are a characteristic of a Bull Market, as the incentive to realize value increases for participants with mature coins. This leads to a reduction of 1yr+ old supply as coins are spent and sold.
  • Accumulation Cycles are a characteristic of Bear Markets, as the magnitude of potential profit wanes alongside a collapse in price. HODLing gradually becomes the primary dynamic. This leads to an increase of supply older than 1yr.

Currently, Supply Active 1+ Years sits just below the previous ATH set in May 2022 at 65%. This highlights the significant conviction of May-July 2021 buyers after the great miner migration. The equilibrium over the last three months indicates that coin maturation is in balance with spending. This is can be considered a constructive mechanic within a bear market.

🔔Alert Idea: Percent of Supply Last Active 1+ Years Ago breaking above 65.72% would signal a new ATH in supply dormant for a year, this suggest increased probability of a topping formation.
Live Advanced Chart

This phenomena can be further inspected by isolating coins from the HODL Waves age bands of 6 Months to 3 Years. HODL waves provides insight into the volume of BTC held for at least a minimum duration, which provides a proxy for analyzing buyers from the 2020-22 cycle, many of whom are likely experiencing their first bear market cycle.

The 6m-12m band can be seen to expand post the Great Miner Migration as HODLers refused to sell at the lows, this supply swell coincides with a bottoming in supply active 1yr+ ago. Within a HODLer dominant regime, supply was able to mature leading to a swelling of the 1y-2y age band following the Nov 2021 ATH.

Live Advanced Chart

The Realized Cap HODL Waves can then be used to assess the USD wealth held in these same age bands. Here we can see an even more intriguing result, where overall USD value held in these cohorts has surged by 52%, now accounting for 63% of the Realized Cap.

  • The price insensitivity of the Smart Money cohort can be highlighted by this continued increase, which suggests minimal spending, and investors allowing held BTC to mature regardless of price appreciation (Nov 2021), and subsequent capitulation (May 2022 - Current).
  • Smart Money can be seen to be in a structural uptrend expanding its USD wealth by 51% equivalent to a $220B increase culminating in a total balance of $267B.
  • Therefore, 37% of the Circulating Supply (7M BTC) represents 63% of the network USD wealth (based on value at the time of acquisition) underscoring the relative economic weight of the cohort.
Live Advanced Chart

Bitcoin cycles are driven by an ever-evolving supply balance between longer-term investors, and newer speculative buyers. The RHODL Ratio distils this concept into an oscillator by comparing the USD wealth of 1 week old coins, to those held by the 1y-2y old cohort.

This can be considered under the following framework:

  • An uptrend in the RHODL Ratio suggests dominance of USD wealth held by new, speculative buyers, which is typical of peak speculation and Bitcoin market tops.
  • A downtrend in the RHODL Ratio indicates dominance of USD wealth held by older coins, suggesting increased HODLing and long-term accumulation behavior.
  • A flat, range bound RHODL Ratio indicates that the rate of change between old and young dominance is at an equilibrium. This a transition period. is often observed around market transition periods such as distributive markets tops and accumulation bottoms.

Currently, we are seeing the RHODL Ratio trade within a strong downtrend, confirming that the balance of USD wealth continues to shift back towards longer-term patient holders.

Live Advanced Chart

The Long-Term Holder Supply can then be employed to provide an assessment of the behavior of holders whom have a statistically higher conviction in the asset. Note that the 155-day threshold for LTH status 🔵 brings us to the March 2022 region, where price experienced the first post-ATH relief rally towards $46K.

By observing the total supply held by the Long-Term Holder cohort, we can make two observations:

  • LTH Supply has been range bound between 13.56M to 13.27M BTC since the November 2021 ATH, declining by just 300K BTC.
  • Since the Luna Sell off in May 2022, LTHs have seen a sustained decline in supply amounting to -150K BTC.

Recent spending behavior by Long Term Holder is currently larger in coin volume than the HODLing from the pre-LUNA consolidation zone. This results in a modest, but observable decline in held supply.

Note that LTH supply does not need to aggressively decline for the cohort to be experiencing a capitulation event under the surface. Historically, LTH supply tends to trade only slightly lower during such events as the weakest of the cohort are flushed out, and generally balanced by more resilient accumulation that takes time to mature.

Live Professional Chart

Compression and Contraction

When considering the Circulating Supply for Bitcoin, we can inspect it from three components: the Long-Term, Short-Term, and Exchange held supply.

Beginning with Exchange Balances, Exchanges continue to experiences a macro decline in supply held, with this trend developing since the March 2020 capitulation event. Year to date, exchange outflows have continued with generally increasing intensity as prices declined. This underscores a persistent structural demand, from both small and large investors, for sovereign self custodial assets.

On balance, Exchanges have seen a net outflow of -100K BTC following the May 2022 LUNA capitulation, which accounts for 3.2% of the total outflows since the March 2020 ATH.

Live Advanced Chart

Next, we can assess the other two components held outside exchanges, the Long Term and Short Term Holder supply.

As discussed, LTH supply has seen a slight decline of -200K BTC since recording an ATH in May 2022 but remains effectively range bound over the last 12-months. This highlights a relatively balanced inflow/outflow dynamic for this cohort.

On the contrary, STH supply continues to expand following a capitulation in price leading to a supply increase of+330k BTC.

Since the May collapse of LUNA, there has been a net transfer of -300k BTC from the combined LTHs, and exchanges, towards STHs. Given the accompanying price declines, this broadly describes a capitulation style event, as the swelling STH supply describes accumulation by buyers who stepped in during the flush out, and now own coins with a much lower cost basis.

Live Workbench

A Constructive Divergence

By definition, these coins were transferred into the Short-Term Holder cohort. Since the March 08 2020 LUNA collapse, STH supply increased by +330k BTC.

Extreme STH accumulation is normally concurrent with bull market topping formations (marked in 🔵), however, a few bear market examples stand out against this trend (marked in 🔴):

  • The twin spikes of 300K+ inflows, which punctuated the start, and end of the 2015 bear market bottom.
  • The April to July 2019 relief rally out of the bear market lows.
  • The March 2020 capitulation event.
  • The June 2022 sell-off below the last cycle $20k peak, with a spike of 300K+ BTC.

STHs are normally adept at buying tops and selling bottoms, however, the distinct footprint of the above described events can be considered an exception to the trend. Both inflow events were in response to extreme drawdowns in price actions as well as severe STH outflows following bull market culminations.

Such events describe a transfer of coins to new buyers whom are initially classed as STHs, but have a low cost basis, but are in an advantageous financial position to HODL from there on.

Live Workbench

Having established a case that this spike in STH cohort coins likely describe bear market floor buyers, we can also see this captured in the BTC denominated supply balance for Young Coins (< 3-months). We can see supply peaks in 2015 (x3), Nov 2018, March 2020, and during our most recent sell off.

Simultaneously, these supply peaks tend to occur at the macro lows of young supply. This signals both a final flush out of sellers, followed by months of gradual accumulation, and the withdrawal of coins from the actively traded market.

Live Advanced Chart

The USD denominated wealth of the Young Coin cohort has been in structural decline following the March 2021 topping formation. This is a result of both the accumulation behavior (allowing coins to mature), but also the revaluation of coins to cheaper and cheaper prices during the bear.

A growing divergence can be identified between the aforementioned cohorts USD wealth (Realized Cap HODL Waves) and their respective BTC denominated supply (HODL Waves).

The spike in BTC denominated value is not reflected in the USD denominated chart. This is because whilst 300k BTC in coin volume was transferred, their USD realized value has declined from say $50k-$60k, to $20k, which is notably lower.

This bolsters the case that we may very well have seen a meaningful capitulation take place in recent months. However, the onus is now on these new Short Term Holder bulls to hold the line.

Live Advanced Chart

Summary and Conclusions:

In this newsletter, we assessed the relative distribution of supply and wealth for both Young and Old coins, to further understand the Bitcoin ownership structure. We established that the supply has undergone a significant transfer of wealth in recent months, with an observable and widespread capitulation, and thus equal and opposite accumulation.

Long Term Holder Supply has seen a local, modest decline as spending behavior dominates following the LUNA collapse. However, LTH supply remains relatively range bound, which indicates more contained spending by a sub-set, rather than broad loss of confidence.

In contrast, Short Term Holders are seeing a divergence between BTC and USD denominated wealth. This is indicative of a pool of buyers who stepped in at the lows, and now hold some 300k BTC, acquired at a much lower cost basis. Now we turn to see if they have the conviction to hold on.


Product Updates

All product updates, improvements and manual updates to metrics and data are recorded in our changelog for your reference.

Disclaimer: This report does not provide any investment advice. All data is provided for information purposes only. No investment decision shall be based on the information provided here and you are solely responsible for your own investment decisions.