The Week Onchain (Week 48, 2021)

The market continues to drawdown this week, despite Short- and Long-Term investors holding more profitable supply than the recent correction in September.

The Week Onchain (Week 48, 2021)

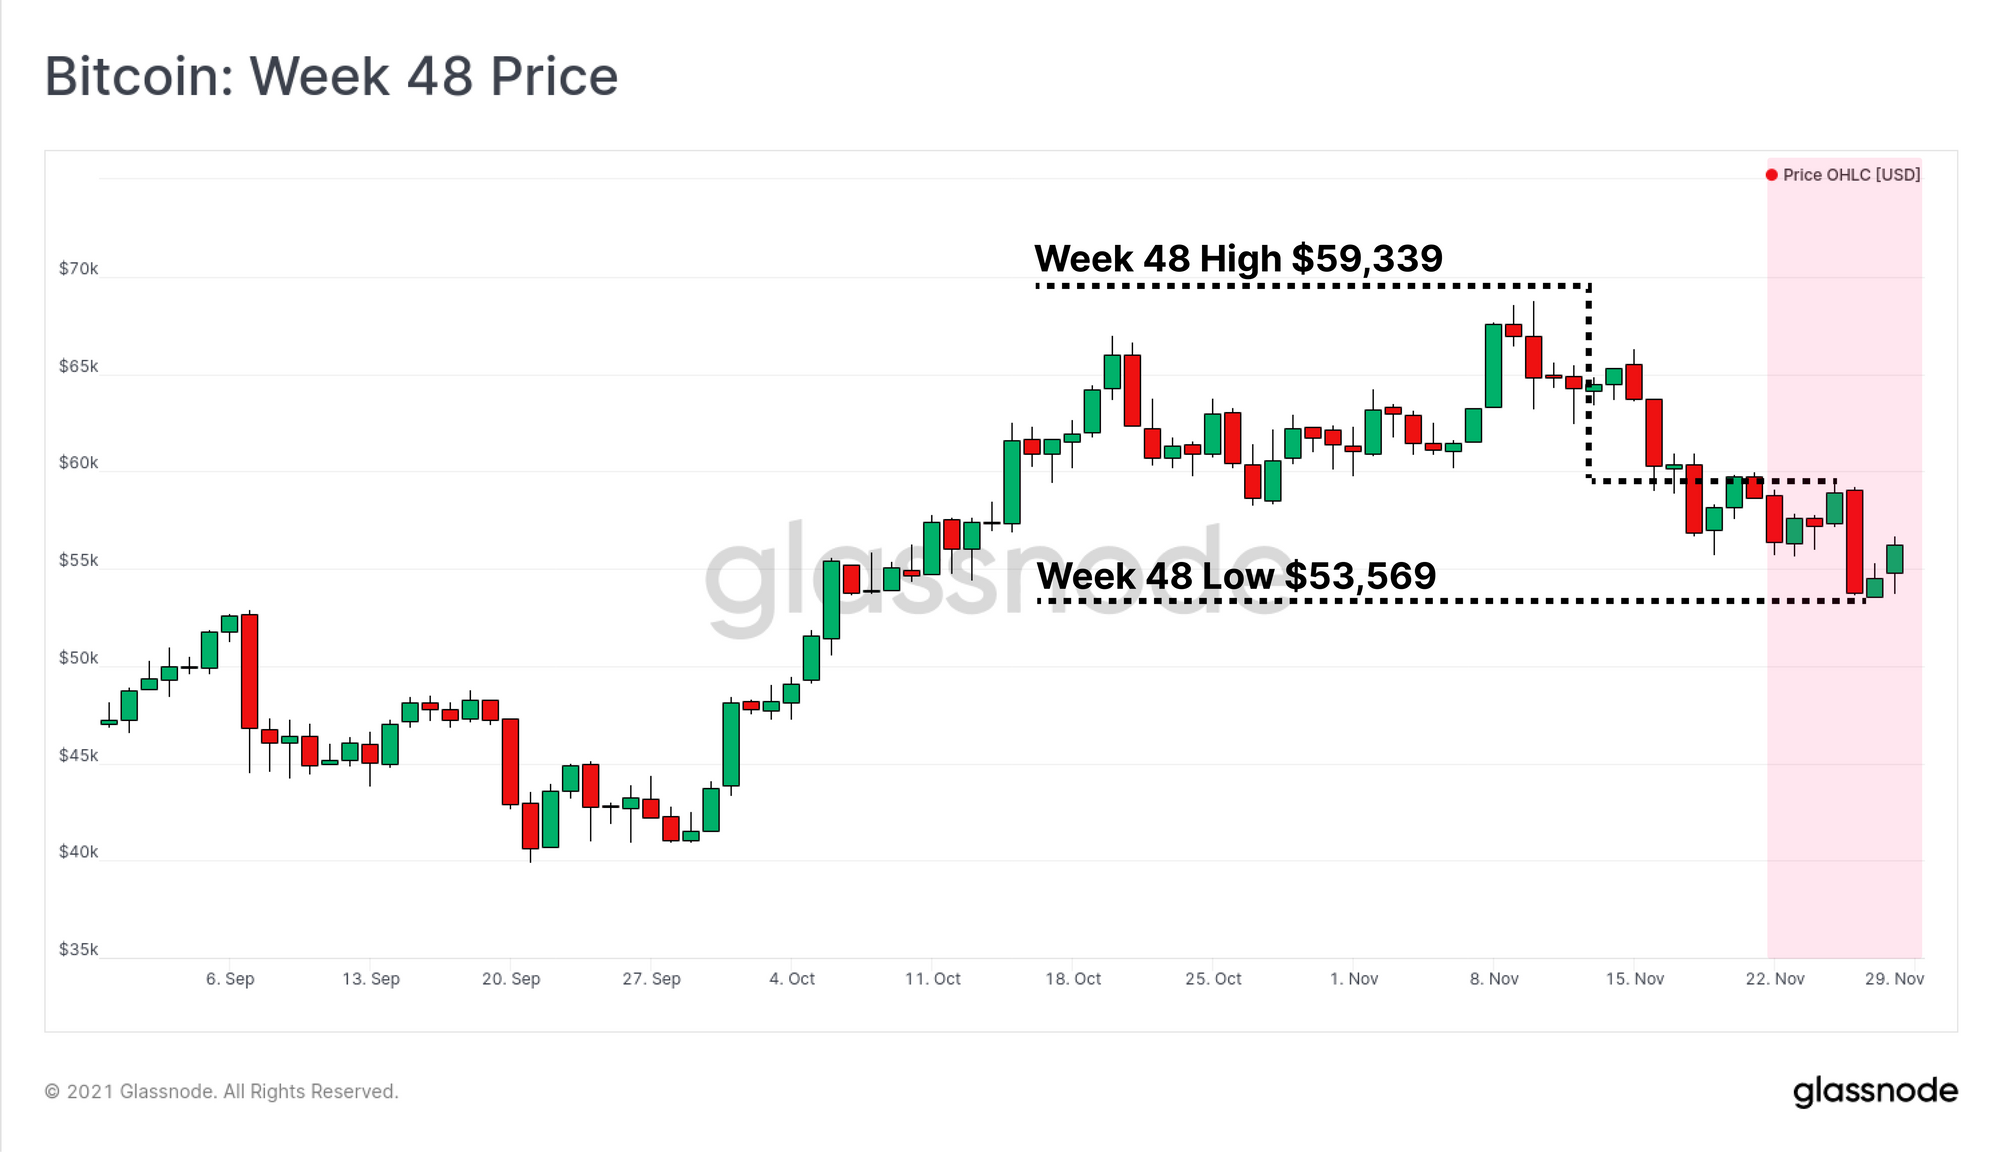
Bitcoin traded lower this week, alongside weakness across many traditional assets, largely due to renewed concerns over new virus variants. Bitcoin's price opened at a high of $59,339, and reached the lowest price for the month of $53,569. This continues the price correction that has been in play for most of November.

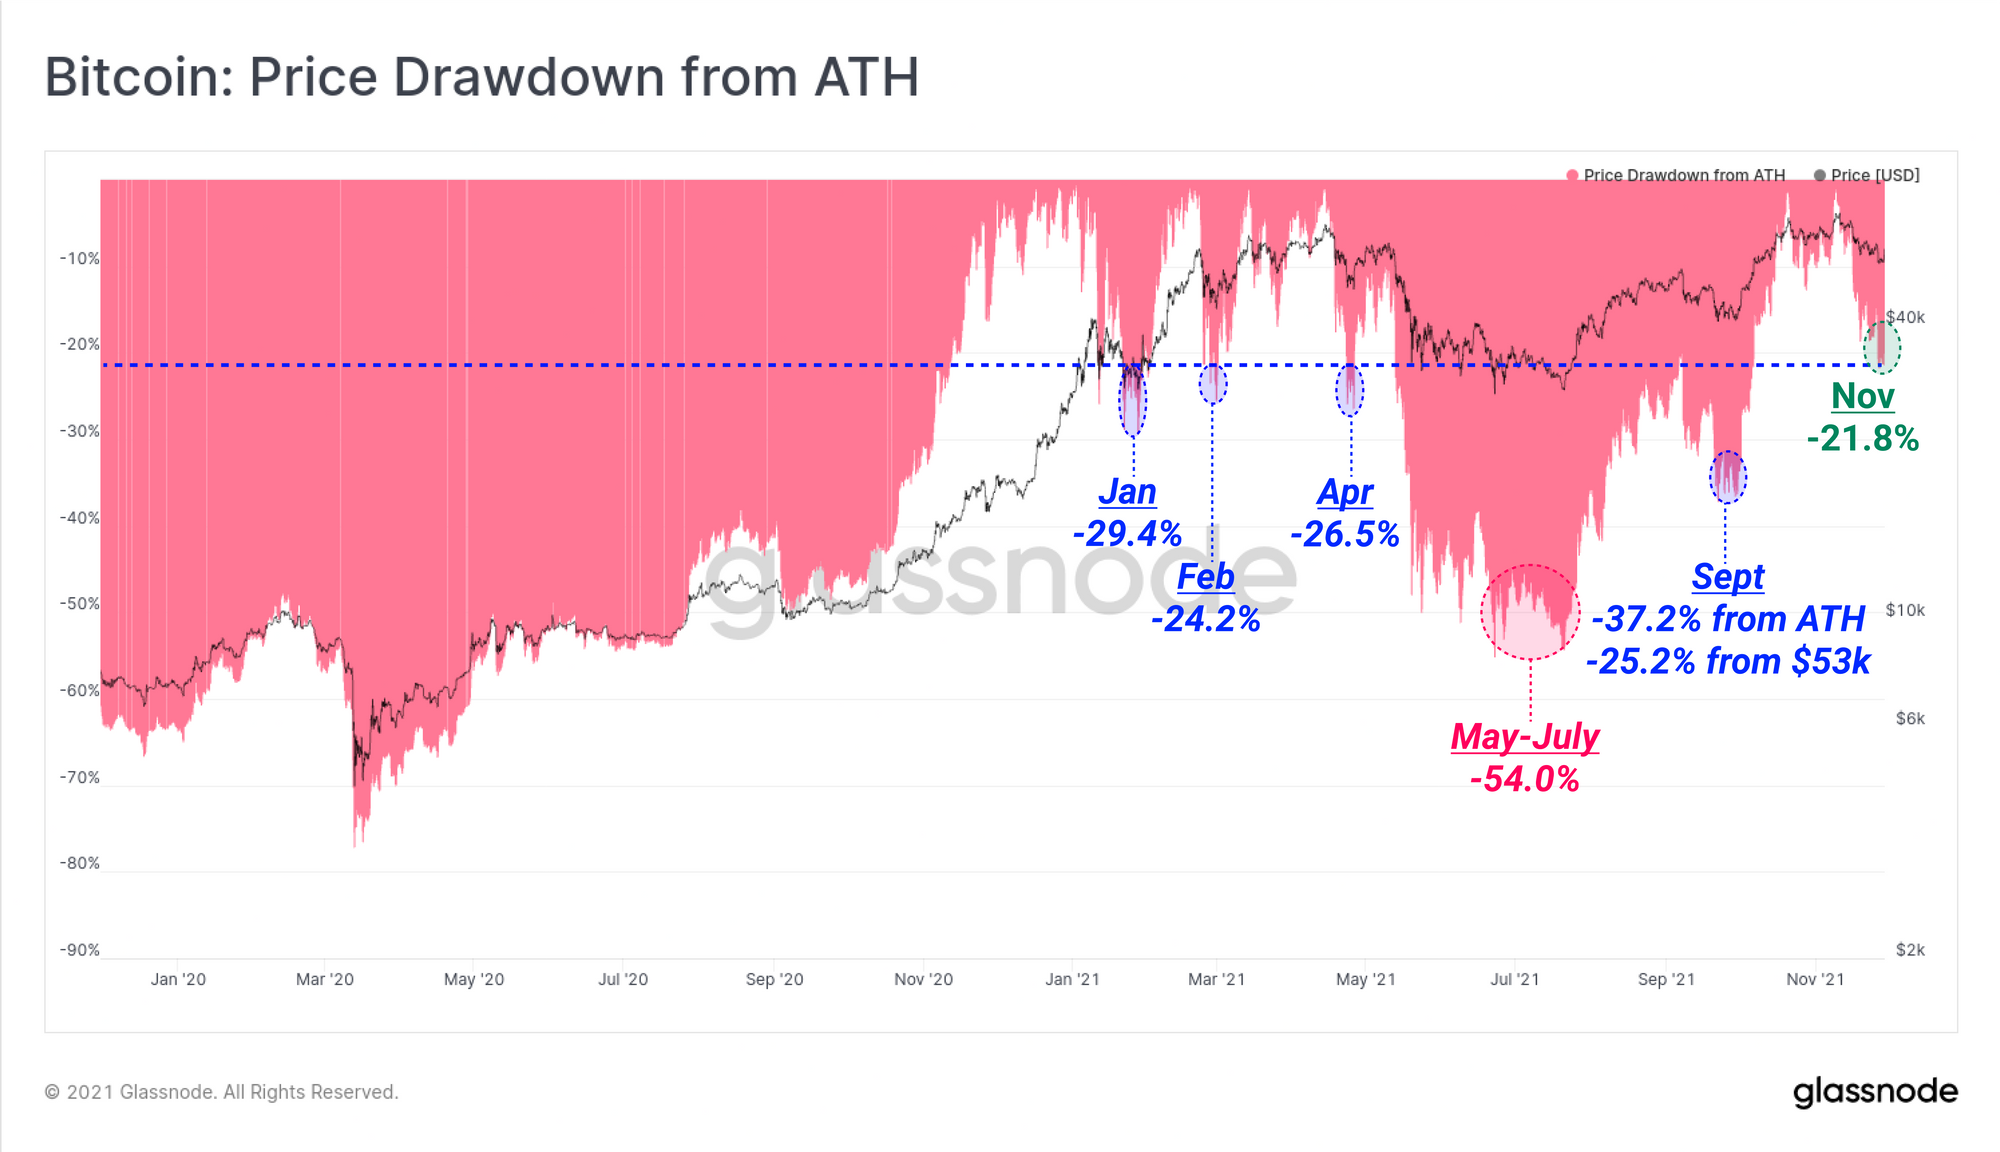
With Bitcoin now over 20% below the all-time-high, headlines in traditional media have declared that Bitcoin has entered a bear market. However it may surprise some readers that this current market correction is actually the least severe in 2021. Some might even say business as usual for a Bitcoin HODLer.

Sell-offs in Jan, Feb and April all reached drawdowns as deep as -24.2% from the ATH before reverting. The deepest drawdown this year was obviously the period from May to July, where the market reached a -54% drawdown at the lows. The most recent correction in September was actually the second deepest, reaching -37.2% from April's ATH, and 25.2% off the local high of $53k.

Live Chart

In this week's newsletter, we will be assessing the market structure during this drawdown from three different angles to identify investor sentiment across cohorts, and potential risks for further downside. We will focus on:

  • Derivatives markets and the state of leverage in the system.
  • Short-Term Holders and the recent retest of their onchain cost basis.
  • Long-Term Holders and the state of their distribution and profitability.

Week On-chain Dashboard

The Week On-chain Newsletter now has a live dashboard for all featured charts here. We have also started production for Week On-chain video analysis to provide a deeper dive into the thesis and logic behind each weeks analysis. Visit and subscribe to our YouTube channel, and visit our Video Portal to see our video content.


CME Futures Dominance Climbs

It is important to pay attention to the state of Bitcoin derivatives markets, as they can often be a source of excessive leverage which can unwind in a fairly spectacularly way from time to time.

In options markets, we continue to see between $12B and $14B in nominal open interest throughout October and November. The total open interest has come off the highs this week, down to approximately $10 Billion following the expiry of the 26-November contracts.

Live Chart

Futures open interest is also just below all-time-highs when denominated in BTC, reaching just above 400k BTC in total nominal value. Denominating in BTC is used to remove the influence of coin price on this metric (such as coin-margined contracts), and aide in identifying periods of rapidly growing leverage, or de-leveraging.

Highlighted in the chart below are a number of short and long squeezes, where open interest rapidly decreased as price volatility forced traders to cover their positions. With leverage in futures markets near an ATH, there is a risk that leverage may unwind, as has been demonstrated in almost all prior instances where open interest surpassed 350k BTC in size.

Live Chart

However, for all futures positions, buyers are matched equally with sellers, meaning there is limited information on likely market direction in the event of a leverage squeeze. Perpetual futures funding rates can give some insight into the market's directional bias, and at the time of writing, remains slightly positive (bullish bias). However it is notable that funding rates have generally declined alongside falling price, suggesting traders are more cautious as the correction proceeds.

However, whilst funding is positive, the decline is quite significant, which doesn't rule out the possibility that a large portion of the market is net short as price declines. It is reasonably plausible for a leverage squeeze to play out in either direction given this observation.

Live Chart

On a more specific note, since the launch of the Bitcoin futures backed ETFs in the US markets, the dominance of both open interest (pink), and futures trade volume (blue) on the CME has exploded higher.

The chart below shows that contracts opened on the CME market now represents over 19.3% of all futures open interest, an almost doubling from the 10% dominance in early-September. Similarly, trade volume on the CME has risen from just 1.4%, to 6.0% over the same period.

Live Workbench Chart

Short-Term Holder Analysis

In the last two weeks newsletters (46 and 47) we focused on a number of metrics related to Short-Term Holders, whose coins are younger than ~155-days. We also noted that the Realised Price of the Short-Term Holder cohort was hovering at around $53k, and would likely provide market support.

This week, price traded to a low of $53.5k, which whilst not a technical touch, does suggest a potential front-running of that psychological cost basis support level was in play. This is now the second retest of the STH Realised Price in the current trend, and if held, has similarities to major corrections observed in 2017, where it acted as reliable support.

Live Workbench Chart

A common onchain behaviour we see near the lows of bull market corrections are top buyers capitulating and realising losses. In many ways, bottoms cannot be hammered out until these potential sellers are exhausted.

Looking to overall realised profits and losses, we can see two recent events in play:

  • Realised Profits (green) have declined alongside the correction, potentially signalling reducing profit taking, and growing investor conviction.
  • Realised Losses spiked (pink) to $800M per day, similar to significant sell-offs in April, and July, but much lower than the major sell-off in May. This suggests a reasonable flush out of spot top buyers has occurred, but does not rule out further sell-side.
Live Workbench Chart

Zooming into the STH cohort specifically, the STH Profit/Loss ratio has fallen just below 1 this week. This indicates that spending by STH are realising losses on net. Similar to the STH Realised Price, this represents a test of investor conviction as prices return to, or below their on-chain cost basis. Ideally, market strength needs to step in reasonably soon, else the probability of STHs selling at or around their cost basis will likely increase.

Live Chart

Now whilst price is testing STH conviction, and trading around their cost basis, the market is actually in a healthier position when compared to the September correction. The total proportion of supply held by STHs that is in profit has increased by 60%, from 5.78% of circulating supply in September, to 9.20% today. STH supply in loss has accordingly declined from 12.3% to 9.6% of circulating supply.

More STH supply is in profit, price is retesting their cost basis, and top buyers are realising losses on-chain. In bull market conditions, this combination usually sets out a fairly constructive short-term outlook. The key 'watch-it' is whether the market can convincingly hold the STH Realised Price at ~$53k.

Live Chart

Long-Term Holder Analysis

Shifting our focus to Long-Term Holders, we can see that there has been a reasonably continuous rate of spending over the last month. From the peak of 13.5M BTC in holdings, LTHs have spent (assumed distributed) 150k BTC, equivalent to around 5.8% of the volume accumulated since March 2021.

Live Chart

Performing a similar breakdown assessment as for STHs, we can see that the proportion of LTH supply in profit has also increased since the September lows. Whilst LTH supply in profits has increased from 72.3% to 75.8% of circulating supply, the proportion at a loss has fallen from 9.65% to 5.80%.

In comparison to the correction in September, the balance of supply in profit vs loss is actually much healthier, both for STHs and LTHs. Whilst the risk of further downside certainly remains, forced selling in the mid-50k's by investors holding too much underwater supply is unlikely to be the cause.

Live Chart

So now that we have established LTHs are spending some of their holdings, we can look to the LTH-SOPR to assess the relative profitability of the coins that are on the move. Marked on the chart below is the approximate time in late June where the STH-LTH threshold of 155-days is for context.

Here we can see that the LTH-SOPR metric is in a macro decline, indicating that since March, the profitability of LTH spent coins has been falling. Note also how this week especially, LTH-SOPR has fallen rapidly, again suggesting smaller profit multiples are being realised.

The most important observation is the divergence since August, where LTH-SOPR trades lower as prices trade higher. There are two primary factors behind this observation:

  • The LTH threshold now encompasses the first half of 2021 in which the market traded well above last cycles $20k ATH. LTH coins can simply now have a higher cost basis.
  • LTHs who are spending at the moment, are spending coins purchased closer to the current price. This could be interpreted as LTHs de-risking, panic selling closer to their cost basis, or selling coins with the lowest tax burden (highest cost basis).
Live Chart

Finally, we can use LTH-SOPR to divulge an estimate average 'spent coin cost-basis'. In other words, for all the LTH spent coins each day, what was the average price they we last moved at?

By taking the ratio of market price and LTH-SOPR, we can see that the 'LTH Spent Price' ticked up to $34.3k this week (green). Extreme peaks and troughs in this metric often occur around local market tops and bottoms, often an indicator of strategic profit taking (high profit multiples), or panic selling (lower profit multiples), respectively.

Live Workbench Chart

In summary this week, we have:

  • Market sentiment taking a hit, despite the drawdown from ATH actually being one of the least severe in 2021
  • Open interest leverage in options and futures at or near ATHs, which is cause for some concern regarding heightened 'flush out' potential. Funding rates suggest an only slightly positive bias, making both a long- or short- squeeze plausible scenarios.
  • Price has retested the Short-Term Holder onchain cost basis and bounced. Holding this level at $53k is key to support a bull market.
  • Long-Term Holders have distributed 5.8% of the supply accumulated since March and some uncertainty exists based on their spending patterns.
  • Both Long and Short-term Holders are holding more profitable supply than September's correction, which can generally be viewed as constructive for price.

Product Updates


Disclaimer: This report does not provide any investment advice. All data is provided for information purposes only. No investment decision shall be based on the information provided here and you are solely responsible for your own investment decisions.