A Capital Reset

In the wake of one of the largest deleveraging events in digital asset history, the Bitcoin Realized Cap has declined such that all capital inflows since May 2021, have now been flushed out. There is an associated uptick in on-chain activity, however it lacks substantial volume follow through.

A Capital Reset

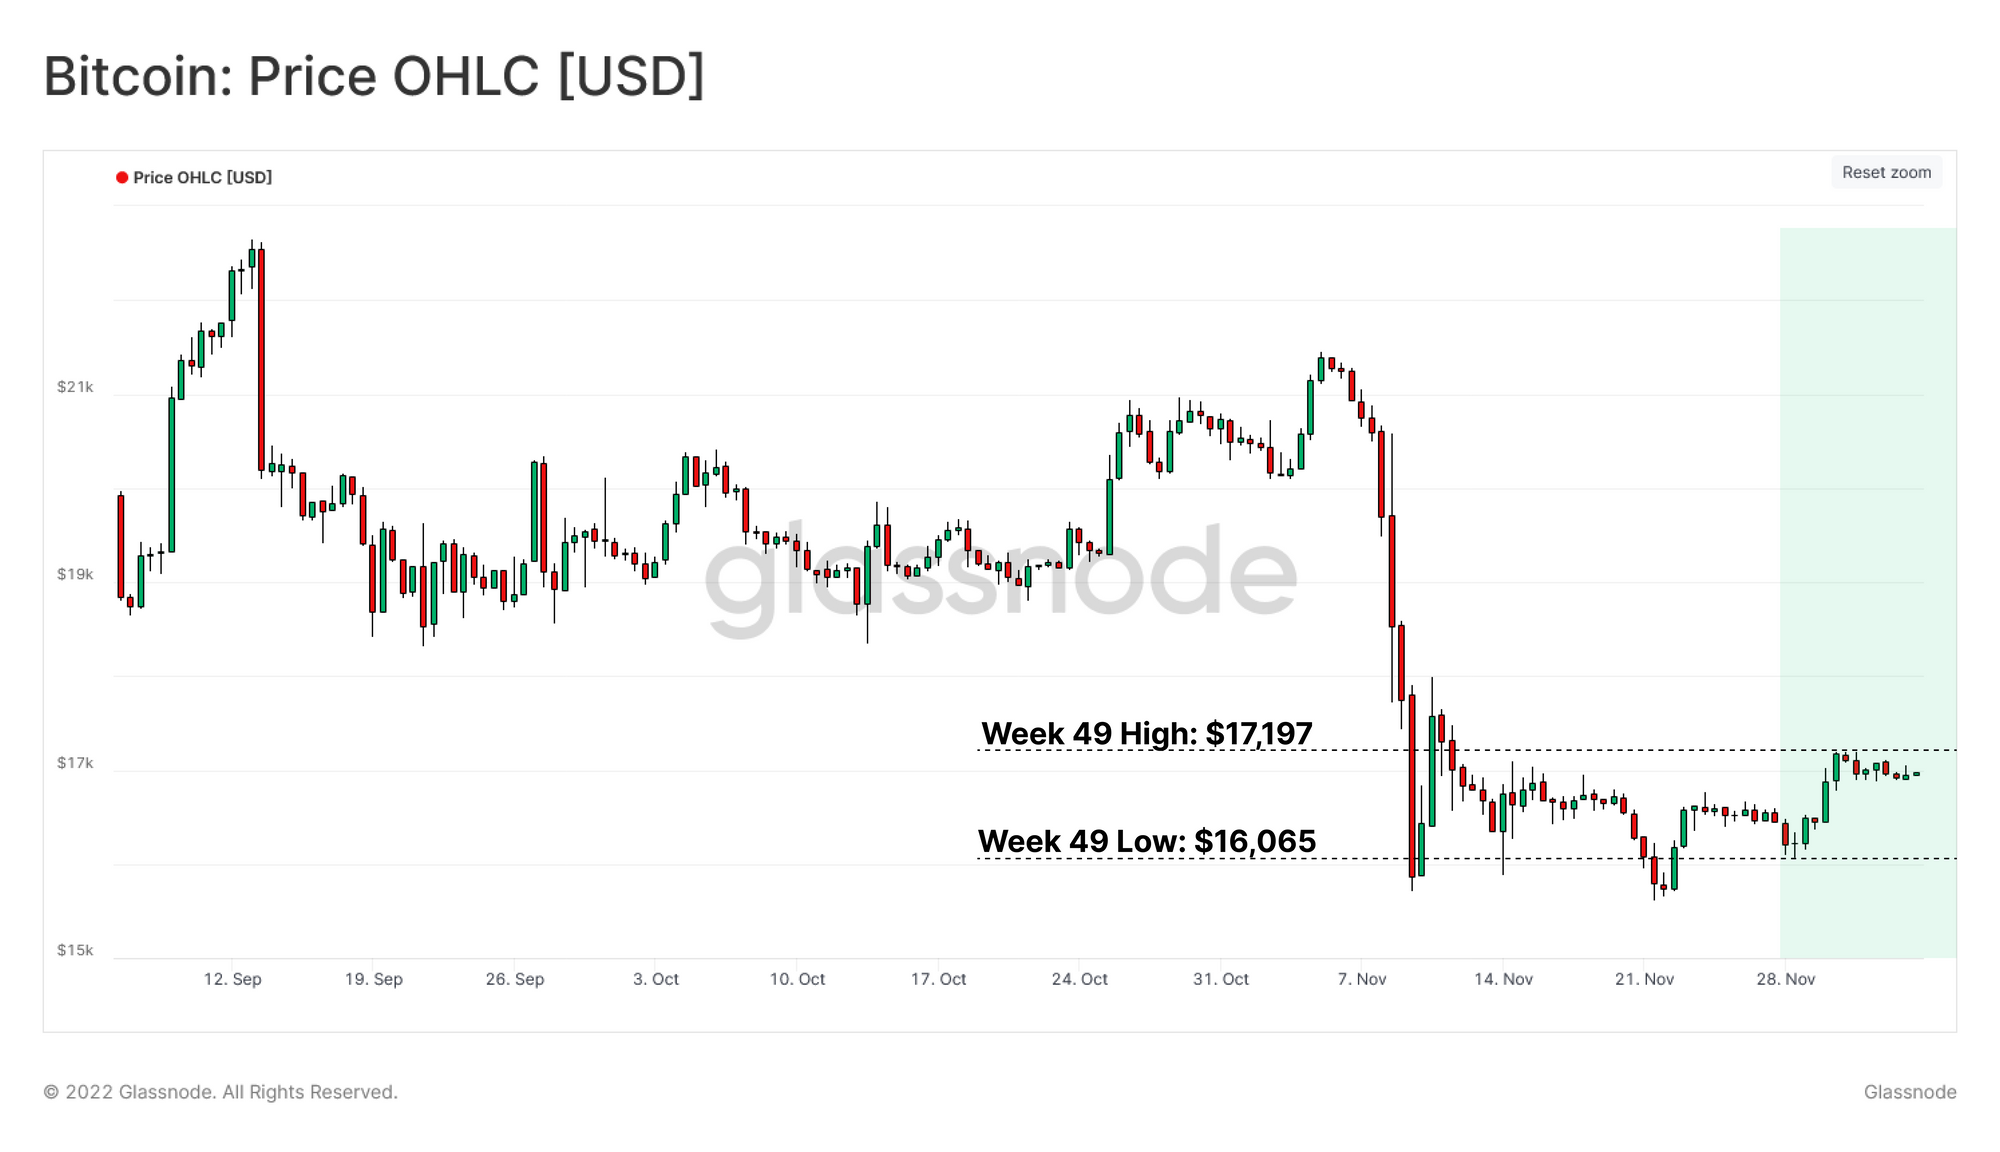
The Bitcoin market has seen considerable consolidation above cycle lows following a tempestuous few weeks in the wake of the FTX implosion. Price action has seen a strong recovery of near 10%, bouncing from range lows of $16,065 to a high of $17,197.

In this weeks edition, we shall explore the severity of losses experienced by market participants in what appears to be the largest deleverging event in digital asset history. We will also explore the subsequent effects on both network activity and and demand for blockspace, and what it tells us about current market structure.

Translations

This Week On-chain is now being translated into Spanish, Italian, Chinese, Japanese, Turkish, French, Portuguese, Farsi, Polish, Arabic, Russian, Vietnamese and Greek.

The Week Onchain Dashboard

The Week Onchain Newsletter has a live dashboard with all featured charts available here. This dashboard and all covered metrics are explored further in our Video Report, which is released on Tuesdays each week. Visit and subscribe to our Youtube Channel, and visit our Video Portal for more video content and metric tutorials.

A Regime of Loss

To begin our assessment, we shall inspect the magnitude of losses realized by all market participants throughout the turbulent deleveraging event in recent weeks.

Both the June 2022 sell-off, and the FTX Implosion prompted investor capitulation events that are of historical scale. The FTX event recorded an ATH one-day loss of -$4.435B.  However, when assessed with a weekly moving average, losses appear to be subsiding. The June Sell-off by comparison sustained over -$700M in losses each day for almost 2 weeks after the event.

Live Advanced Dashboard

We can supplement this analysis by inspecting the ratio between realized profit , and realized loss. Here we can observe that the ratio between realized profit / loss has recorded a new all time low.

This indicates that losses locked in by the market were 14x larger than profit taking events. It is likely this in part reflects how the entirety of the 2020-22 cycle price action is above the spot price.

Previous instances of extremely low Realized Profit/Loss ratios at this scale have historically coincided with a macro market regime shift.

Live Advanced Dashboard

Next, we shall inspect the Realized Capitalization metric, which displays the the net sum of capital inflows, and outflow into the network since inception. We can use this metric to assess the severity of capital outflows from the network after the market cycle peak.

A significant rise can be seen in the Realized Cap following the sell-off in mid-2021. This can be interpreted as market participants taking significant exit liquidity on the rally higher, and thus realizing profits, and increasing the Realized Cap.

Following the LUNA collapse in May 2022, a significant capital outflow can be seen, as investors who purchased near the market top started locking in increasingly large losses.

The exuberance experienced during the H2 2022 rally to the ATH has almost fully retraced, suggesting a near complete detox of this excess liquidity.

Live Advanced Chart

We can then compare the current cycle to all previous major bear markets, measuring from Realized Cap peak, to trough, as a gauge for relative capital outflows:

  • The 2010-11 saw a net capital outflow equivalent 24% of the peak.
  • The 2014-15 experienced the lowest, yet a non-trivial capital outflow of 14%.
  • The 2017-18 recorded a 16.5% decline in Realized Cap, the closest to the current cycle of 17.0%.

By this measure, the current cycle has seen the third largest relative outflow of capital, and has now eclipsed the 2018 cycle, which is arguably the most relevant mature market analogue.

Live Advanced Chart
The realized loss experienced by Bitcoin investors across the past 6 months has been historic in magnitude. Profitability stress is starting to diminish after the event, but has resulted in a complete flush out of all excess liquidity attracted over the last 18-months. This suggests that a complete expulsion of 2021 speculative premium has now occurred.

An Uptick in Blockspace Demand

The Miner Revenue from Fees metric allows for insight into the demand for blockspace, and whether transactors are willing to bid up fees paid for inclusion in the next block. If we compare the monthly fee rate to the longer standing yearly average, we can assess the local fee momentum.

  • Fee Momentum above 1 🔵 suggests an expansion in miner revenue contribution from fees, relative to the yearly baseline.
  • Fee Momentum below 1 🔴indicates a contraction in miner revenue from fees relative to the yearly baseline.

Sustained bear markets are often accompanied by a significant decline in network activity, resulting in fairly lacklustre fee revenue. This deadlock has historically broken in reaction to a major capitulation in price action, where substantially lower prices entices new demand for blockspace. As sellers are expelled, and value buyers take the other side, this excitement creates an uptick in network congestion.

Of most interest is whether this uptick is fleeting, or whether it can be sustained, signifying a potential regime shift is underway.

Live Advanced Workbench

This observation is supported by the the Active Entities Momentum metric, which can be considered under the following framework.

  • Momentum above 1 🔵 indicates expansion in unique entity activity.
  • Momentum below 1 🔴 suggests contraction in unique entity activity.

Again, we note that the recent price drawdown has stimulated an influx of activity on-chain, with this metric breaching above the equilibrium position for the first time since the price rally to $48k in April 2022.

It would be encouraging to see Entity Momentum remain at elevated levels relative to the equilibrium threshold.

Live Professional Workbench

Following on, we introduce a set of yearly rolling standard deviation bands for the Transaction count metric (on Entity-Adjusted basis). This plots out the 14D-SMA for all confirmed transactions, as well as a series of statistical bands within the range of ± 2σ.

Two key observations can be ascertained:

  • The dramatic decline in Transaction Count in May 2021 exemplifies a near total expulsion of network activity, similar to that seen in early 2018.
  • Following the aforementioned event, network activity embarked on a slow, but consistent recovery towards the yearly baseline. This is again similar to late 2018, and much of 2019

The stabilization of Transaction Counts shows that over the course of the last 6-months, the Bitcoin network has been approaching and oscillating around an equilibrium position of demand for blockspace.

Live Professional Workbench

One area which continues to languish is the settlement of volume across the network.

The current volume settled is testing cycle lows, suggesting the utilization of the network for value transfer remains lacklustre, despite improvements in transaction counts, and unique entities.

Live Professional Chart

With transaction counts recovering, but transfer volumes declining, it is likely a reflection of more small size transfers, and declining dominance of larger institutional sized entities. The Relative Transfer Volume Breakdown confirms this, showing the dominance of smaller sized transactions (up to $100k) has increased to around 35%. This is a break from the relatively stable 10% to 12% through the entirety of the 2020-22 cycle.

Live Professional Chart

This can be further critiqued using the RVT Ratio metric shows that the network is near peak under-utilization. This suggests that even after the a significant capital outflow detailed above, the Bitcoin Realized Cap is still relatively high compared to transfer volume.

Live Professional Workbench
There are some constructive improvements in Bitcoin network activity and demand for blockspace. However, this trend remains in its infancy, and lacks the follow-through of transfer volume, which is again approaching cycle lows.

As Above, So Below

Despite improving participant activity, utilization of the network remains lacklustre, and it is prudent to prepare for all possibilities. We consult two on-chain pricing models which reflect network cost basis, and have been visited in prior bear cycles:

  • The Balanced Price 🔵 is calculated as the difference between Realized Price and Transfer Price. The Transfer Price is the cumulative sum of Coin Days Destroyed in USD, adjusted by circulating supply and total time since Bitcoin's inception.
  • The Delta Price 🟣 is the difference between Realized Cap and Average Cap, divided by the Circulating Supply, where Average Price is assumed to be the life-to-date moving average of Market Price.

In all prior bear markets, price has traded between the Balanced Price and the Delta Price, with 136-of-4518 (3.0%) of trading days within this range.

With regards to our current market, this creates a range between $15.5k and $12.0k. Price has only entered this channel briefly during the onset of the FTX collapse, before finding support above the Delta Price.

Live Advanced Workbench

When considering direct overhead resistance, we consult the on-chain cost-basis of the wider market, as well as two granular subsets; the Short and Long-Term Holders.

The STH cost basis remains has dived significantly lower of late, indicative of the large volume of coins that changed hands in November. We can also note that all on-chain cost-basis are tightly concentrated within the $18.7k to $22.9k range.

This tight concentration of cost-basis suggests a degree of homogeneity amongst market participants acquisition price. As such, it is more likely that the aggregate market will start to behave in a more cohesive manner in response to volatility. This also suggests that the perceived risk, and  opportunity amongst all participants, old or new, is similar, providing further confluence of a significant full market detox.

Live Professional Workbench

Summary and Conclusions

In conclusion, it is evident that the level of realized financial pain across Bitcoin market participants throughout the last 6 months has been nothing short of staggering, however, the severity of losses do appear to be diminishing over recent weeks.

We can also note a positive shift in character for both network activity and the demand for blockspace. This shift in structure is not however supported by rising transfer volumes, which continue to languish at cycle lows, and suggest an elevated level of retail sized participation.

A rare, but informative market structure is also present, whereby there is a degree of homogeneity amongst acquisition prices across all Bitcoin cohorts. This allows market analysts to assess the entire Bitcoin market as having a similar perception of risk vs opportunity, and a similar stance with regard to their profitability.


Disclaimer: This report does not provide any investment advice. All data is provided for information purposes only. No investment decision shall be based on the information provided here and you are solely responsible for your own investment decisions.


Translated channels

We are proud to have launched new social channels for: