Investors De-Risk Ahead of Hikes
Bitcoin investors have de-risked as global macro headwinds increase. In particular, traders eye the proposed Fed rate hikes in March, opting for protective insurance over speculative calls.


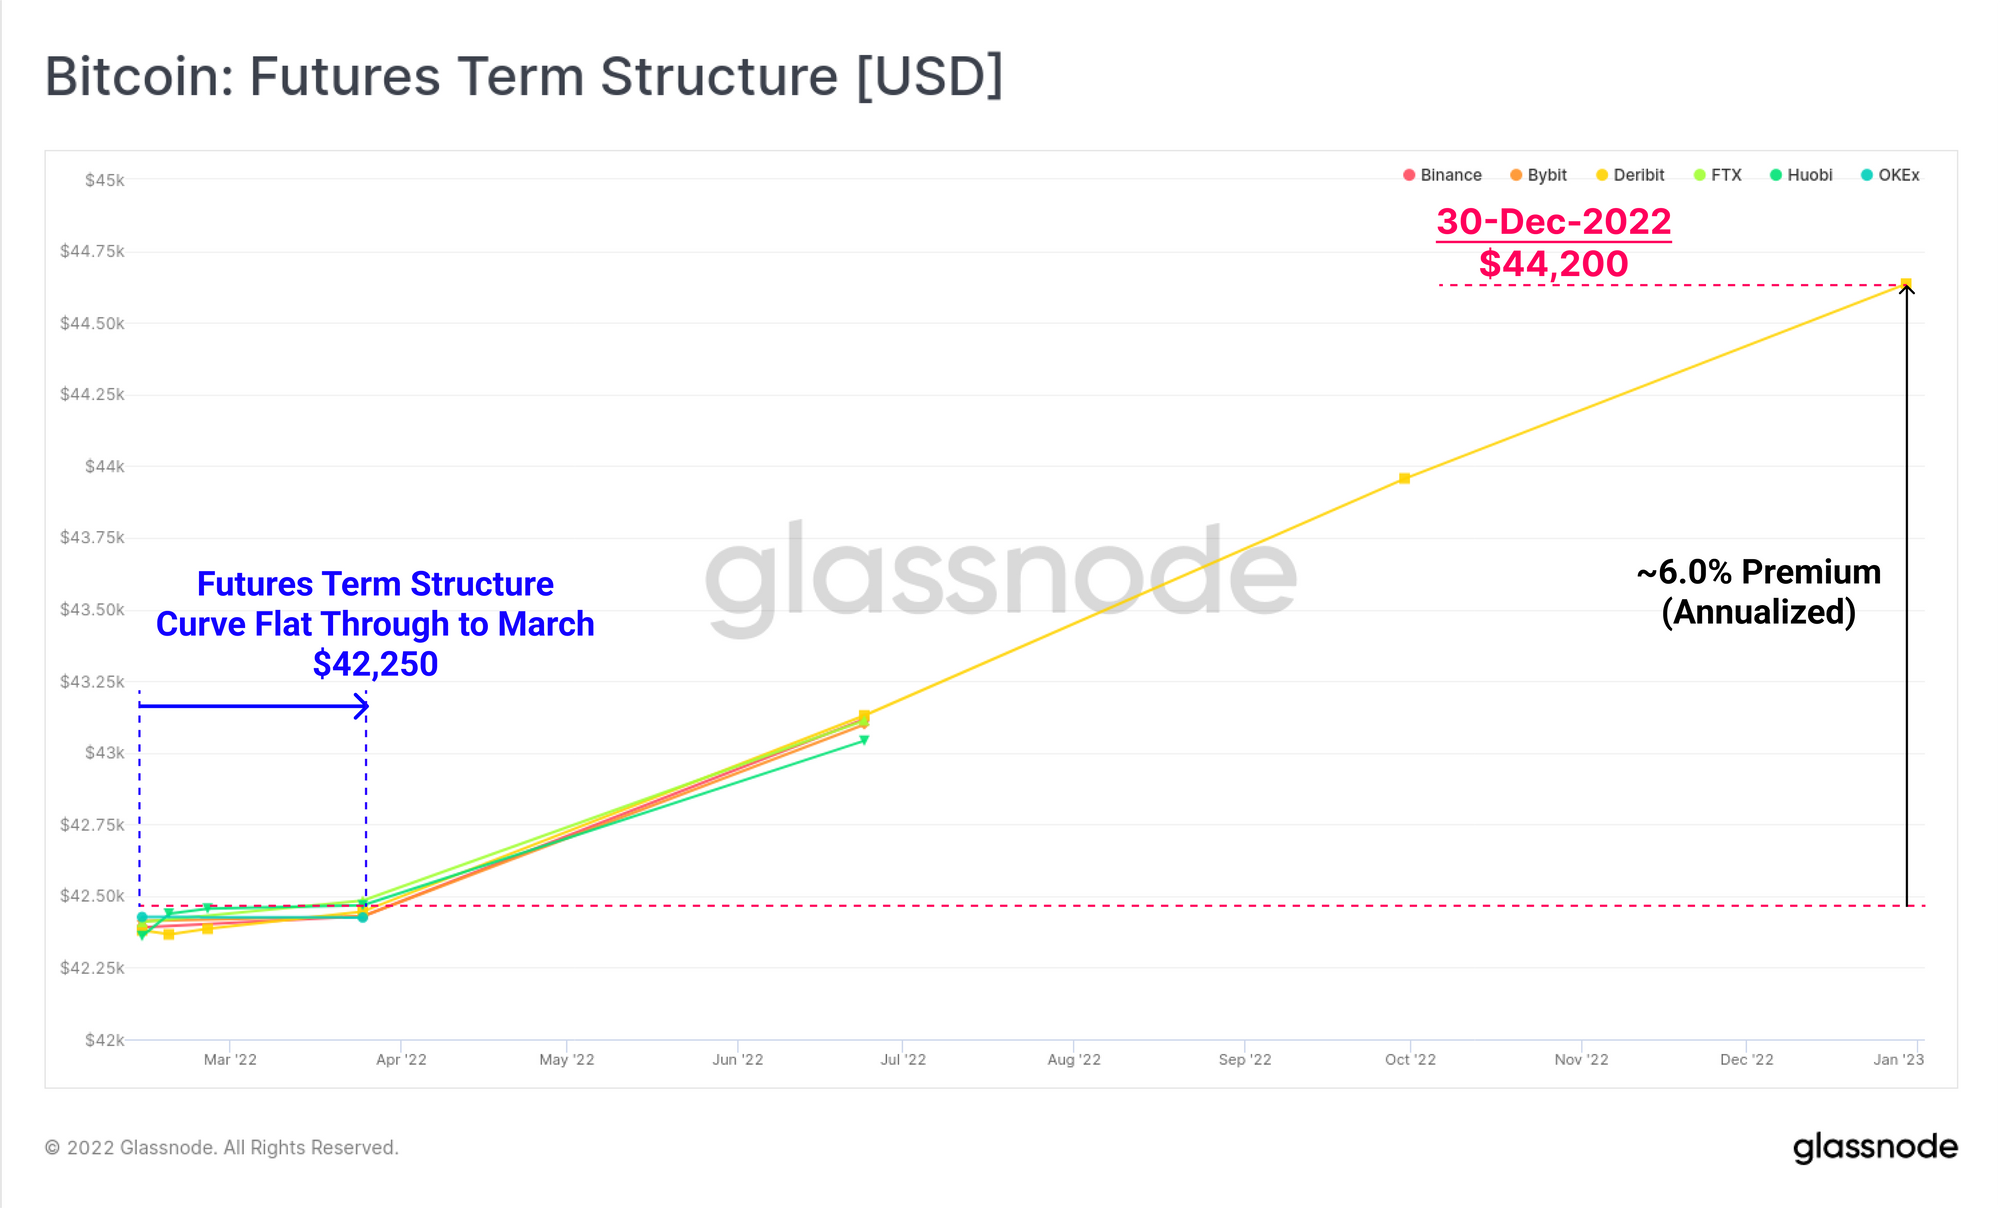
The Bitcoin market continues to grapple with numerous macro headwinds, from the tightening of Fed policy expected in March, and now fears of a potential conflict escalation in Ukraine. This week has seen Bitcoin derivatives markets pricing in this uncertainty, with a flattening out of the futures term structure curve until March. Futures premiums out to the end of 2022 are notably low, trading at just 6% annualised, and the market is expressing a strong preference for protective put options.
Simultaneously, on-chain supply dynamics are remarkably stable, a likely indication that investors are prepared to ride out whatever storm lies ahead, preferring to utilise derivatives to hedge out risks. Overall, this speaks to the continuing maturation of the Bitcoin market, as liquidity deepens, and more comprehensive risk management instruments become available. This differs greatly in comparison to historical Bitcoin market cycles where de-risking was possible only by the sale of coins in spot markets.
Quite to the contrary, current spot holdings and flows on-chain continue to display to be constructive characteristics, rather than a mass exit driven by fear or panic.
Translations
This Week On-chain is now being translated into Spanish, Italian, Chinese, Japanese, and Turkish.
The Week Onchain Dashboard
The Week Onchain Newsletter has a live dashboard with all featured charts available here. This dashboard and all covered metrics are explored further in our Video Report which is released on Tuesdays each week. Visit and subscribe to our Youtube Channel, and visit our Video Portal for more video content and metric tutorials.
Uncertainty Priced in for March Rate Hikes
As Bitcoin derivative markets mature and liquidity deepens, we can draw increasingly useful information from futures and options pricing. Across all of the exchanges we track, the futures term structure has flattened out through to March, coincident with the expected rate hikes proposed by the Federal Reserve. This speaks to a clear investor uncertainty regarding the wider economic impact of a tighter US dollar, given the preceding decades of loose monetary policy.
Futures out to the end of 2022 are currently trading with a very modest 6% annualized premium, suggesting the market is quite far from anticipating a wild bullish impulse any time soon.
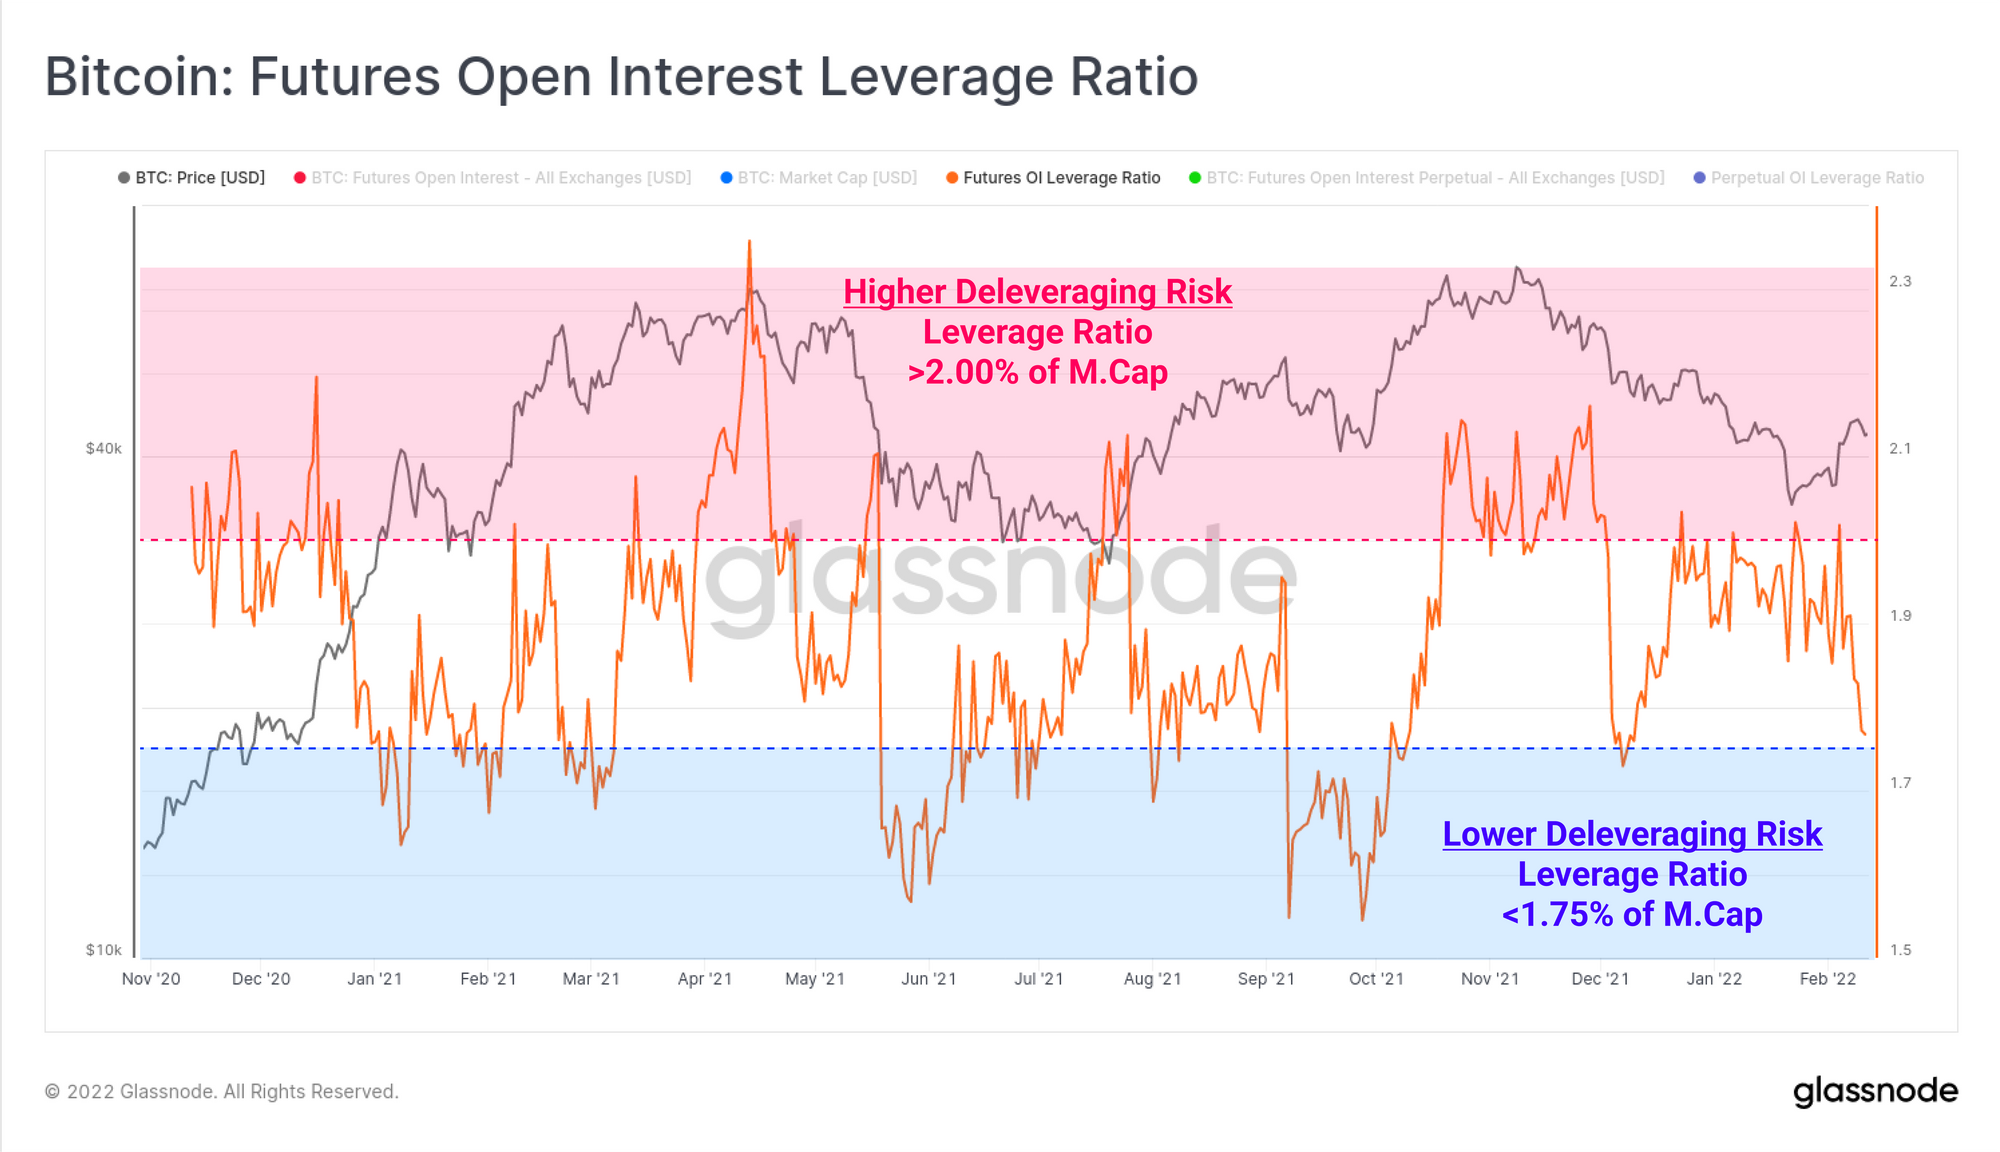
There has also been a notable de-leveraging across futures markets this week, however not a result of the infamous liquidation cascade that punctuated so many moments in 2021. The primary driver appears to be traders opting to close out their futures positions, rather than a forced sale/bid due to liquidations and volatile pricing. The market appears to be de-risking and curtailing leverage in response to the plethora of macro uncertainties.
Total futures open interest has now declined from 2.0% to 1.76% of market cap. Relative leverage of this magnitude has shown to be a considerably more stable range for the market throughout 2021, and was last reached after the 4-Dec-21 de-leveraging event.
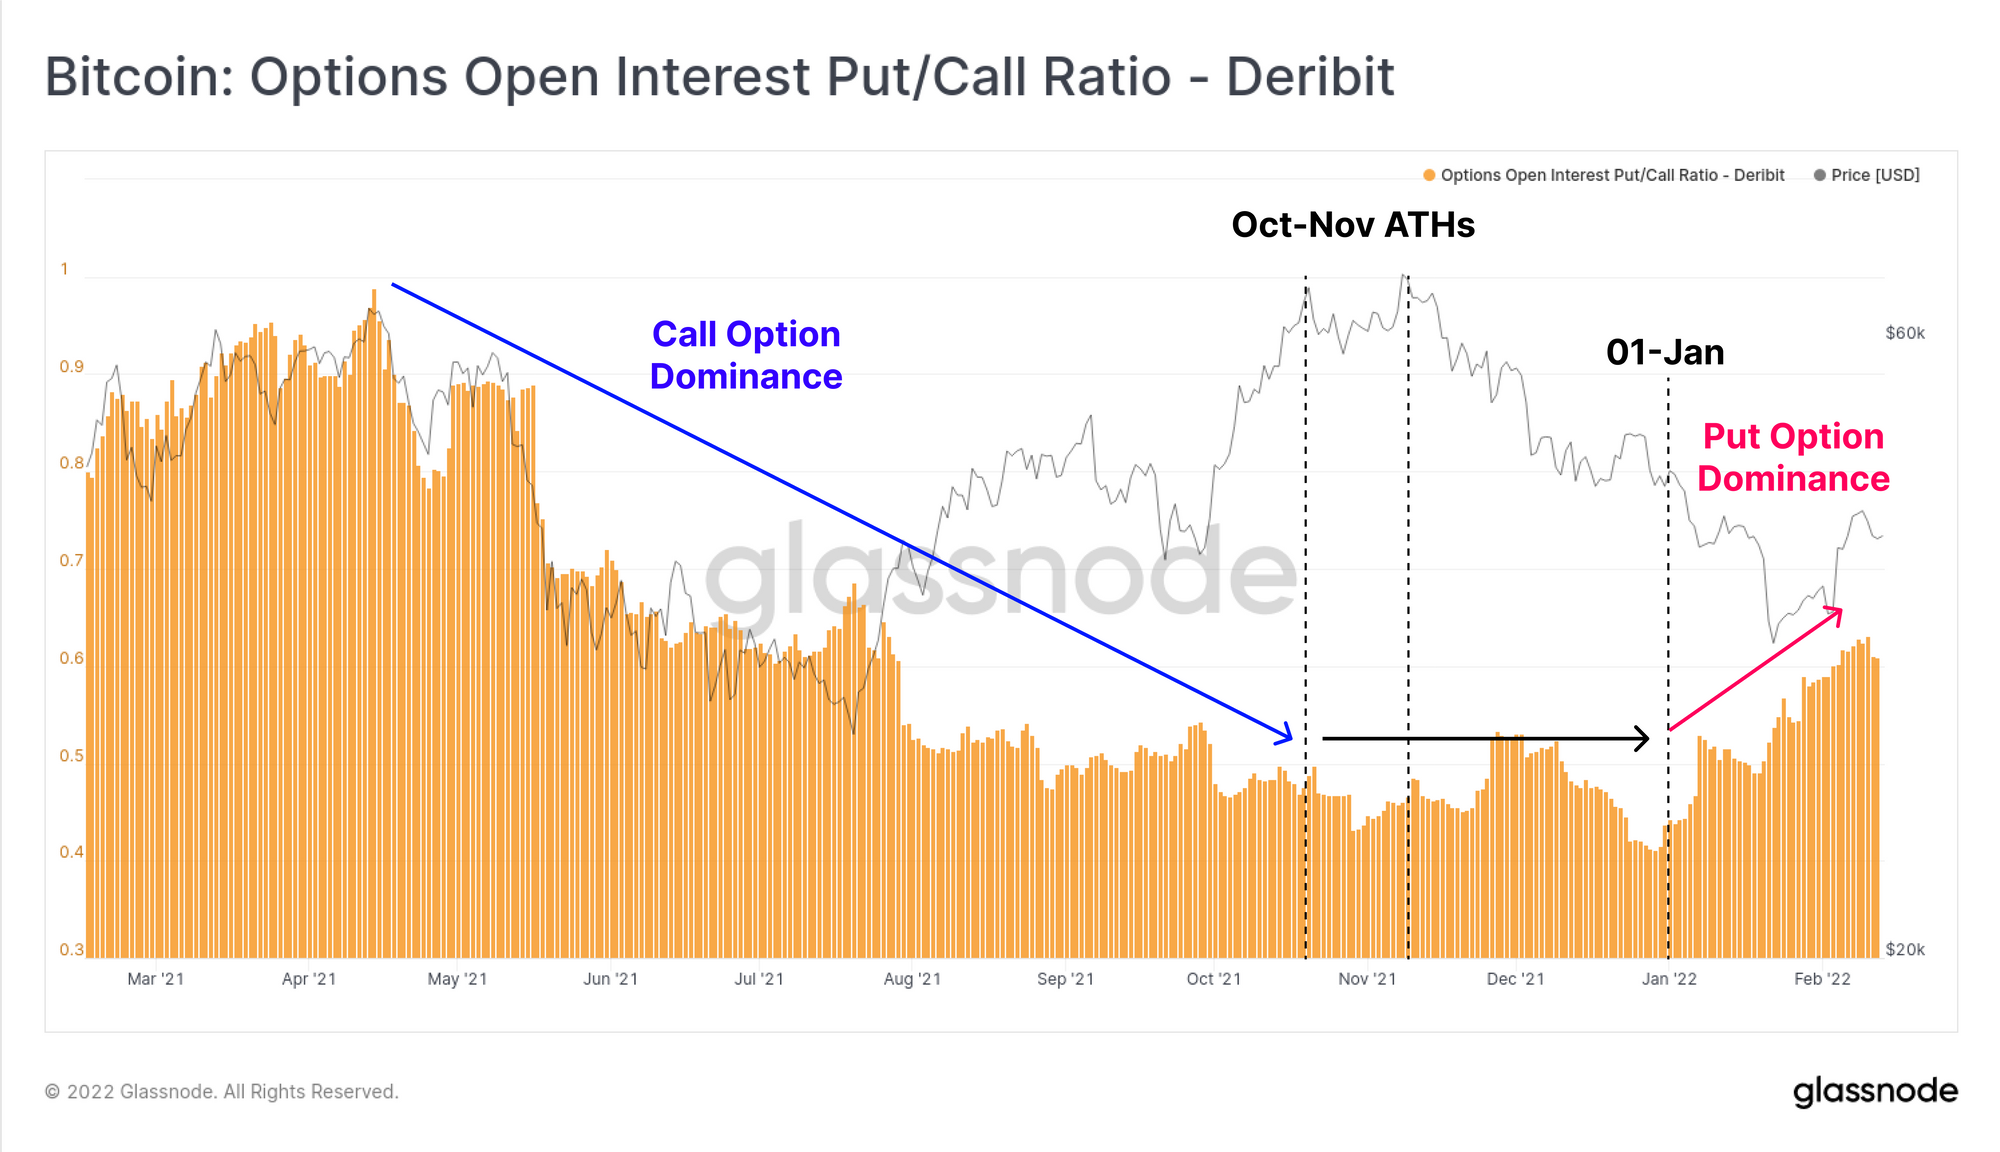
We can also see a strong preference for put option protection with the Put/Call open interest ratio continuing to climb. The transition from traders favouring speculative call options, and into protective put options is quite clear following the October and November 2021 ATHs, indicative of a new regime of investor sentiment.
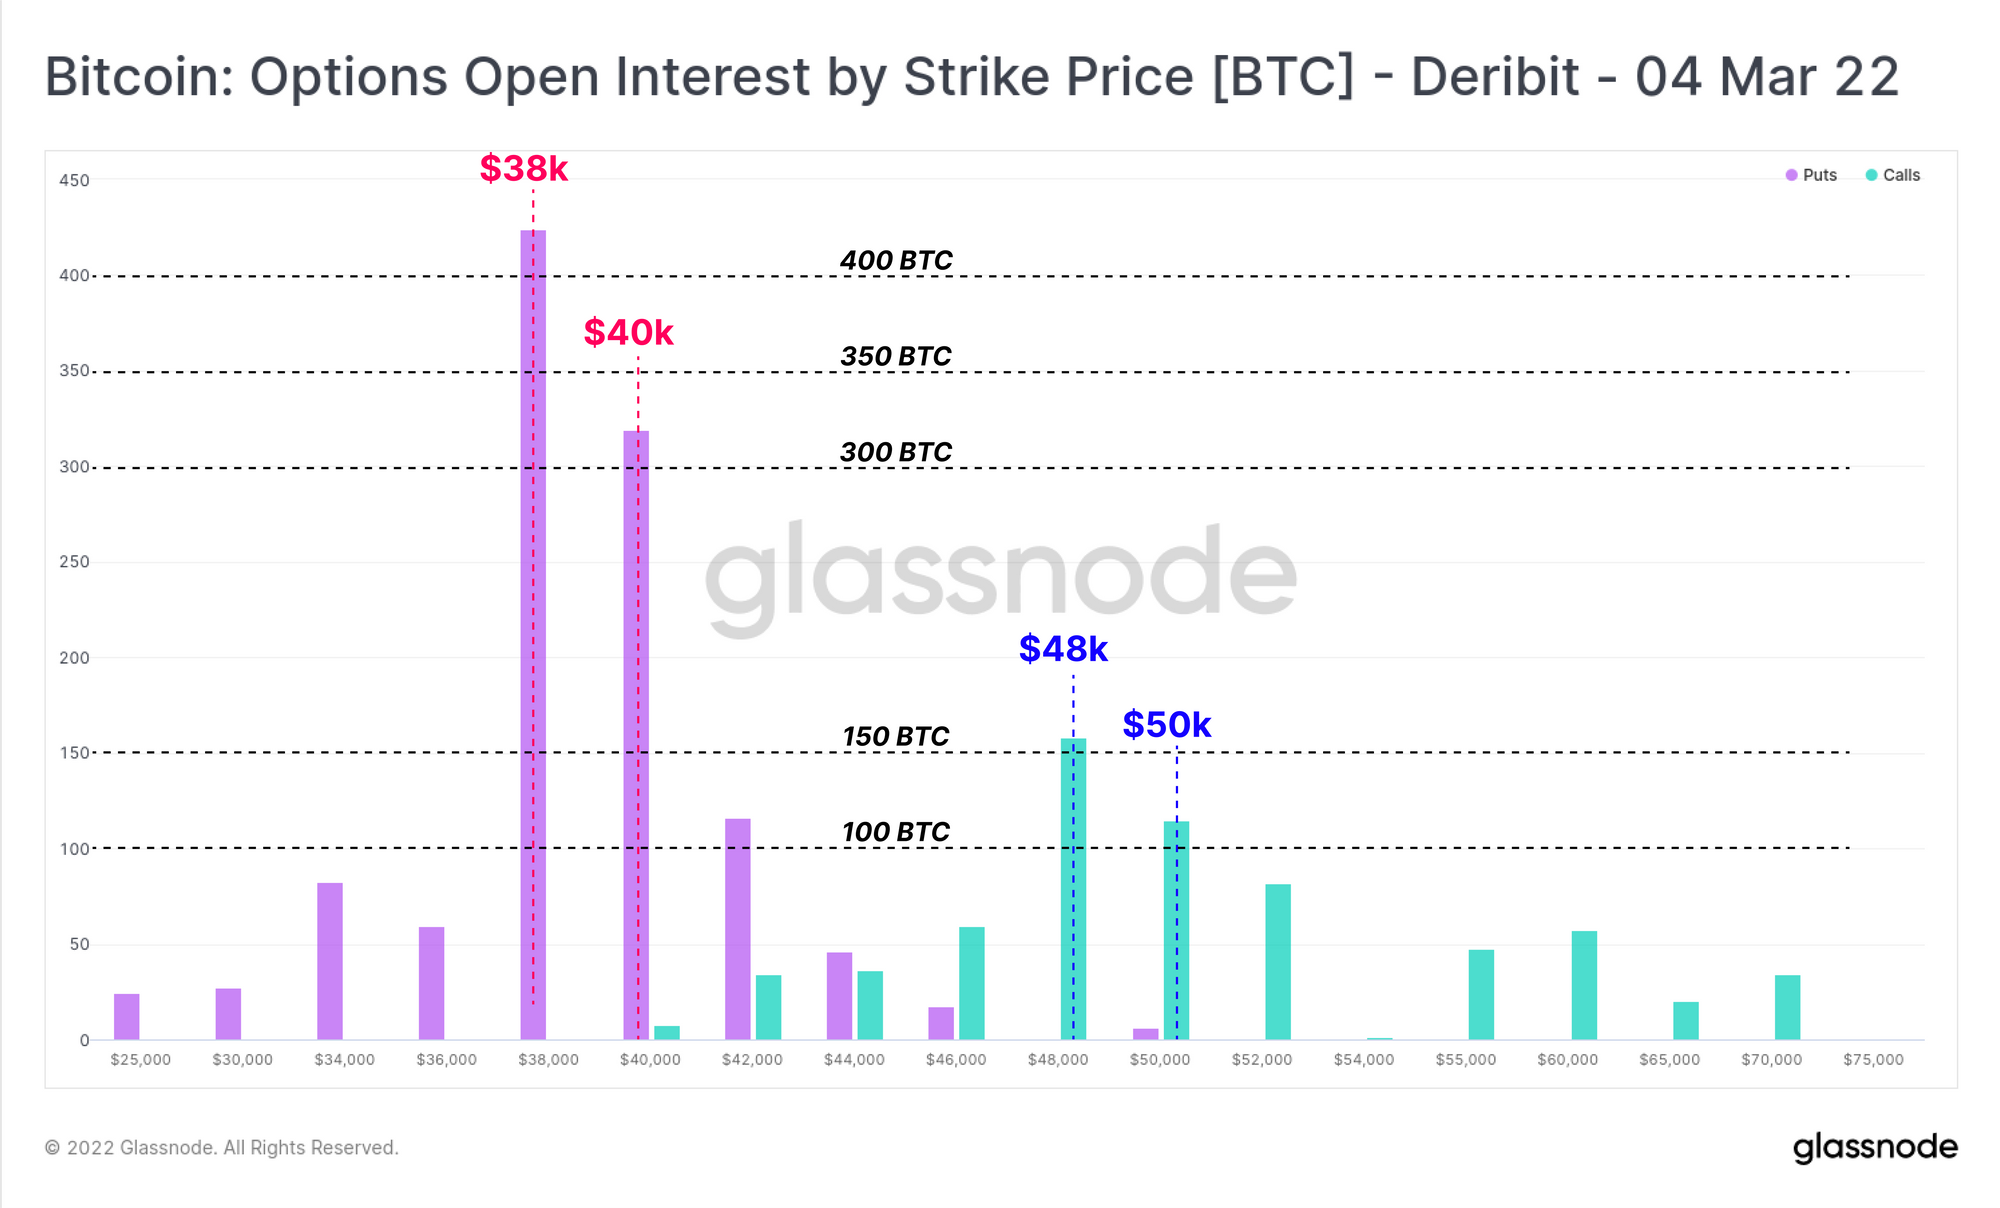
Higher put/call dominance is also apparent when looking at the open interest distribution for the 4-March contract. The market has a clear preference for puts with a strike between $38k and $40k, carrying more than 2.5x the open interest of the highest volume call option strikes, between $48k and $50k.
Overall, the pricing signals available in derivatives markets indicates a preference for protection, conservative leverage, and a cautious approach to storm clouds on the horizon. Based on both futures and options pricing, uncertainty appears to be principally centred around the impact of Fed rate hikes expected in March. Next up, we will review the performance of on-chain metrics to meld these observations with investor sentiment in spot markets.
Spot Supply Dynamics Remain Stable
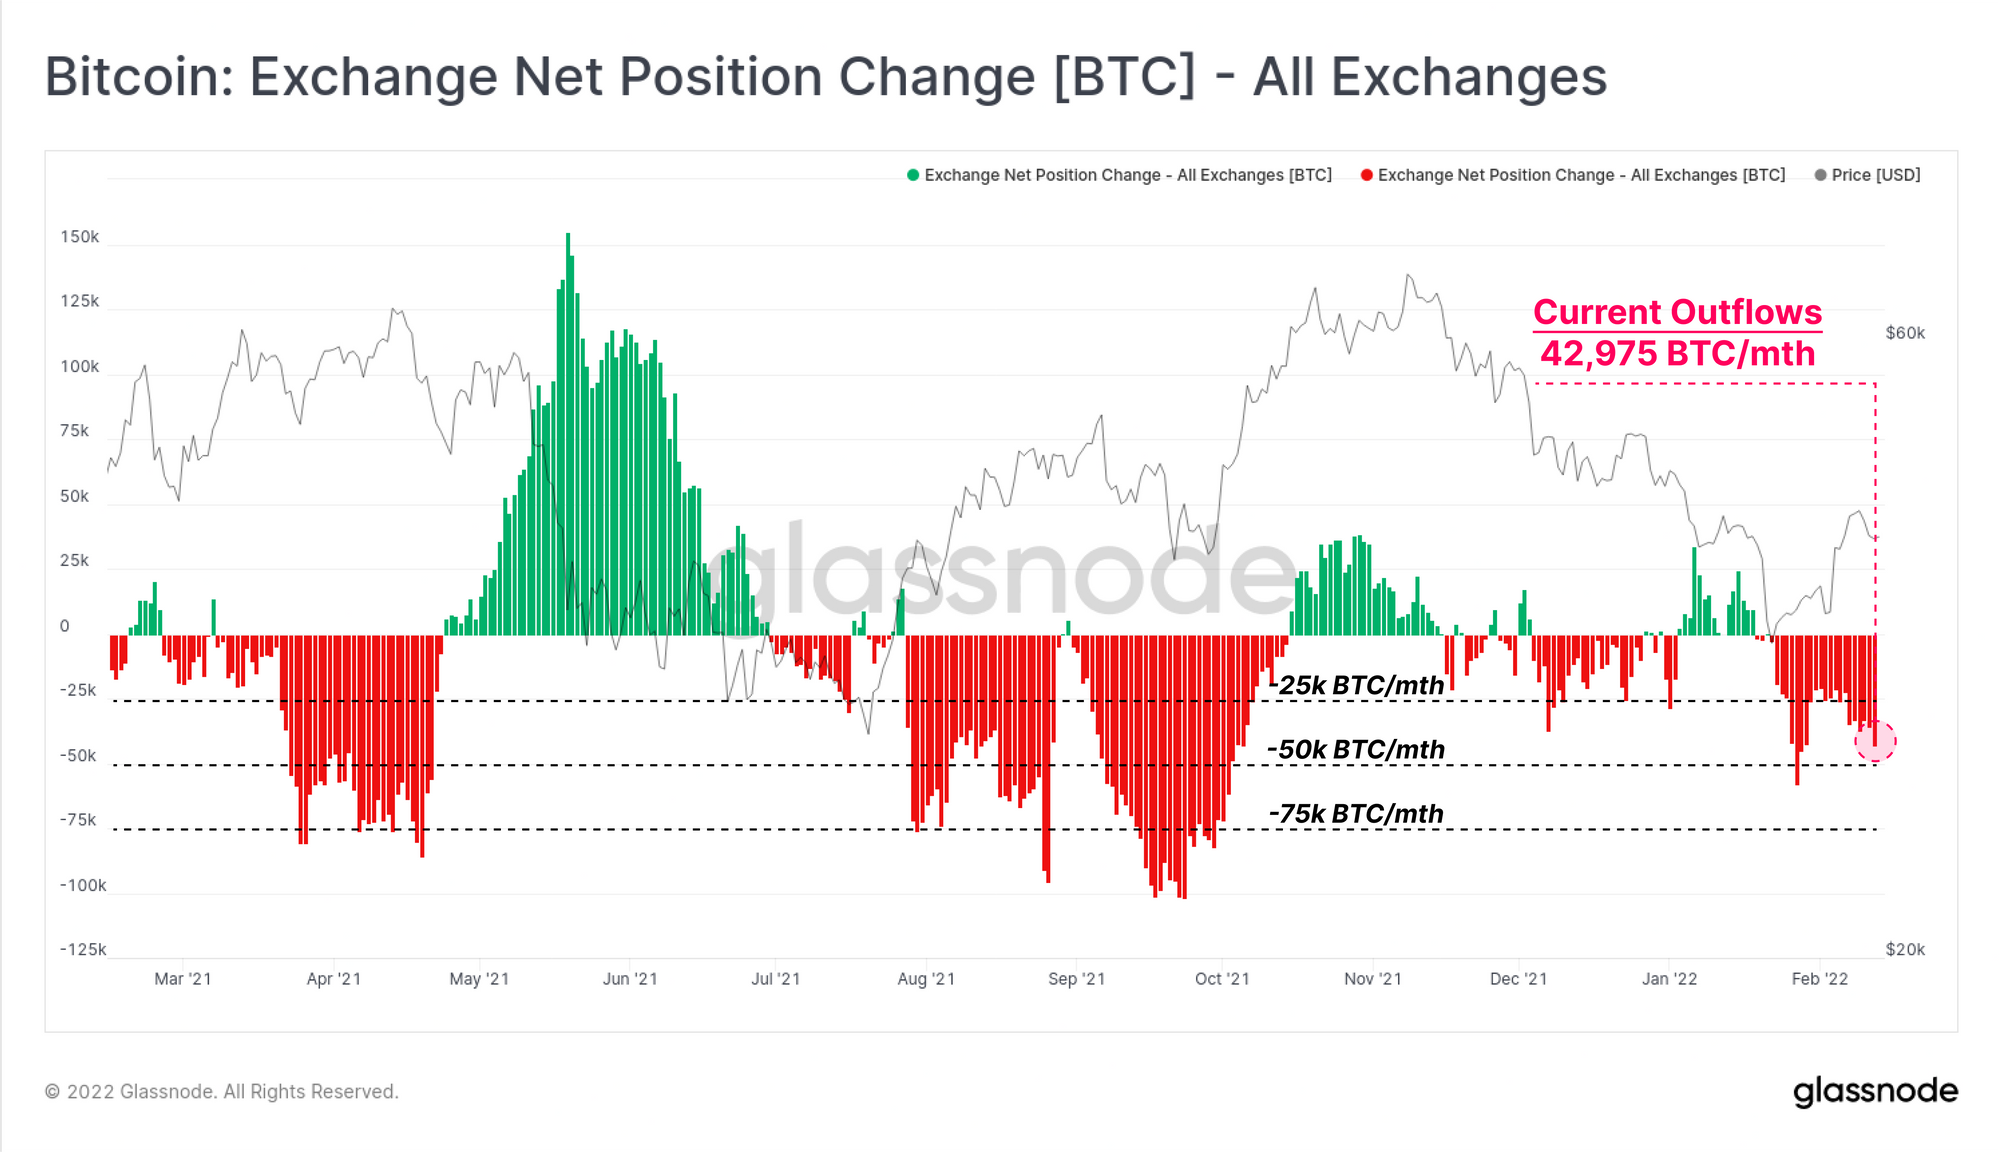
As noted above, investor de-risking in prior Bitcoin market cycles was best expressed by the sale of coins in spot markets, as investors reducing their exposure. In this instance, we would usually expect to see a period of net coin inflows to exchanges, a phenomena that was observed from May to July 2021.
However, in the current market, we continue to see net coin outflows at a non-trivial rate. Across all exchanges we track, BTC is flowing out of reserves and into investor wallets at a rate of 42.9k BTC per month. This trend of net outflows has now been sustained for around 3-weeks, supporting the current price bounce from the recent $33.5k lows.
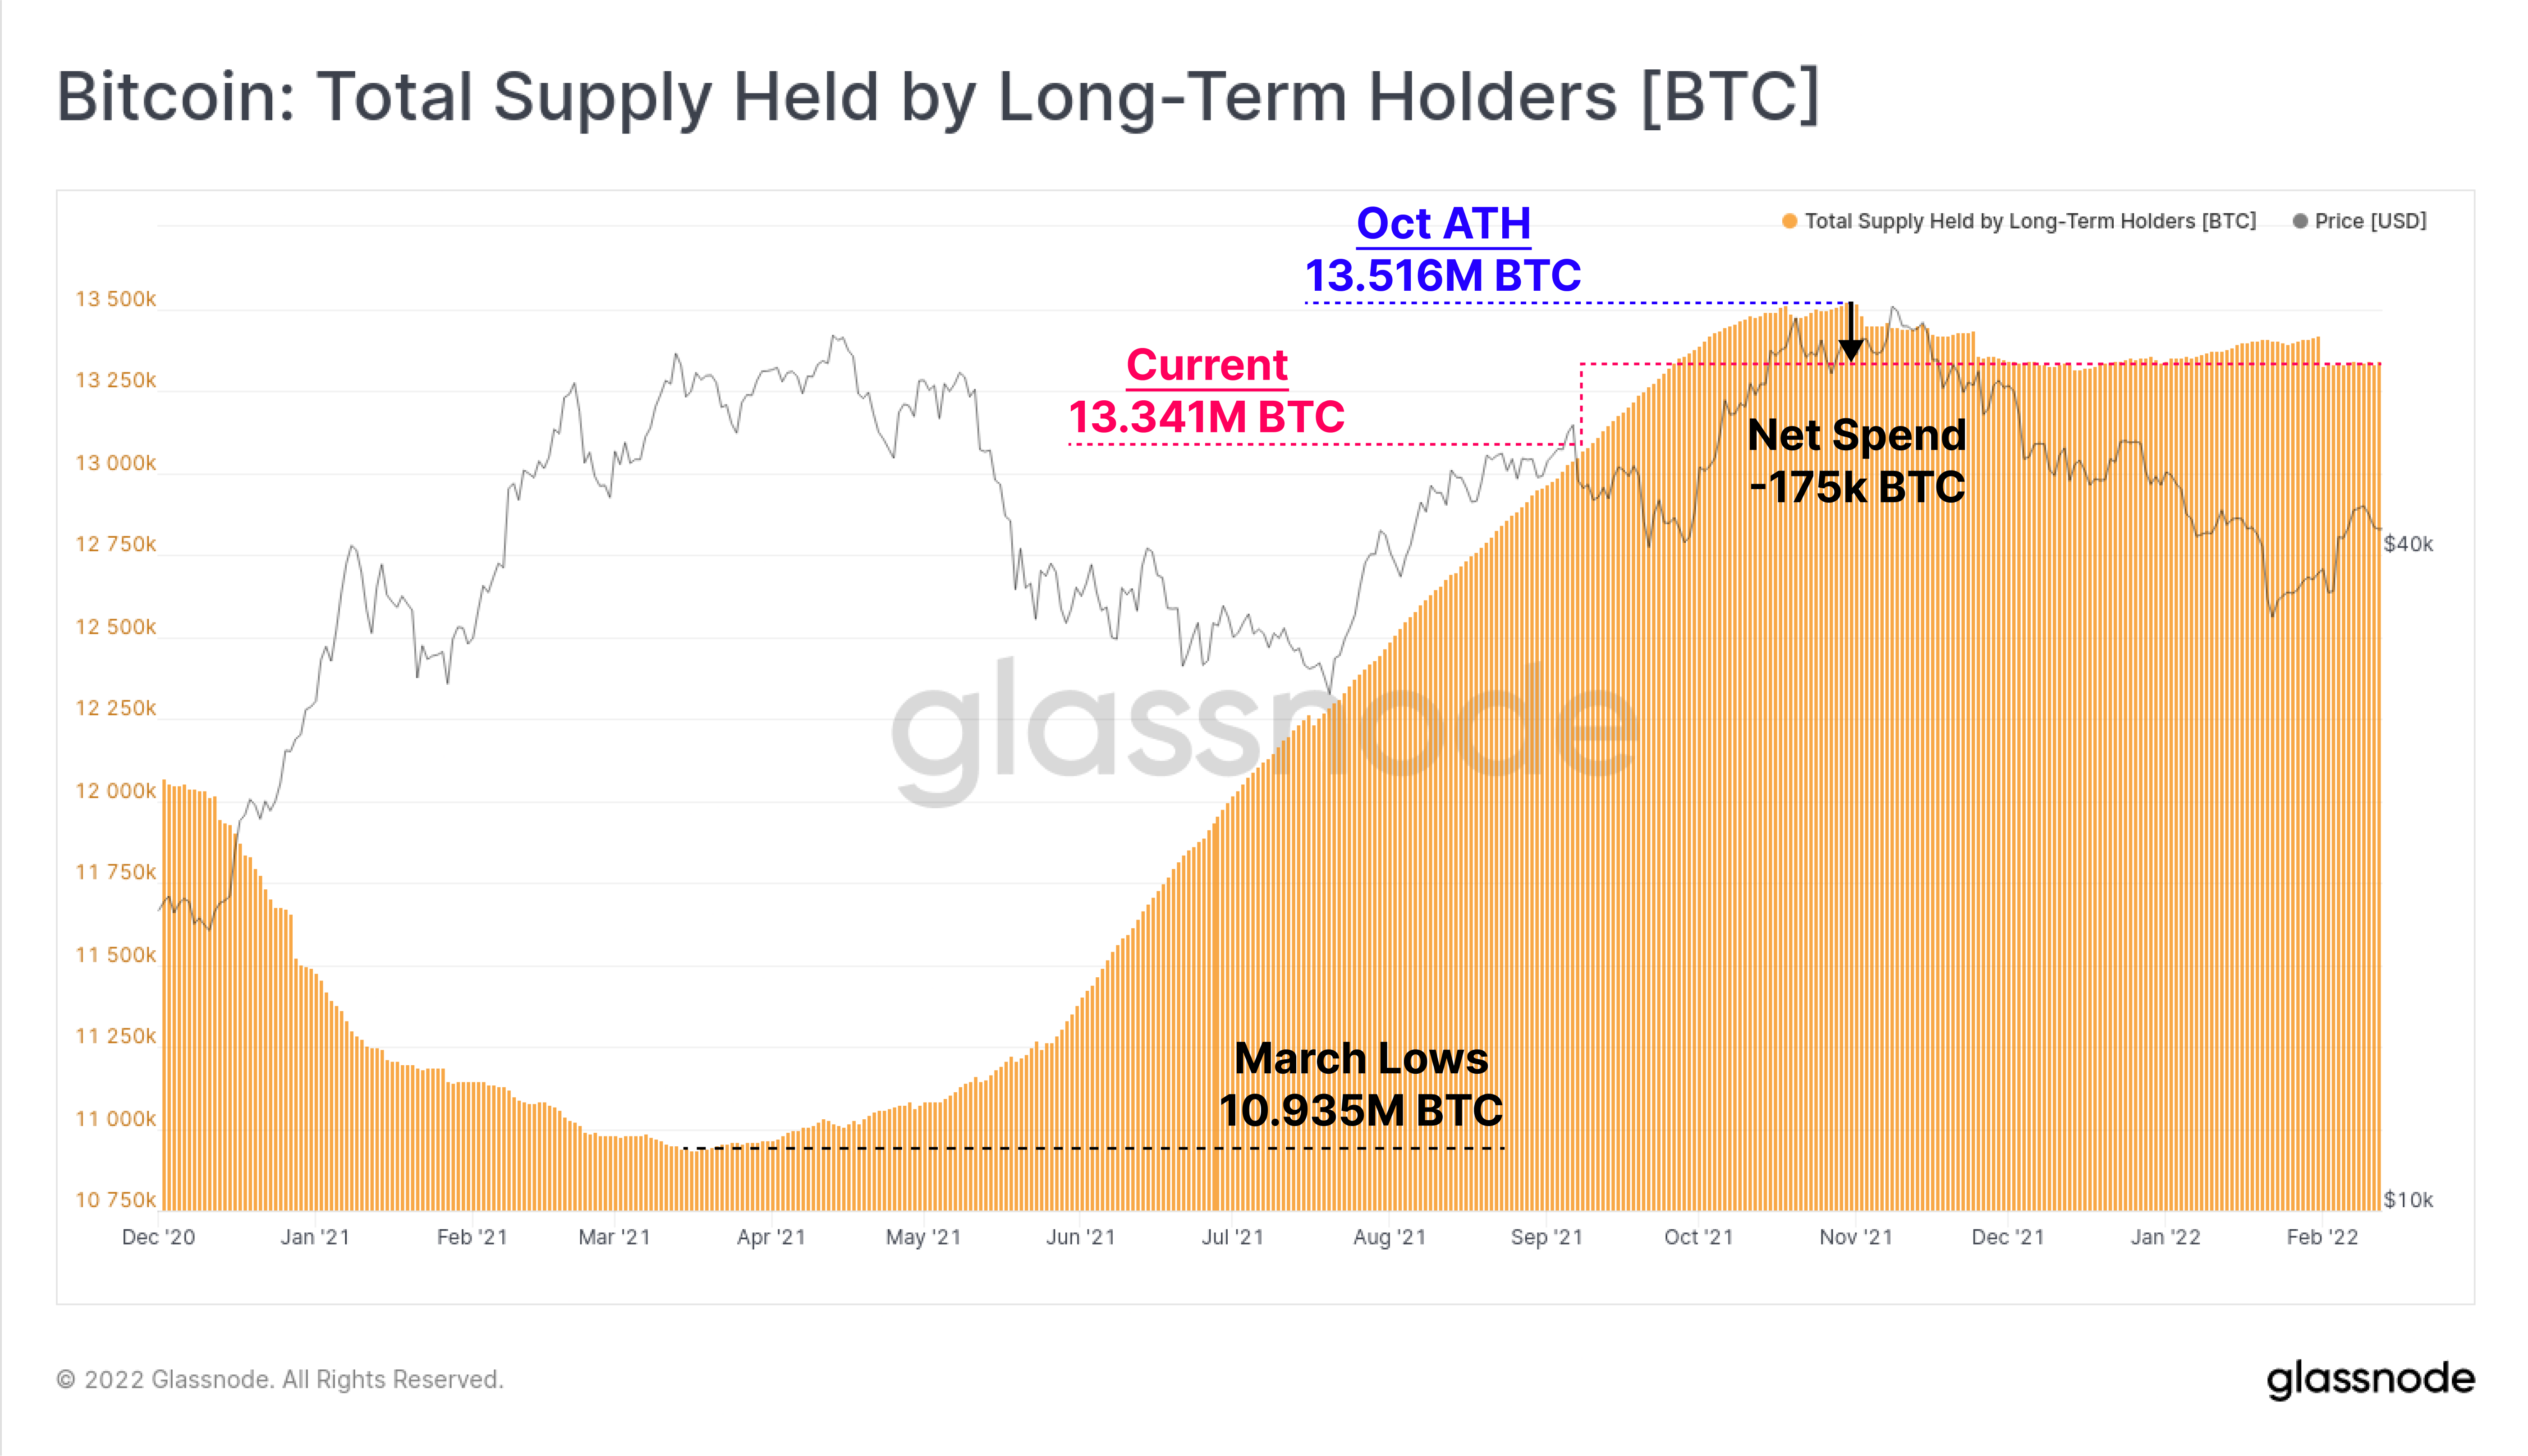
Long-Term Holder (LTH) supply has continued to hold a sideways trend, with a total supply held of around 13.341M BTC. There is almost always a consistent flow of coins maturing from Short into Long-term holder status. As such, this indicates that the degree of LTH spending is approximately equal and opposite to the degree of coin maturation.
Since the October ATH, LTHs have spent only 175k BTC on net, demonstrating a remarkably resilient cohort of hodlers, despite the prevailing macro headwinds.
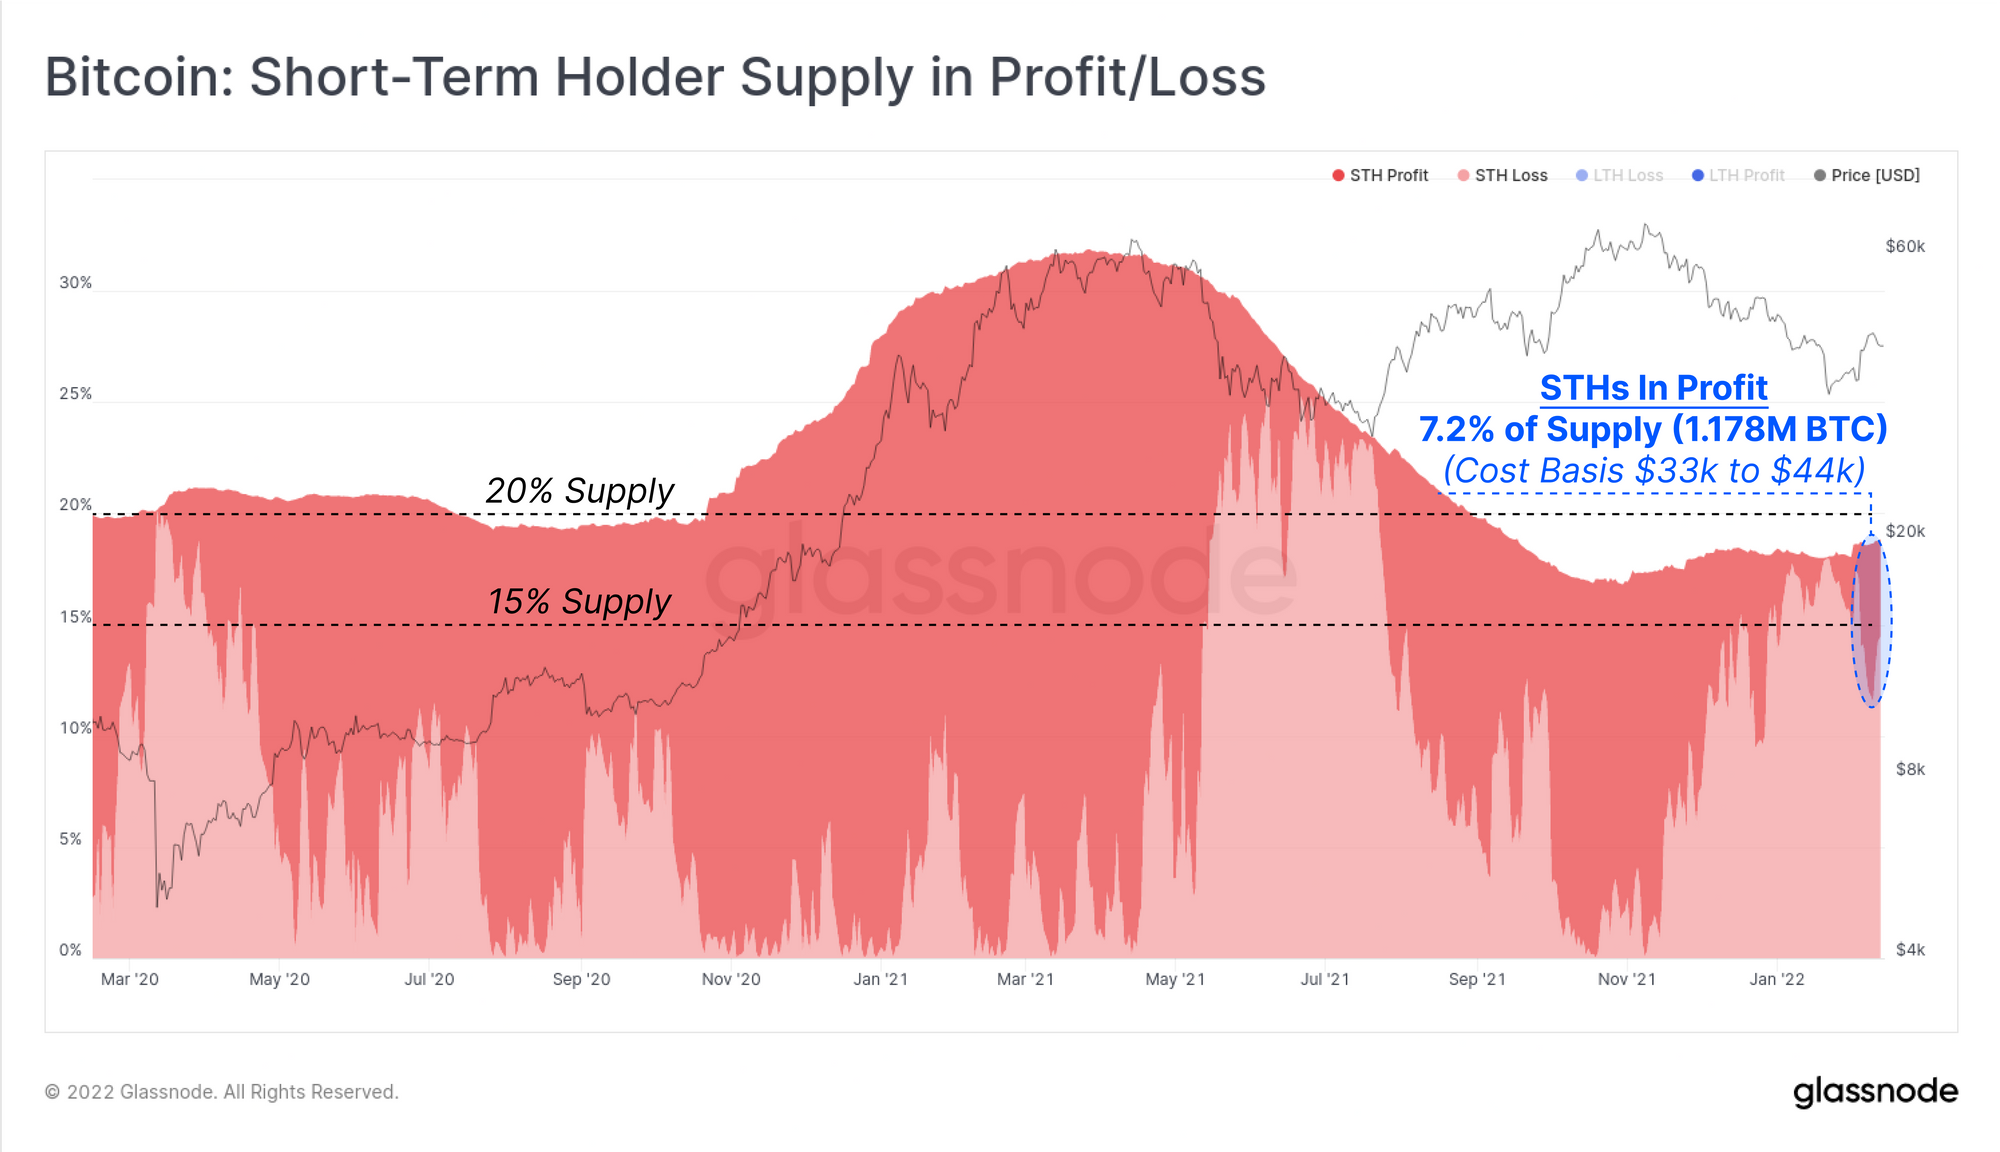
The Short-Term Holder cohort (STHs, coins younger than ~155-days), currently hold 18.85% of the supply that is outside of exchange reserves (note: LTH supply + STH supply + exchange Balance ~ Circulating supply).
7.20% out of this 18.85% has recently returned to an unrealised profit during the price rally above $44k. This indicates that 1.178M BTC were spent (assumed to have changed hands) as prices traded between $33.5k and $44.0k. In other words, 7.2% of the coin supply held outside exchanges has been re-accumulated over the last three weeks, providing an indication of underlying demand in the current price range.
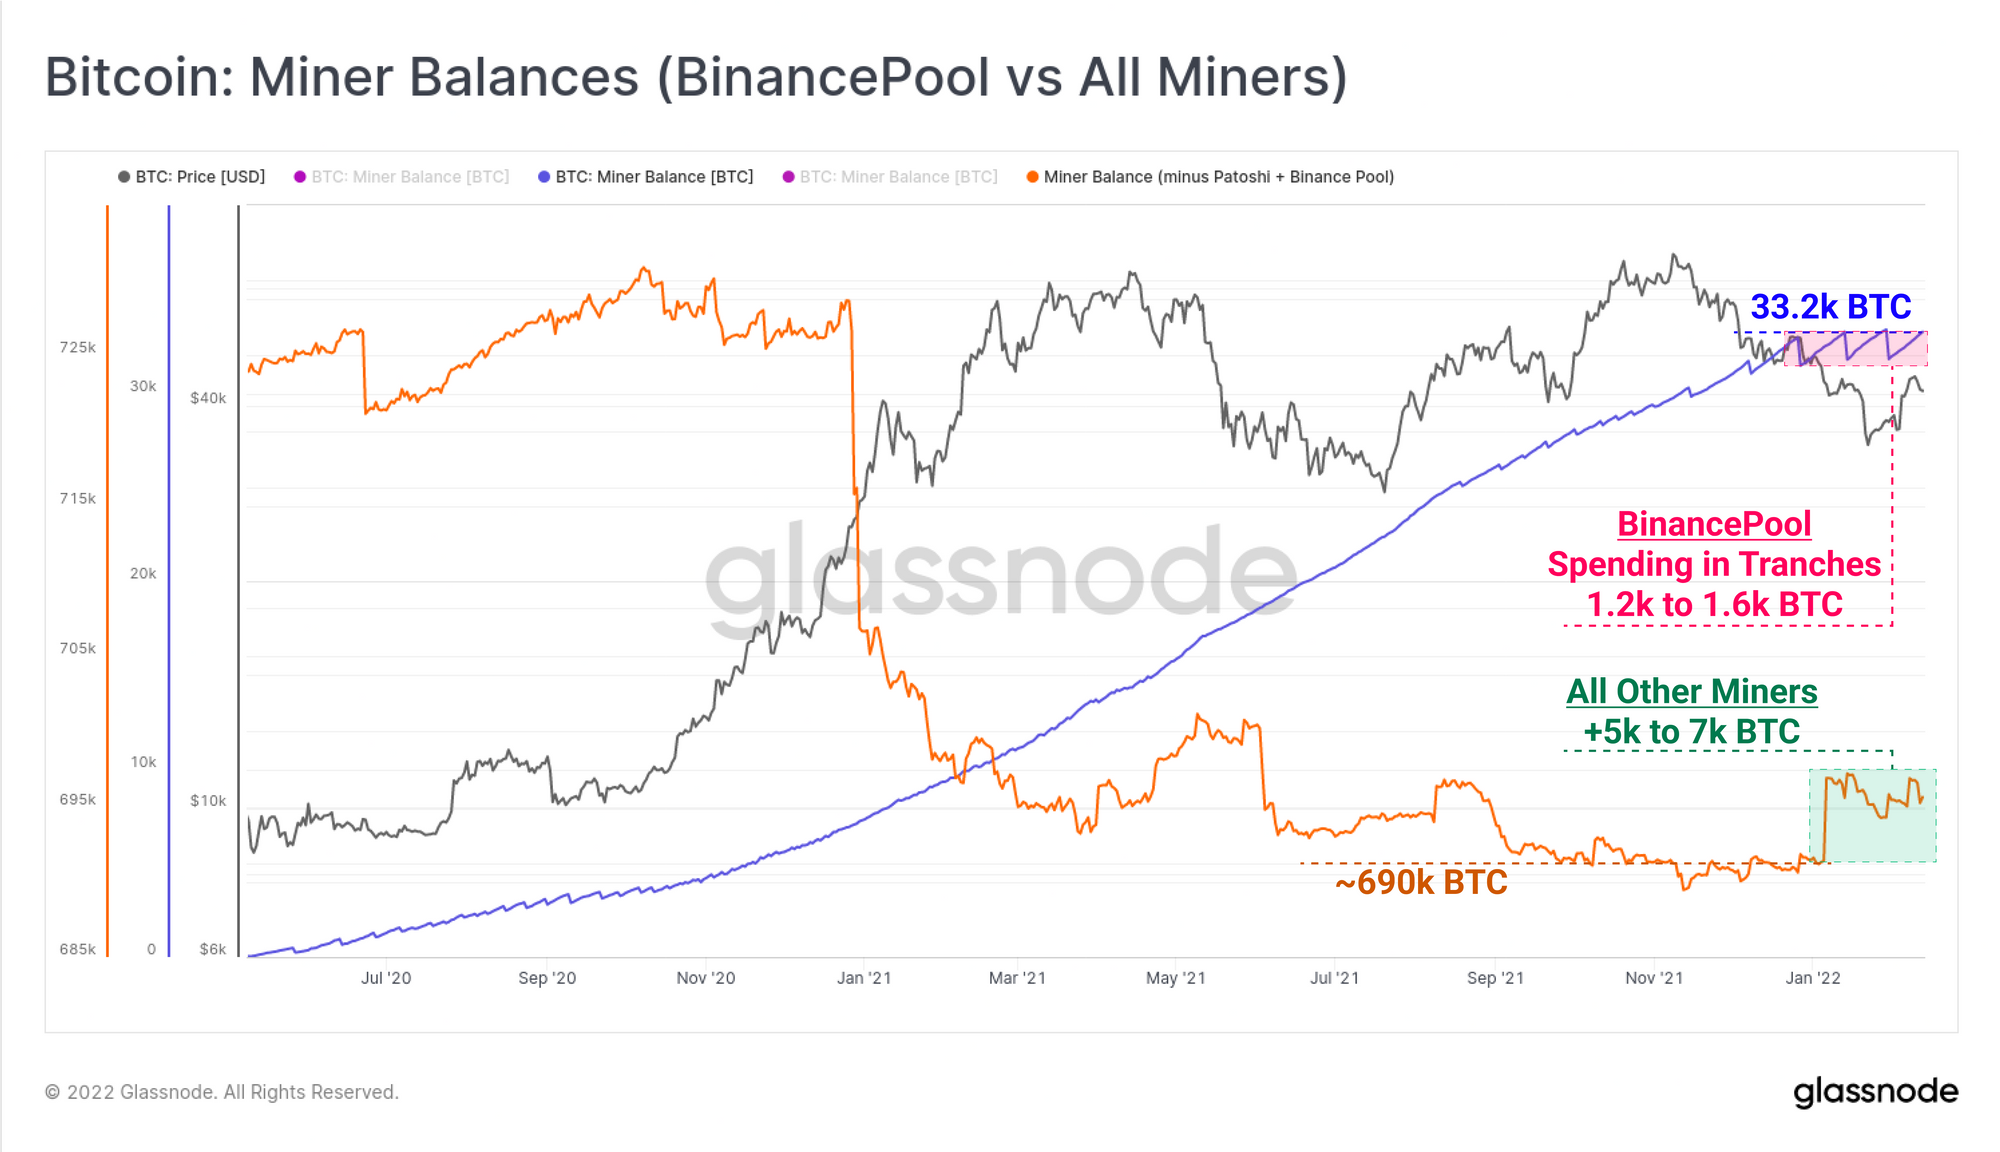
Miners also continue to display an intriguing preference for coin accumulation or distribution. The chart below presents two different cohorts of miners, whom have divergent behaviour in their treatment of mined supply:
- BinancePool (blue) has been a strong net accumulator of mined coins since mid-2020, having amassed a reserve of 33.2k BTC. However throughout 2022, miners associated with BinancePool have been spending in semi-regular tranches of between 1.2k and 1.6k BTC.
- All other miners and pools (orange) have been much heavier distributors throughout 2020-21, with aggregate balances reaching multi-year lows of around 690k BTC in Oct-Nov last year. Countering the recent spends by BinancePool, this miner cohort have added between 5k to 7k BTC to their aggregate reserves in 2022.
Overall, miner balances are climbing in aggregate, however the chart below demonstrates that the majority of this accumulated supply is driven by miners associated with BinancePool.
We can also investigate large wallet holdings, often referred to as whales, to see if there is a net accumulation or distribution in play. However, it is important to note that interpretation of 'whale holdings' requires a very nuanced analysis approach, and is rarely as straight forward as watching changes in an aggregate wallet cohort.
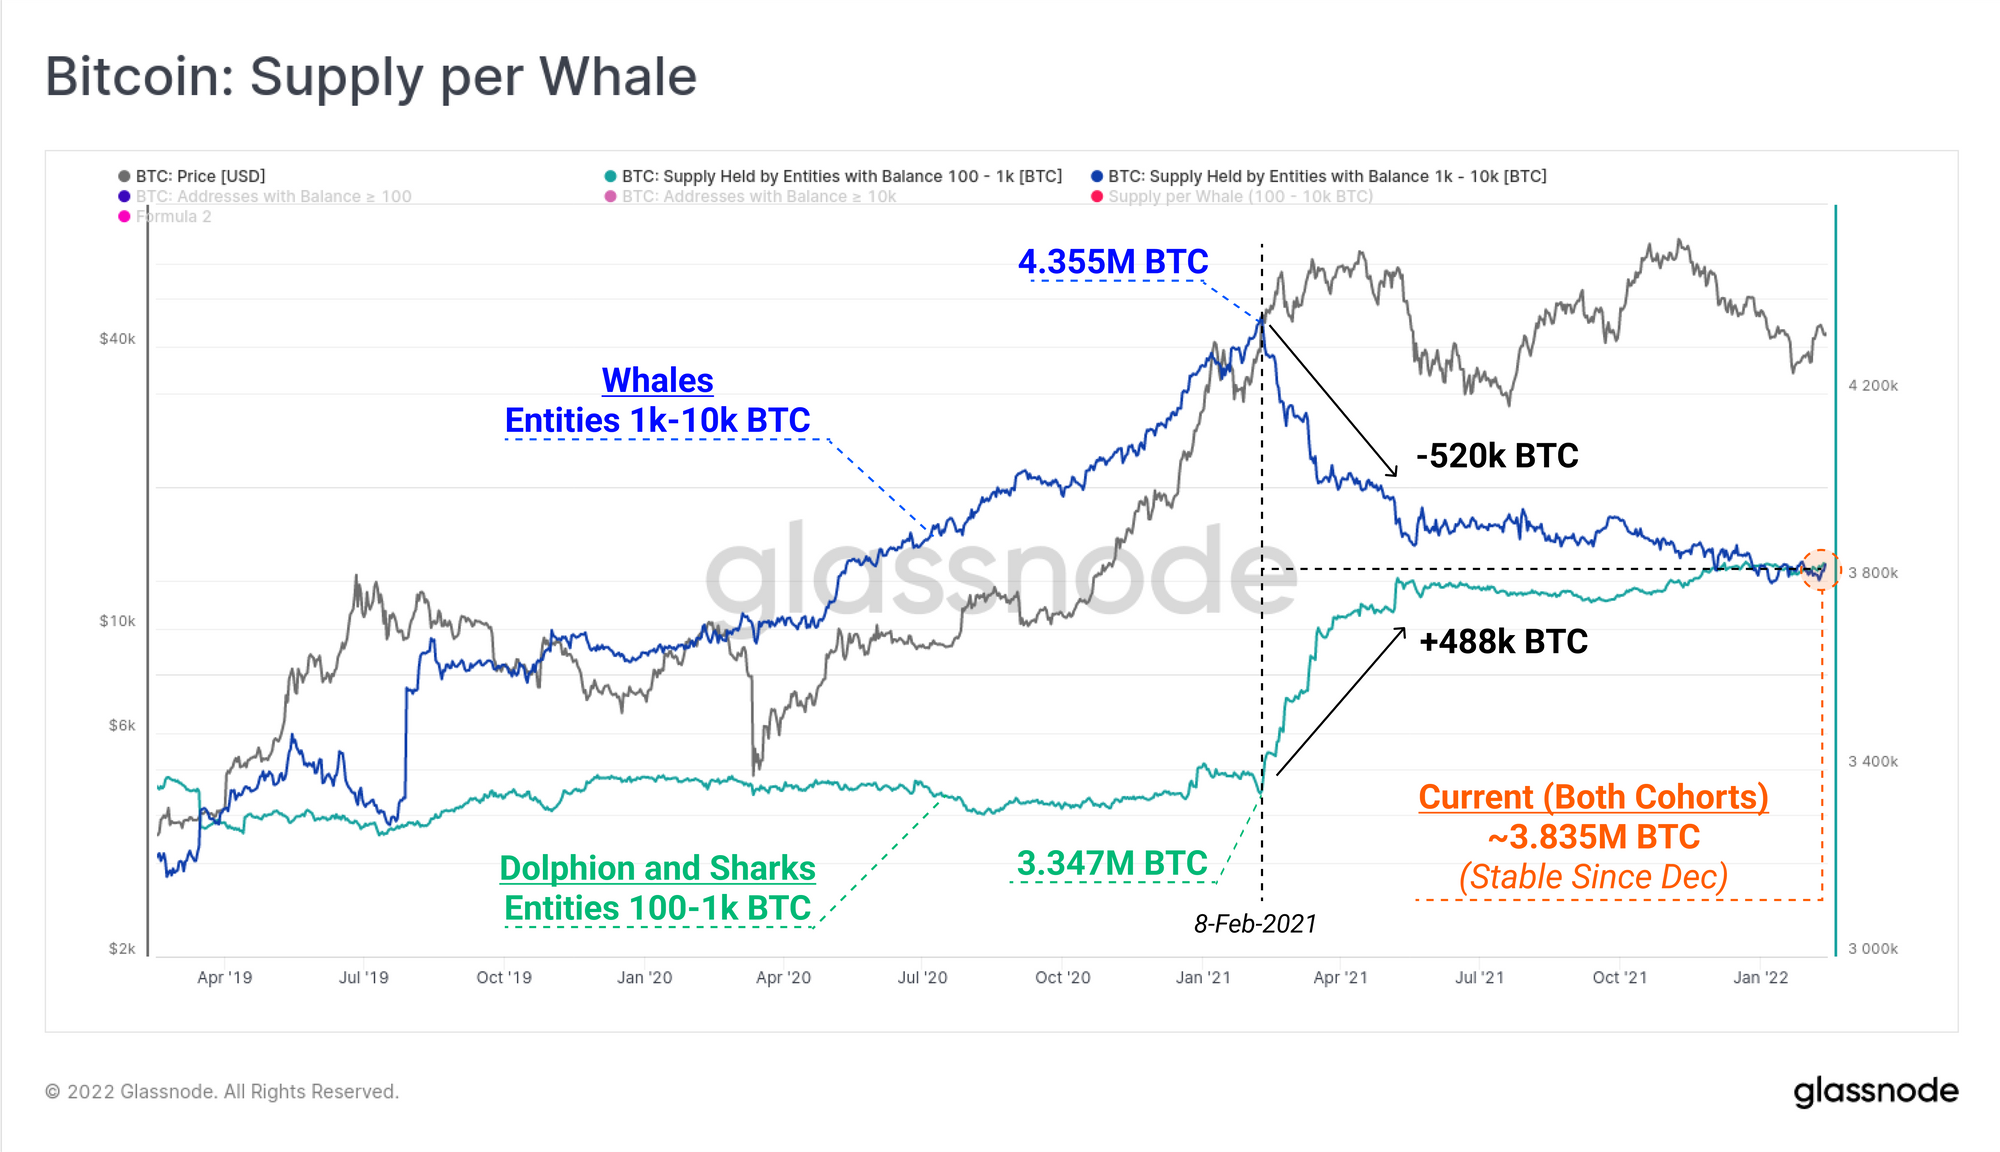
The chart below presents two curves, reflecting wallet balances of millions of USD in value:
- Supply held by entities with 100-1k BTC (teal)
- Supply held by entities with 1k-10k BTC (dark blue)
What we can see is an almost equal and opposite change in total supply held in these two cohorts throughout 2021. As the supply held by 1k-10k cohorts declined by 520k BTC, the supply held by 100-1k cohorts increased by 488k BTC. Finer grained analysis would reveal whether these coins were bought, sold, or simply reconfigured into a greater number of smaller value UTXOs.
In aggregate however, through the course of 2021-22, this leaves a net of -32k BTC that migrated out of these wallet cohorts. This is arguably a small coin volume when spread over a year long process of redistribution, and also relative to the present monthly rate of exchange outflows (42.9k BTC/mth).
In summary this week, it appears that investors are deleveraging and utilising derivatives markets to hedge out risk, and buy downside protection, with a keen eye on the Fed rate hikes expected in March. Meanwhile, overall on-chain supply dynamics appear to be in a form of equilibrium. Both Long- and Short-Term holder supplies are range-bound, miner balances are on aggregate flat to slightly higher over the last few weeks, and whale supply (100-10k BTC wallets) have been flat since December.
Unlike previous Bitcoin cycles, the sale of spot holdings does not appear to be the preferred de-risking strategy. This reflects an increasingly mature market, with a growing suite of derivative instruments available for risk managers.
Weekly Feature: New Bitcoin Supply Metrics
As Bitcoin market dynamics change over time, analysts must pay attention to a growing set of 'locations' where Bitcoin may be locked up, and flow in/out of. The section below introduces a number of new metrics available on Glassnode Studio to track various concentrations of Bitcoin supply.
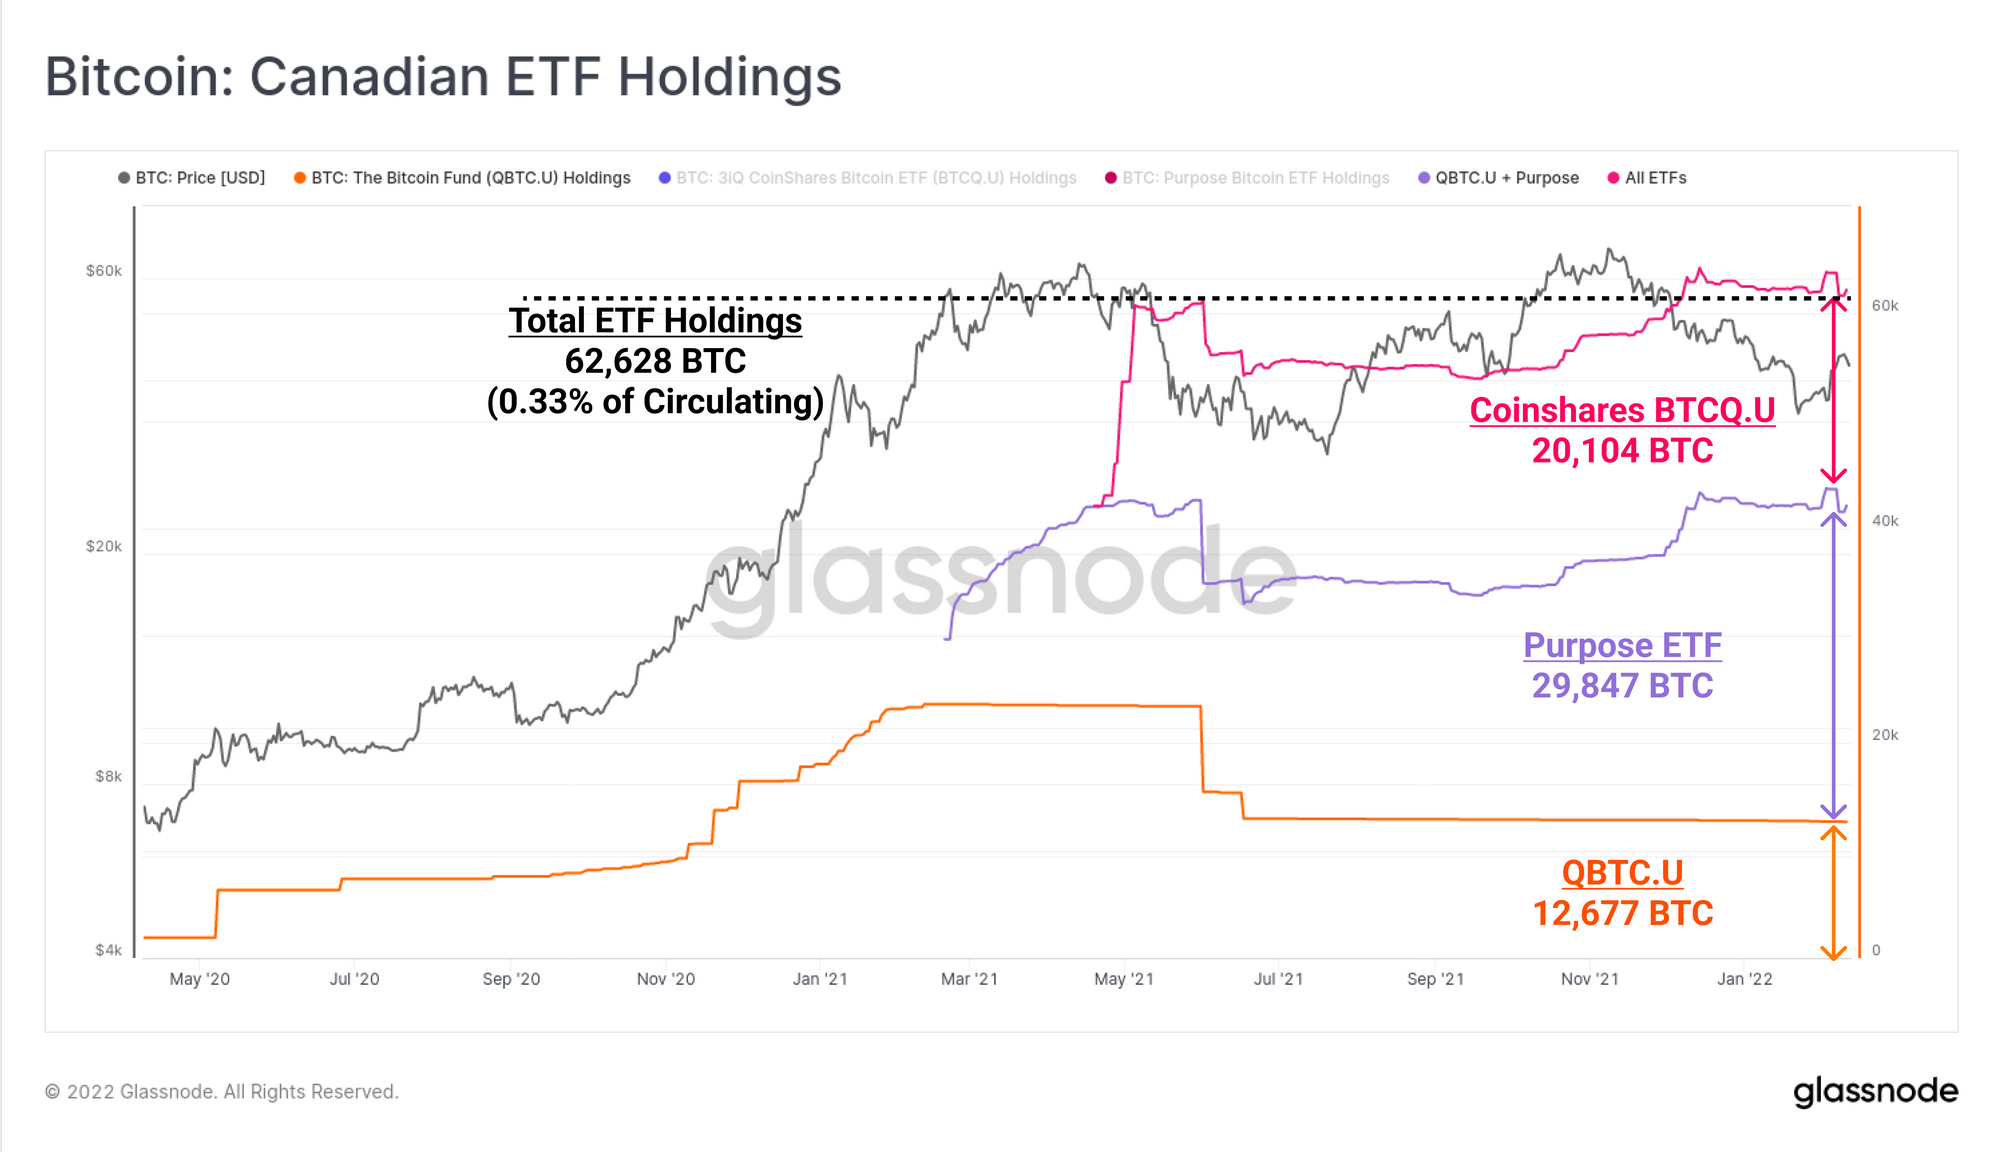
There are now three Bitcoin ETFs trading in Canada:
- The Bitcoin Fund QBTC.U (orange)
- Purpose Bitcoin ETF (purple)
- Coinshares BTCQ.U (pink)
Collectively, these ETFs now hold a total of 62,628 BTC, representing 0.33% of the circulating supply, with the Purpose ETF representing 47.6% of the total.
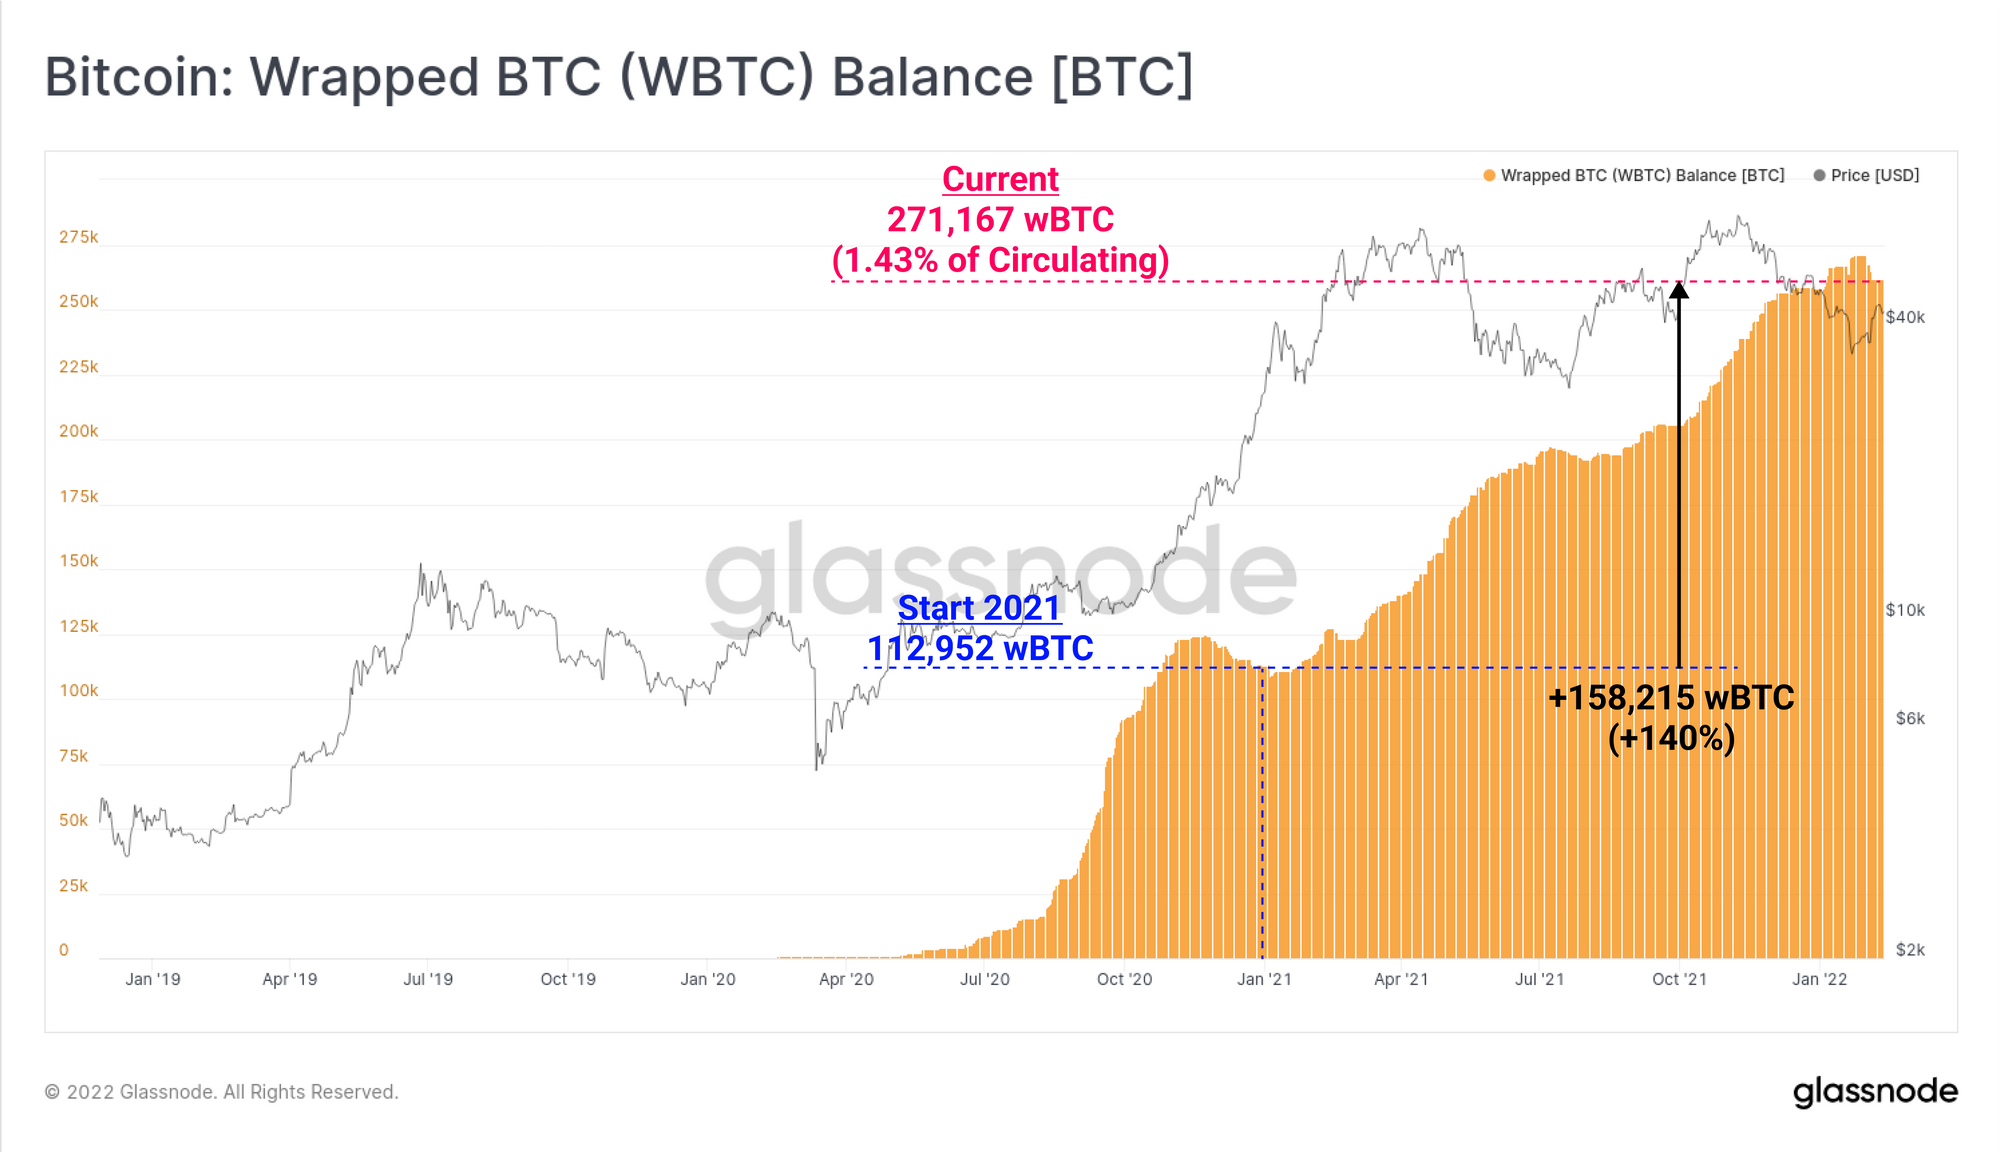
The wrapping of Bitcoin into wBTC for use within the Ethereum ecosystem has been in impressively high demand, having now absorbed 271,167 BTC, over 1.43% of circulating supply. wBTC supply has expanded by 140% since the start of 2021, growing by 158.2k BTC.
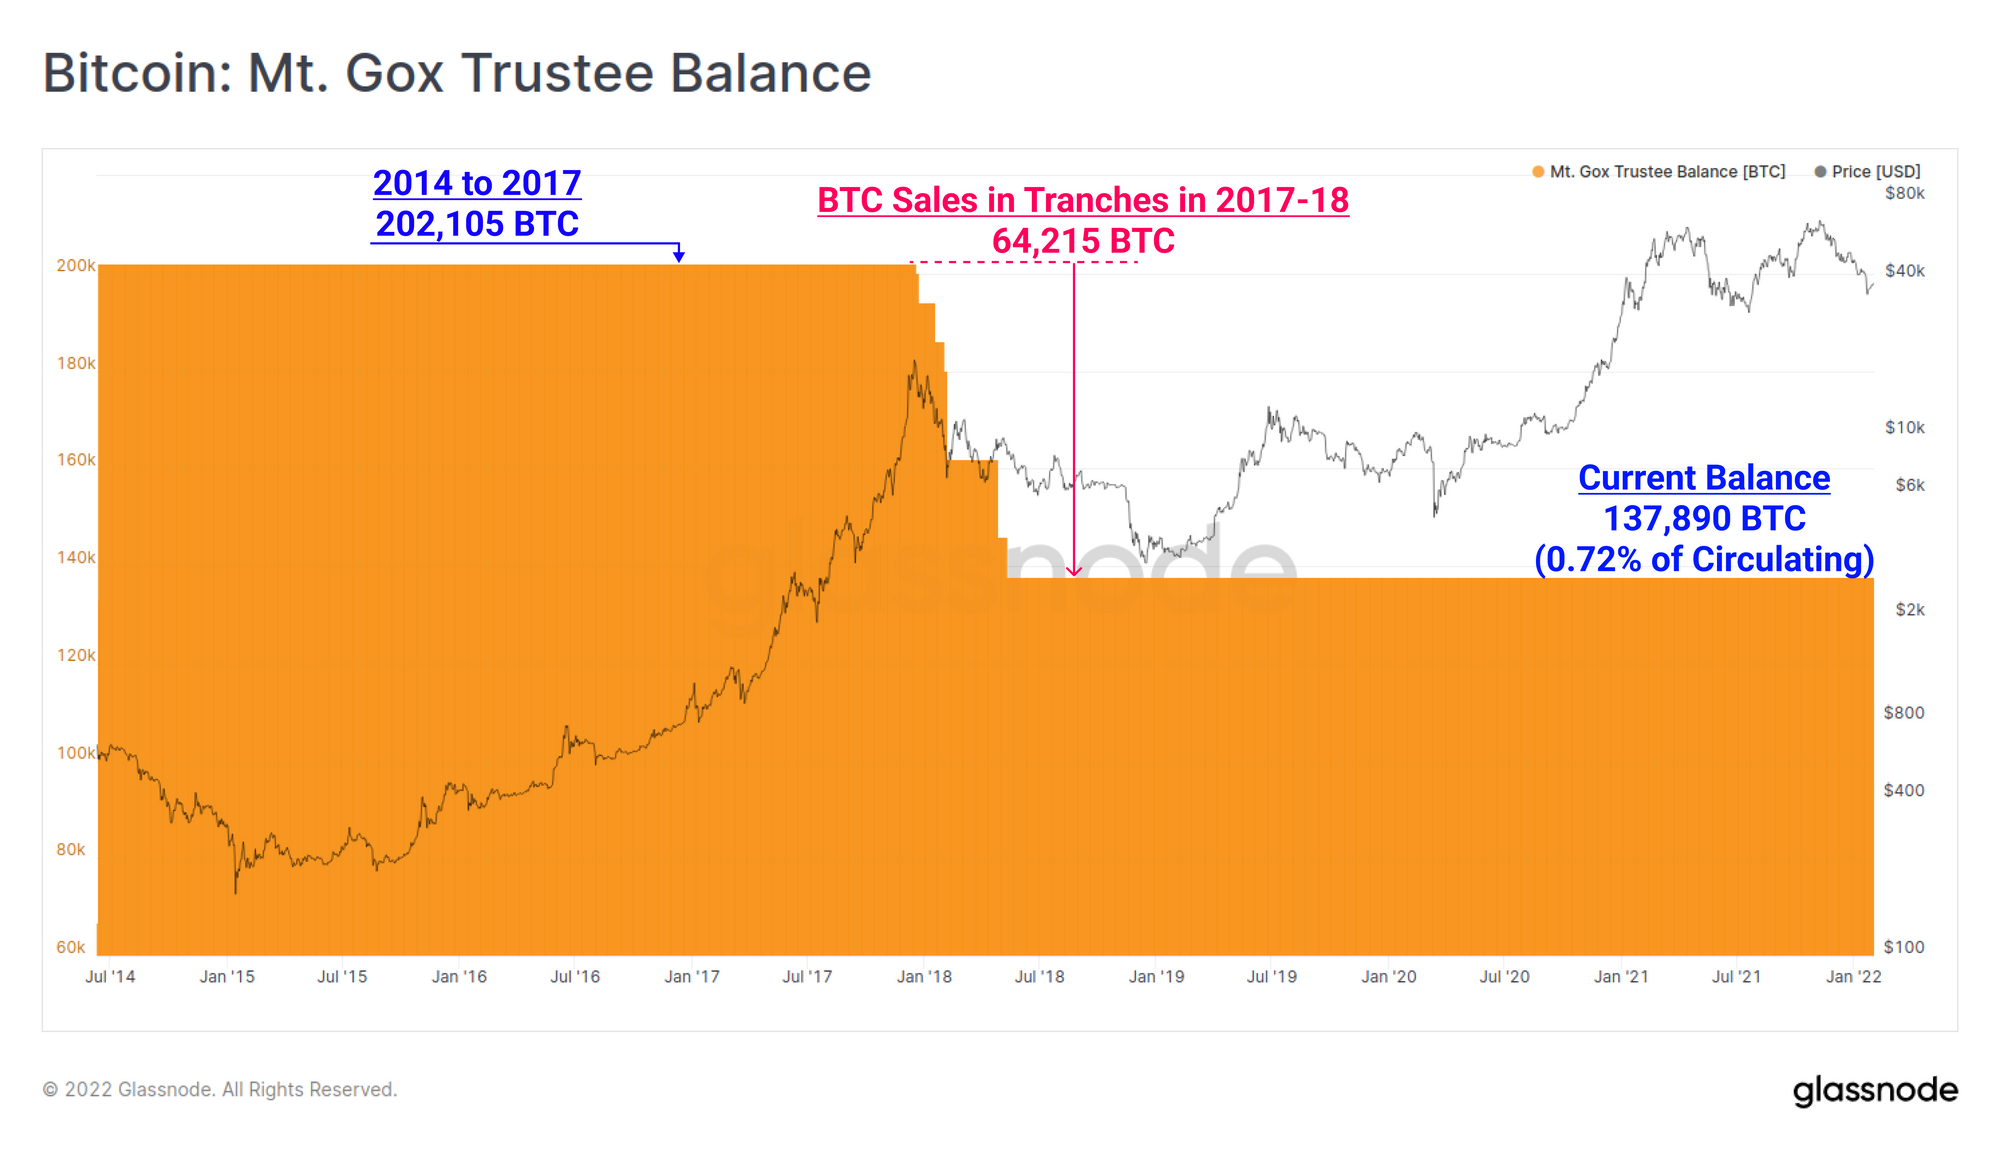
Finally, as the long-running Mt Gox rehabilitation proceedings continue, metrics presenting the balance of coins held by the Mt Gox Trustee, Nobuaki Kobayashi, are now live. After a series of sale tranches in 2017-18, the total balance of coins controlled by the Mt Gox Trustee currently stands at 137,890 BTC, equal to 0.72% of the circulating supply. This metric will respond in the event any of the coins held are spent and moved by the Trustee.