The Week On-chain (Week 10, 2021)
Bitcoin continues it's consolidation around the $50k level this week, maintaining a strong composure despite volatility in traditional markets.


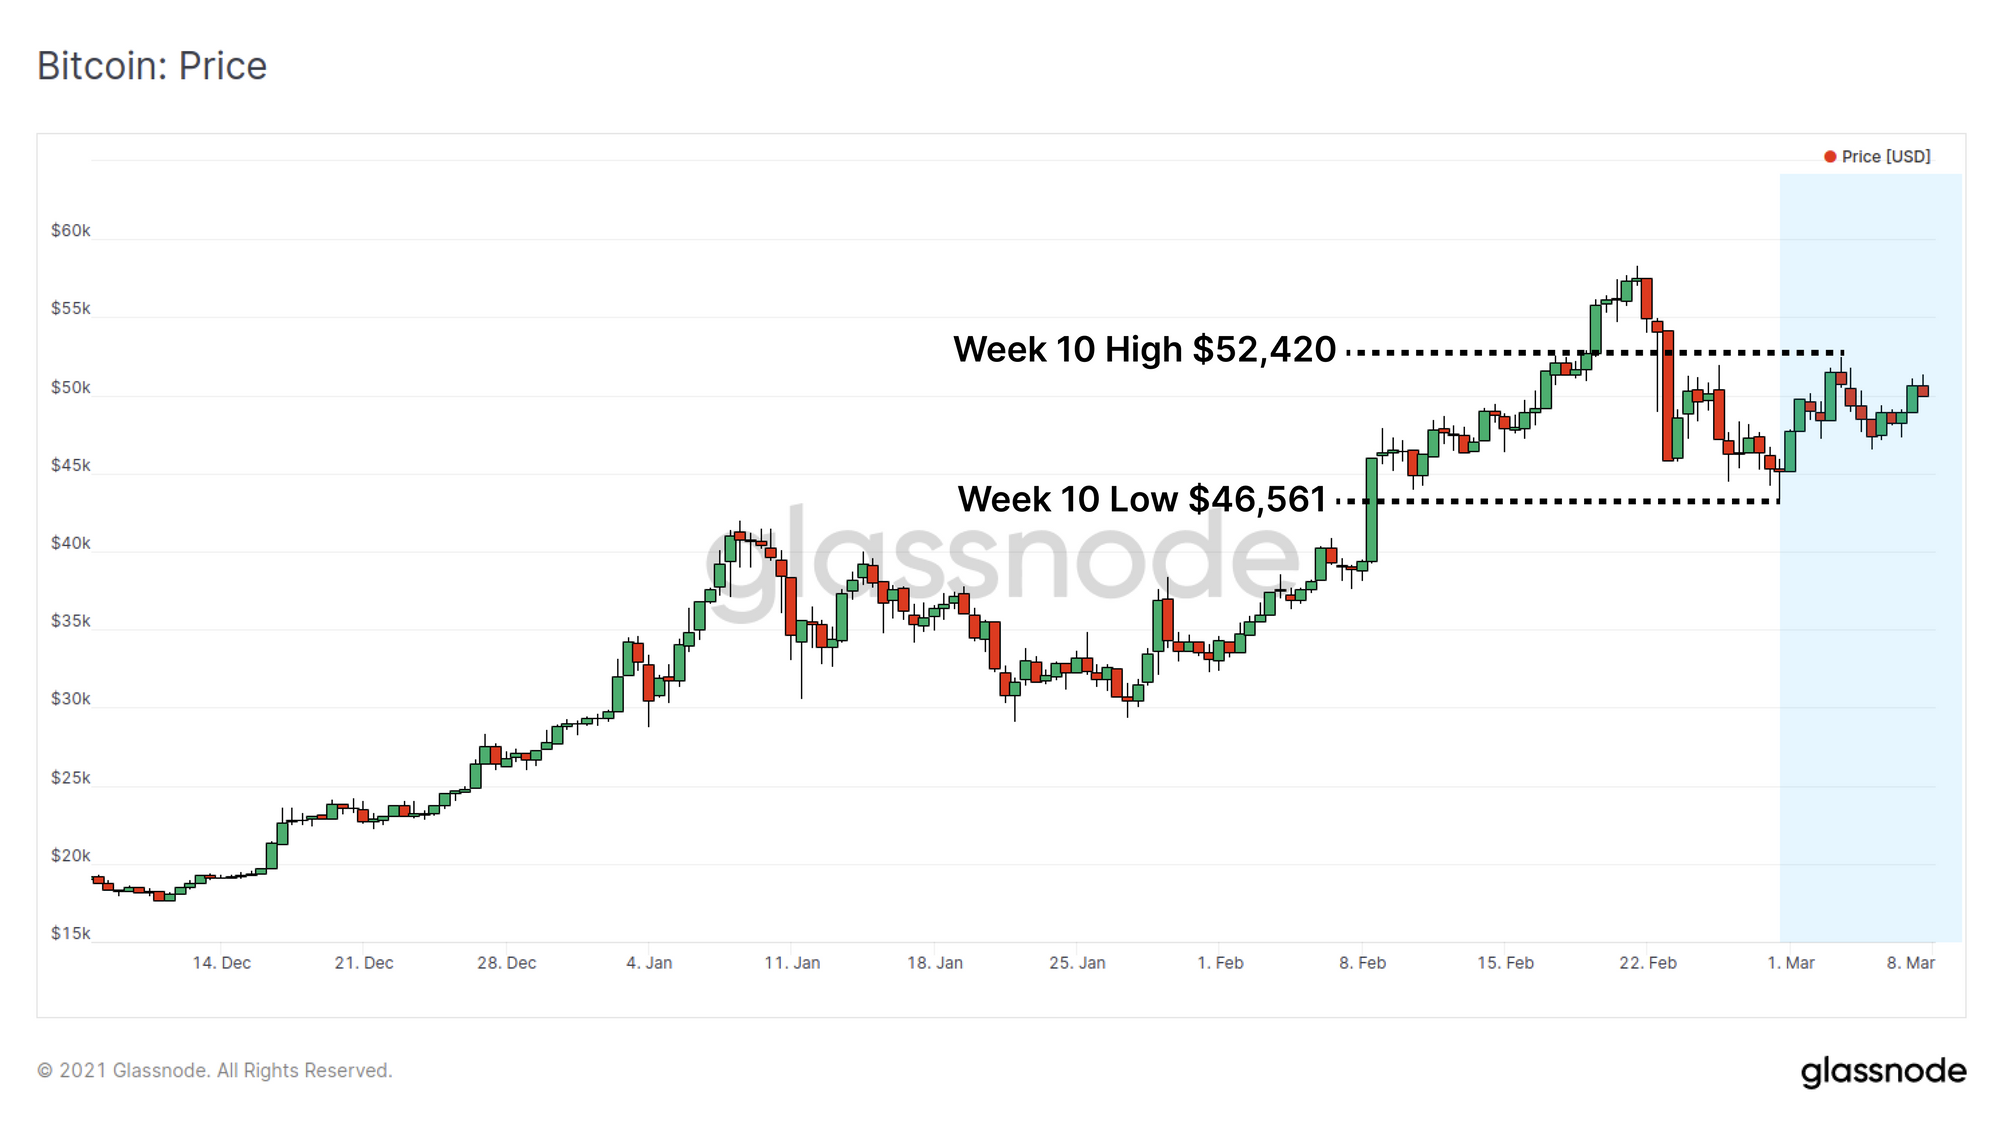
This week, volatility in the Bitcoin market has reduced as it consolidates in between a price high of $52,420 and a low of $46,561. Impressively, this Bitcoin consolidation has held the $45k on-chain support level Willy Woo identified in last weeks newsletter, despite weakness in both equities and precious metals markets.
Strength in the US 10-year treasury yield has continued to put markets on edge with yields rallying +10.7%, closing the week at a 52-week high of 1.566%. The equities market showed weakness in response with the S&P500 and NASDAQ100 indices trading down 5% and 8% intra-day, respectively, and gold falling to a 38-week low of $1,730.
Putting Bitcoin side by side with these macro assets, it is remarkable how resilient price action has been given the significance of such a rapid revaluation of treasury yields.
On-chain Support
Last week Willy Woo noted that a significant volume of BTC was transacted on-chain around $45k, forming an on-chain support level. As we closed out the week, @n3ocortex highlights that this support level has actually strengthened to rest above $46.6k, with 1.2 million BTC (6.5% of circulating supply) transacting in this zone.
When a large volume of coins move on-chain and an on-chain support level holds, it suggests that there is significant accumulation interest and buyers see it as a 'value' entry point. Keep in mind that despite on-chain support gaining strength since last week, should price fall below, it would become a level where overhead supply may form equally strong resistance.
This support is holding nicely.
— Rafael Schultze-Kraft (@n3ocortex) March 7, 2021
And it got stronger! We now have a wall of 1.2M $BTC that moved on-chain between $46.6k and $48.6k.
That's 6.5% (!) of the circulating supply.
I'd be surprised if we go below anytime soon.
I was long at <$50k, and am long now anyways.#Bitcoin https://t.co/eXcOhSmzbF pic.twitter.com/Gj3TFHVADW
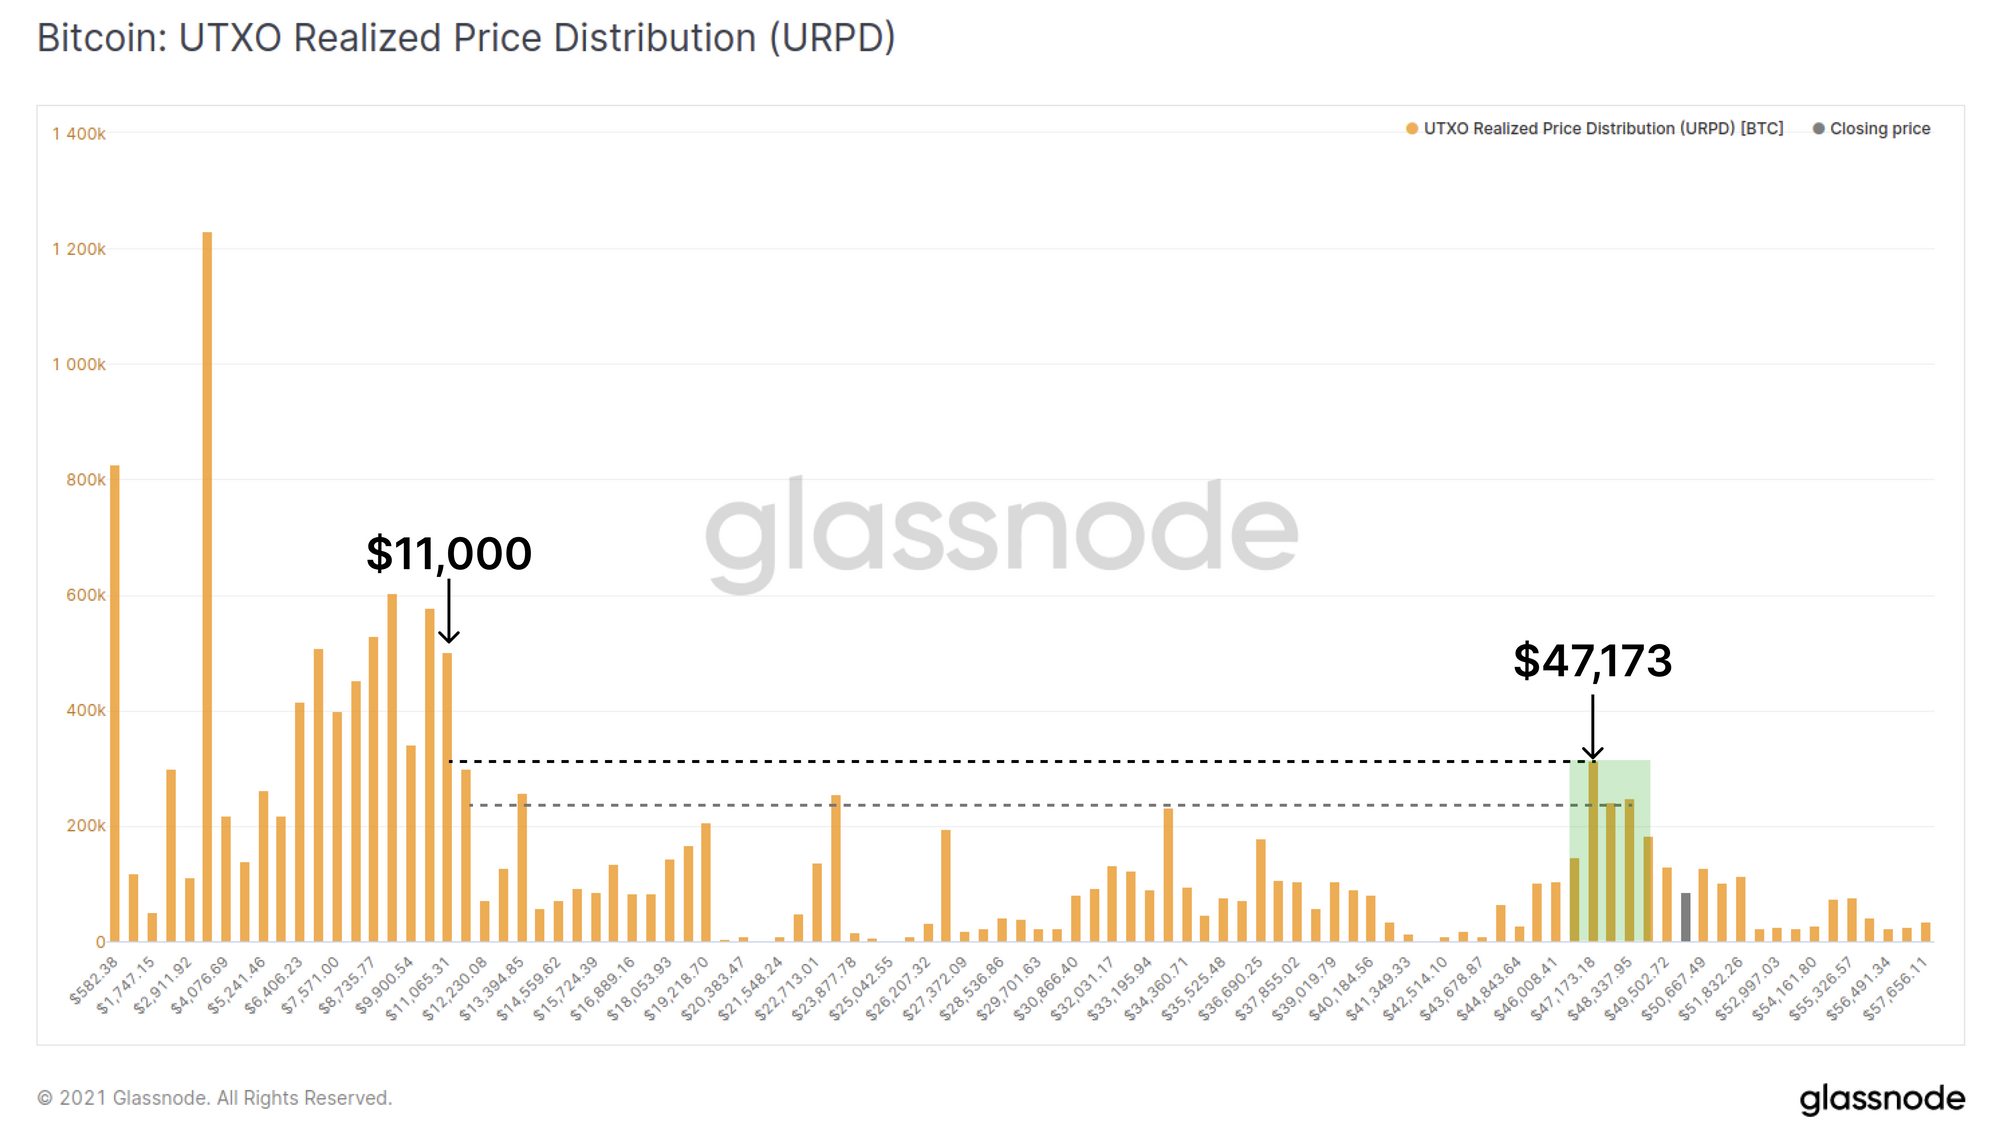
In fact, if we look at the UTXO Realized Price Distribution, the on-chain support level at $47,173 is the largest since prices were $11k. Furthermore, the block of on-chain activity shown in green below, is not just a specific floor price, but instead a large support zone. We can see sustained and significant volume has transacted between $45.5k and $48.9k. This range now represents one of the largest on-chain BTC accumulation levels in history, certainly the largest since the last cycle's $20k ATH was breached.
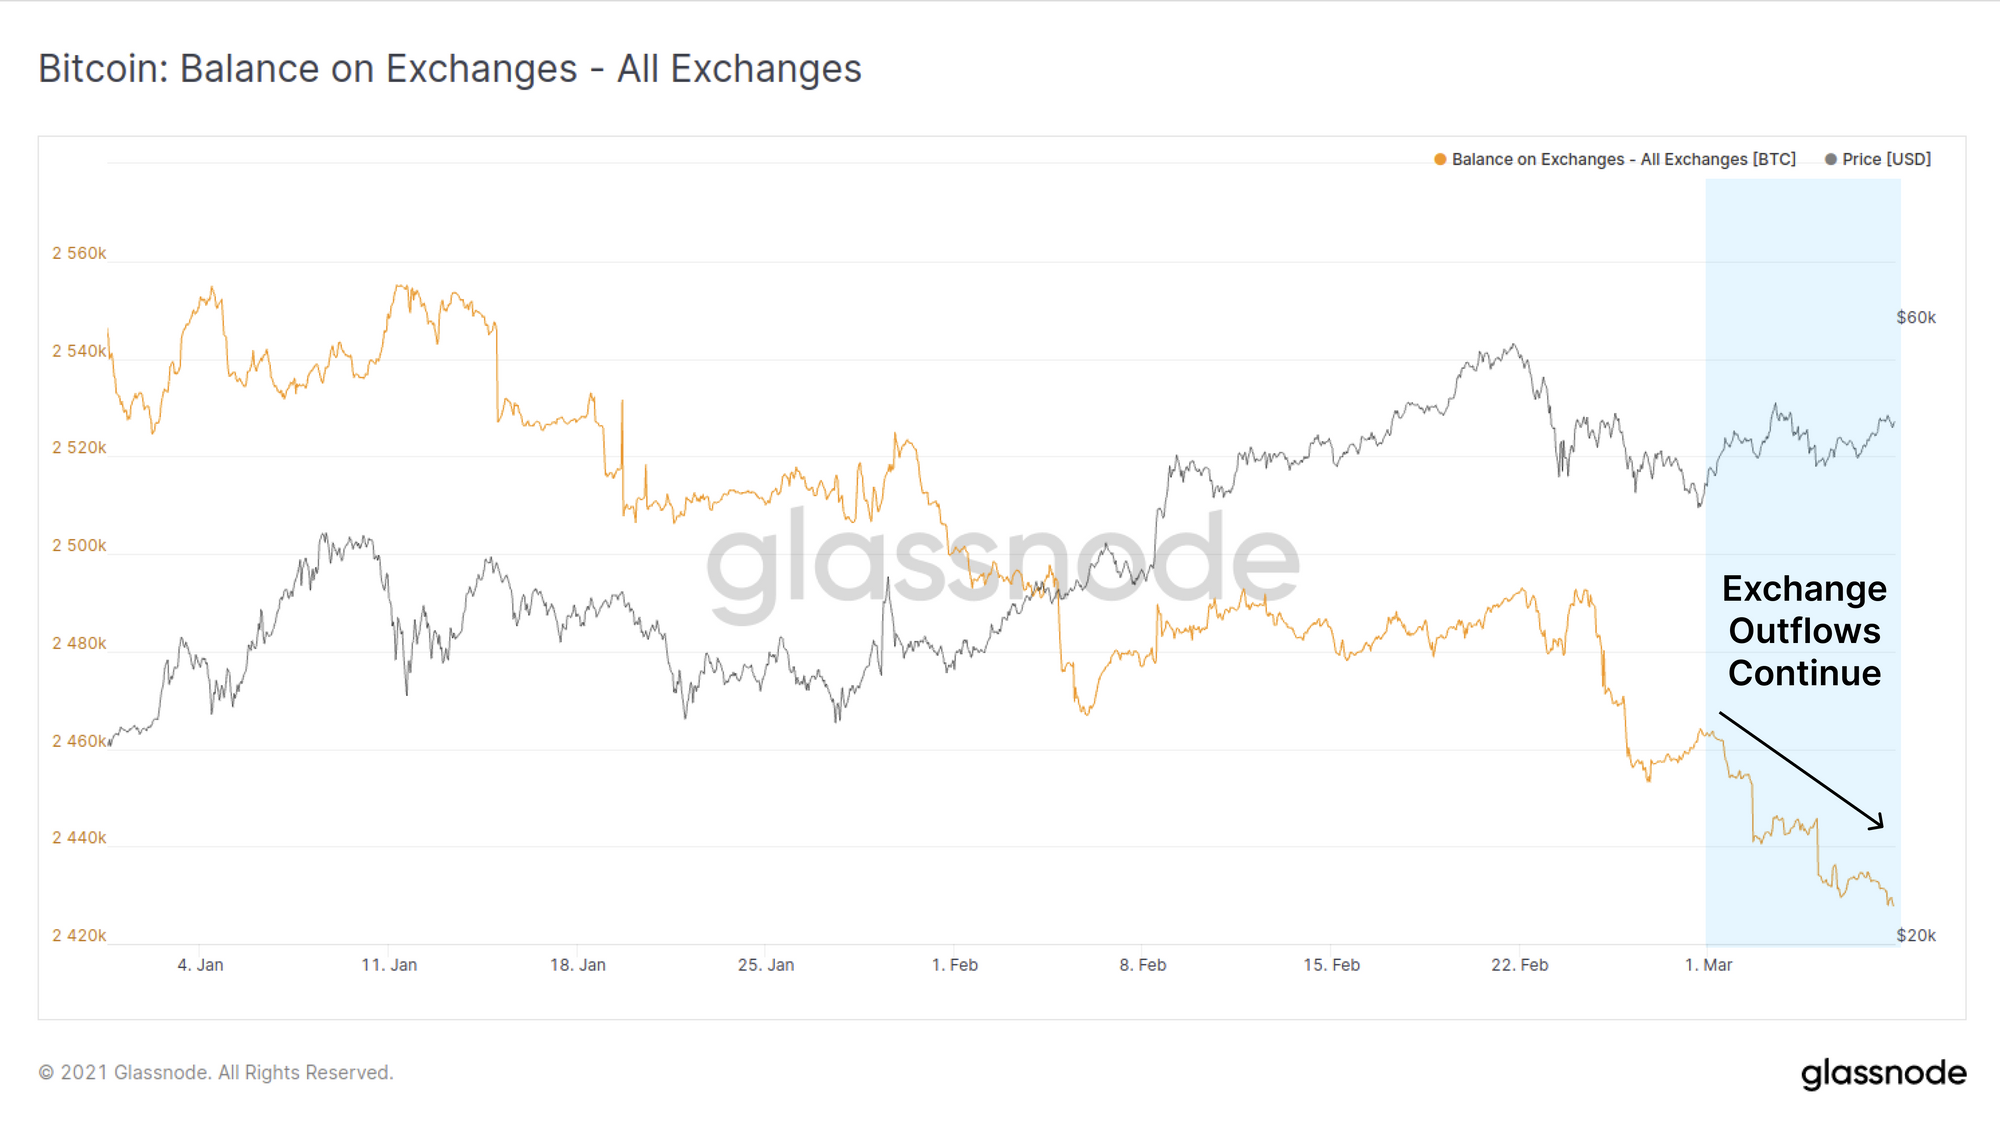
An important question we must ask is whether this volume on-chain is associated with accumulation, or is it instead a rush for the exits by sellers. As a first step, we can observe that the BTC Balance on Exchanges continues its uninterrupted march downwards with another 35,200 BTC withdrawn this week.
Miner Positions
Miners are extremely bullish Bitcoin network participant, having made huge CAPEX and OPEX investments in ASIC hardware and facilities. That said, they remain compulsory sellers of BTC to cover ongoing capital and operational costs.
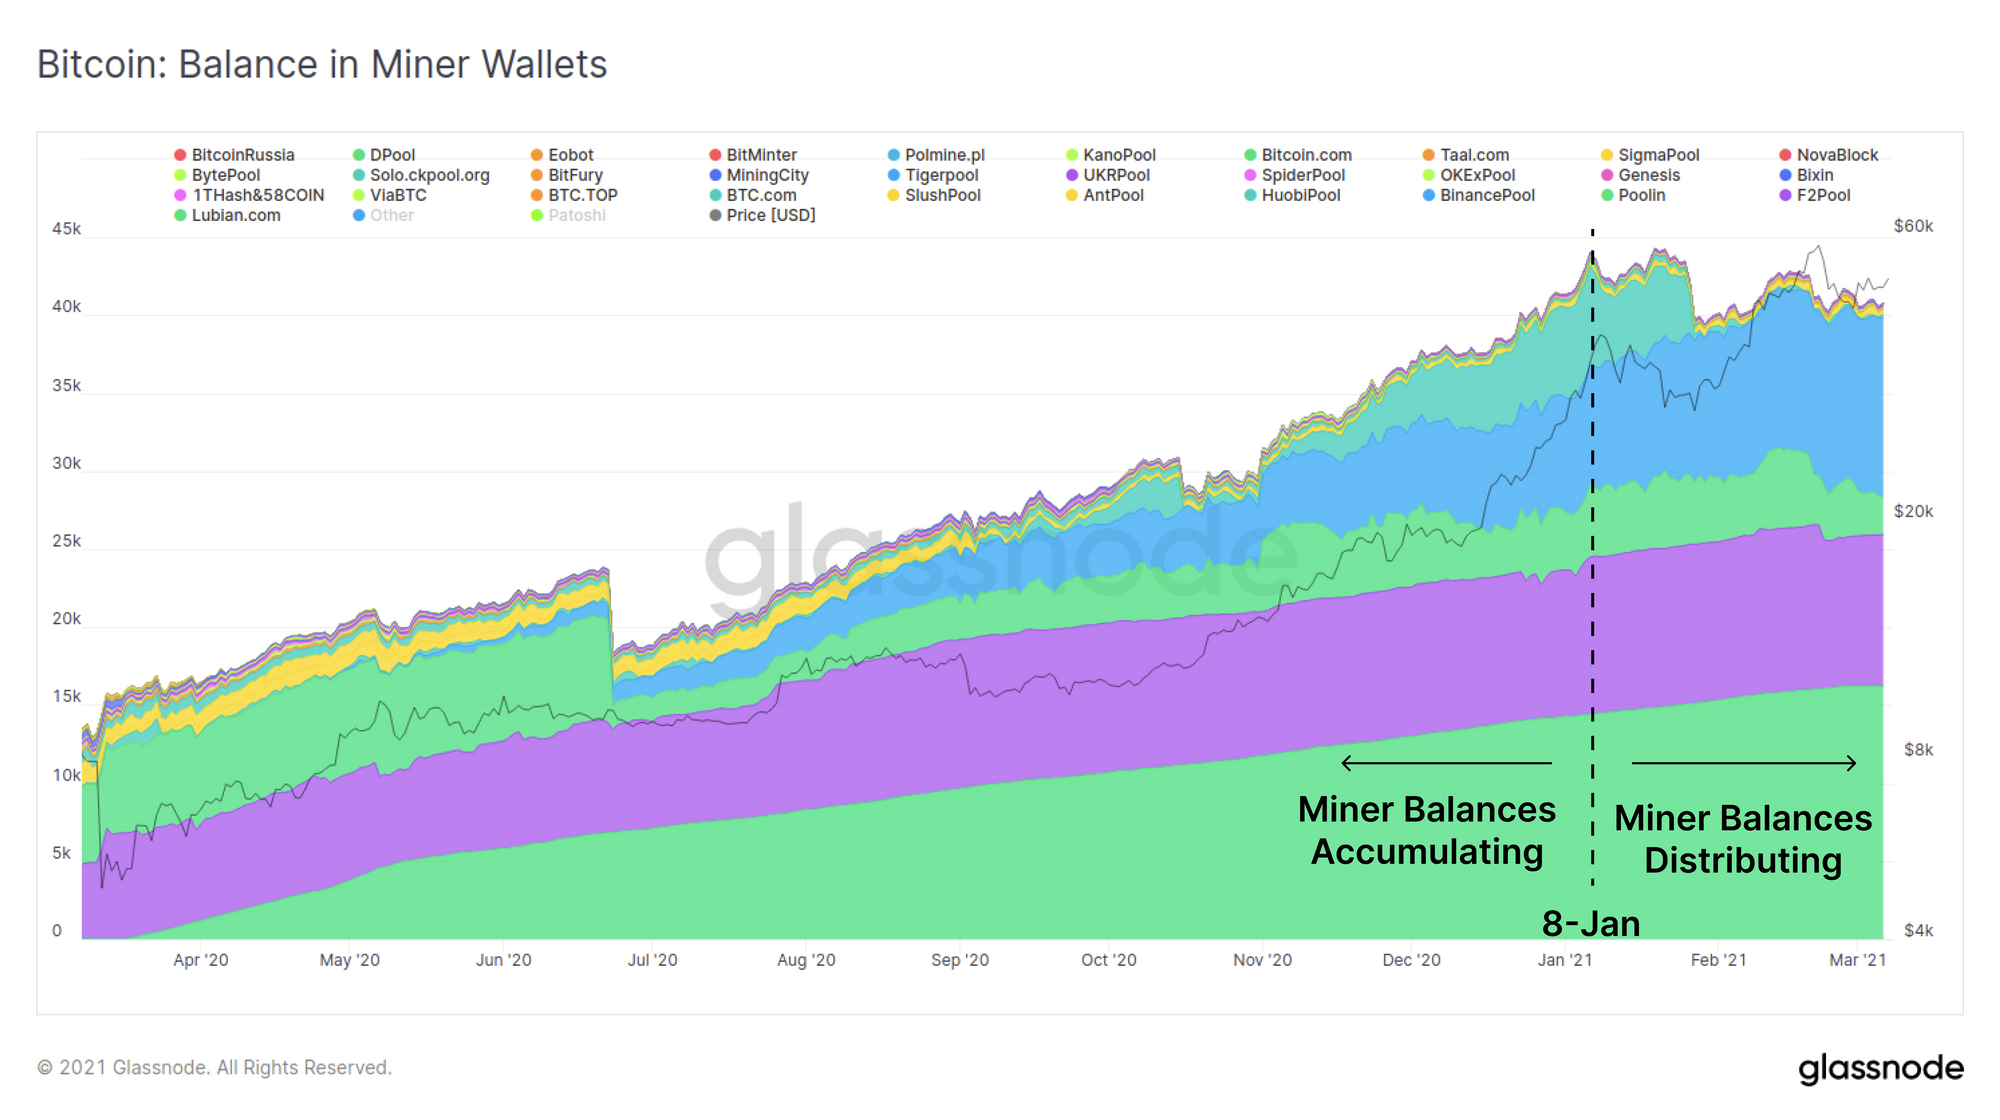
If we investigate the Balance of Known Miners (filtered for miners that Glassnode has clusters for), we can see that up until early January 2021, miners were in accumulation mode. Miner distribution has occurred through 2021 however not to the same magnitude or rate as the preceding accumulation phase.
Keep note that the miners shown below are only those we have identified and clustered (shown to provide a nice visualisation of this trend). There is another large pool of unknown miners ('other') that represent a significant portion of the mining market whom we will include in our investigation of the next chart.
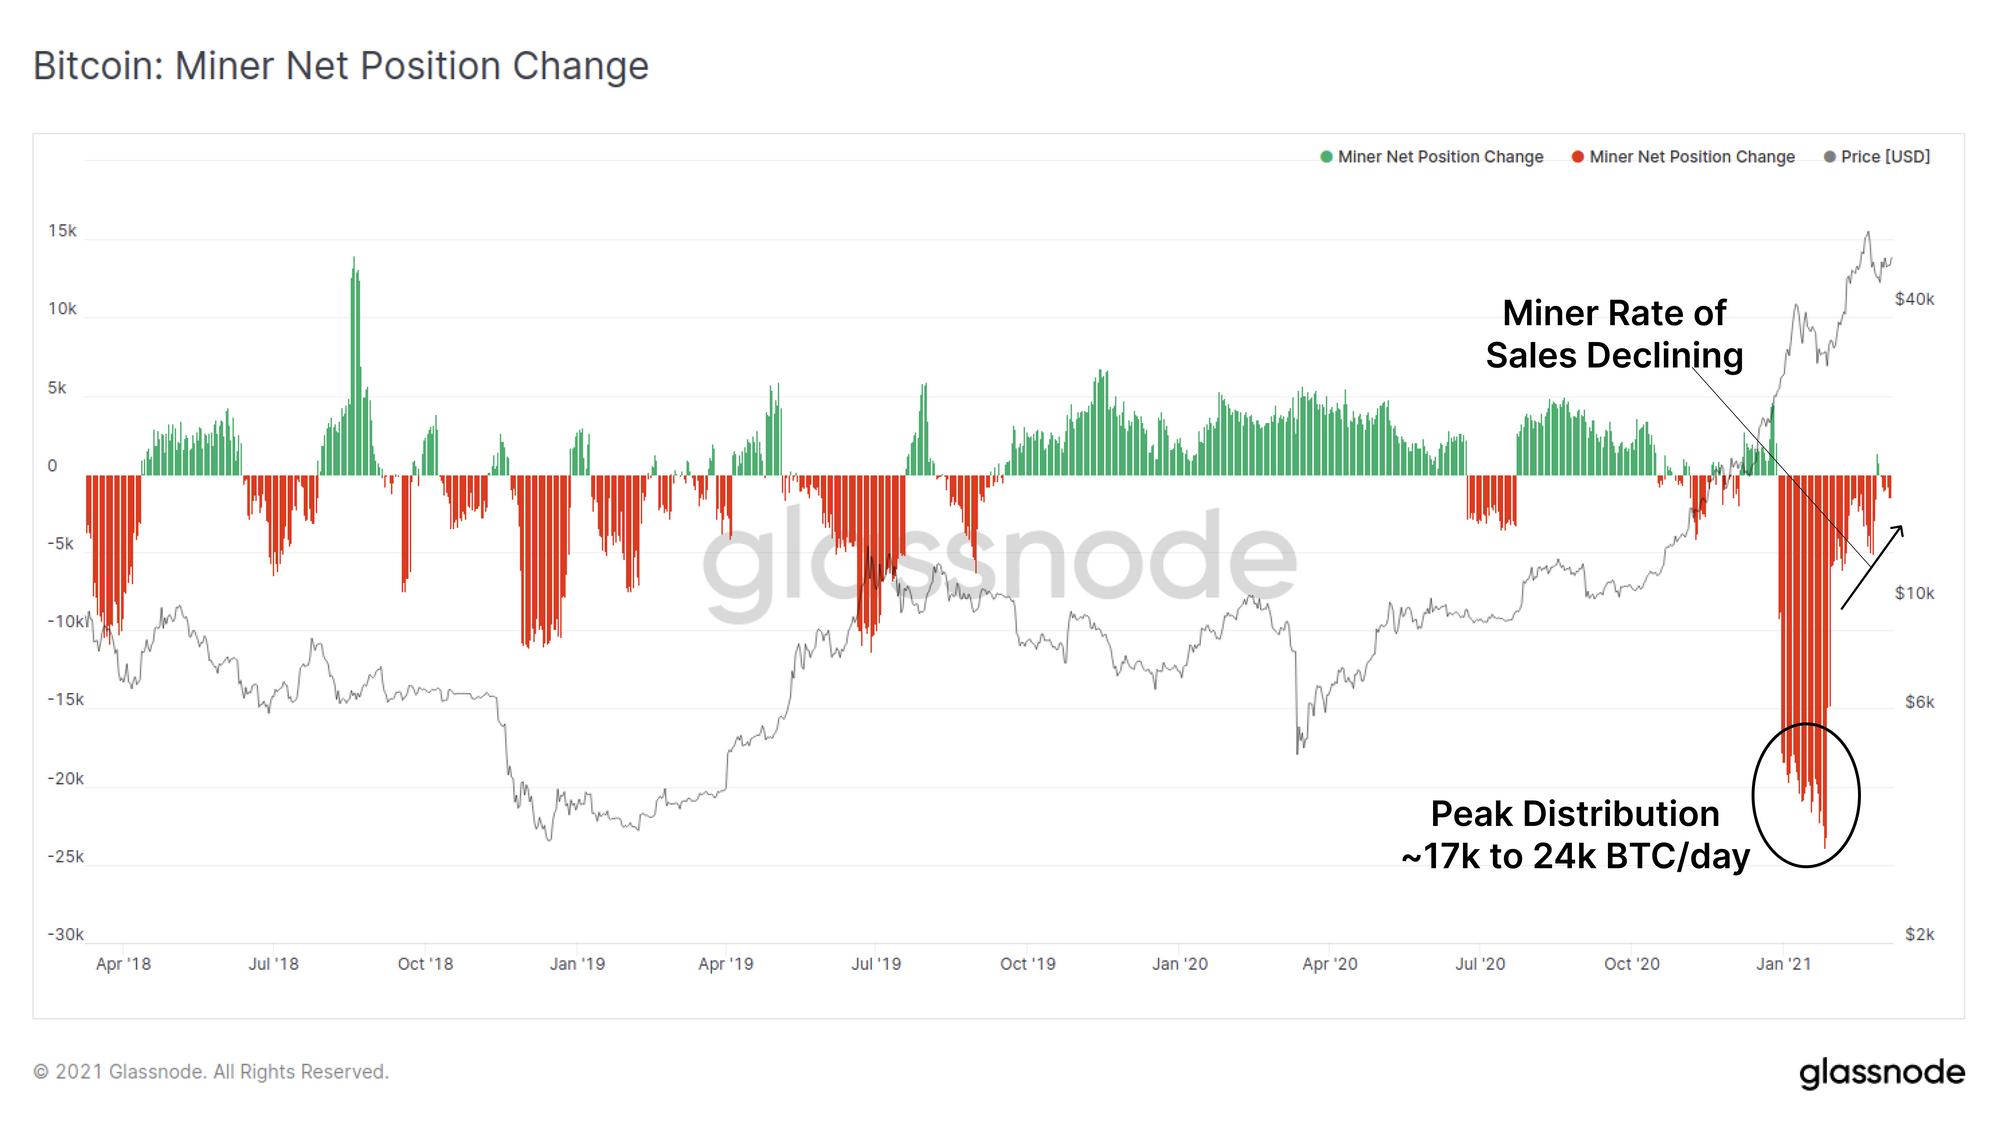
The Miner Position Change metric factors in all balances for all newly minted coins and thus provides us with a big picture view on the full mining landscape. What we observe is a peak in distribution behaviour throughout January (17k to 24k BTC/day) which can be largely assigned to a few larger unknown miners (and even a few early miners from 2010!).
Throughout February however, we can see the rate of miner sales is declining, where today, it is almost net neutral. Despite newly minted coins representing only a fraction of daily trade volume (i.e. miner selling is small net force these days), it appears that even miners are returning to neutral or accumulation mode.
Long-term Holder Positions
Long-term holders (LTH) are classified as those who hold coins older than 155-days, and/or withdraw coins into wallets displaying characteristics of cold storage or long-term hodler heuristics.
In on-chain analysis, we must make assumptions around the behaviour and incentives of various network entities. With respect to LTHs, we generally make an assumption that they have good knowledge around Bitcoin and a high conviction. As such, their coins are often accumulated in bear markets, remain dormant for long periods of time and come back to life during bullish trends as they sell into strength.
The supply adjusted Coin Days Destroyed (CDD) metric excels at tracking this LTH behaviour. The longer a coin is dormant, the more 'coin-days' it accumulates. As more old coins are spent, more coin-days are destroyed and the CDD metric will trend higher.
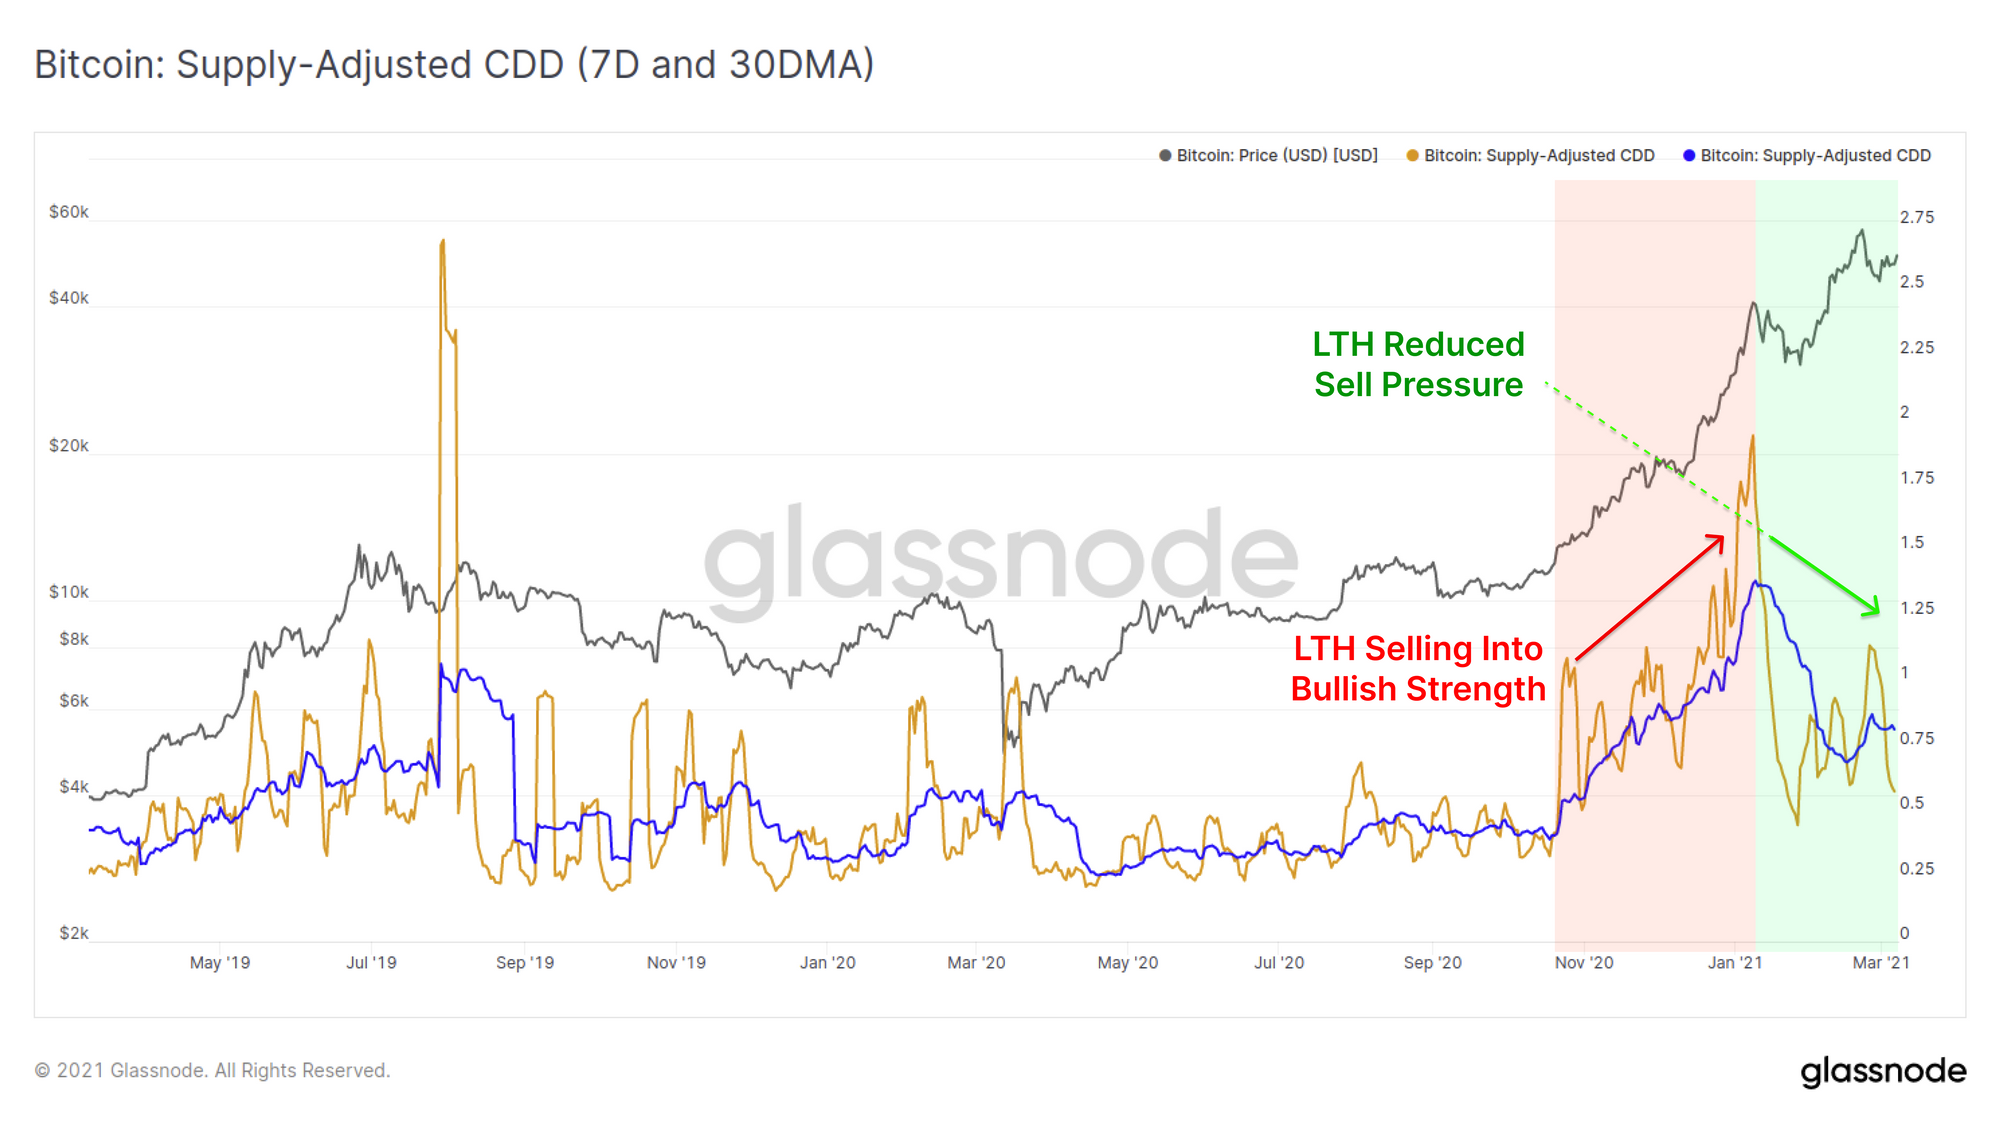
The chart above shows that LTHs did indeed commence spending their coins in the period from October 2020 through to 8 January 2021 (CDD trending higher). However, since 8 January, LTHs have slowed this distribution behaviour. Both the 7-day and 30-day moving averages of CDD have returned to levels that are elevated, but not uncommon for early bull markets and even bear markets. This metric indicates that similar to miners, LTHs are taking profits, but are certainly not rushing for the exits.
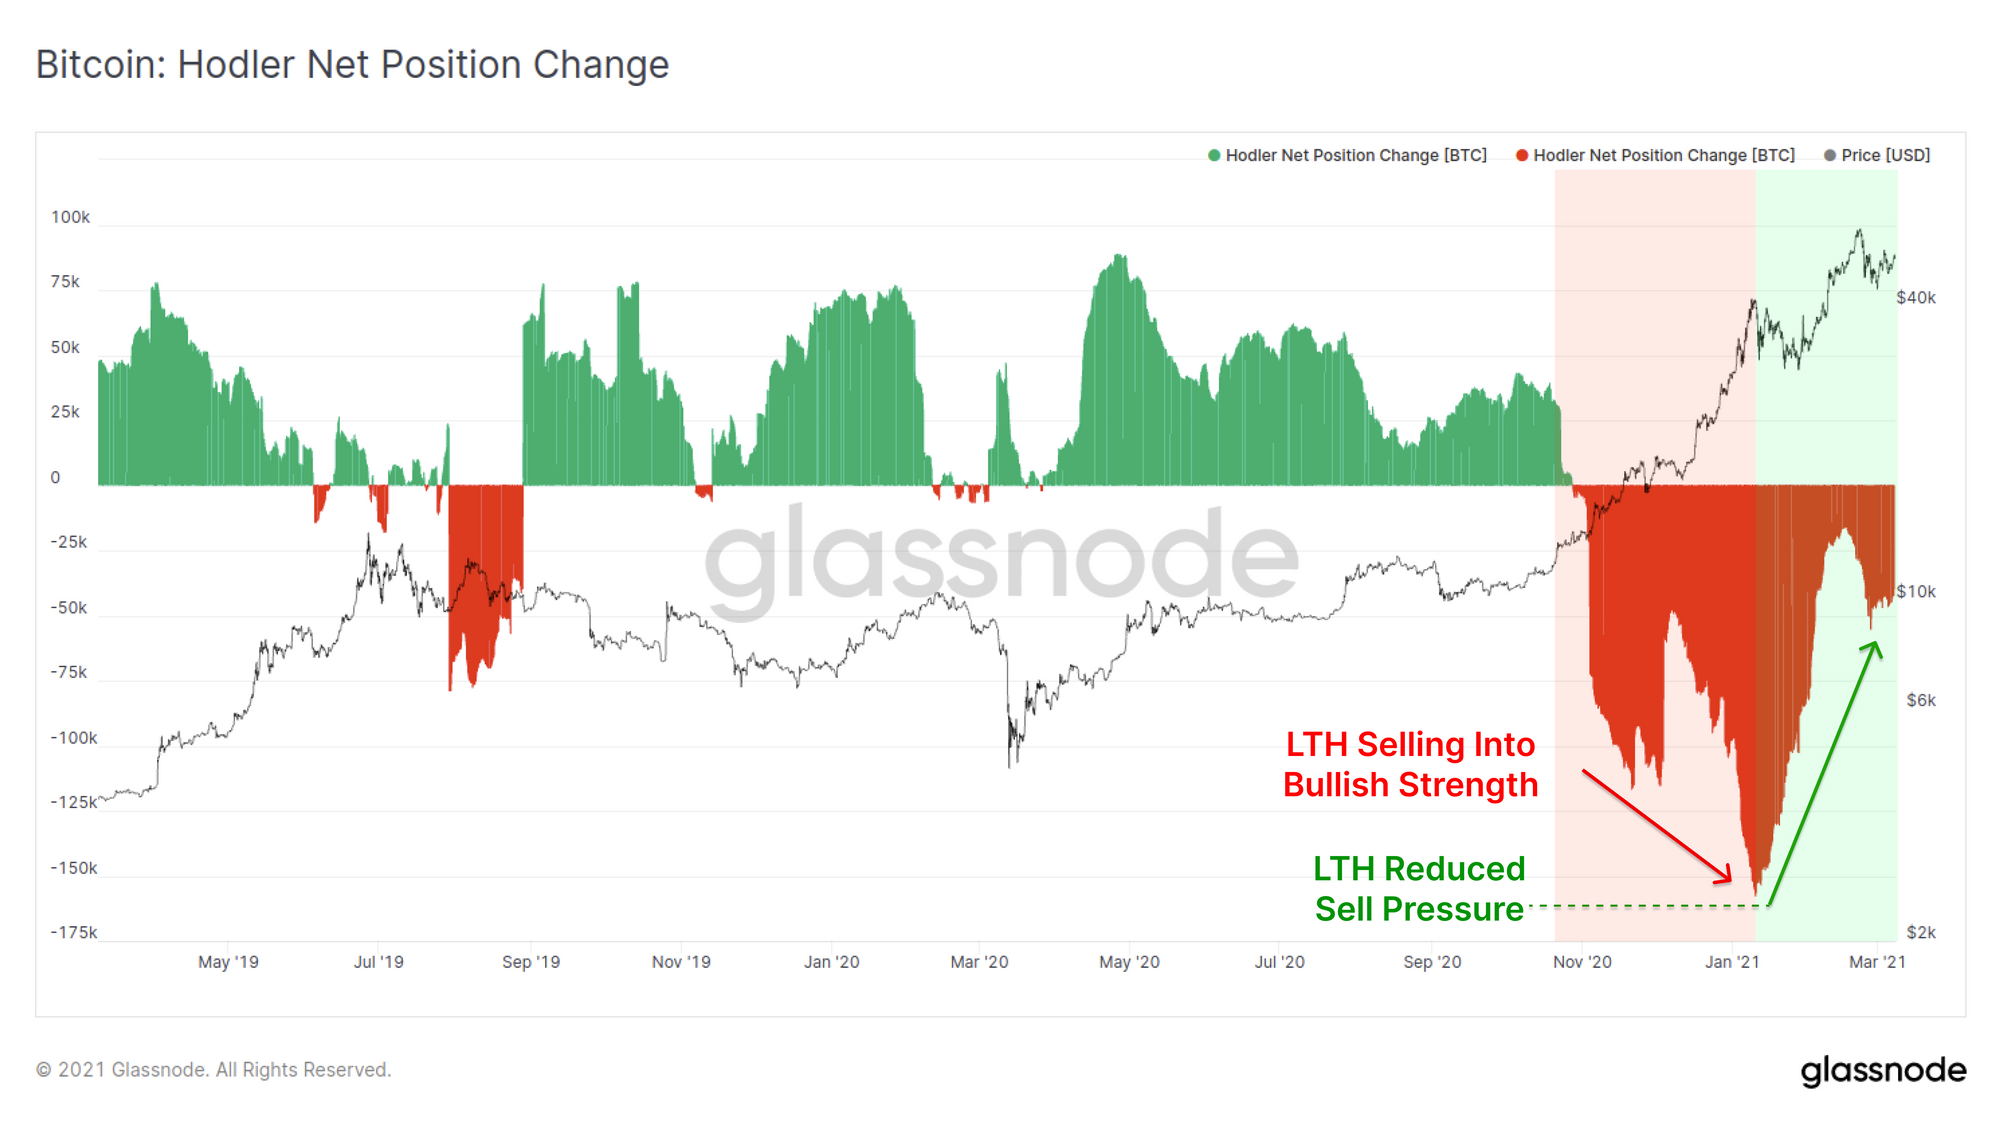
To add further weight to this argument, we can look at the net balance of these LTHs. We see a near identical pattern to the miners where peak distribution occurred from late 2020 through to early Jan 2021 before dramatically slowing down. On net, LTHs are still distributing at a rate of around 44.5k BTC per day, however this represents less than ~5% of daily trading volume in futures markets and the trend is towards a reduction in spending.
Short-Term Holder Positions
Finally, we will investigate the behaviour of short-term holders (STH) who are classified as those owning relatively young coins (< 155-days old). STHs typically make up the majority of day-to-day traffic on-chain. In on-chain analysis, we often assume STHs are transient users, speculators and day-traders whom are more sensitive to price volatility.
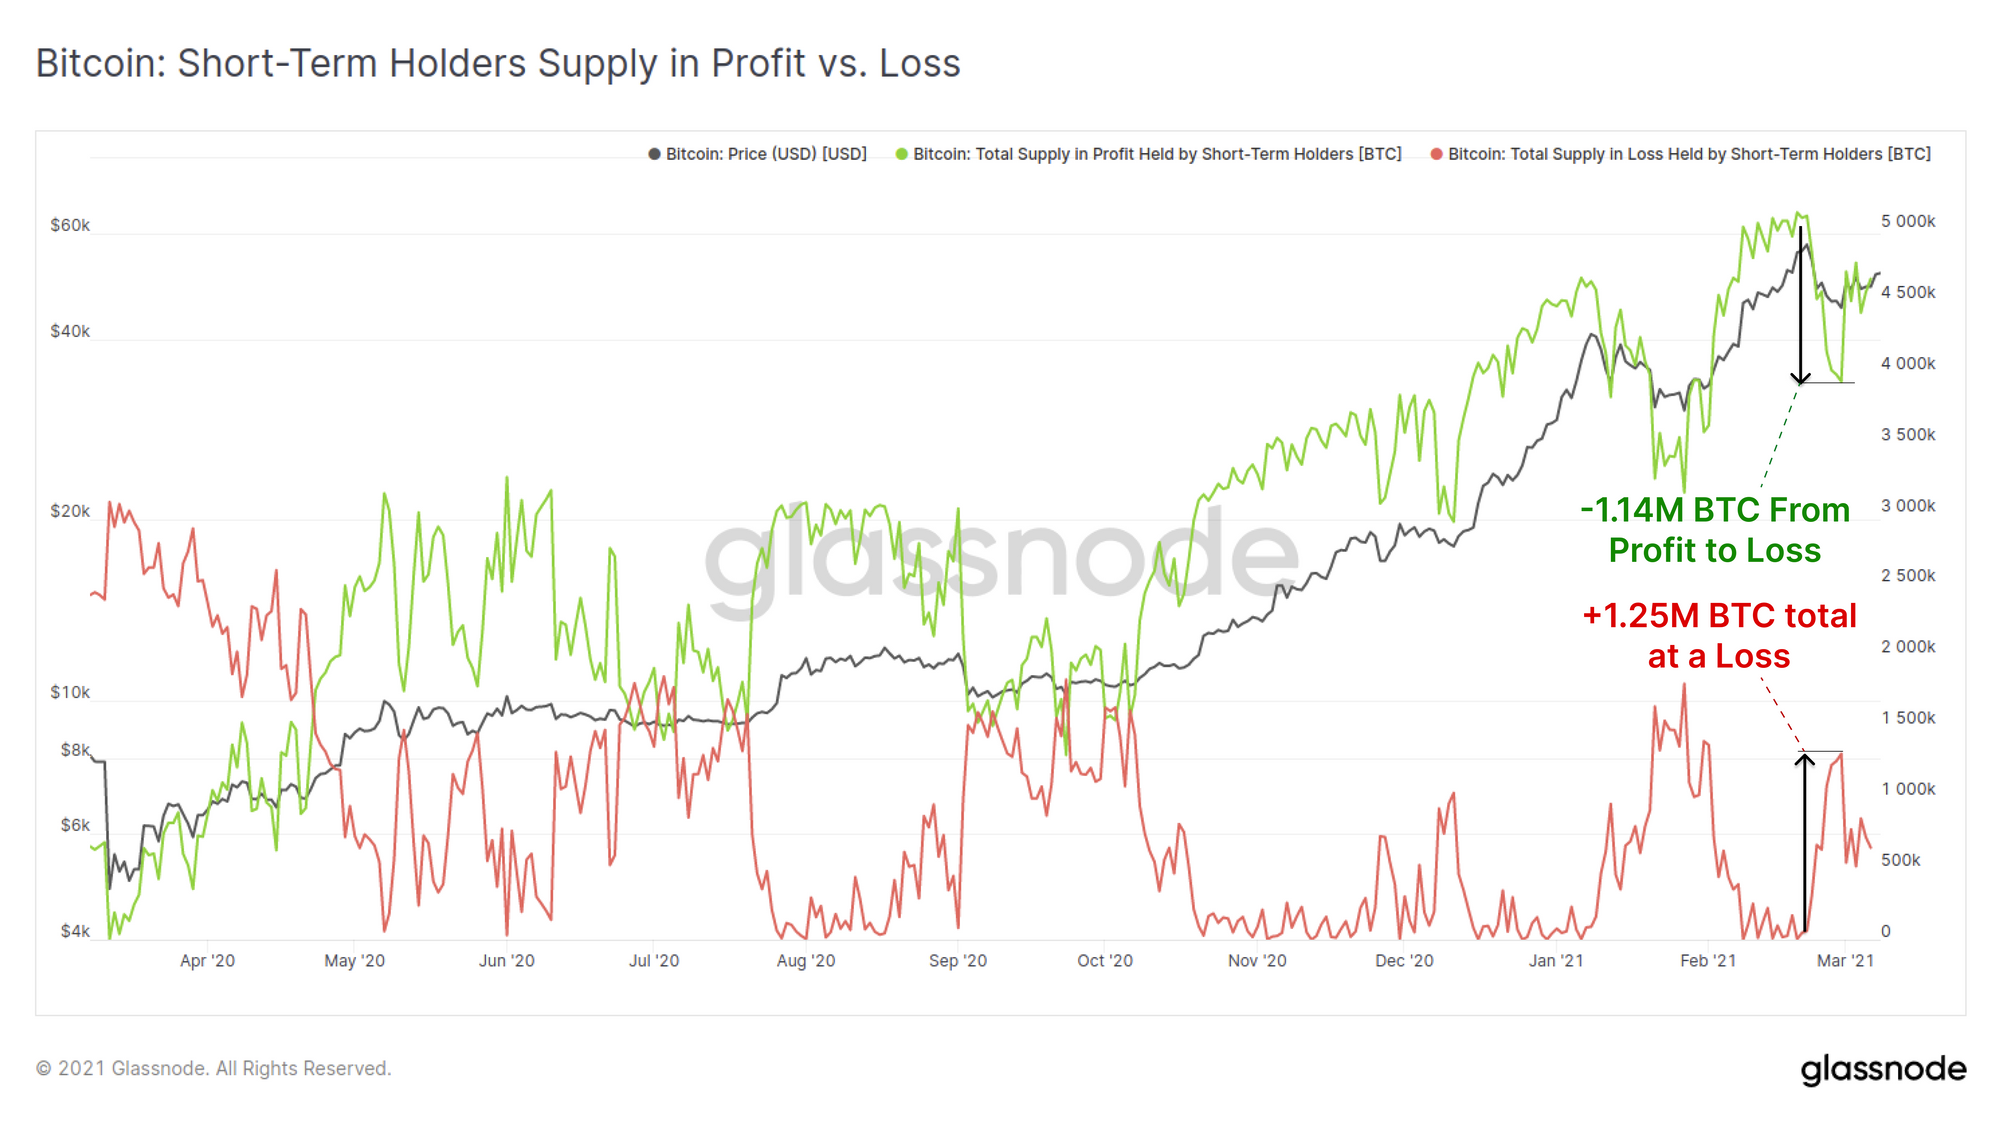
First we review the relative supply held by STH wallets that are in profit (young coins last moved at cheaper prices, green) and at those now at a loss (red). During the rally to the current ATH of $58.3k, there were over 5.12 million BTC held by STH that were in profit.
As this correction sold down to the $43.3k low, over 1.14 million of those BTC became underwater with an additional 0.112 million BTC being purchased early within the correction (and then falling underwater).
This suggests that there has been a transfer of around 112k coins from LTH to STH hands over the past two weeks and that 1.25 million BTC were accumulated by STH above $45k (which also lines up with @n3ocortex tweet and our URPD at the start of this post).
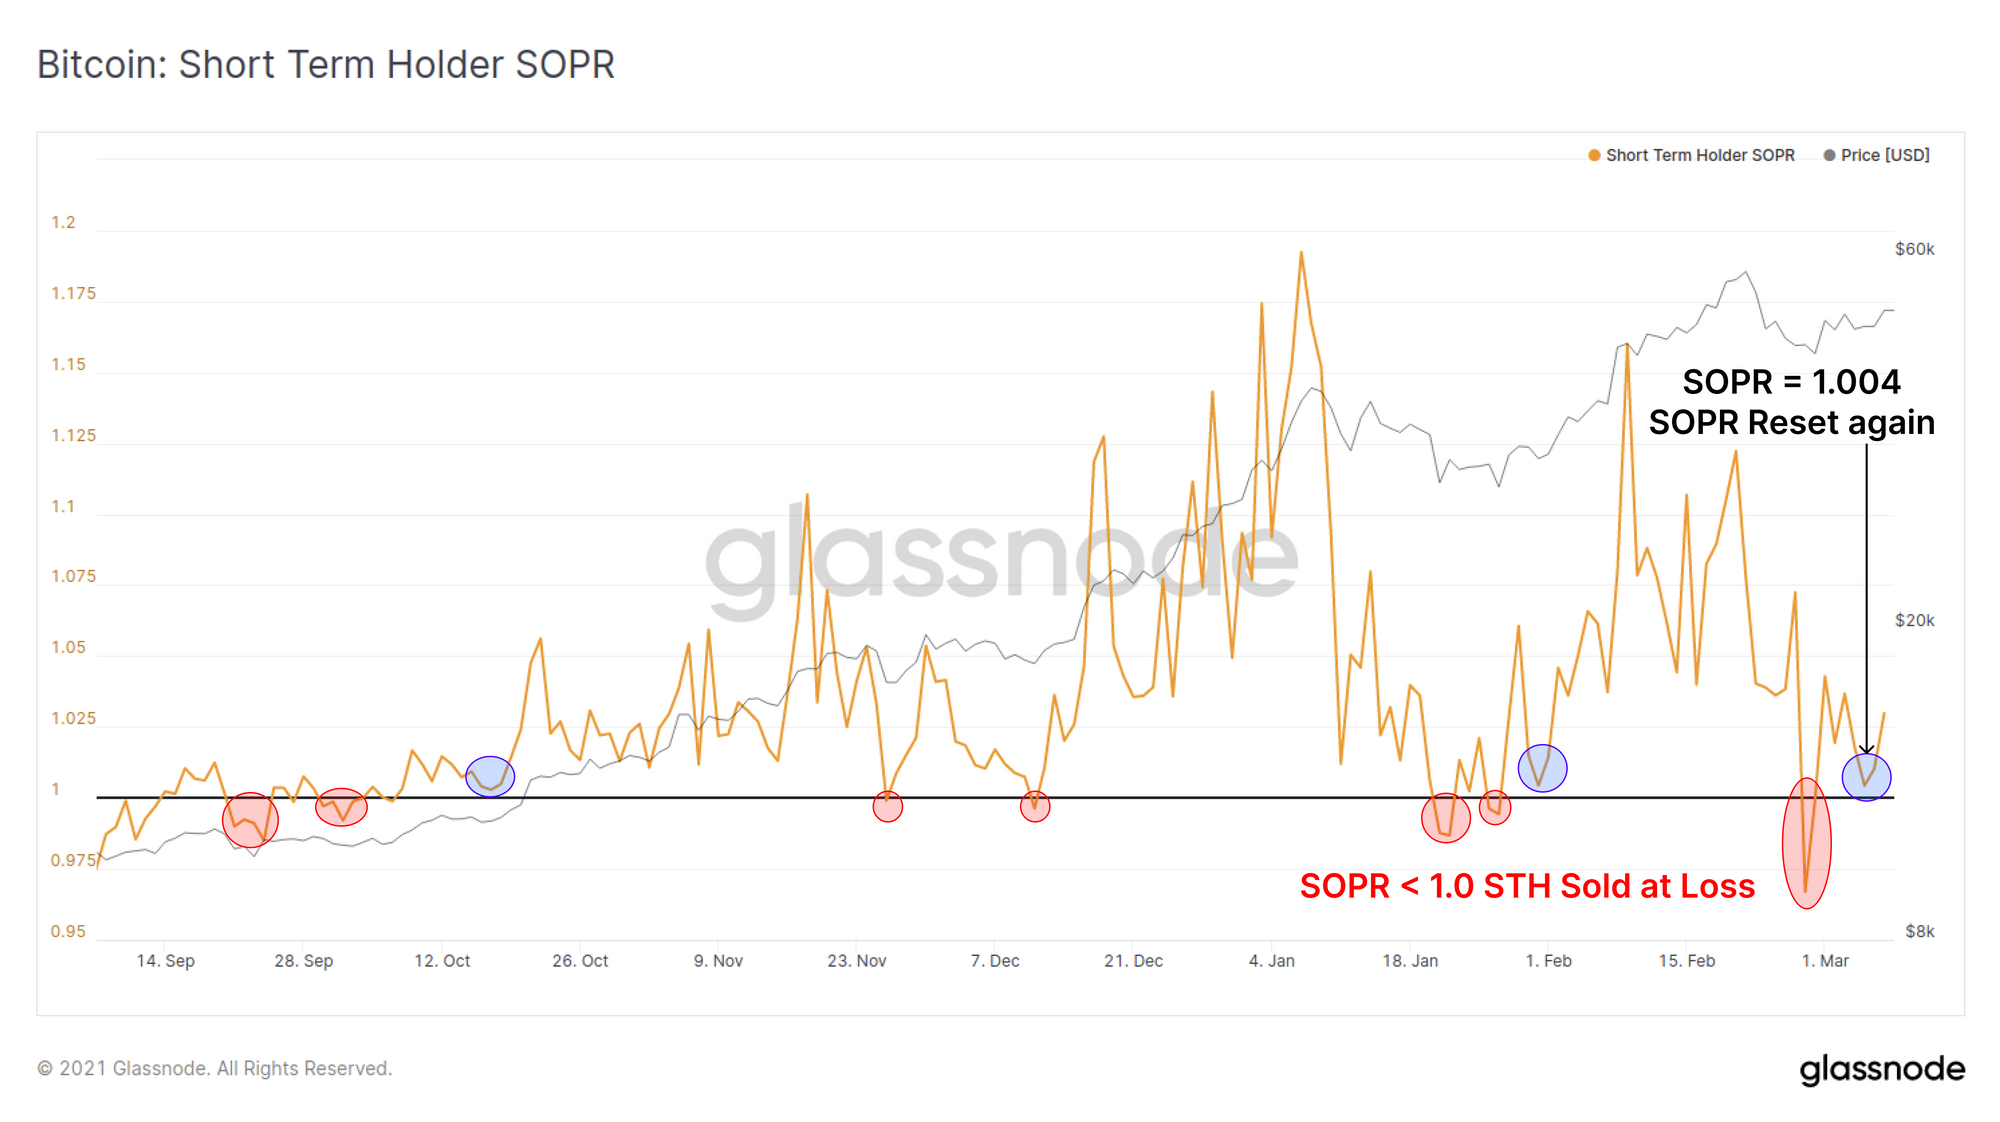
We can add weight these profit and loss dynamics by looking at the Spend Outputs Profit Ratio for STHs. This metric looks at how much profit was realised by all UTXOsclassed as STHs that were spend on that day. As a quick refresher for the SOPR metric:
- SOPR > 1.0 means on aggregate coins moved that day were in profit.
- SOPR = 1.0 means on aggregate there is no profit nor loss realised that day.
- SOPR < 1.0 means on aggregate coins moved that day were at a loss.
Last week we saw that SOPR reset below 1.0 and we theorised this to be a first indicator of new retail level investors taking losses. This week we saw SOPR-STH retrace back to just above 1.0 despite sideways consolidating price action.
This second SOPR reset is healthy as it represents a retest of STH 'buy the dip' conviction. Previous instances of this SOPR retest after falling below 1.0 have generally signalled a calming of the correction downside, and in this bull cycle, have been followed by upwards price momentum.
Weekly Bitcoin Market Summary
The on-chain analysis above is a typical workflow we use to assess the sentiment and behaviour of various network participants, within a set of behaviour assumptions. To maximise the value of on-chain insights, it is important to seek confluence between multiple metrics to improve our accuracy and probabilities of being correct.
This week, we have:
- Sideways consolidation above strong on-chain support (that held last week), despite non-trivial macro market turbulence and weakness in traditional markets.
- On-chain support at $45k has actually strengthened by over 1.2 million BTC changing hands, and even raised the support floor into the $46.6 to $47k range.
- Miners (who are uber bulls) slowed down selling behaviour after a few months of distribution. This total distribution was small relative to both daily BTC trading volume and miners accumulation through 2020.
- Long-term Holders (also strong bulls) have similarly slowed their distribution after a distributive start to 2021. Many of our lifespan metrics (e.g. CDD and ASOL) have dropped of significantly (meaning fewer old coins moving) and LTH balances are selling off at a reduced pace.
- Short-term Holders (assumed new investors/speculators) have taken losses last week, bought the dip, and had their dip buying conviction tested this week. More coins were transferred from LTH to STH however we did not see another SOPR print below 1.0 indicating we did not get more panic selling.
On-chain data suggests a relatively strong bull case for Bitcoin this week. The major risk that one must keep in mind is that the key on-chain support level between $45k and $47k falls, many of our observations may swap from strong support to heavy resistance.
Weekly Feature: Litecoin Position Changes
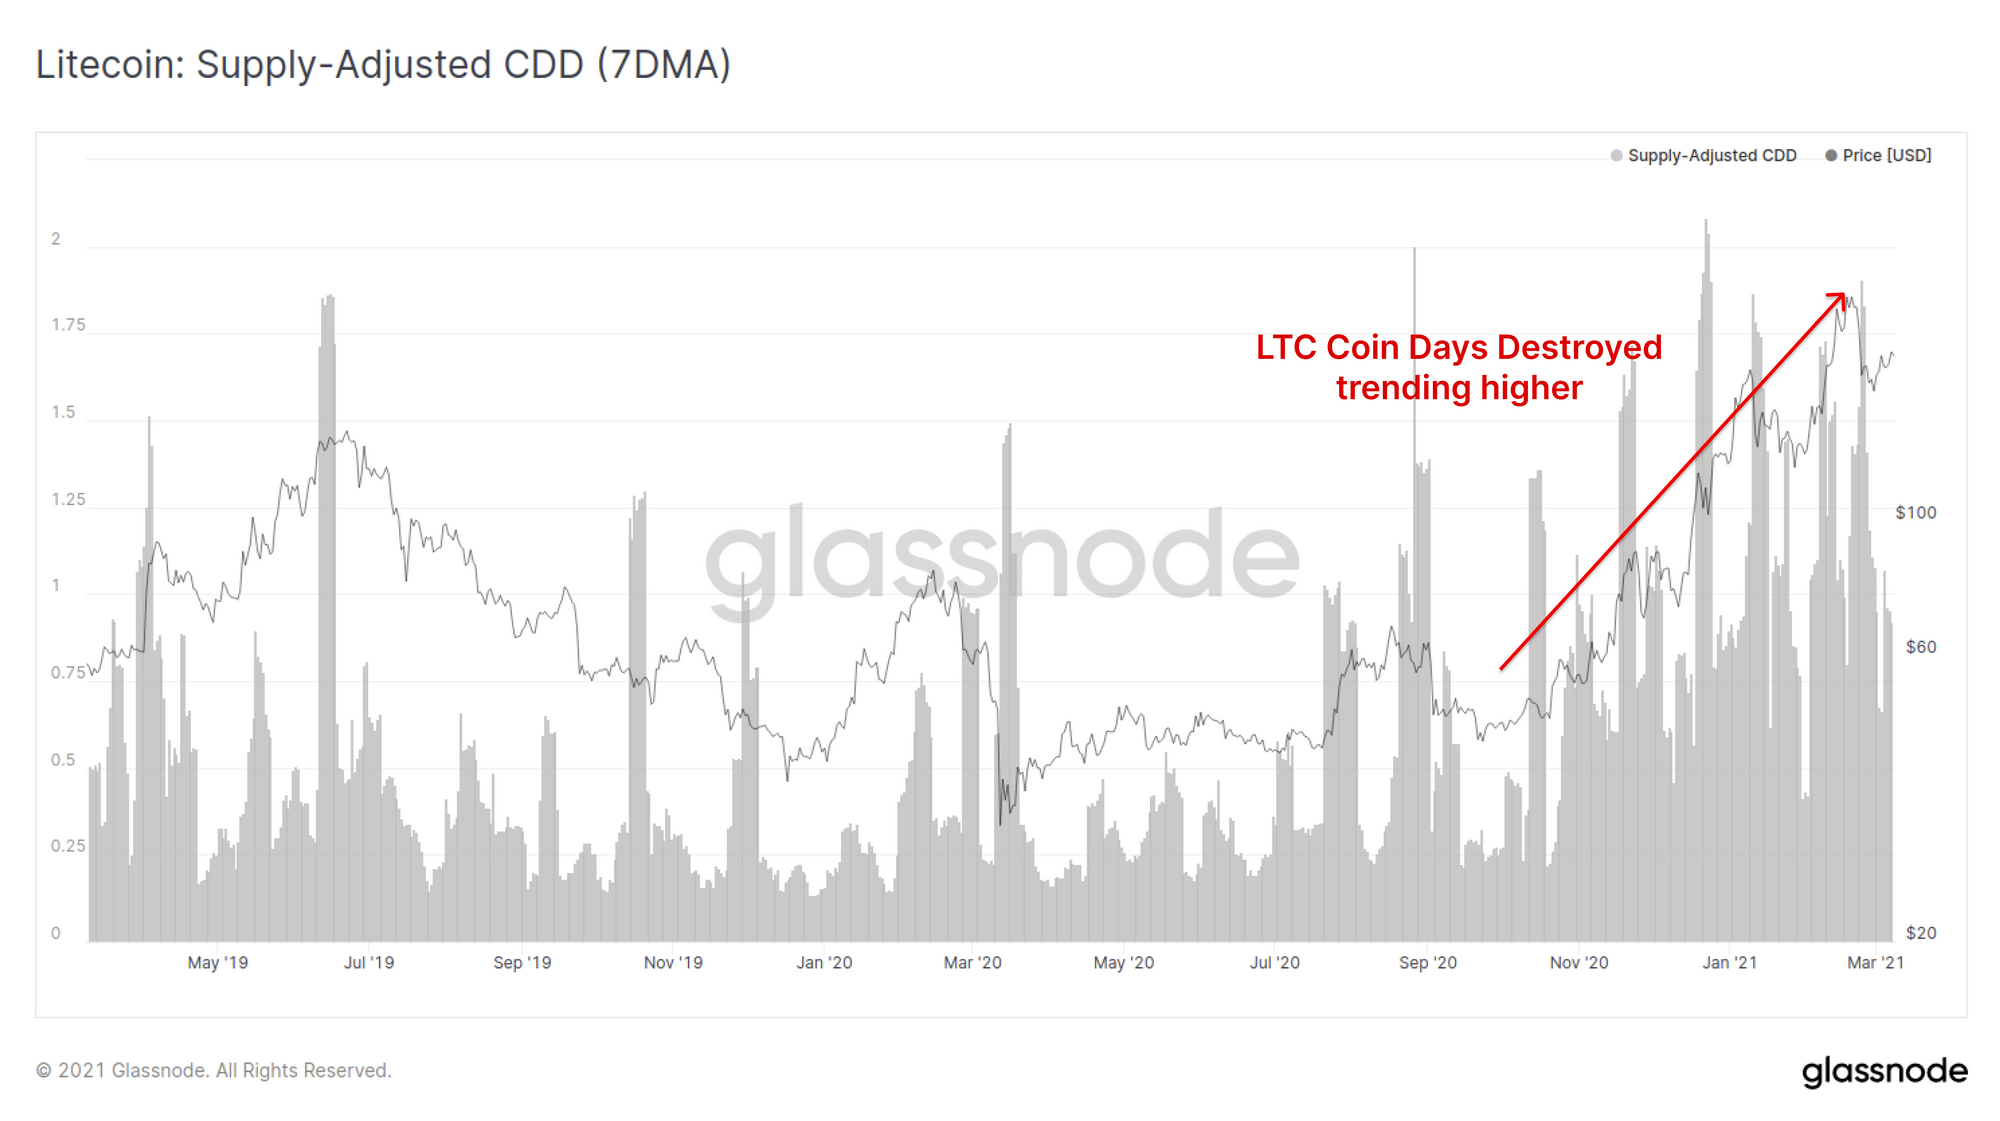
This week we will apply similar analysis to Litecoin with a specific focus on HODLers of LTC. First we assess whether old LTC coins that are being spent or HODLed by investigating the Supply Adjusted Coin Days Destroyed (CDD). We can see that since October 2020, a relatively clear trend has emerged with CDD trending higher suggesting older coins are coming back to life and selling into market strength.
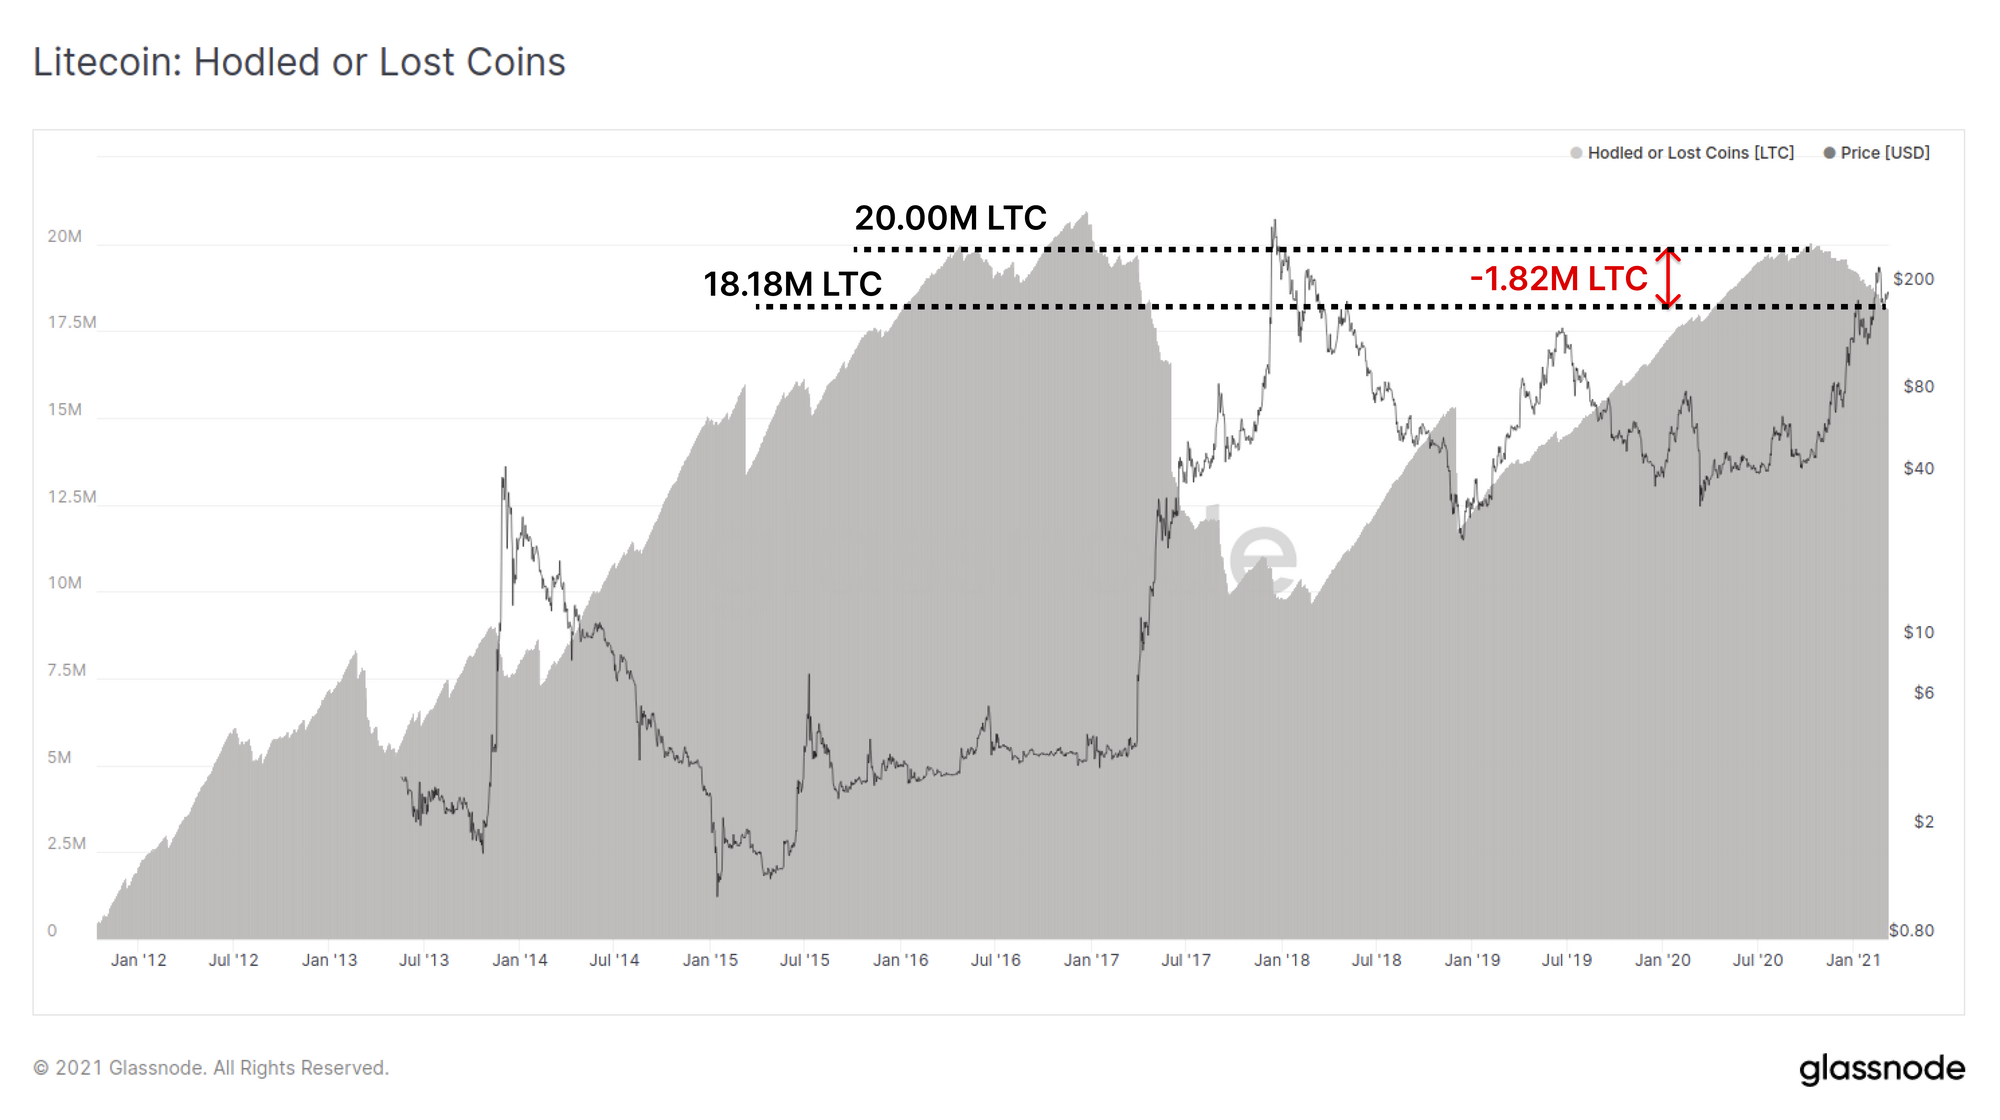
The Litecoin Hodled or Lost Coins metric provides a view on the overall LTC supply that is deemed to be dormant, lost or in cold storage. Around October 2020, this metric peaked with just over 20M LTC fitting this classification (~30% of circulating supply). This was similar to the peaks achieved back in 2016 although at that time, 20M coins represented a larger share of circulating supply (40-45%).
Since October 2020, coincident with CDD trending higher, we have seen 1.82M LTC spent by long term hodlers as market price has rallied from around $50 to the recent local high around $227. This suggests LTHs have taken profits into market strength.
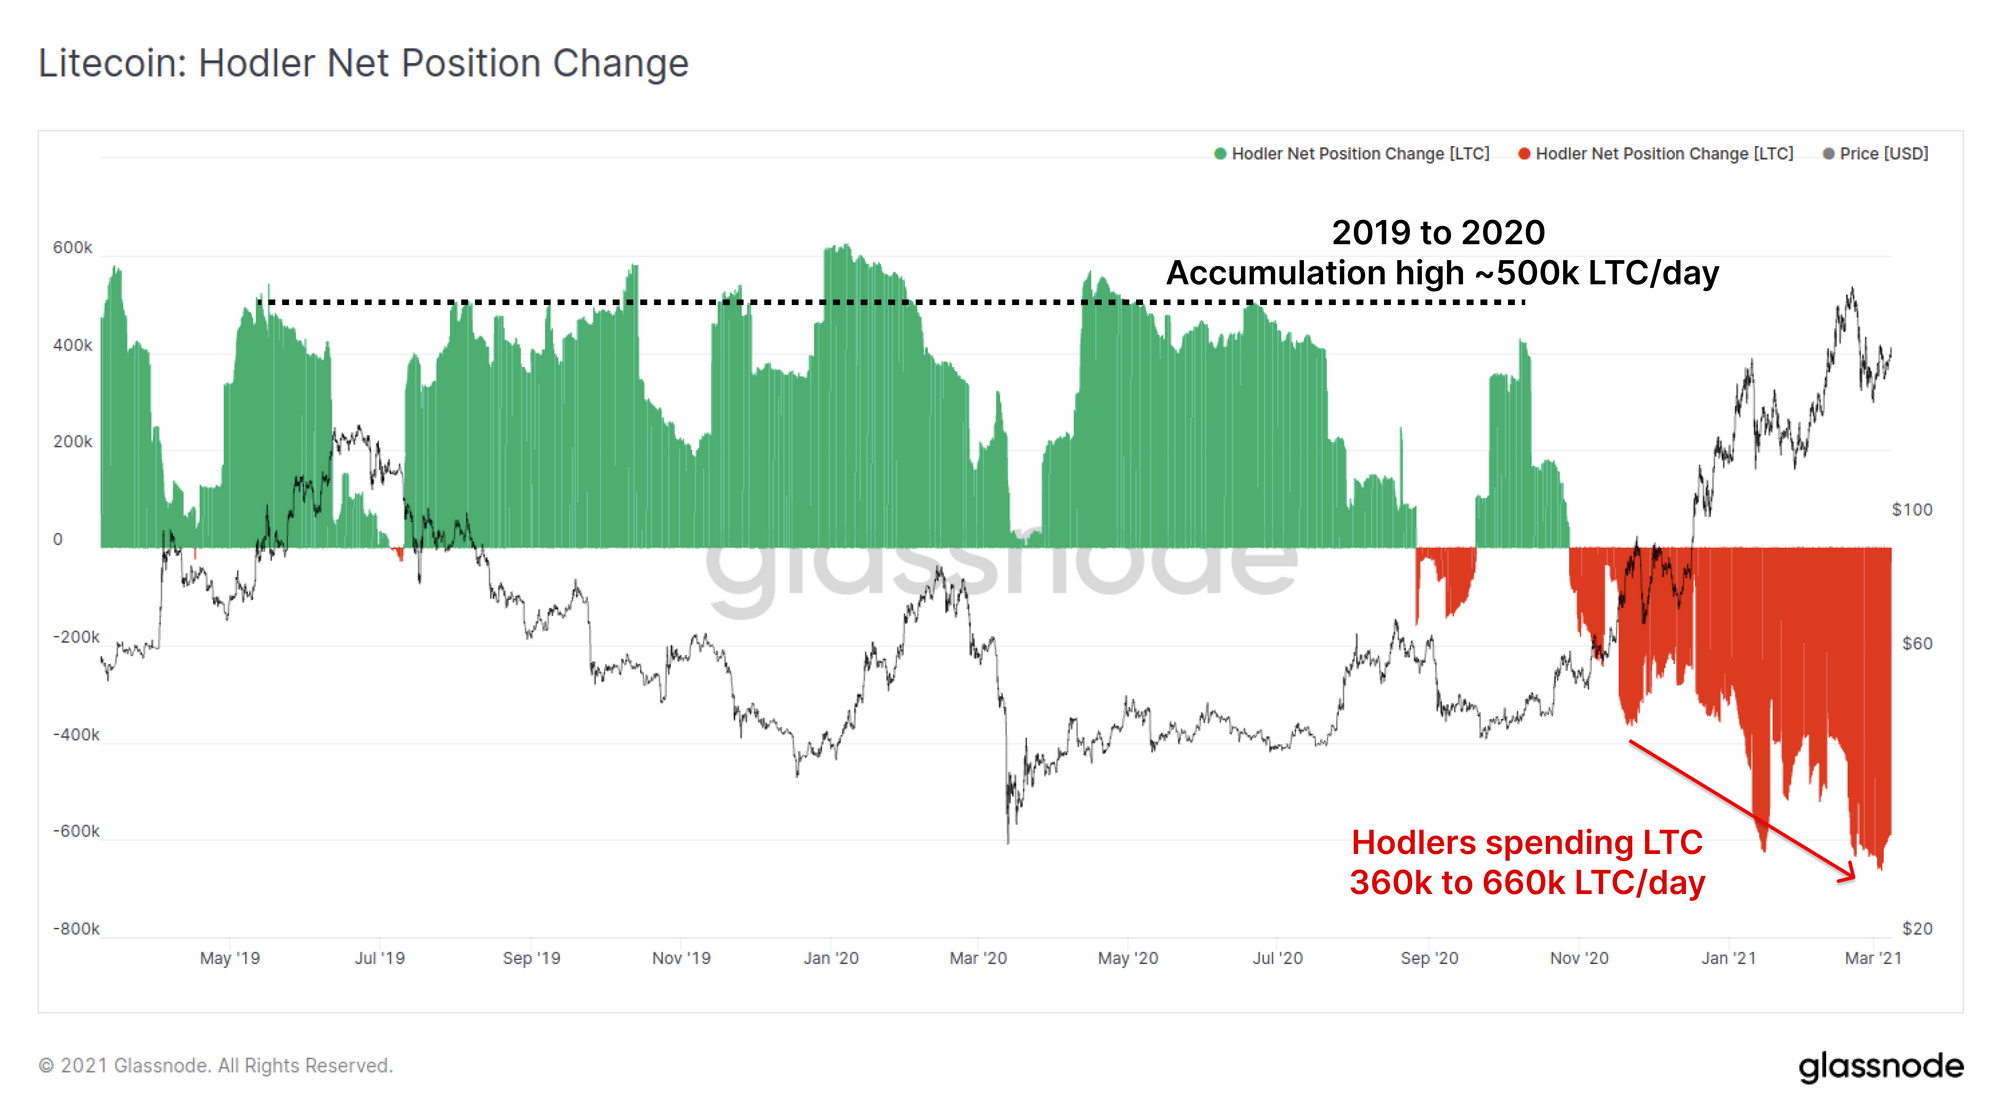
Finally, we map this change in hodled supply into the Hodler Net Position Change metric, where we can see this trend stands out against the preceding 12 months. Whist hodlers previously accumulated at a rate of around 500k LTC/day through 2020, they are currently spending at a rate of around 660k LTC/day. This suggests that whilst profits are being taken in 2021, there remains a significant volume of LTC hodled held by long term user wallets (the accumulation period in green is longer than the distribution so far in red).
Check out Our Latest Newsletter: Uncharted
We have recently started a bi-weekly newsletter, Uncharted. This newsletter covers BTC from both an on-chain and off-chain data perspective, and uses beautiful charts and brief commentaries to give readers an intuitive snapshot of what is happening in the markets.
Check out Uncharted on our Substack, and subscribe now!
Special Offer: Free Month of Glassnode Advanced
We've partnered with ZUBR to offer a free month of Glassnode Advanced to users who sign up and trade crypto perpetuals on their platform.
ZUBR is a derivatives exchange built by HFT-traders, featuring guaranteed microsecond execution of trades with only 0.01% trading fees. They recognize the importance of on-chain data for traders.
Sign up now to gain access to Glassnode's on-chain metrics while utilizing ZUBR's high-end trading infrastructure.
Product Updates
Coinbase Exchange Wallet Improved Heuristics
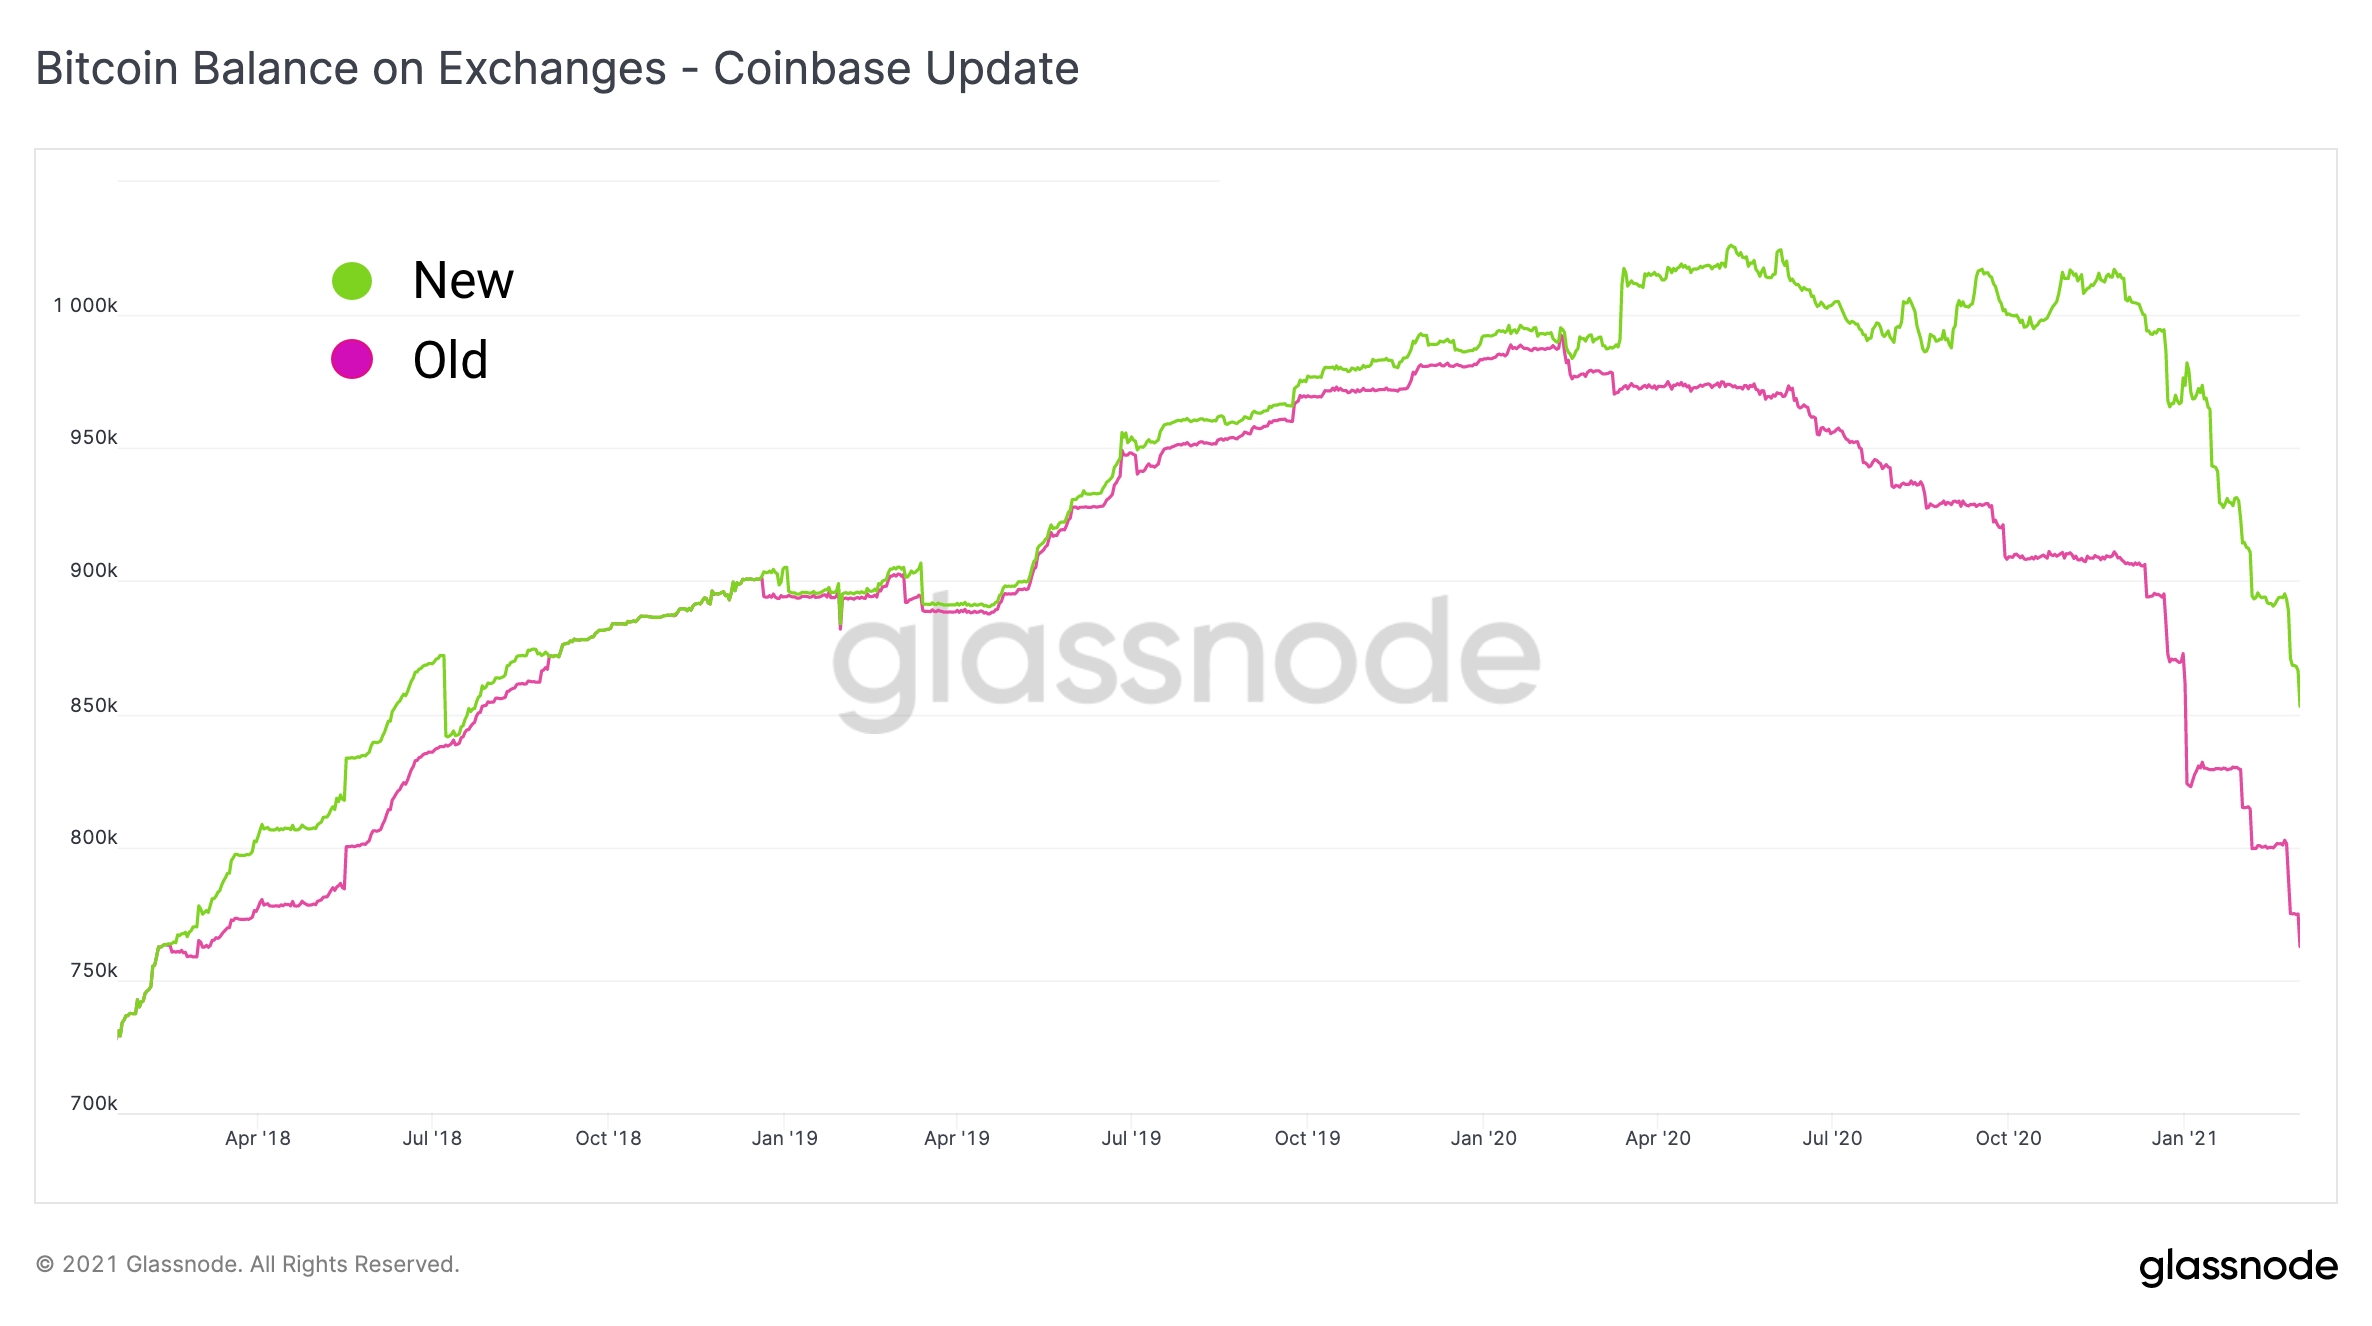
At Glassnode, our mission is to keep providing the best quality exchange data in the space and to that end, we are releasing a major update on the BTC Coinbase addresses and heuristics. This update significantly improves the quality of Coinbase exchange metrics.
This is the result of a long period of internal research followed by rigorous QA. Specifically, historic data will change (leading to an overall balance increase of around 90k BTC). With the new heuristics we improve tracking of Coinbase labels and prevent false-negative in/outflows (which are actually in-house transactions) to be reported. Note that the trend of the data still holds as shown in the chart below.
Metrics and Assets
- Released Purpose ETF metrics and dashboard.
- Significant improvement to Coinbase exchange balance heuristics.
Features
- Updates and Improvements for exchange metrics for Binance, Bitstamp, Coinbase and Gemini.

- Lesen Sie diesen Artikel jetzt auf Deutsch bei unserem offiziellen Partner Bitcoin2Go
- Follow us and reach out on Twitter
- Join our Telegram channel
- For on–chain metrics and activity graphs, visit Glassnode Studio
- For automated alerts on core on–chain metrics and activity on exchanges, visit our Glassnode Alerts Twitter