The Merge: A Feat of Engineering
This week saw the successful deployment of one of the most impressive feats of engineering in the blockchain industry: The Ethereum Merge. We explore it as it happened, on-chain.


This week saw the successful deployment of one of the most impressive feats of engineering in the blockchain industry: The Ethereum Merge. The switching of the consensus mechanism from Proof-of-Work (PoW) to Proof-of-Stake (PoS), has been on the Ethereum roadmap, and actively worked on since genesis and is a remarkable milestone for the project.
As of 15-September at 06:46:46 UTC, at Ethereum blockheight 15,537,393, the final PoW mined block was produced, and the PoS Beacon Chain took over chain consensus. The Ethereum Merge was successful.
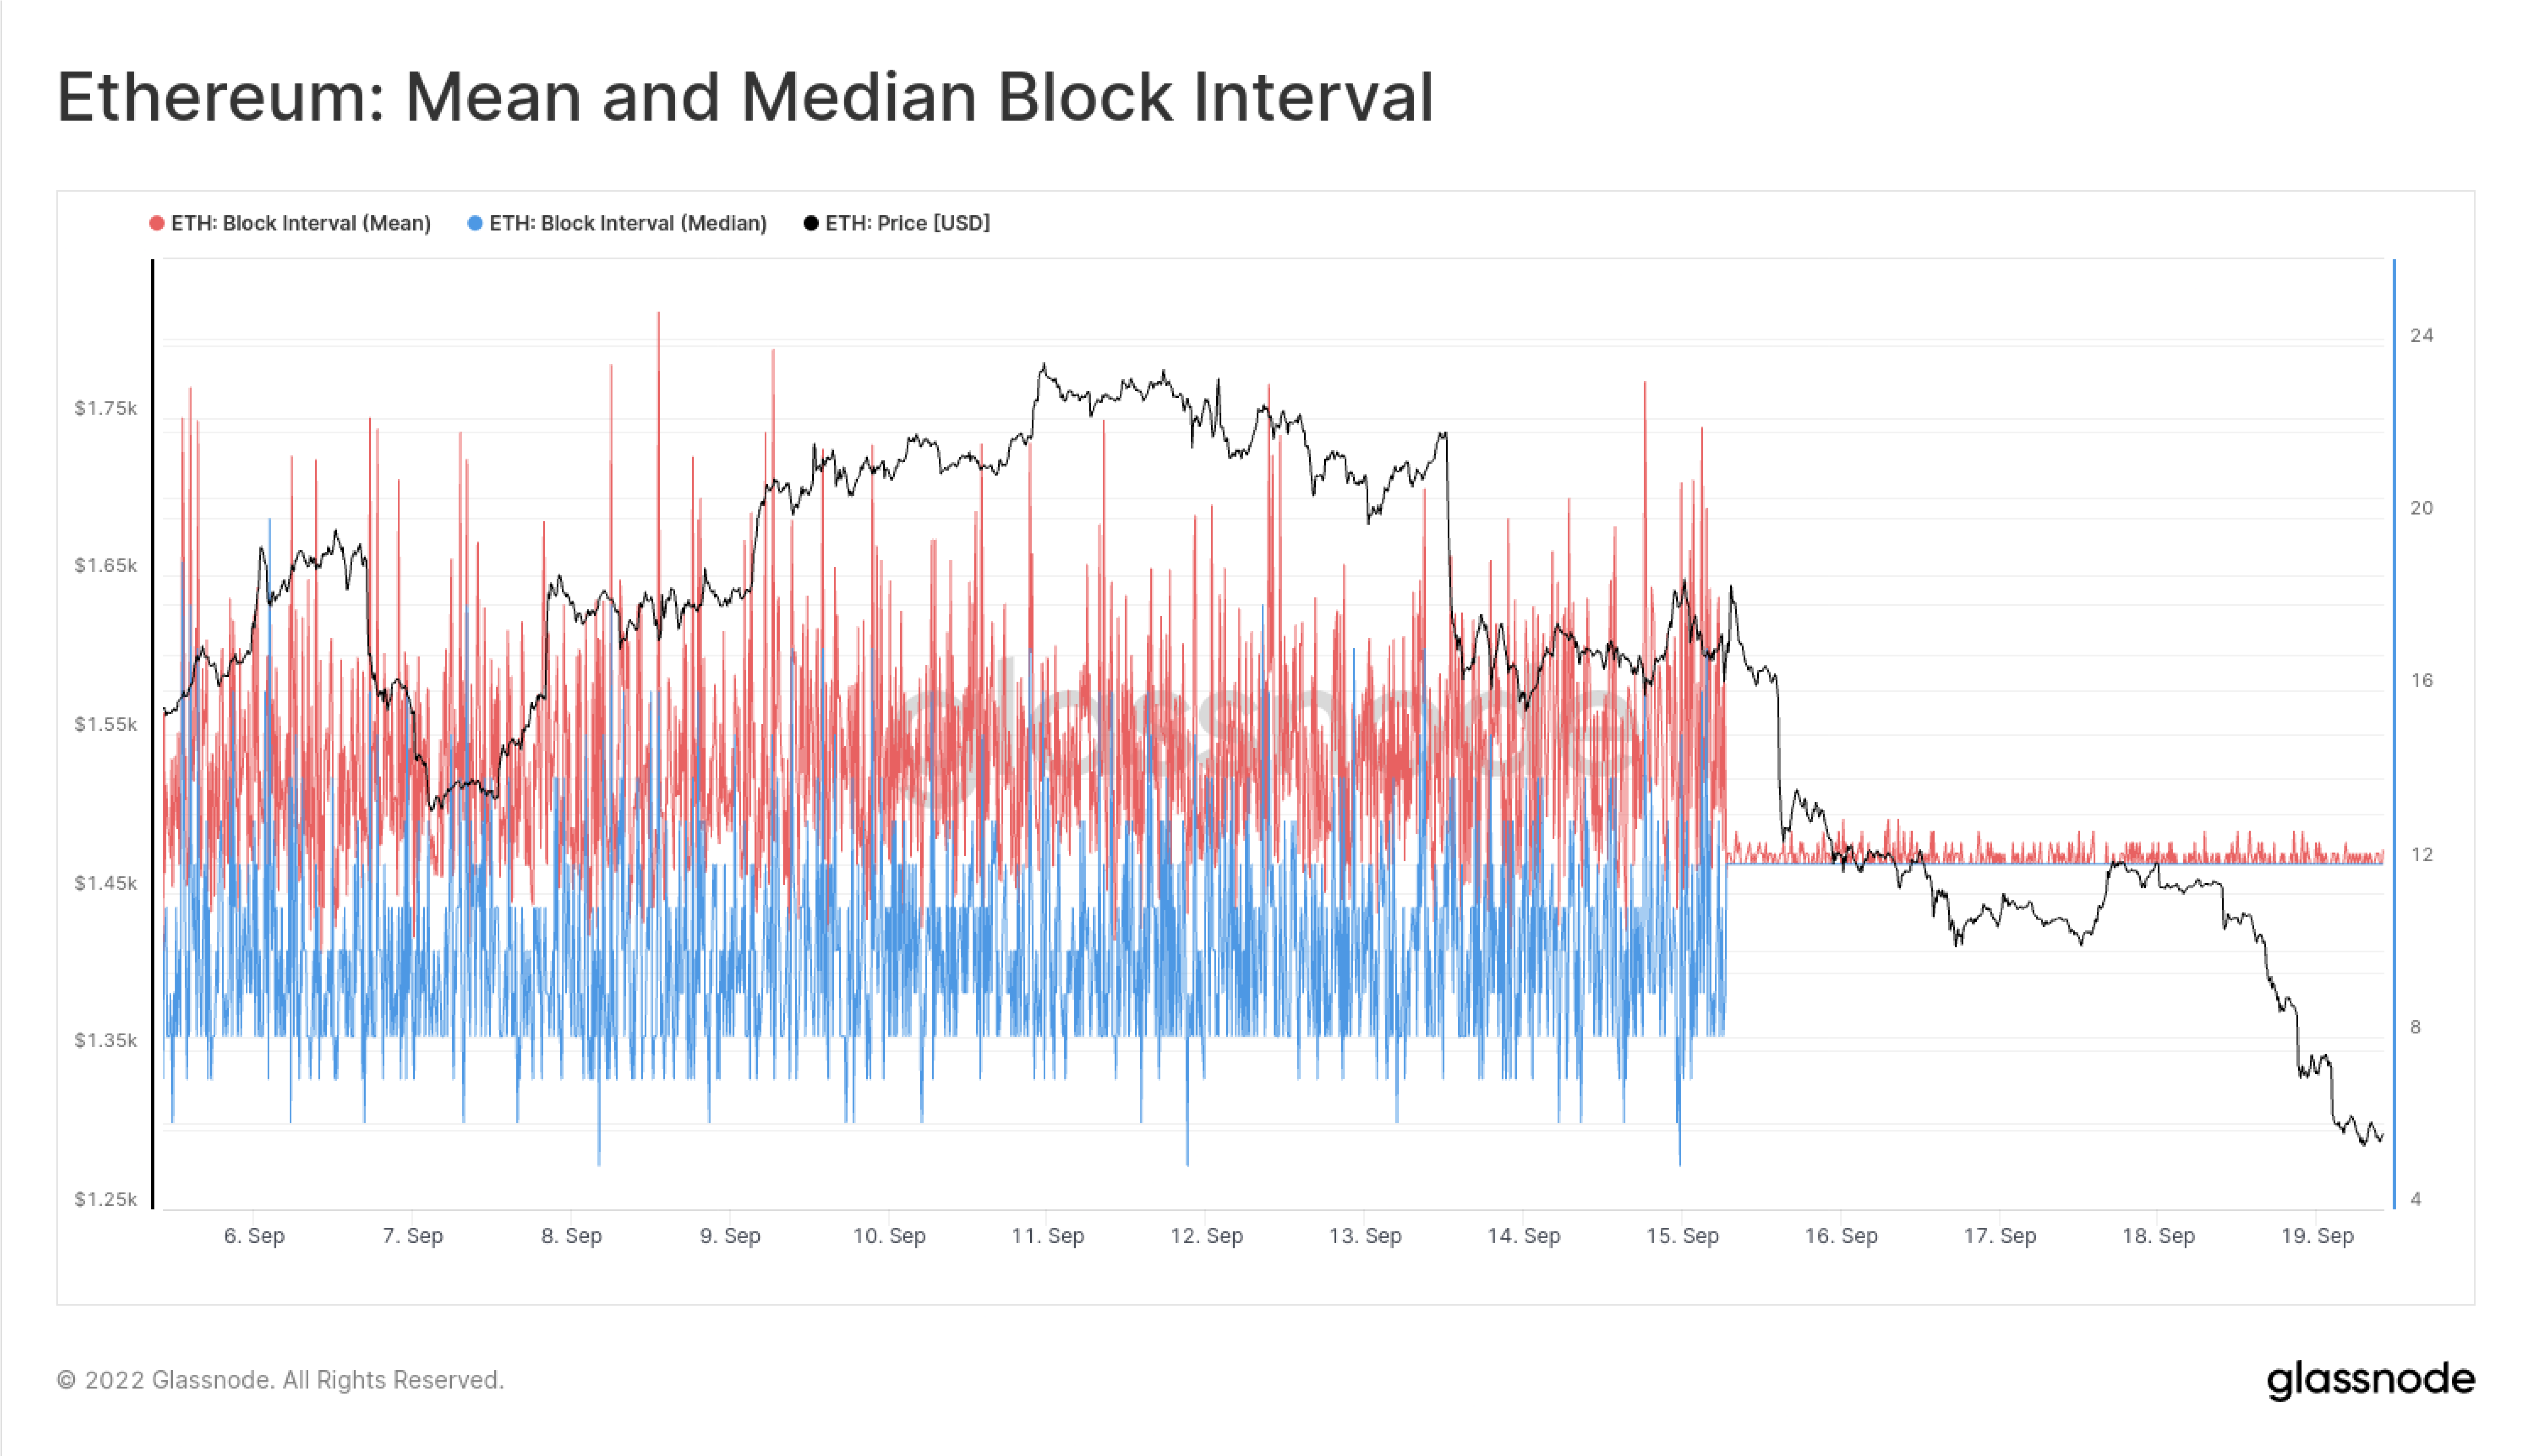
Arguably, there is no better chart to demonstrate just how dramatic this transition was, than observing Ethereum Mean and Median blocktimes. Here we can clearly see the end of the probabilistic, and naturally variable PoW mining, and the switch to the engineered precision of PoS, sporting a consistent 12-second blocktime.
In this report, we will explore this historic event, as it happened, across both trading markets, and on-chain blockchain metrics. We will analyse the Merge from the following angles:
- Positioning of leveraged traders in Futures and Options markets.
- The effect of the Merge transition on consensus parameters.
- Current total ETH staked and the distribution of staking providers.
- Modelled vs actual impacts on the ETH supply.
New Ethereum Metrics, Workbench Presets, and Dashboards
With the Ethereum Merge now behind us, we are pleased to launch a suite of new Ethereum Proof-of-Stake metrics, Workbench Pre-sets, and Dashboards.
New PoS Metrics:
- Block Production: Slot Height, Epoch Height, Missed Blocks, Orphaned Blocks
- Network Stability: Participation Rate, Attestation Count
- Validator Movement: Voluntary Exit Count, Active Validators, Slashing Event Count
- Validator Balances: Total Effective Balance, Stake Effectiveness, Average Validator Balance, Staking Deposits
- Validator Economics: Estimated Annual Issuance ROI per validator ,Estimated Annual Issuance
New Dashboards: Proof-of-Stake Consensus and Proof-of-Stake Supply Dynamics
Workbench Pre-sets: Net Inflation Rate, Net Supply Change, Post-Merge Supply Dynamics, Change in Active Validators, Cumulative Exit Events, Total and Effective Balance, Staked Realized Price
Selling The News
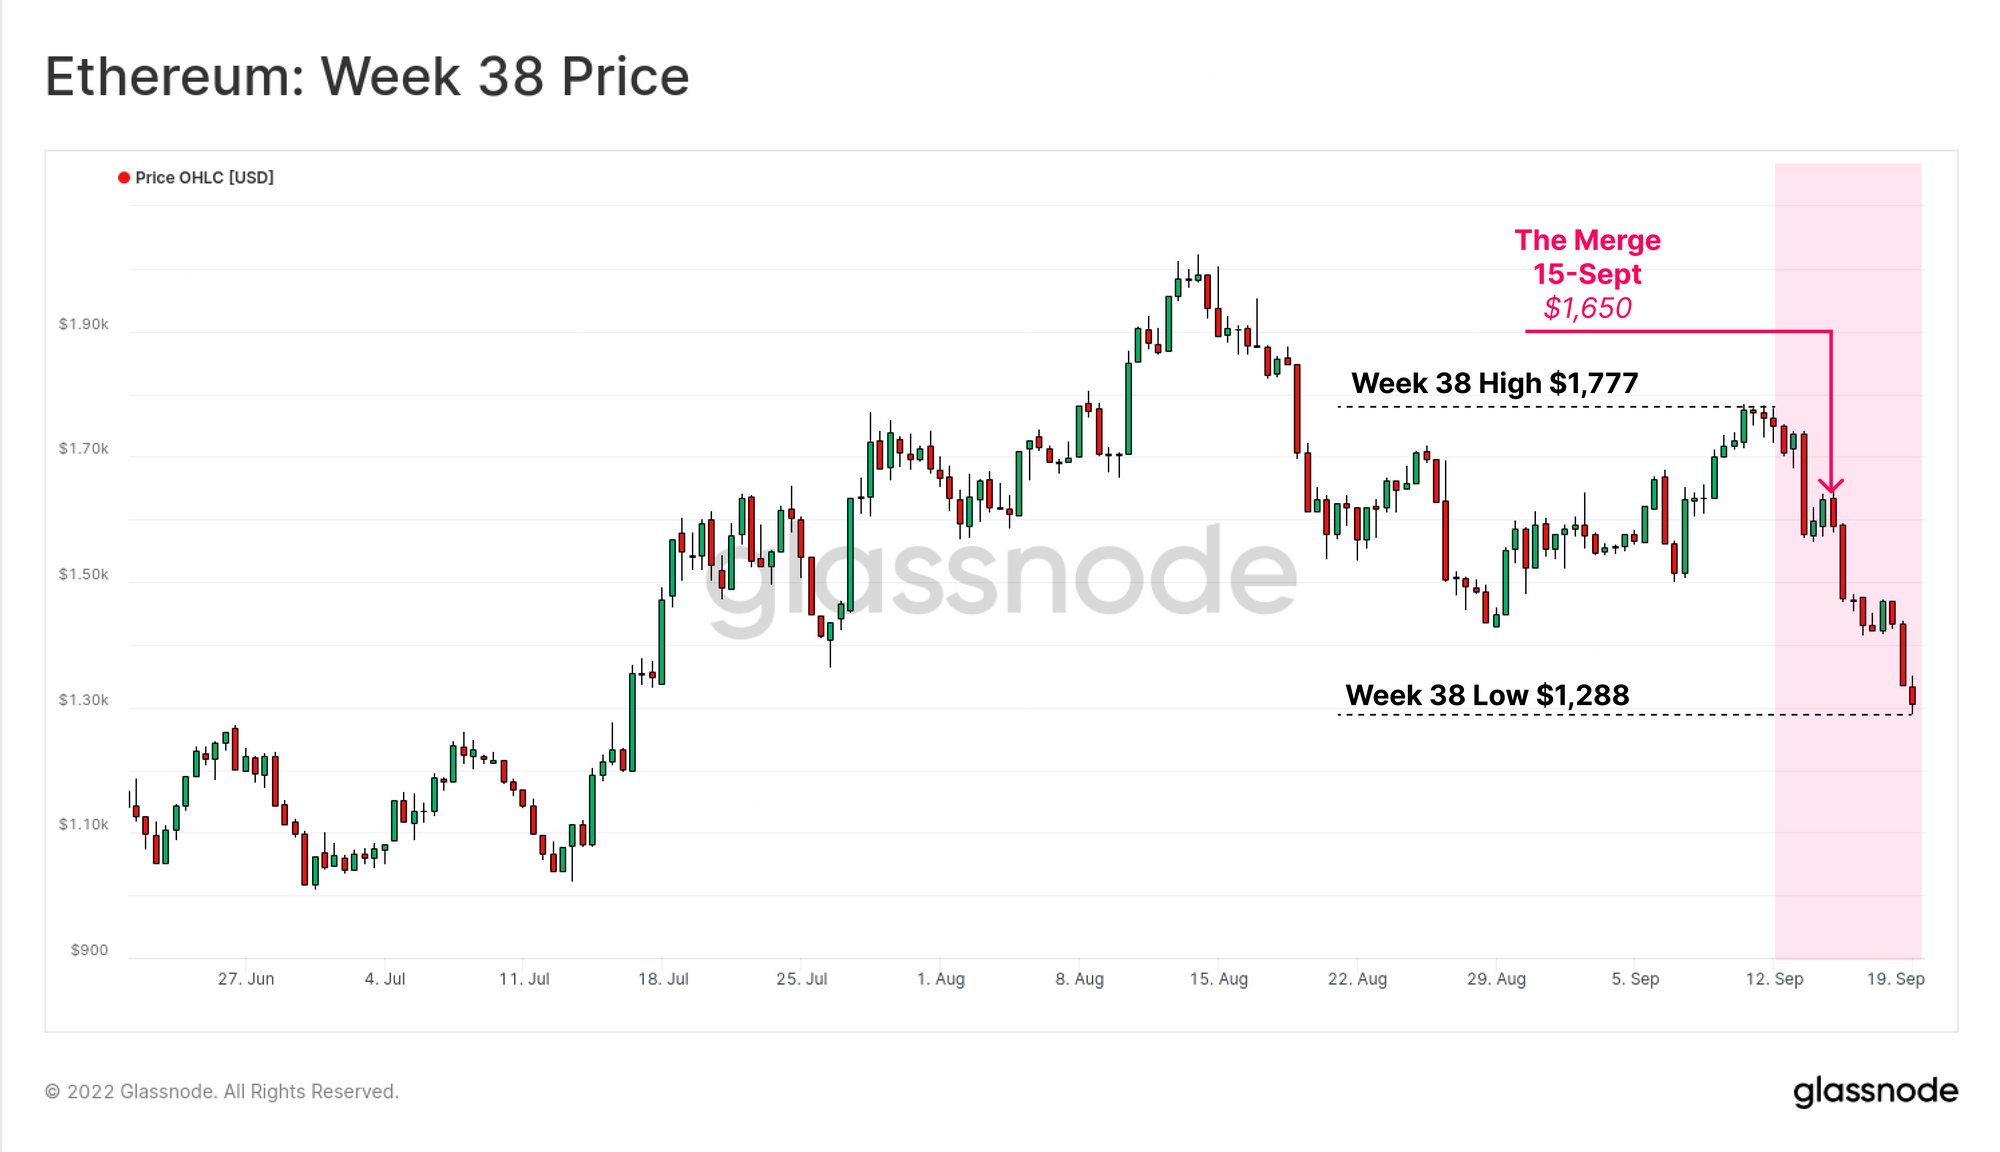
In our WoC 32 Report, we described how market positioning across Futures and Options markets appeared to be well hedged for a sell-the-news style event. Indeed, ETH prices have sold off, from a weekly high of $1,777, to around $1,650 at the time of the Merge, before collapsing to a low of $1,288 on Sunday.
The market has effectively given back all gains made since mid July. Such a sell-off is the result of multiple factors, not least of which being traders taking profits after ETHs recent out-performance. Being one of a small handful of assets that performed well during recent months in the prevailing macro-economic conditions, it is quite unsurprising that profits were taken, where profits were available.
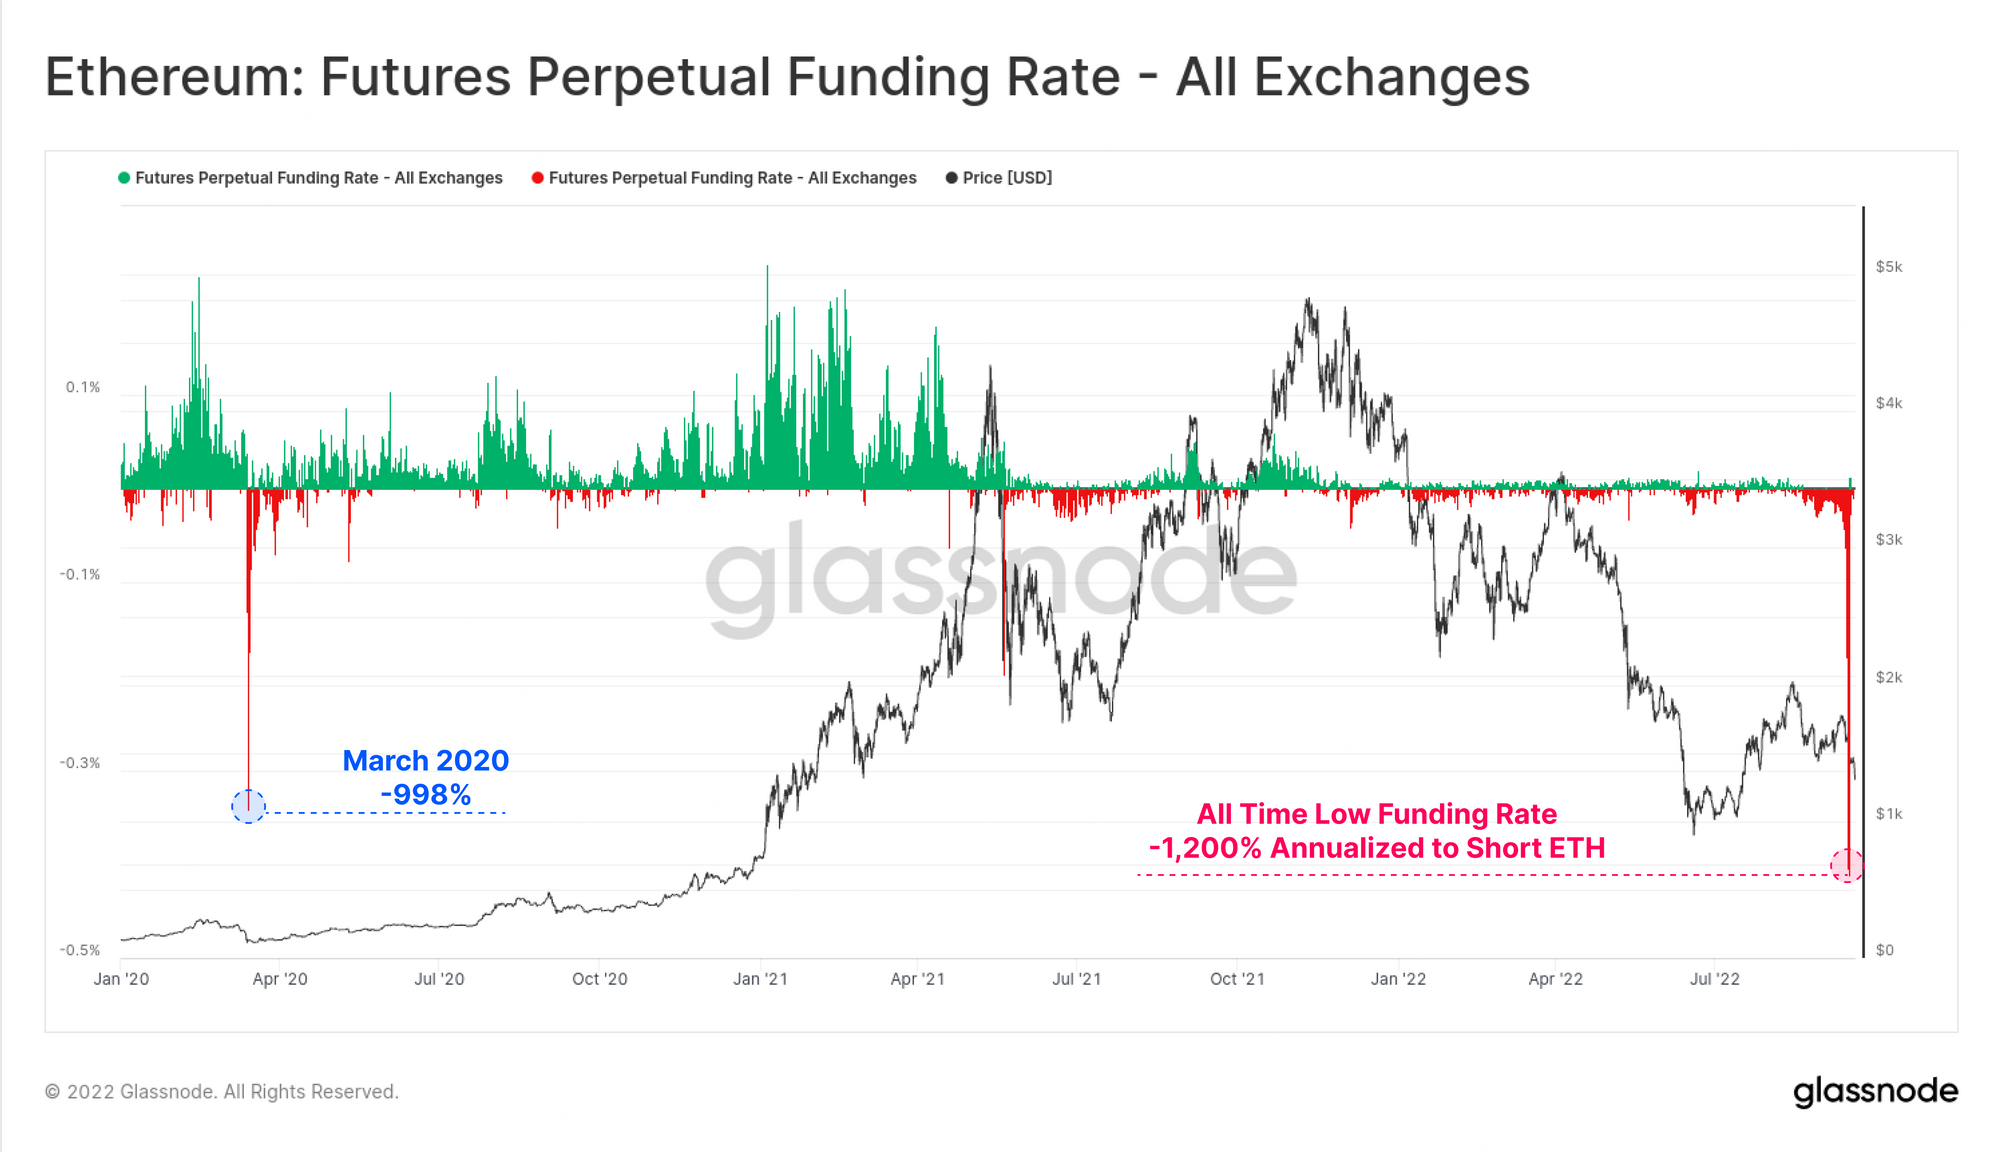
Right up until the Merge, traders in perpetual futures markets were paying an eye-watering 1,200% annualized in funding rates to maintain their short ETH positions. This is a new all time low negative funding rate, eclipsing the previous peak of -998% hit during the March 2020 sell-off.
Funding rates have since completely reverted to neutral, suggesting much of the short-term speculation premium has dissipated.
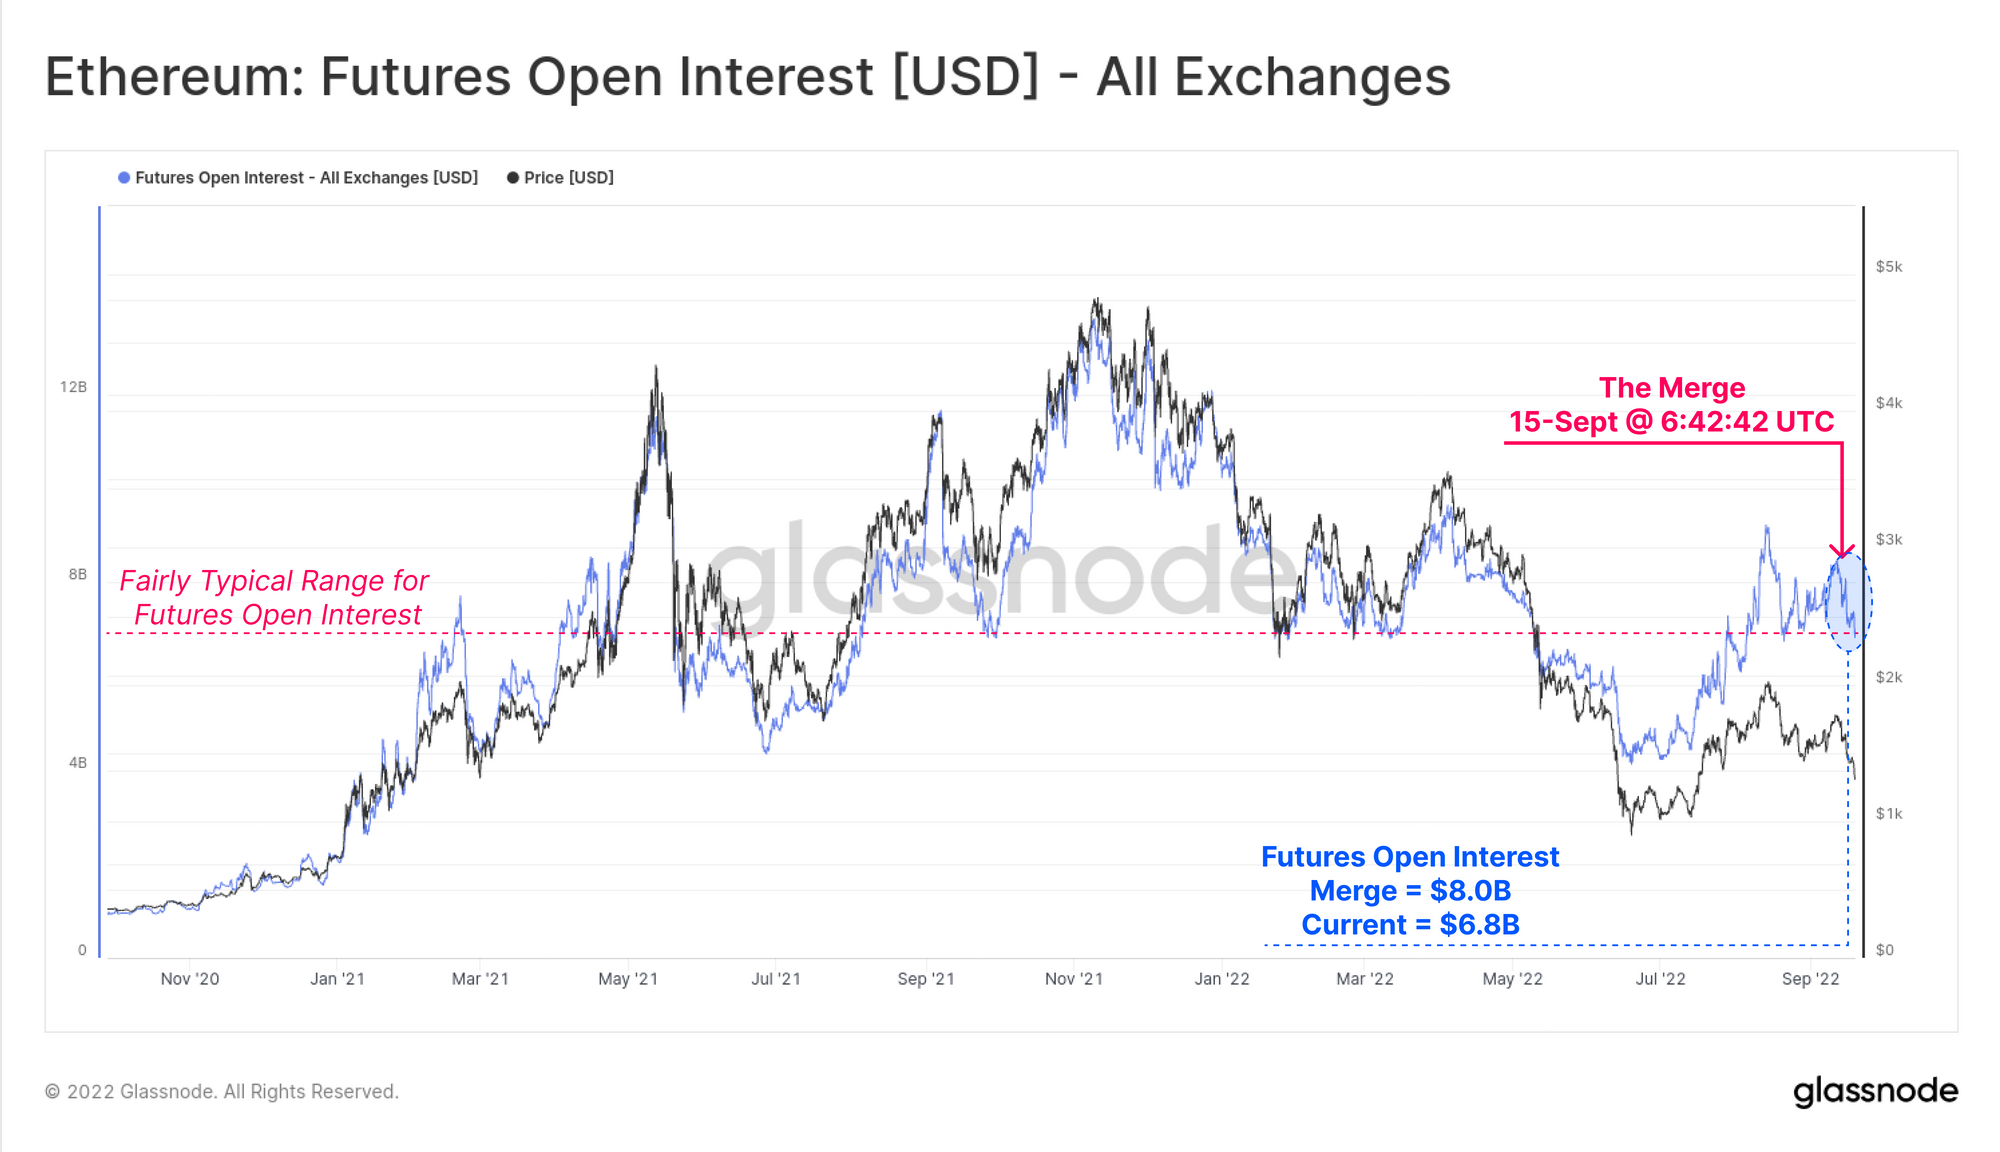
Total Futures Open Interest declined by 15% from $8.0B to $6.8B after the Merge, with both of these extremes being fairly typical in the context of 2021-22 markets. However, to keep this change in context, we must account for the influence of a changing ETH coin-price, which affects the USD value of ETH-denominated futures position sizes.
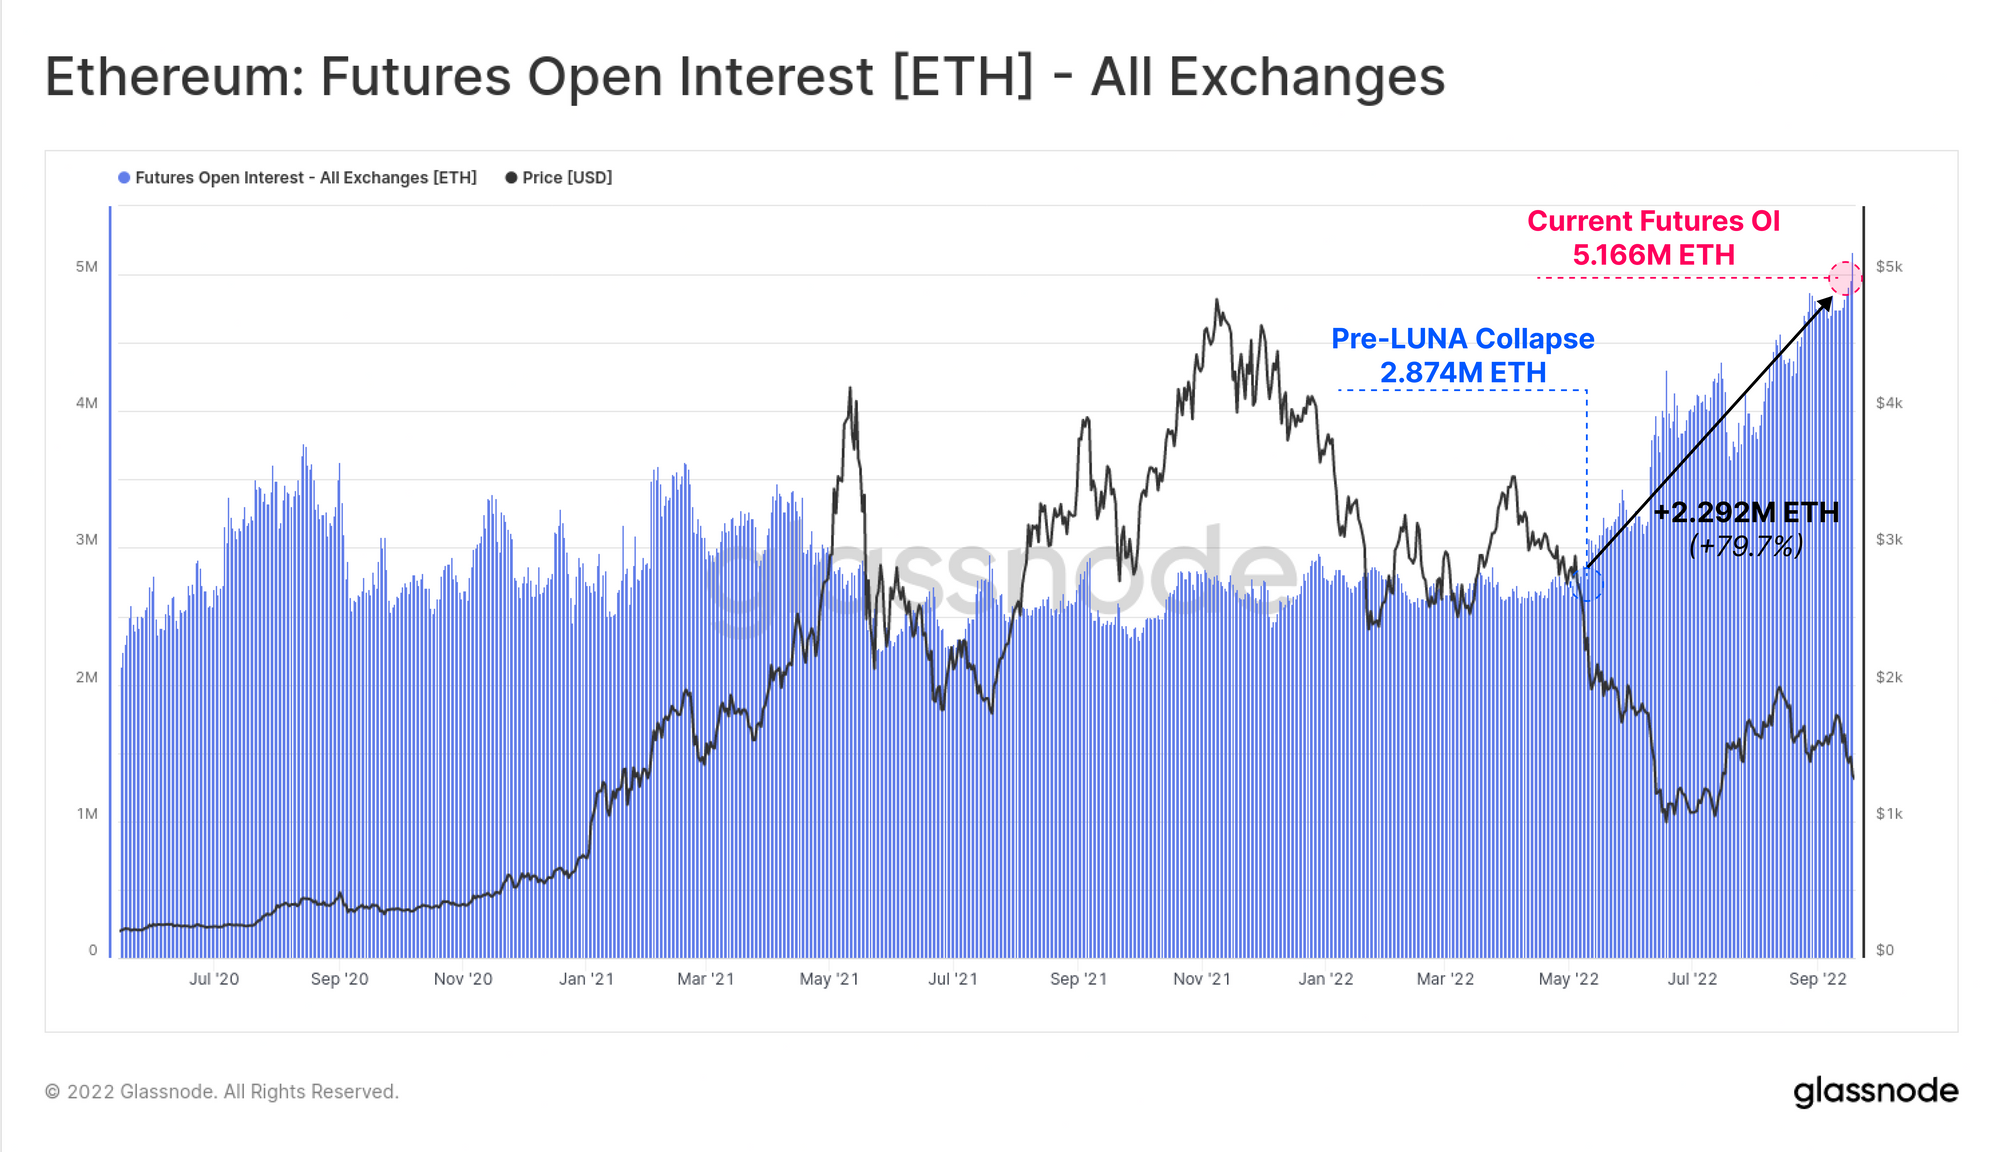
If we inspect Open Interest in an ETH denominated basis, we can see that futures Open Interest is actually at all-time-high, having increased by almost 80% since early-May. Over the last week, there appears to have actually been an increase in futures leverage, rather than a decrease, suggesting many risk hedging positions have not been closed.
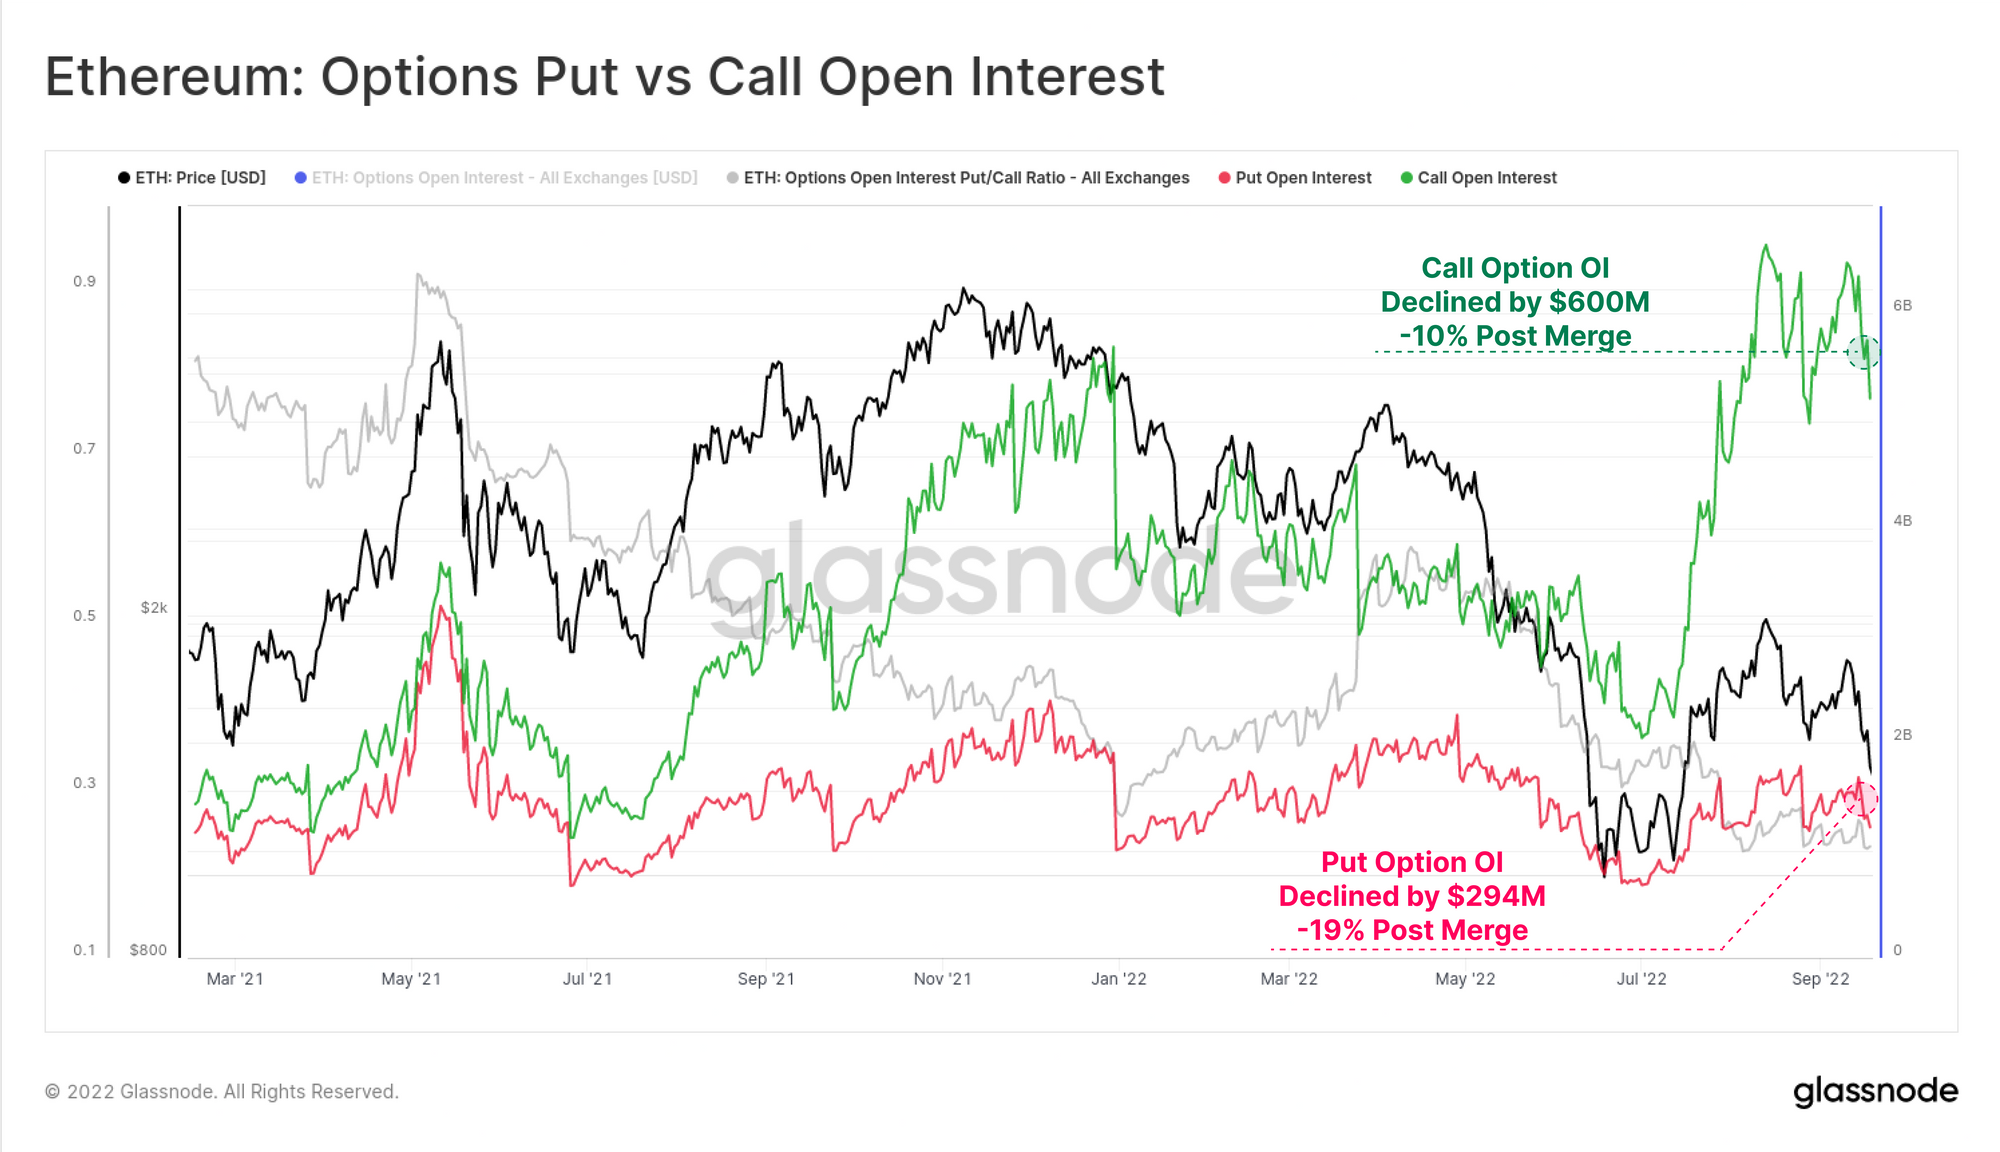
In options markets, where a large amount of recent ETH speculation took place, Call option Open Interest has declined by $600M post-Merge (a 10% decline). There remains a total of $5.2B in outstanding call option position value, which is still much higher than 2021 norms. Put option markets experienced a more significant relative drop of 19%, but this remains a much smaller scale $294M in net position value closed.
In many ways, it appears that ETH markets remain heavily utilized, levered up, and speculating on further upside, despite a -22% ETH price correction.
The On-chain Merge
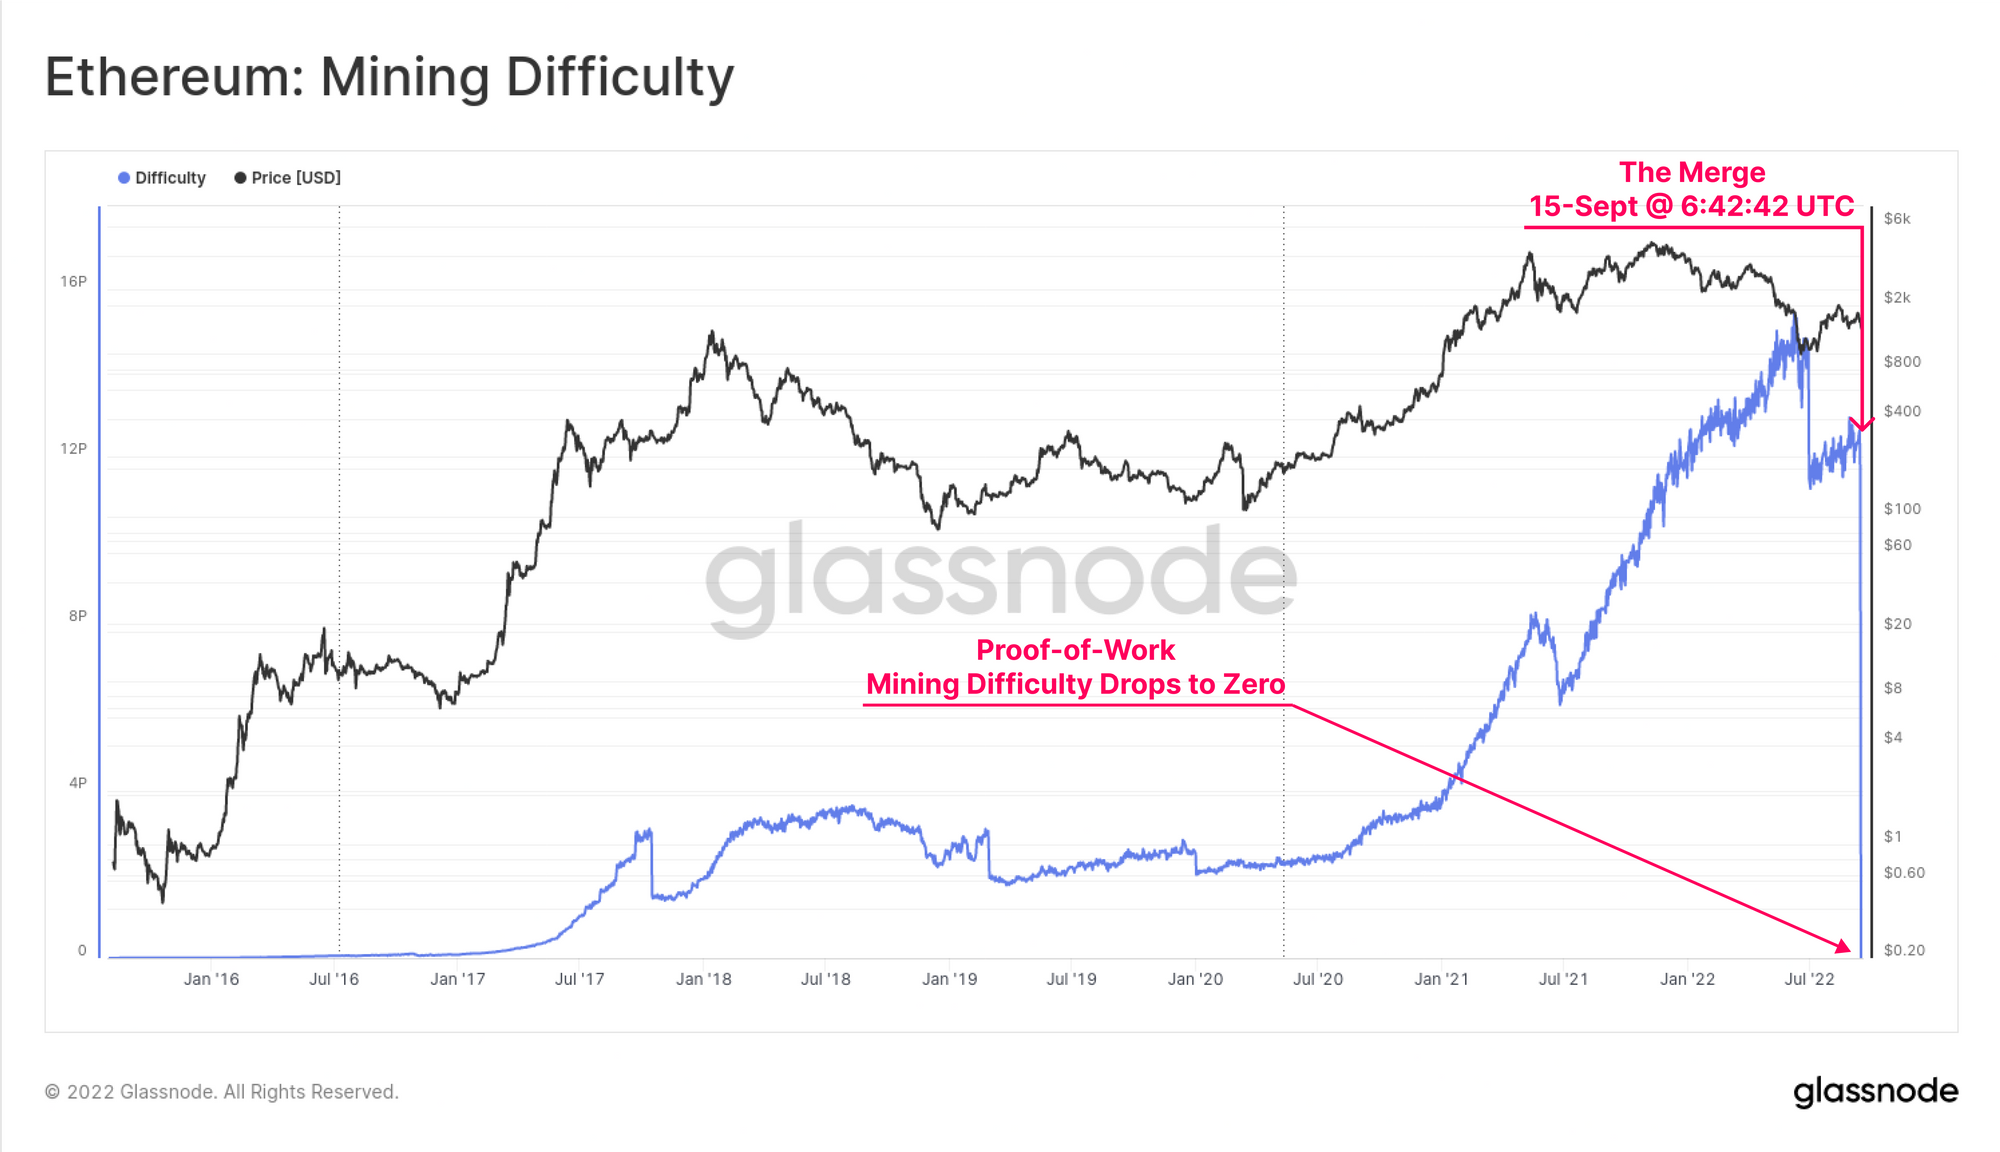
The end of the Proof-of-Work Ethereum era was marked by an immediate decline of mining difficulty to zero after the Merge. This process was instantaneous, with no wind-down period, nor any difficulty adjustments taking place. Revenue for PoW miners has effectively evaporated, leaving a fleet of GPU, and ASIC mining rigs seeking a new purpose.
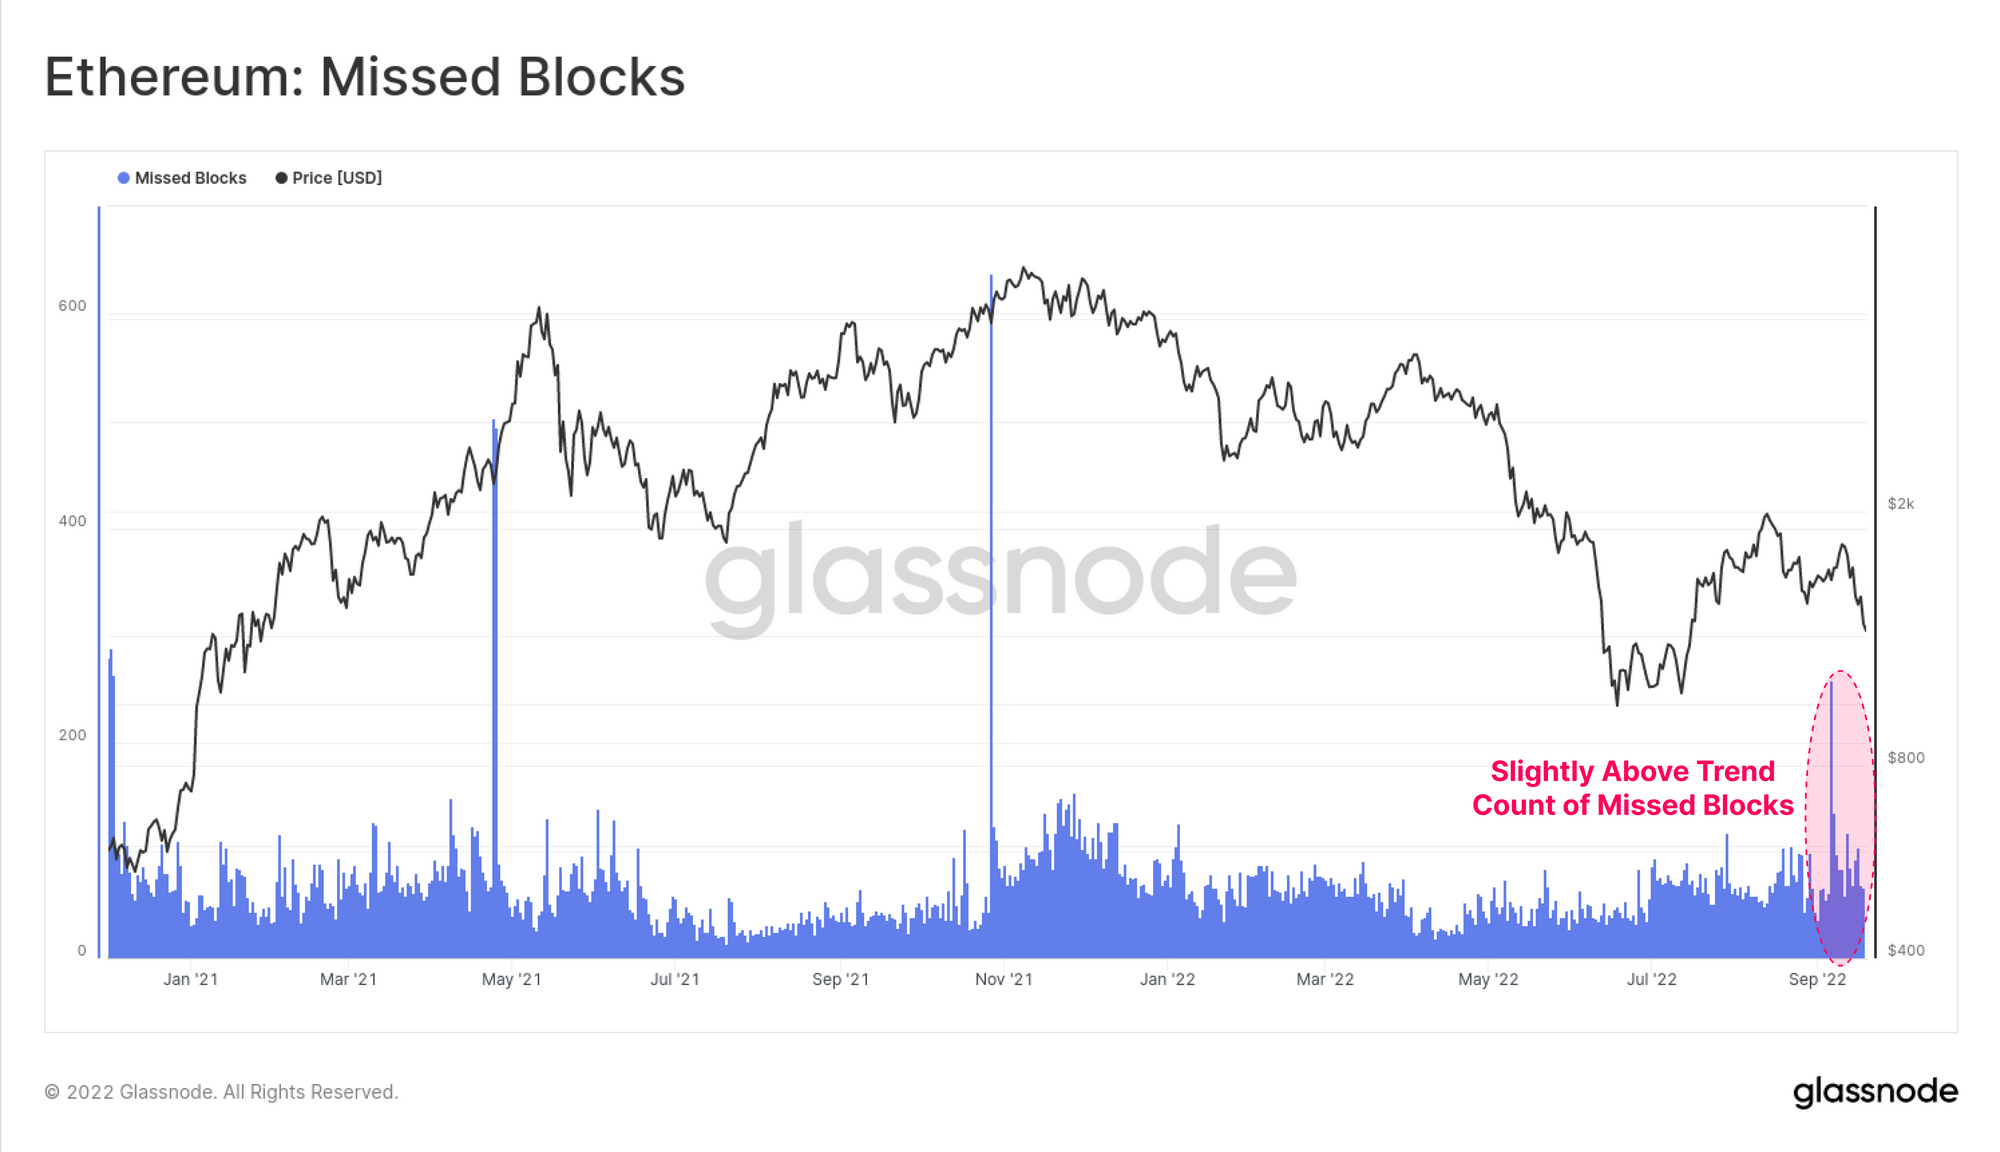
In place of miners, PoS utilises a pool of validators, which are programmatically organised into sets of committees, and block proposers for each 32-slot Epoch. One validator is assigned the role of block producer for each 12-second slot. However, in some instances, this validator may be offline or unreachable at the time, resulting in a Missed Block.
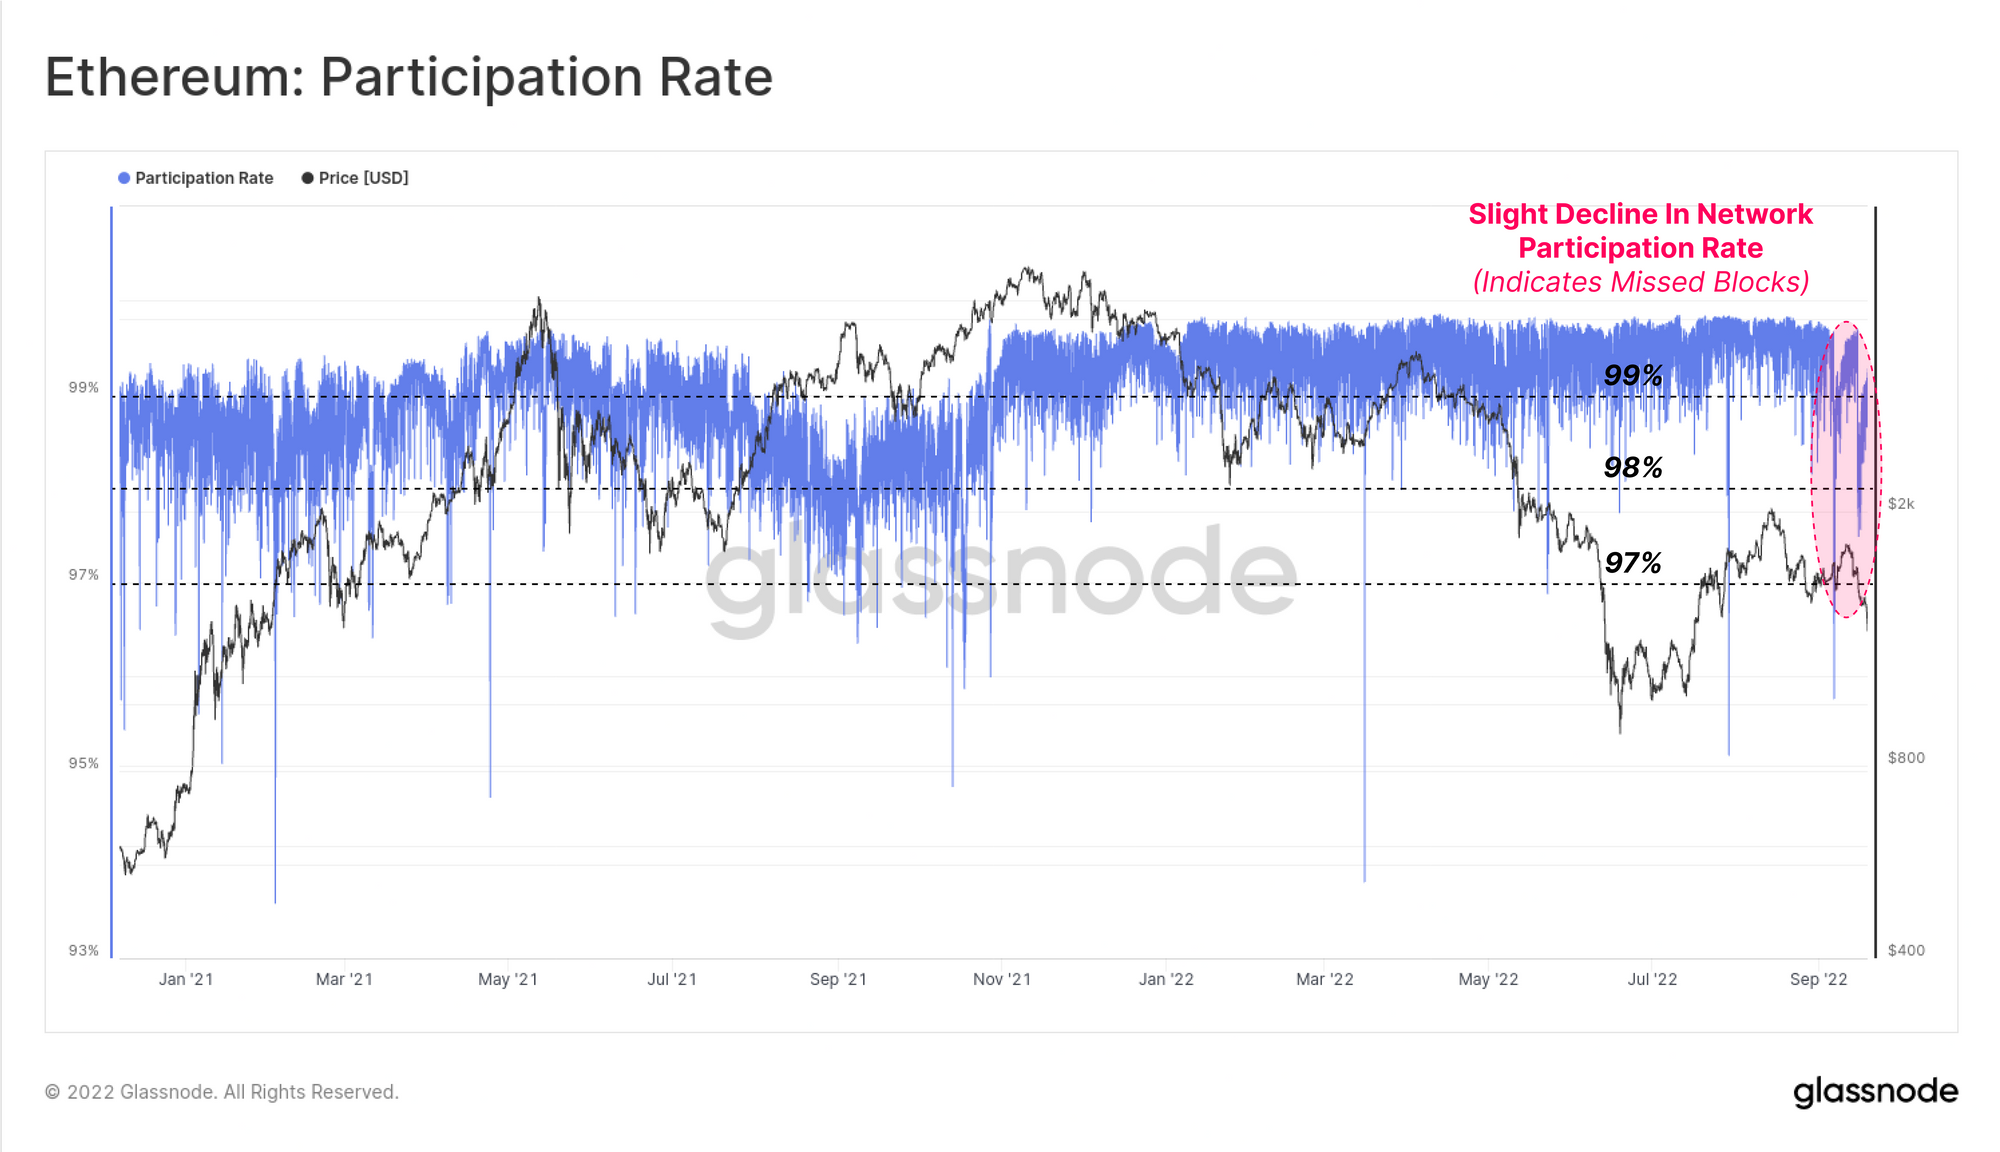
We measure this aggregate validator network uptime using the Participation Rate metric, which is the ratio between the number of blocks successfully produced (i.e. not missed), and the total available slots. As the chart below shows, Participation rates well in excess of 99% have been the norm for much of the Beacon Chains life to date. It will be an interesting performance metric to watch as more load is imposed on the chain, and more validators enter the fold.
In the weeks leading up to the Merge, a slight decline in Participation Rate can be observed, falling below the typical 99% level to around 97.5%. Post-Merge, this has reverted back into the 99%+ range, suggesting only a brief disruption to some sub-set of validators.
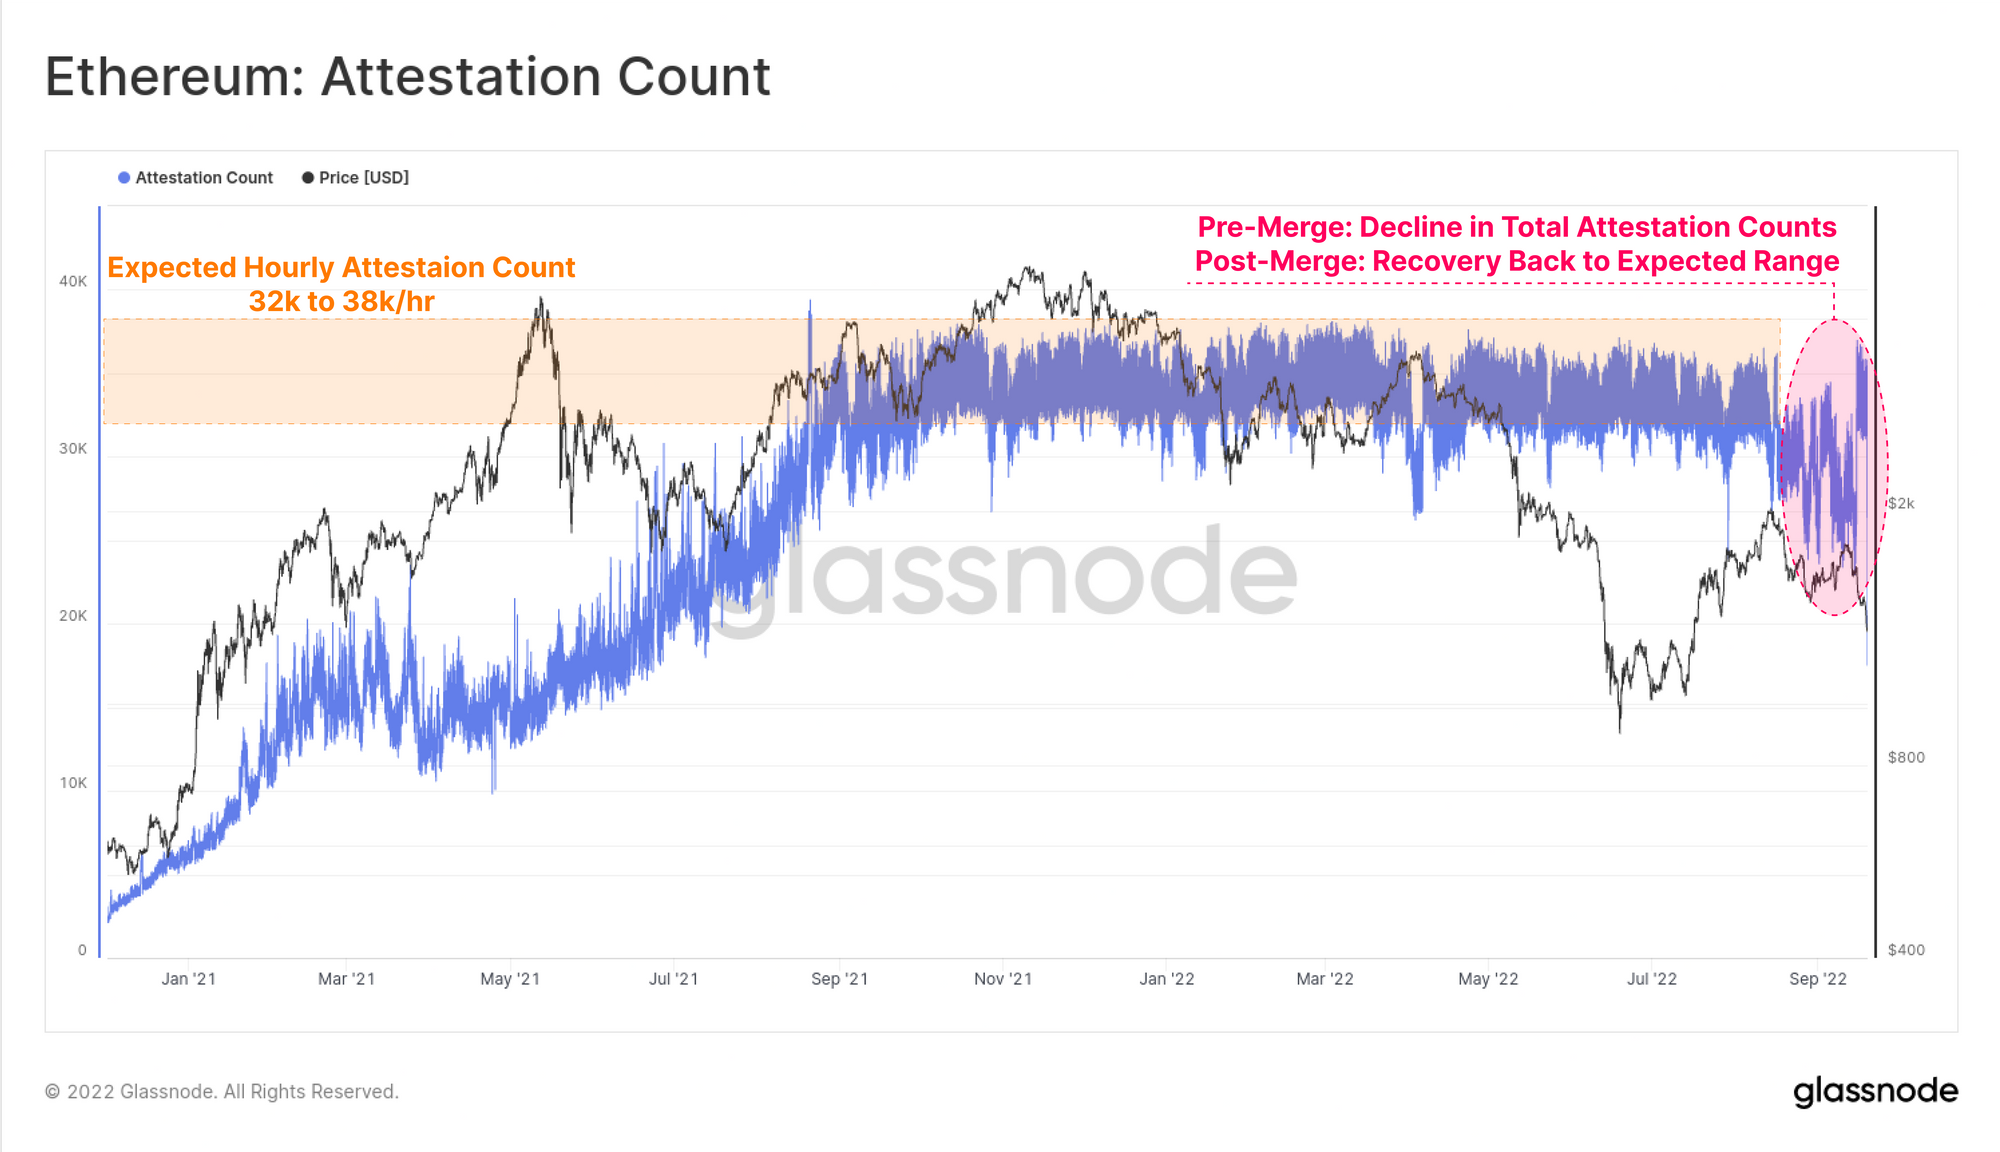
The number of attestation votes on the chain-tip also experienced a brief pre-Merge decline, but has similarly recovered back into the expected 32k to 38k attestations/hour range. It is possible this reflects node issues with a larger sized staking operator, or perhaps a software client bug, where numerous validators were affected in a short window of time.
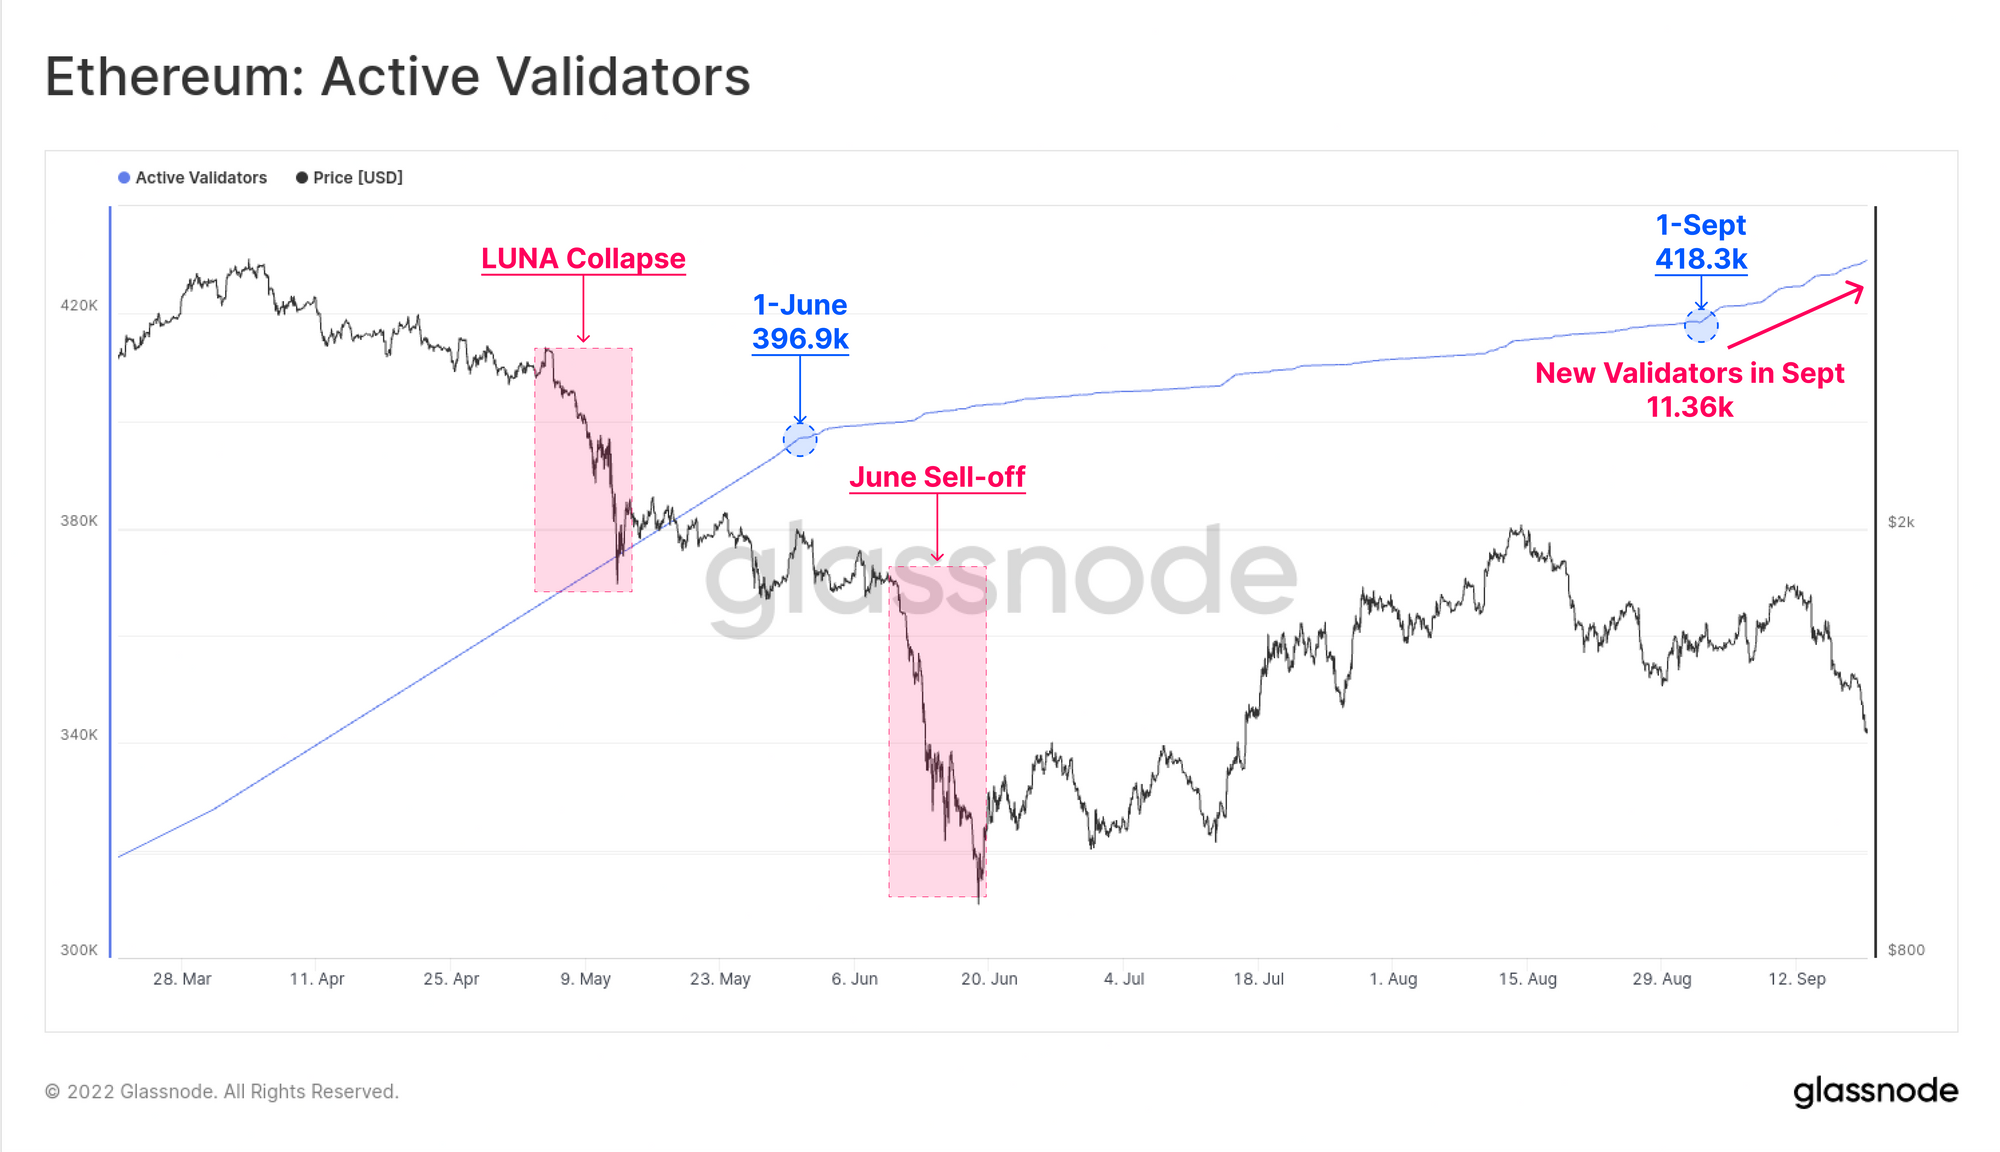
Ethereum currently has over 429.6k Active Validators on the network. The chart below shows the last 6-months, where the gradient of new validators can be seen to increase markedly in the lead up to, and following the Merge. Over 11.36k Validators have come online in September alone, signifying a growing investor confidence as the technical challenges of the Merge are de-risked.
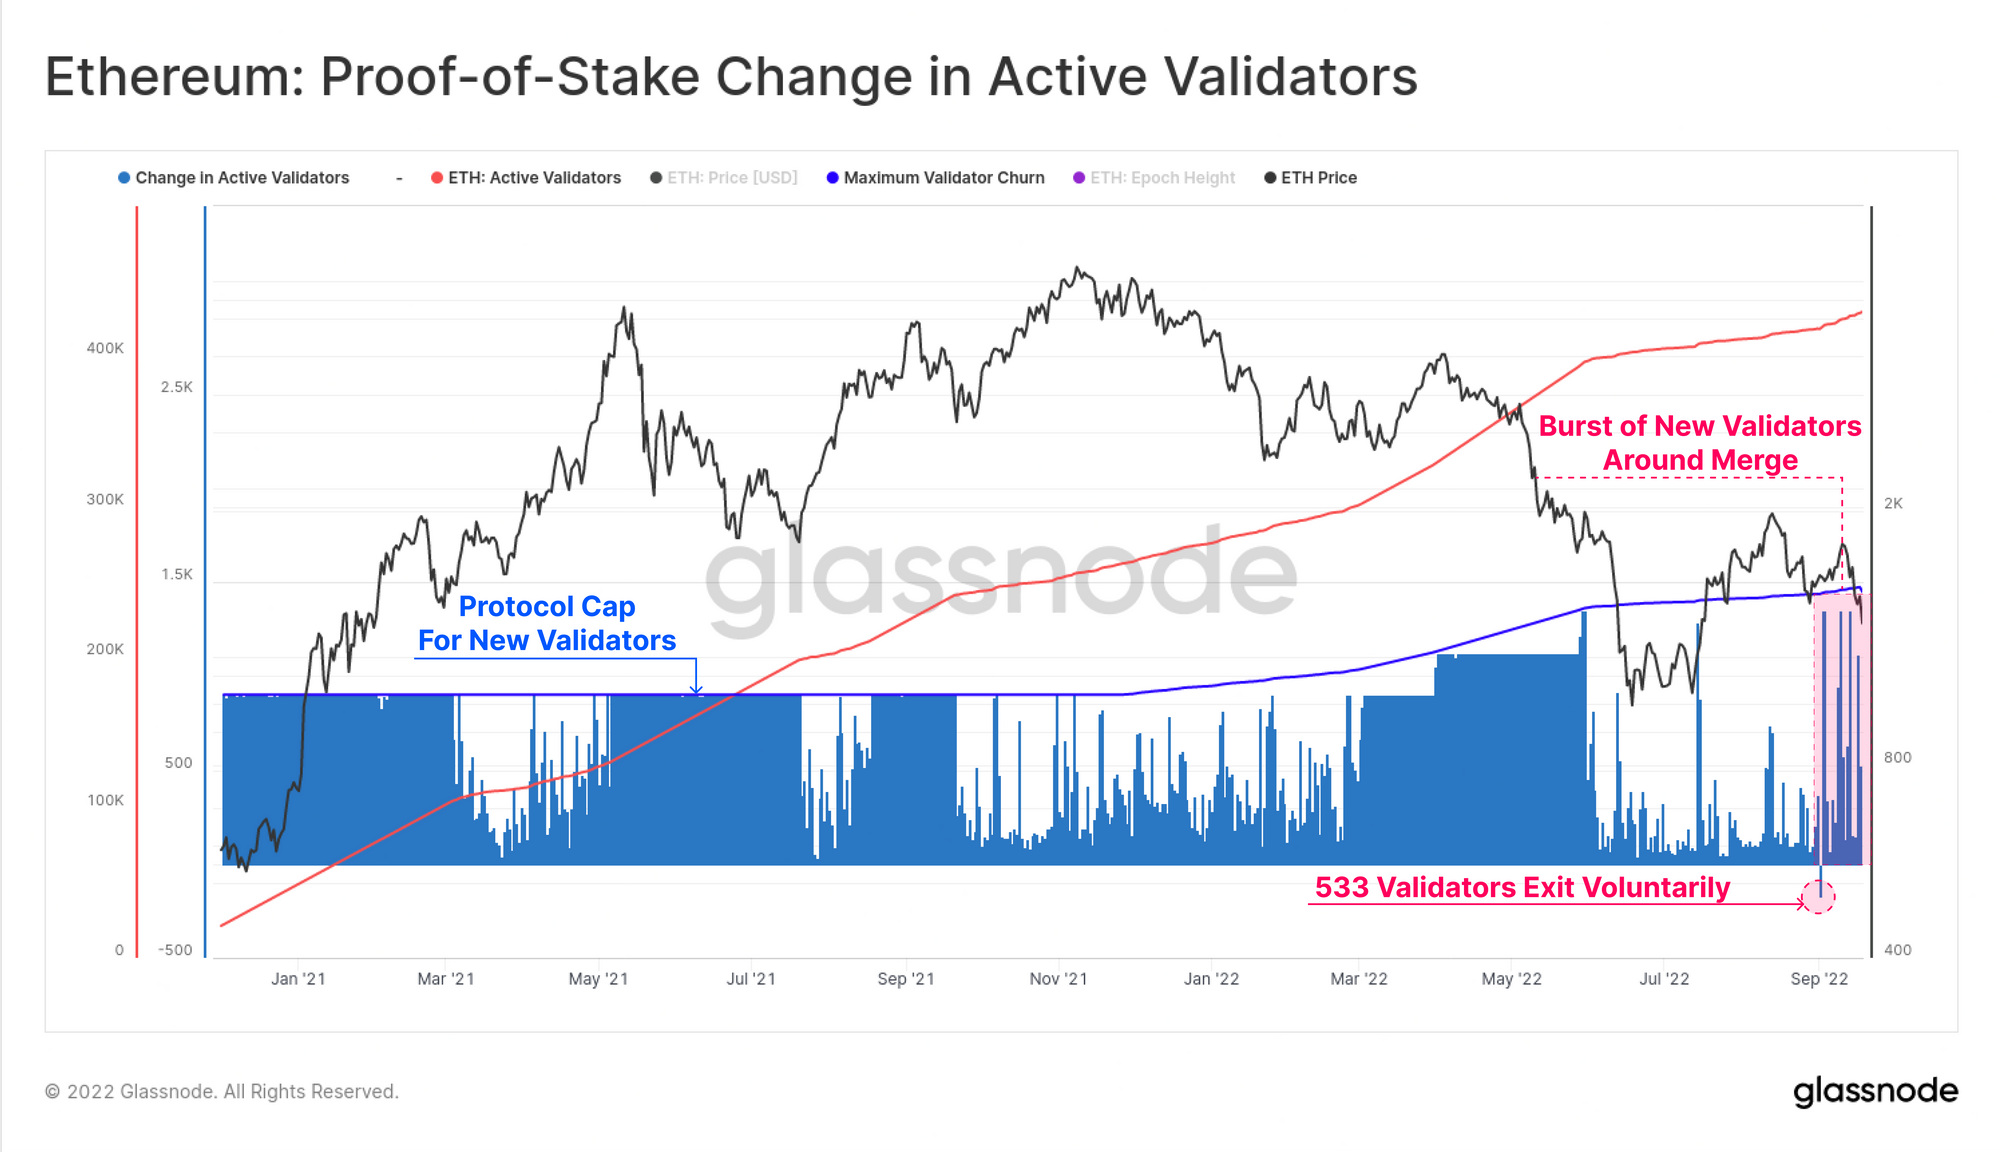
When validators opt into, or out of the staking pool, they are constrained by a protocol set limit on total validator churn per Epoch. The chart below shows this cap (blue trace) alongside a somewhat barcode style chart, which shows the daily change in Active Validators. We can see a handful of periods where the influx of validators hit the limit cap in the past.
The recent burst of new validator activity in September is visible, although it remains quite light relative to the heavier periods seen in 2021.
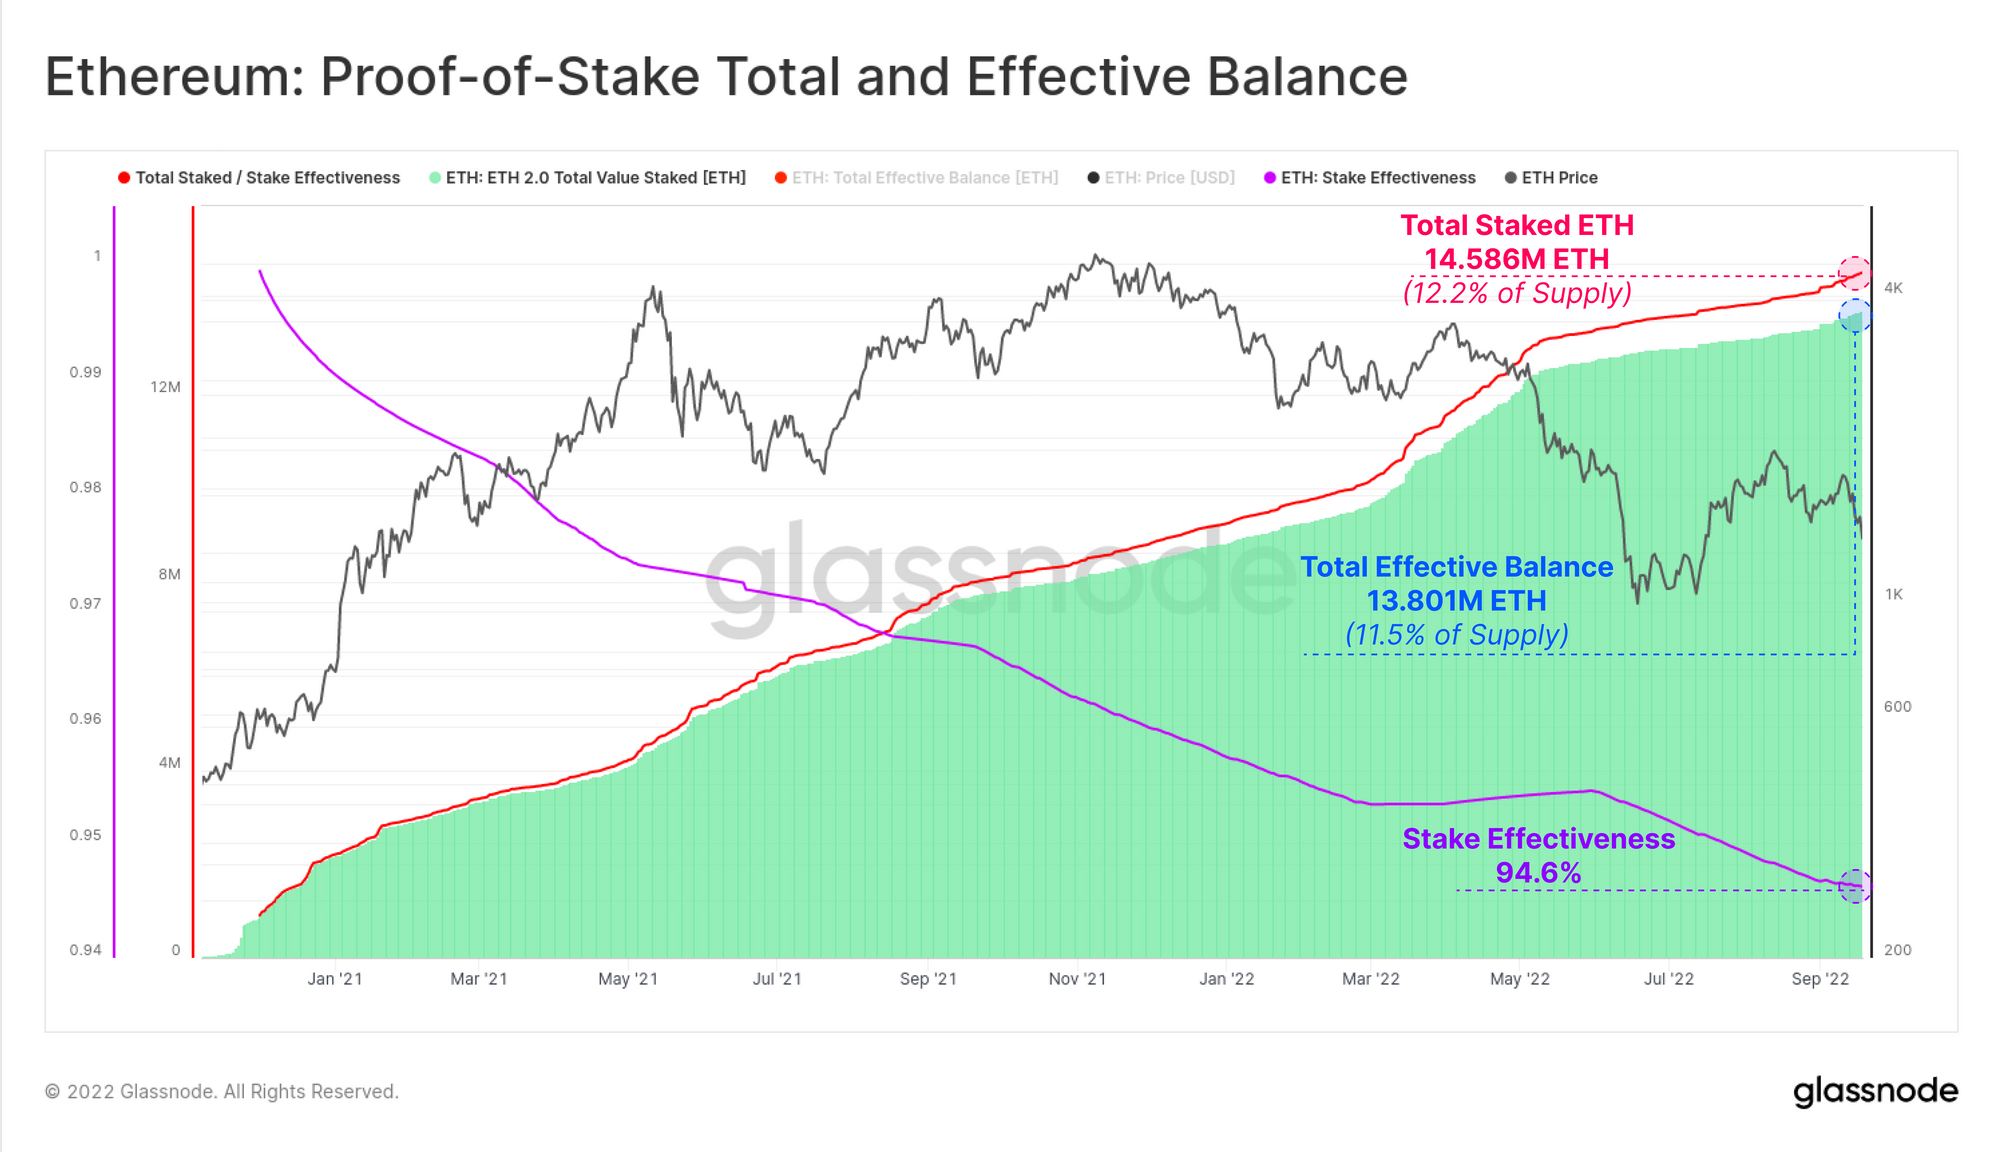
With a total of 429.6k Active Validators, there is now over 14.586M ETH staked, representing 12.2% of the total ETH supply. The Total ETH staked will change over time as a result of:
- New Deposits, and eventually Withdrawals (after the Shanghai Fork)
- Revenue earned from issuance and fees (balance increase)
- Inactivity leak if validators often miss blocks or attestations (balance decreases).
- Slashing in the event of malicious behavior (balance decreases).
The Total Staked Balance differs from a new metric called Effective Balance, which is the portion of ETH which is actively participating in consensus. Effective Stake is capped per validator at 32 ETH on the upside, and decreases to the nearest 1 ETH increment below this in the event of leaking or slashing.
The total Effective Balance is currently at 13.801M ETH, resulting in a Stake Effectiveness rate of 94.6%.
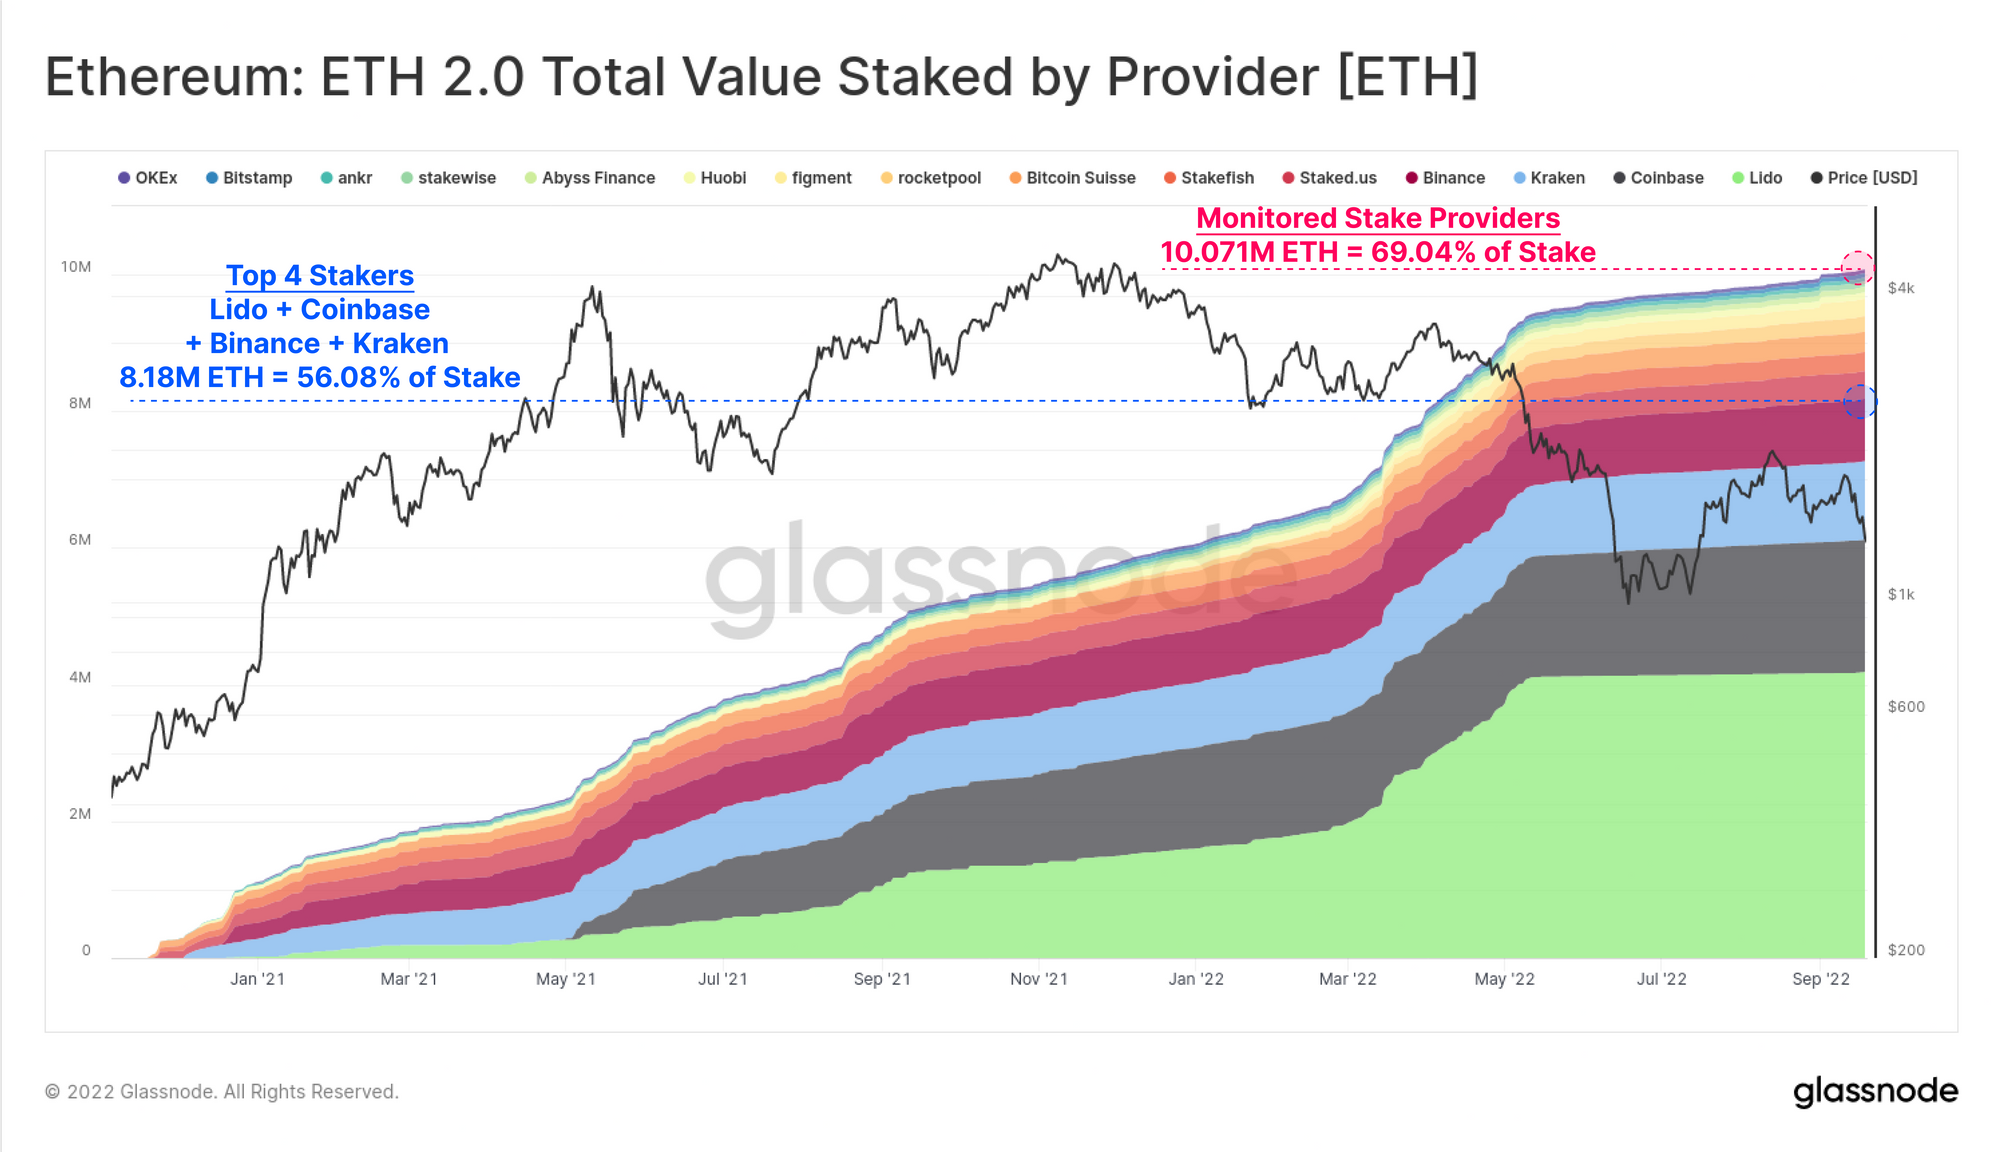
A majority proportion of Staked ETH is hosted by a variety of staking service providers that we monitor, accounting for 10.071M ETH (69.04% of the total). The top 4 service providers are Lido, Coinbase, Kraken, and Binance, whom manage a combined 8.18M ETH staked, account for 56.08% of the total stake.
One of the newest growing staking pools we monitor, Rocketpool, is a distributed validating node operator competing with market leader Lido. Rocketpool remains very small in scale, but is growing, with 228.2k ETH hosted, and representing 1.56% of the total stake so far.
New Content: Before The Merge - Analyzing the Ethereum Beacon Chain
The #Ethereum Merge introduces a suite of new on-chain metrics which describe Proof-of-Stake consensus. In our latest collaboration with CoinMarketCap, we explore these new Proof-of-Stake metrics and profile Beacon Chain network performance since genesis. Read our new report profiling the Beacon Chain.
The Reality of Supply
One of the most talked about components of the Merge has been the dramatic decline in supply issuance, which when coupled with the EIP1559 burn, is expected to lead to a degree of ETH supply deflation.
Since the Beacon Chain genesis on 1-Dec-2020, Ethereum has actually had two sources of net supply issuance, the PoW chain, and the PoS chain. In Aug-2021, EIP1559 was implemented, which created a fee burn feature on the PoW chain, a feature which has now moved to the PoS chain.
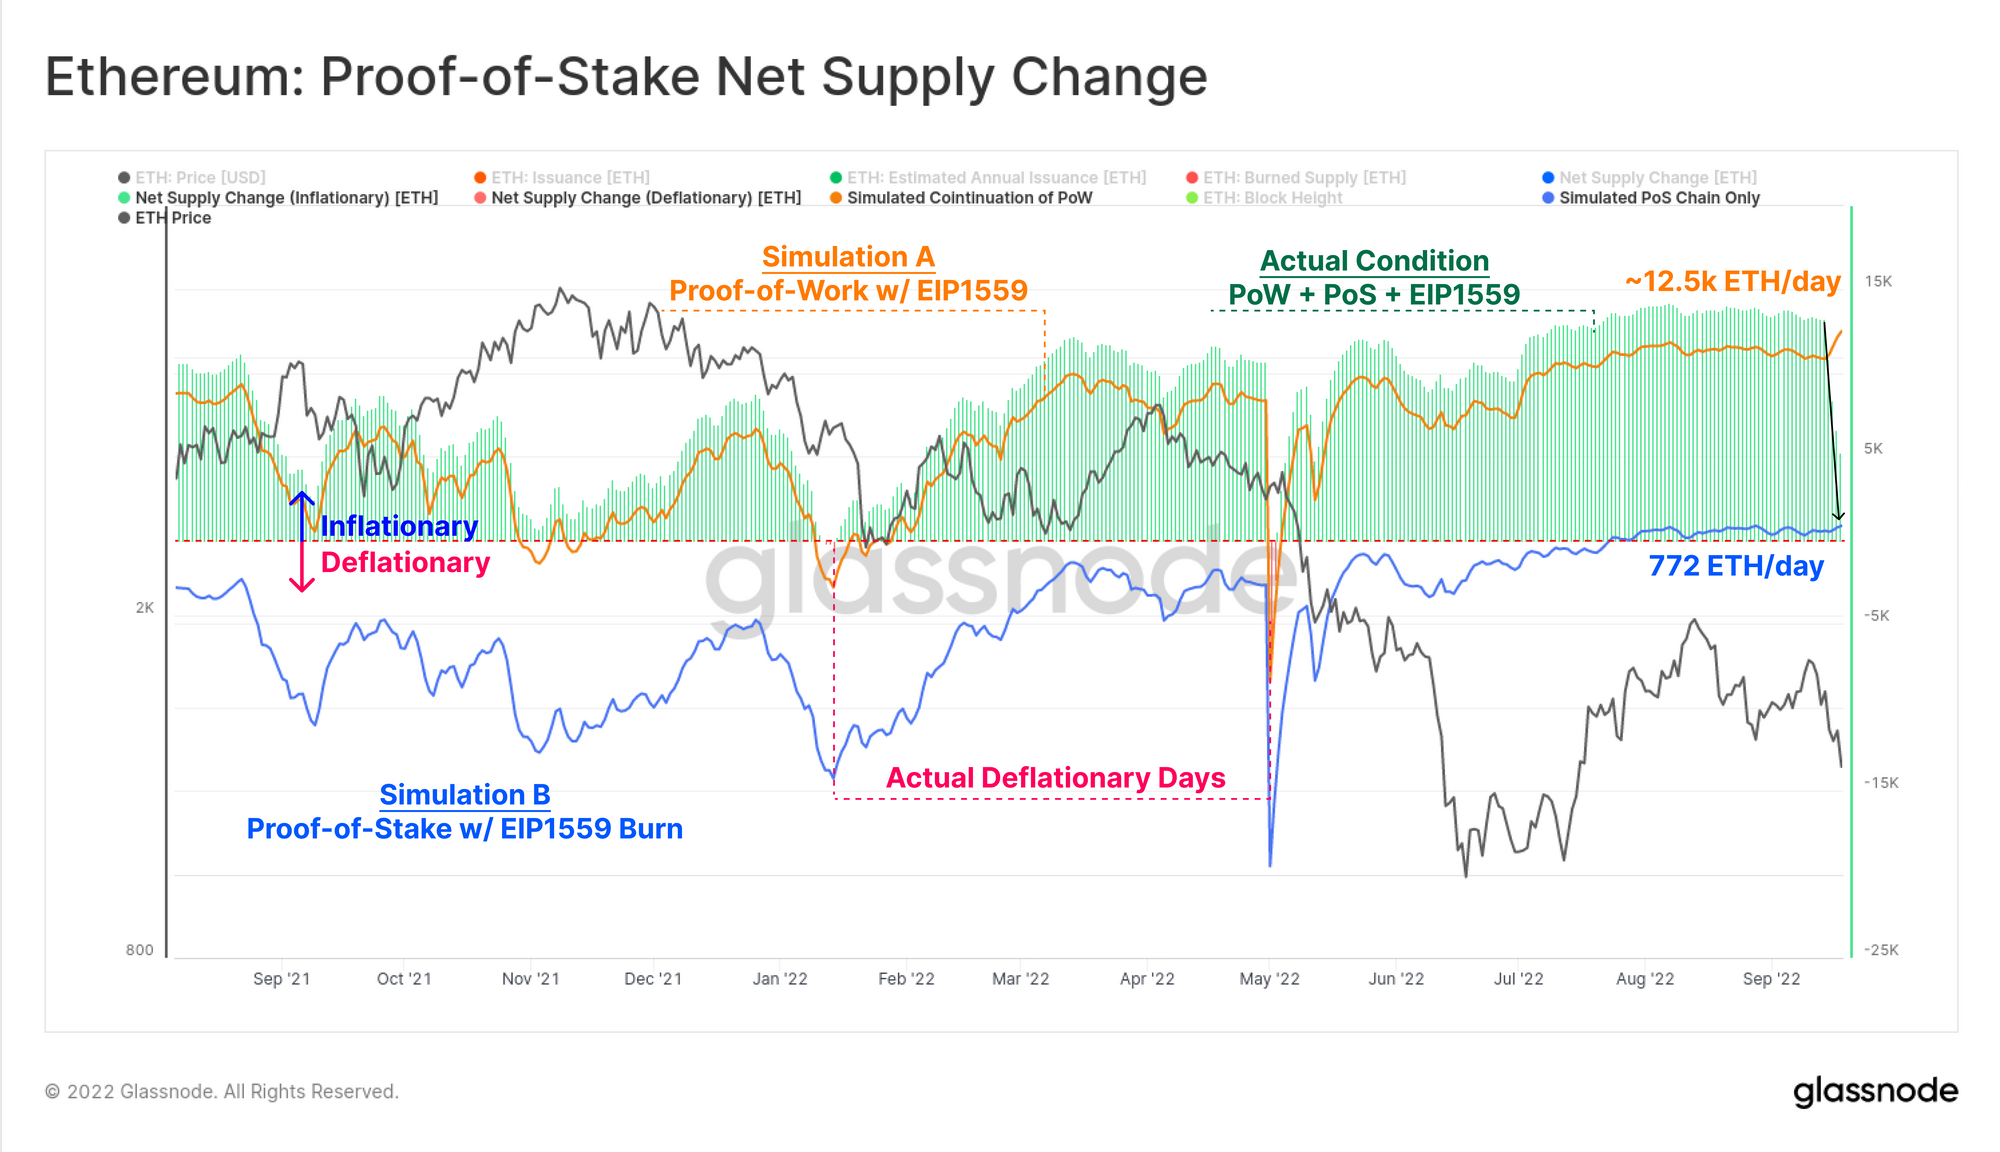
The chart below is a suite of traces, showing the net daily ETH issuance under various simulated, and actualized conditions. It attempts to model and visualize the daily net change in the ETH supply, in the time since EIP1559 was implemented.
- The area chart displays the actual condition, which consists of PoW and PoS issuance, with the EIP1559 burn, and accounts for the deprecation of PoW. Positive values 🟢 represent a net inflationary period (the typical condition), and negative values 🔴 indicate a net supply contraction (ETH supply deflation).
- Simulated Continuation of the PoW blockchain 🟠, assumes the PoS Merge never took place and assumes 2 ETH issued per block (uncle rewards ignored for simplicity).
- Simulated PoS only chain 🔵, assumes the Merge took place alongside the EIP1559 release in August 2021, and thus ignores all PoW block rewards after that date. This trace now aligns with the post-Merge area chart.
It can be seen that the PoS model 🔵 sports a dramatically lower issuance rate of ~772 ETH/day, compared to ~12.5k ETH for the PoW model 🟠. However, it is noted that net ETH issuance is, at present, still inflationary. This is primarily a result of extremely low blockchain congestion, and low network utilization at the moment.
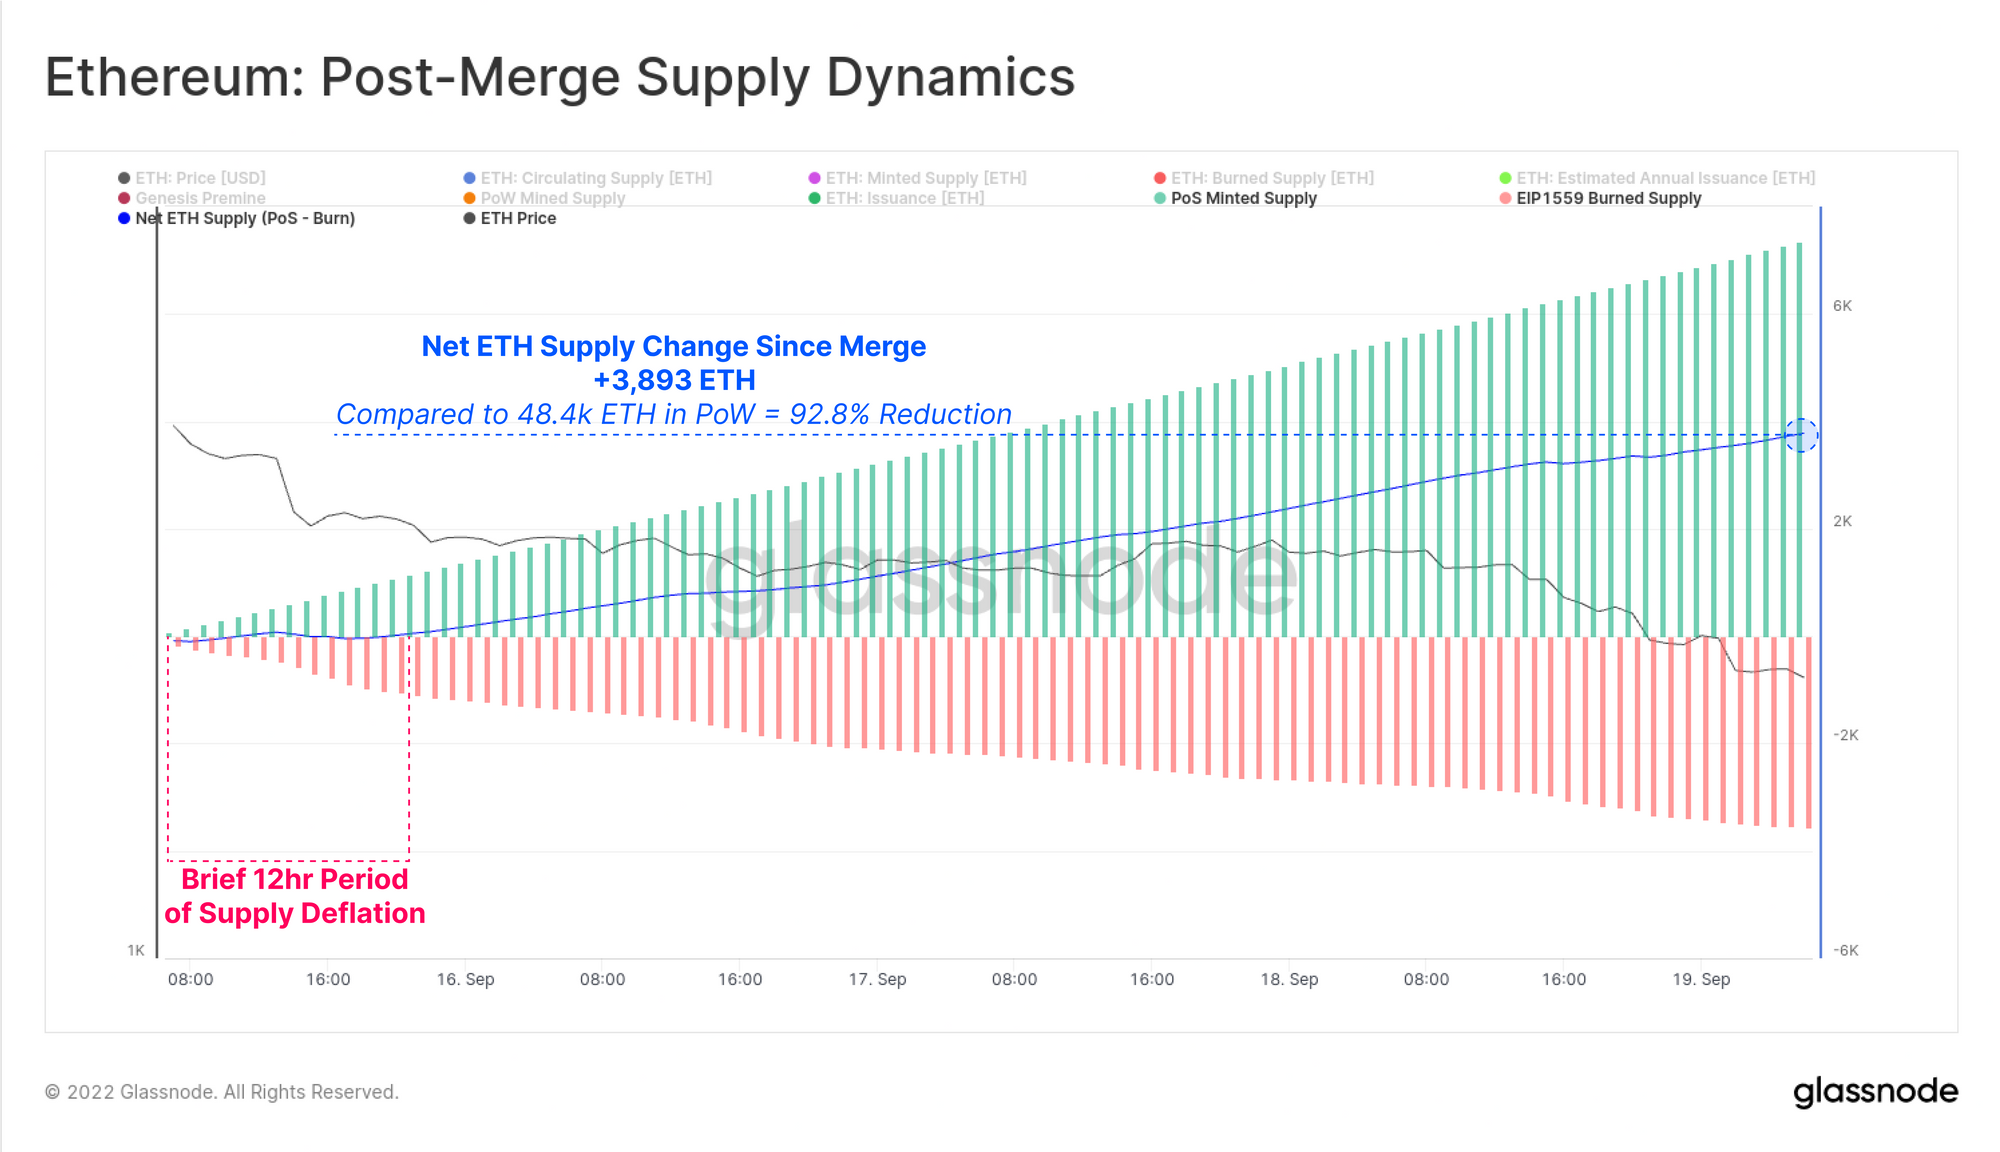
Zooming into the 1-hour chart from the Merge event onwards, we can calculate the net supply reduction that has taken place. Between the Merge and the time of writing (~4-days after the fact):
- The PoW Ethereum chain would have issued approximately 48.4k ETH on net.
- The PoS chain has issued 3,893 ETH on net, reflecting a remarkable 92.8% reduction relative to the deprecated system.
Immediately following the Merge event, a burst of blockspace demand did push average gas fees higher, which created an initial 12-hour period of net ETH supply deflation. However, as congestion cleared, and fees reverted lower, the overall ETH supply has continued to increase, albeit at a dramatically smaller rate compared to the previous PoW implementation.
Summary and Conclusions
The Ethereum Merge was a success, and a historic one to say the least. Many years of dedicated research, development, and strategy have now come together to achieve a remarkable engineering feat.
The world of on-chain analysis now has a plethora of new metrics to explore and describe the new consensus mechanism and performance of the second largest crypto-asset. Of these, the new supply dynamics are of particular interest, as the tension and market forces between new validators coming online (which increase issuance), and network congestion fee burn via EIP1559 lean towards either an inflationary, or a deflationary ETH supply.
Be sure to check out our newest Proof-of-Stake Dashboards:
Product Updates
All product updates, improvements and manual updates to metrics and data are recorded in our changelog for your reference.
- Released a large set of Derivatives, Supply, and Market Indicator Workbench Pre-sets for Bitcoin and Ethereum.
Translations
This Week On-chain is now being translated into Spanish, Italian, Chinese, Japanese, Turkish, French, Portuguese, Farsi, Polish, Arabic, Russian, Vietnamese and Greek.
We are also proud to have launched new social channels for:
- Spanish (Analyst: @ElCableR, Telegram, Twitter)
- Portuguese (Analyst: @pins_cripto, Telegram, Twitter)
- Turkish (Analyst: @wkriptoofficial, Telegram, Twitter)
- Farsi (Analyst: @CryptoVizArt, Telegram, Twitter)

- Follow us and reach out on Twitter
- Join our Telegram channel
- Visit Glassnode Forum for long-form discussions and analysis.
- For on-chain metrics and activity graphs, visit Glassnode Studio
- For automated alerts on core on-chain metrics and activity on exchanges, visit our Glassnode Alerts Twitter