Identifying Seller Exhaustion Across Multiple Timeframes
Using our new Breakdown Metrics, we are now able to discretely isolate points of severe unrealized loss, and investor capitulation. In this article, we introduce a new framework to assess seller exhaustion across multiple timeframes and investor cohorts.


Executive Summary:
- During a Bull Market regime, long-term investors are generally highly profitable. Therefore, the dominant source of realized loss originates from the Short-Term Holder cohort, which can provide information on inflection points during sell-off events.
- Given that market inflection points unfold from the inside-out, we produce a framework using our newly released Breakdown by Age metrics to profile seller exhaustion across day trader and weekly-monthly investor cohorts.
- Within this framework, we utilize onchain metrics to assess both the unrealized and realized losses of the targeted investor classes as a gauge for their response to market downturns.
Establishing a Seller Exhaustion Framework
When evaluating a Bitcoin bull market over a macro timeframe, price action can be broadly characterised by elevated volatility to the upside, with corrections and consolidations along the way. All investors are aware that financial markets do not move upwards only over time, and which creates the sort of cat-and-mouse game between supply and demand which creates local and global correction events.
We will start by assessing the Realized Loss for both Long and Short-Term Holders. We can observe that losses taken by LTHs 🔵 almost exclusively occur around macro cycle downturns. Conversely, losses are locked in by recent buyers throughout all phases of the market, and are typically the dominant source of loss during bull market.
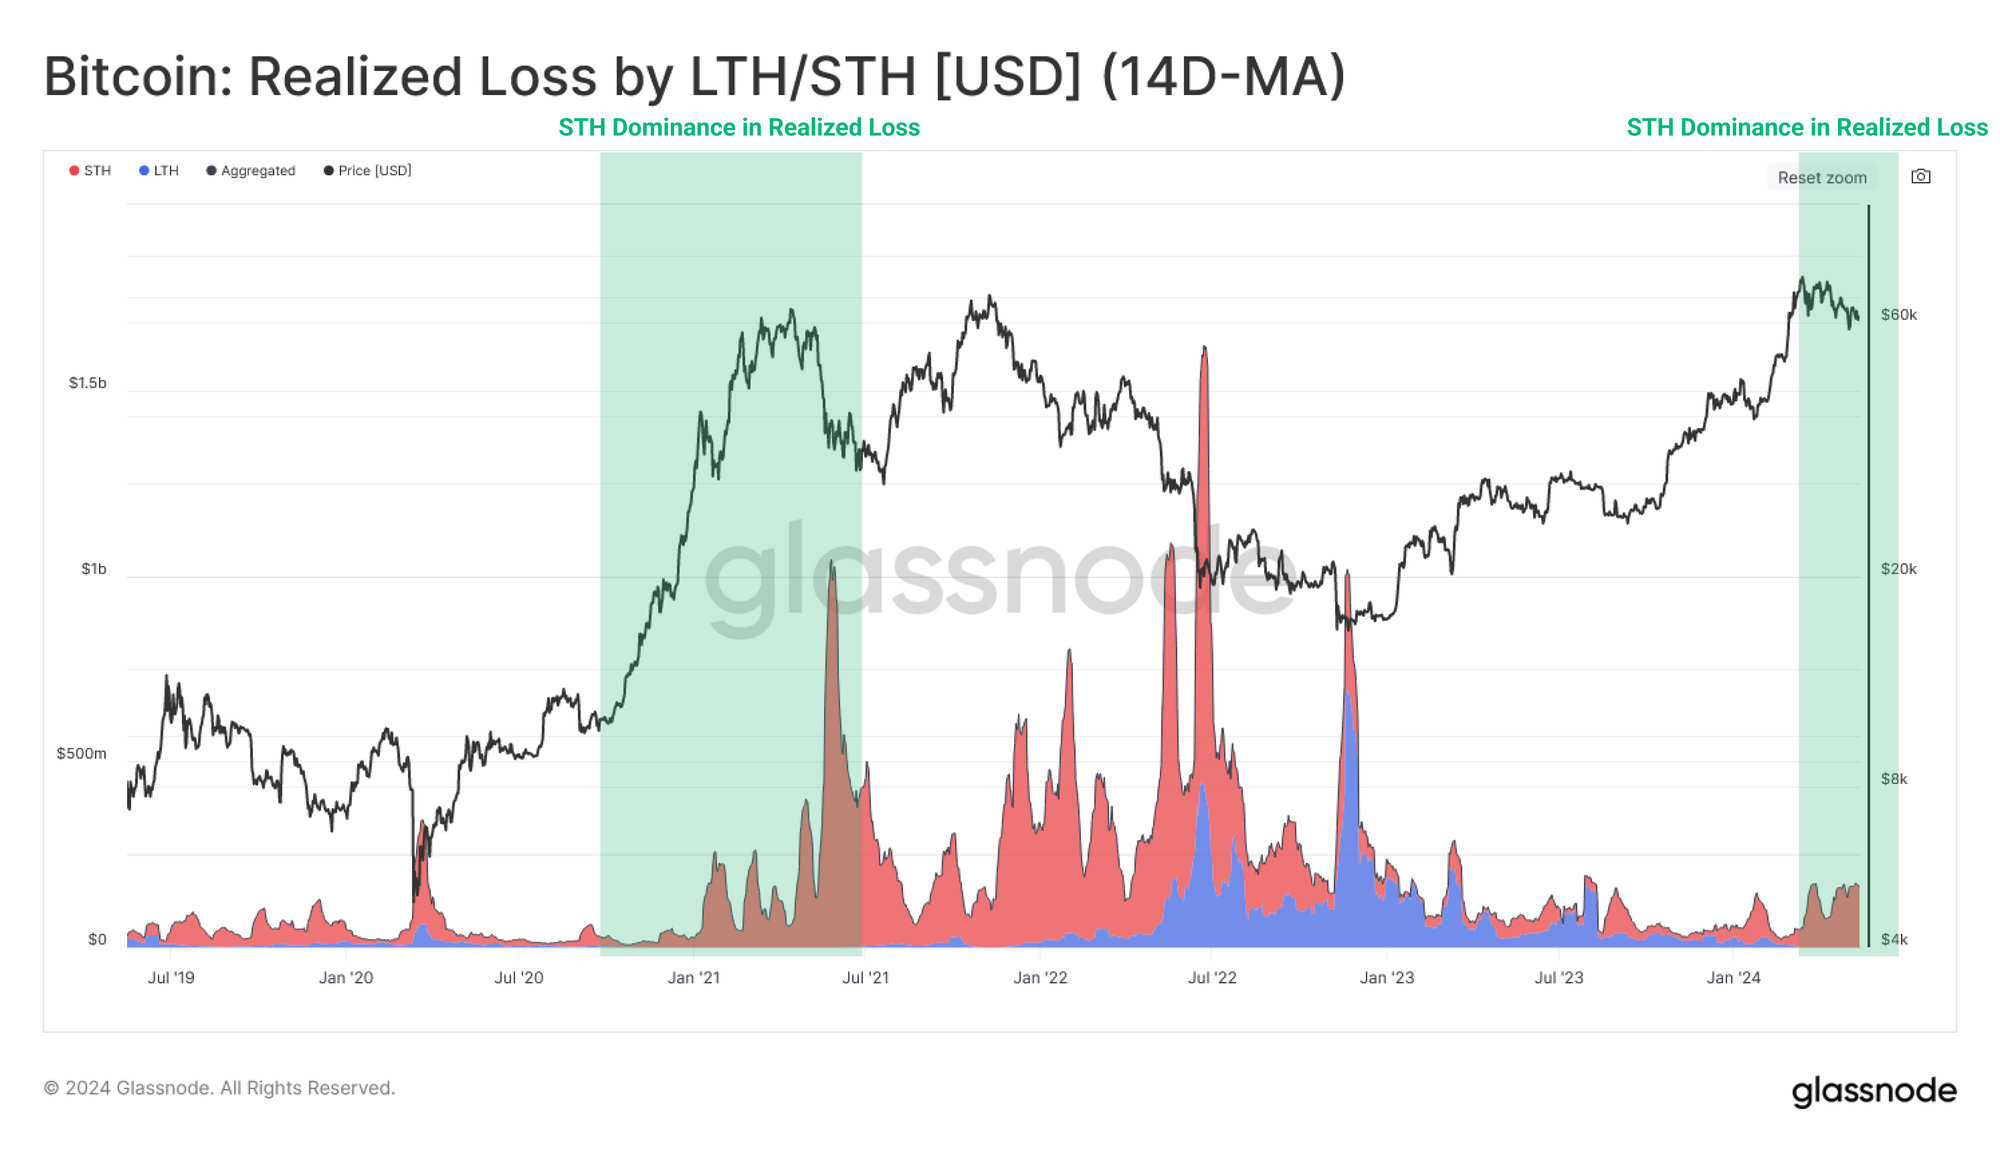
In this report, we will take advantage of the fact that the Short-Term Holder cohort is the dominant group locking in losses, and use this to identify periods of seller exhaustion. The goal is to identify inflection points during corrections and consolidations within a dominant bull trend.
Here, we define Seller Exhaustion as a point of oversold conditions, where a majority of the sellers who are likely to sell, and done so. Since every seller is matched with a buyer, we can simultaneously gauge periods when this sell-side is absorbed by an influx of buy-side demand, which helps establish a local bottom.
Inflection points in market trends tend to reverberate upwards from smaller timeframes (minutes to hours) through to larger timeframes (days to months). In order to capture this effect, we will utilize our newly released age breakdown metrics to isolate two distinct sets of investors from within the STH cohort:
- Daily Traders [24hr Cohort]
- Weekly-Monthly Swing Traders [1d-1m Cohort]
In order to model points of extreme financial pressure and reaction, we call upon three profit/loss metrics which help us establish the severity of the pressure investors are experiencing.
- MVRV Ratio which assesses the unrealized profit or loss held by investors within the cohort.
- SOPR which evaluates the average magnitude of profit or loss locked in by the cohort.
- Realized Loss which isolates the USD denominated magnitude loss locked in by the cohort.
Daily Traders
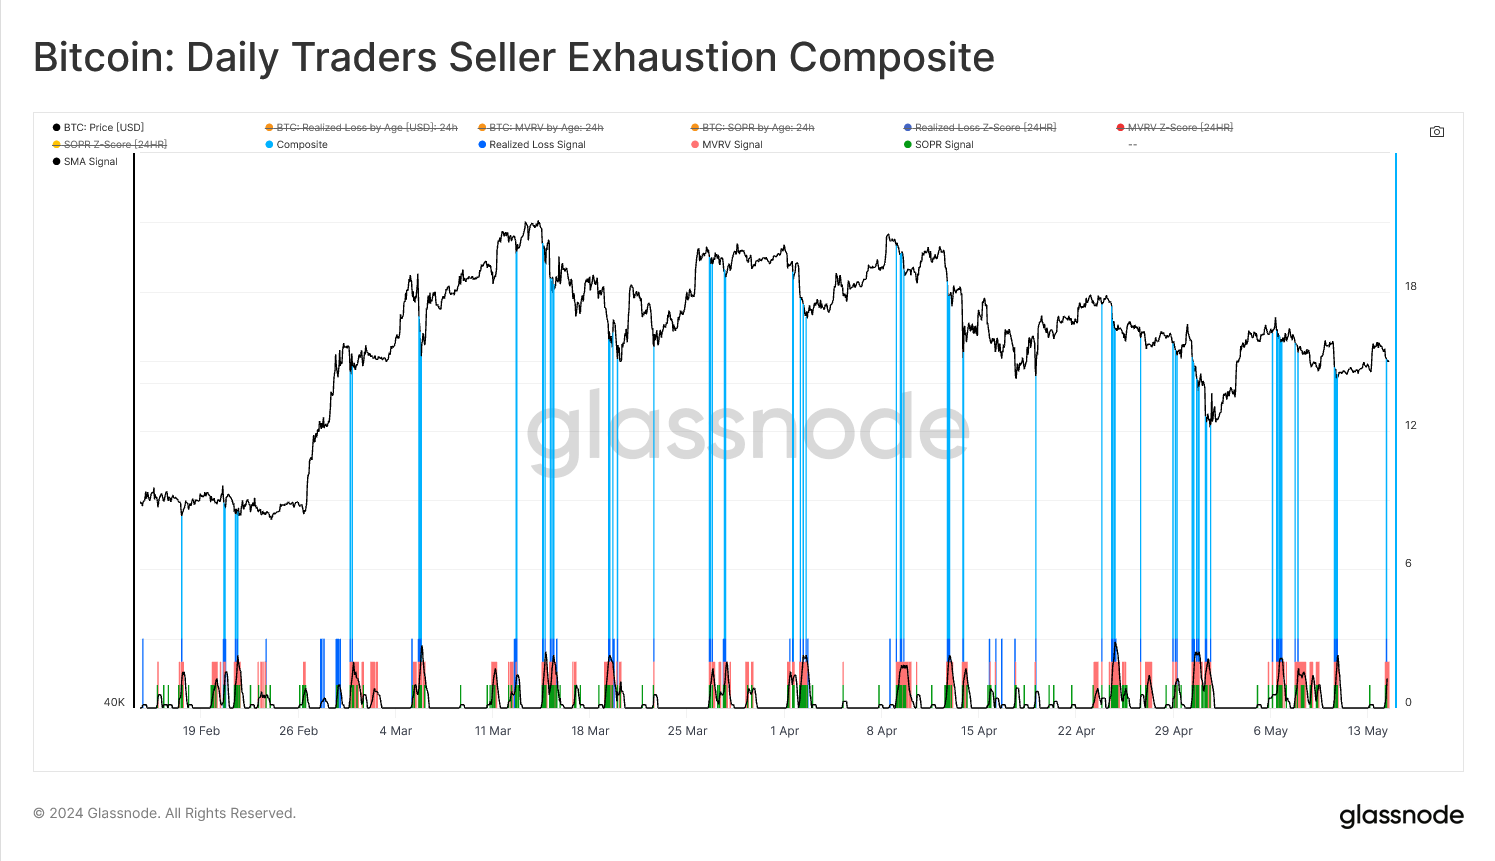
Initially, we start with an assessment of the Daily Trader group, and utilize the 24hr age breakdown.
This is inherently the fastest moving cohort, and the most sensitive to the spot price, reacting near instantaneously to any and all fluctuations in price action. Thus, this cohort will produce a large amount of seller exhaustion signals, but with a larger proportion of noise due to the erratic nature of the selected timeframe.
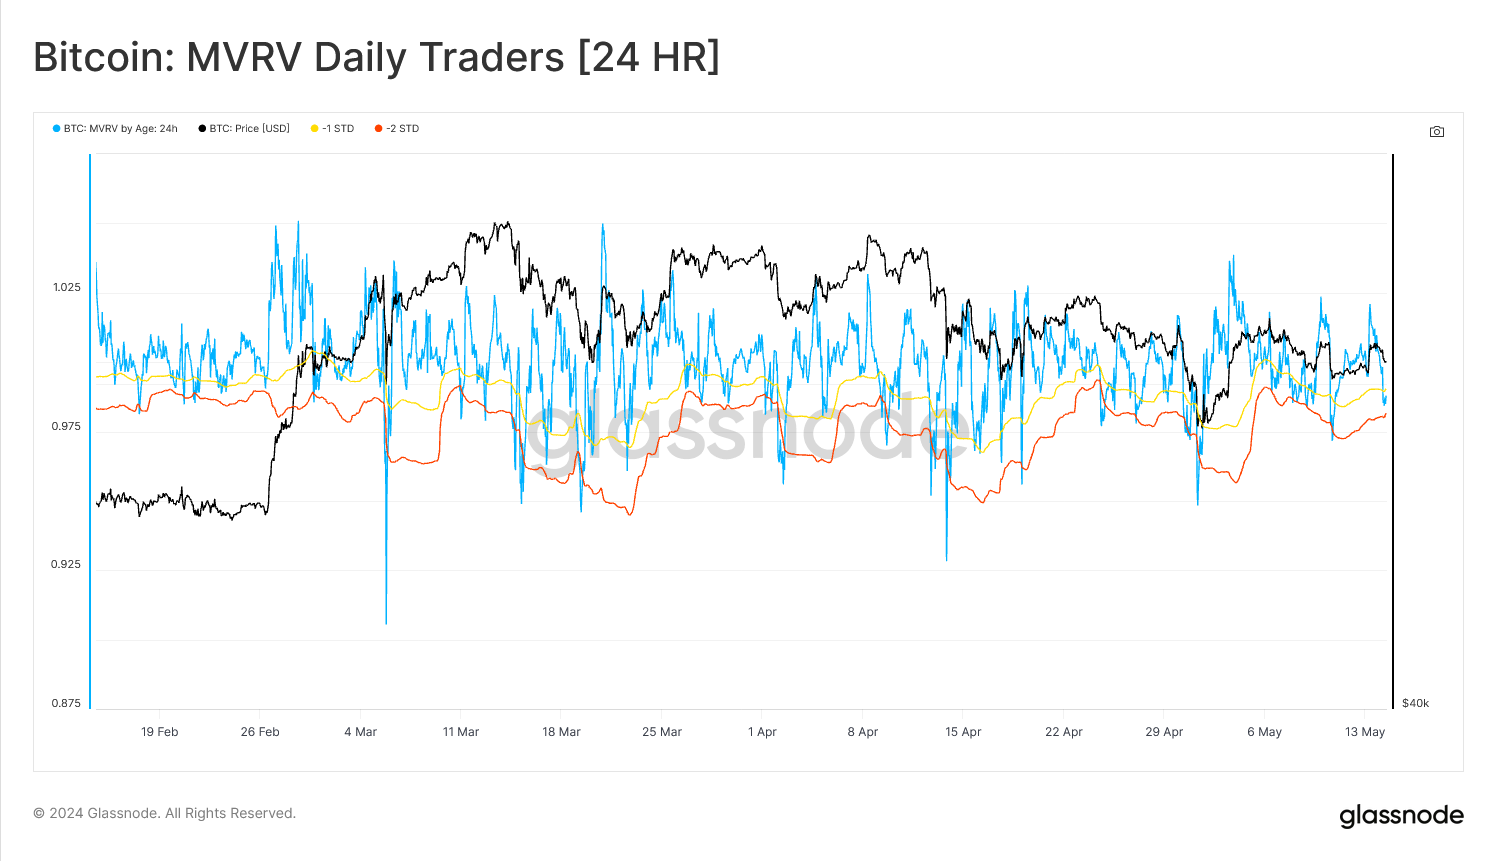
First, we evaluate the MVRV Z-Score (with a 90 data point look-back period) for the Day Trader cohort. We can see this metric consistently flips from high to low values as a result of the intraday volatility of price, which then impacts the unrealized profit/loss held by this cohort.
Since we are looking for seller exhaustion signals during a correction, we isolate points when the MVRV Z-Score trades more than -1σ below the mean. These are points of heightened unrealized loss, and points of statistically significant pressure placed upon Day Traders.
Next, we shall incorporate the SOPR metric to assess whether the unrealized financial pressure was acted upon, and whether those losses were crystallized, or not. Again, we isolate for Z-Score values more than -1σ below the mean, which identifies periods of micro-capitulation, and large sell-side pressure.

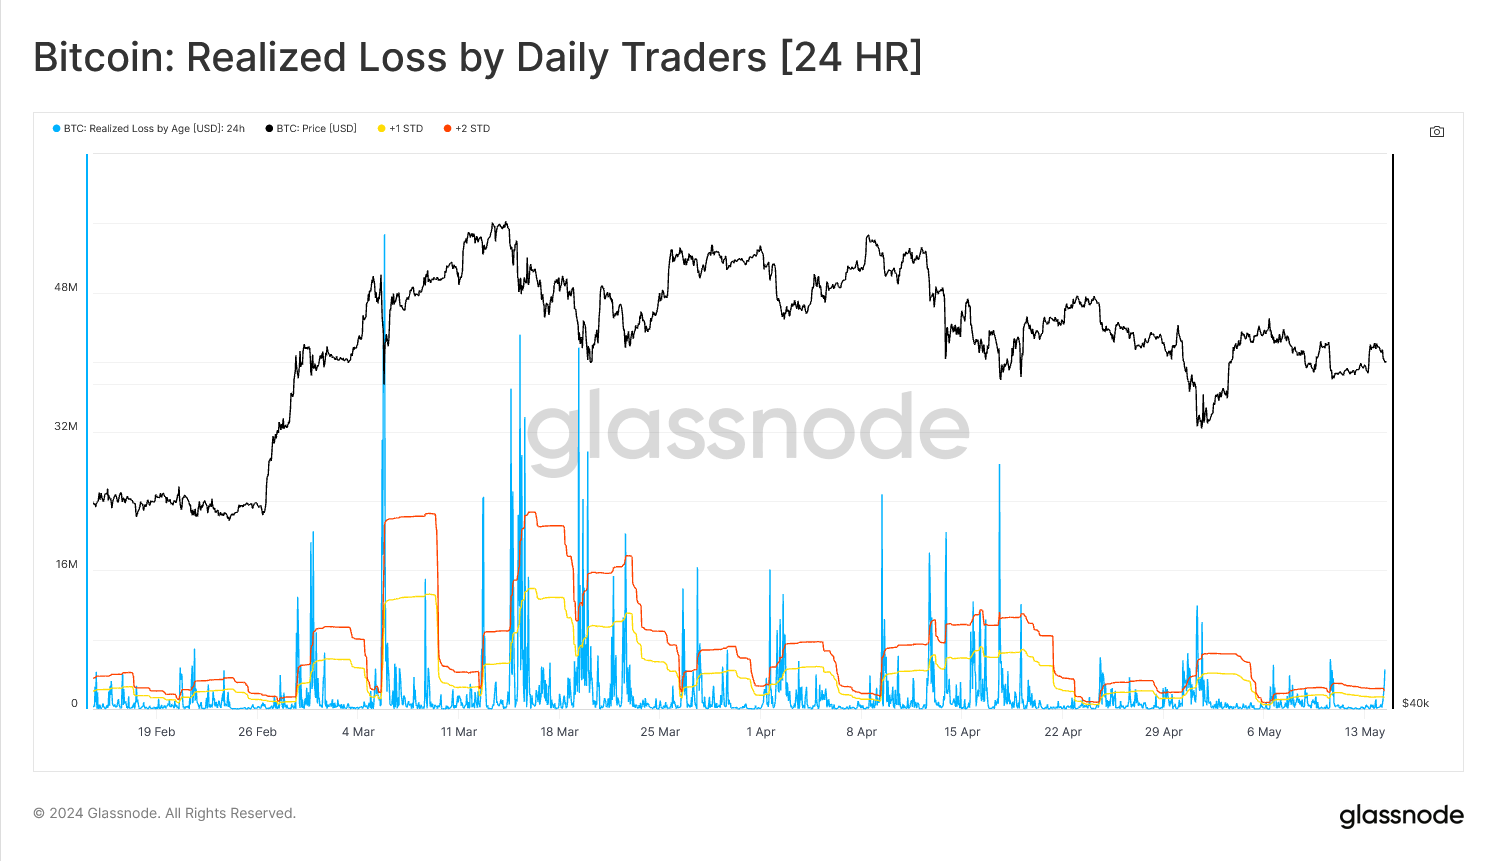
Finally, we can bolster the above observations by assessing the USD denominated realized loss locked in by the Day Trader cohort. Here, we are evaluating the absolute magnitude of the sell-side pressure. Keeping consistency, and applying a similar Z-Score framework to 24hr realized losses, we are able to confirm periods of micro-capitulation, indicated when values are 2σ above the mean.
Weekly-Monthly Traders
Moving onto the Weekly-Monthly traders, we first observe that the oscillation within the signal has slowed noticeably. This is the expected result as we expand up to longer term age bands, which smooths out the average cost basis. This cohort is less price sensitive than the Day Trader group, however they are also more likely to experience volatility as the spot price fluctuates around their cost basis during their holding time.
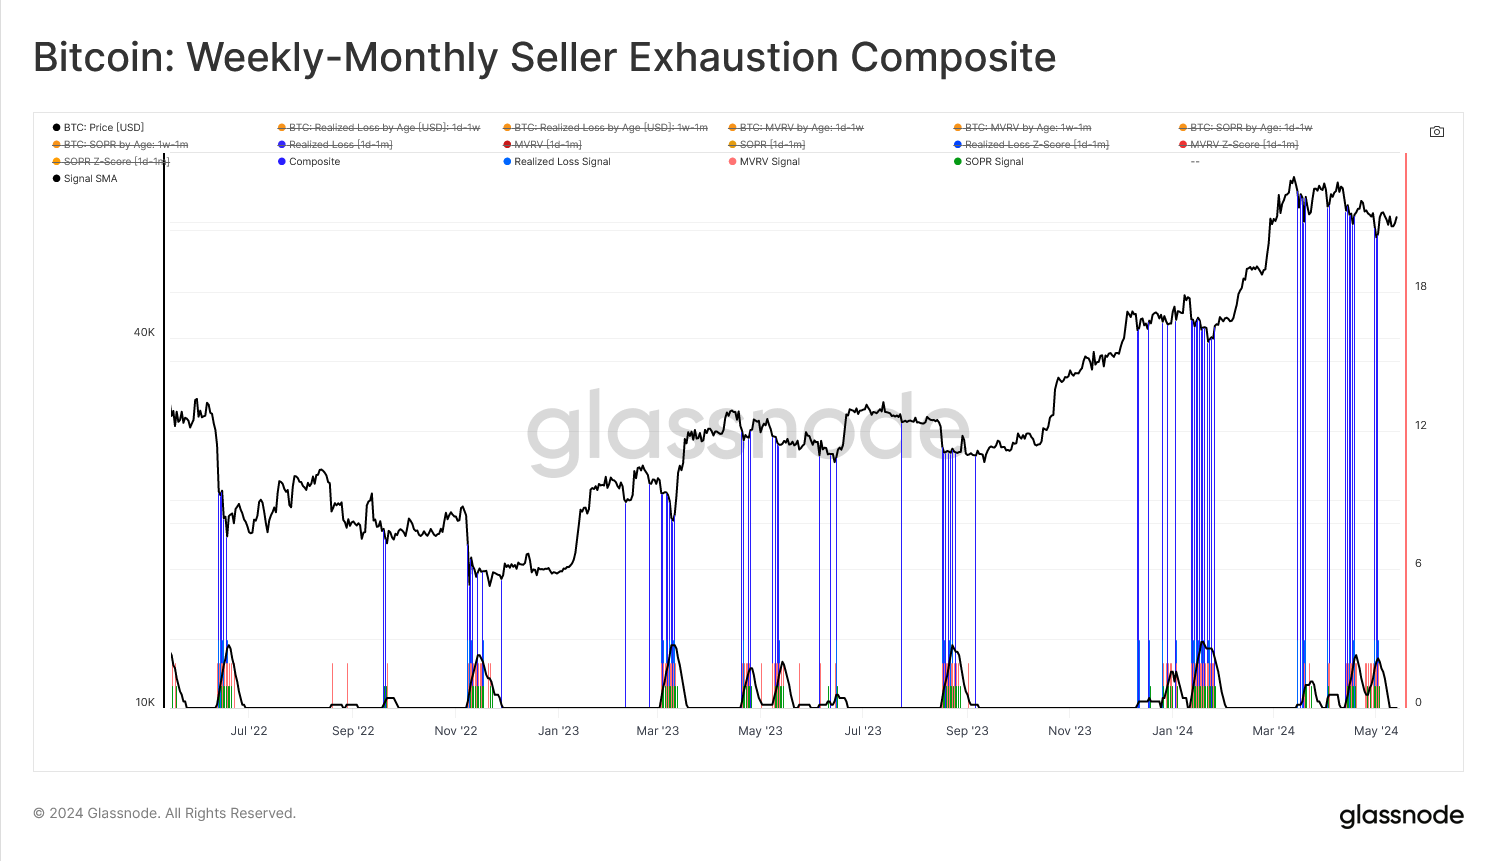
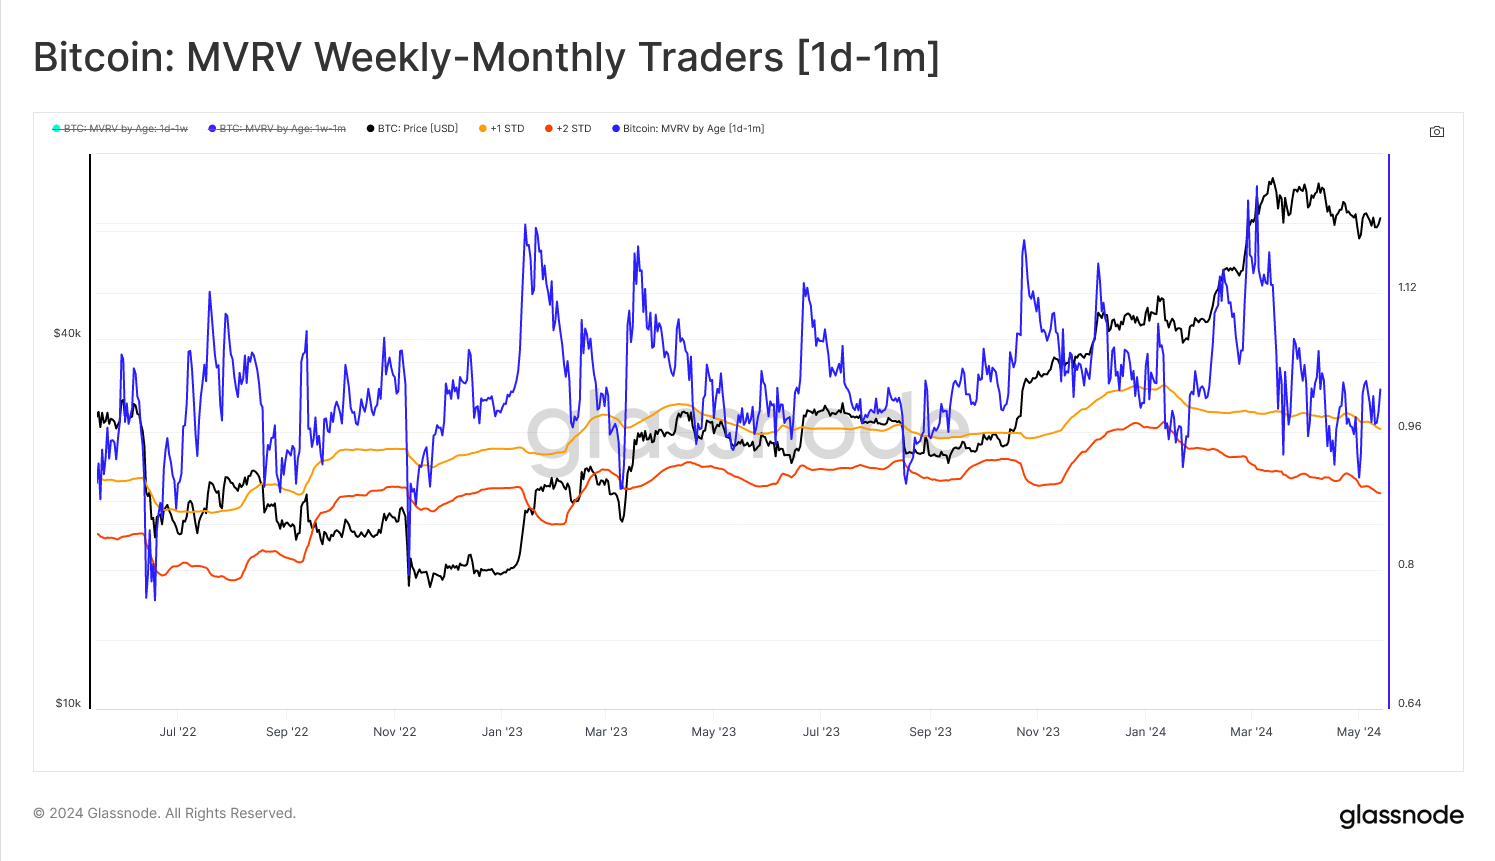
Investigating the 1d-1m MVRV Z-Scores, we can see that this variant is less responsive to price action compared to the 24hr variant. As a result, this MVRV variant is slower to move, generates fewer signals overall, but also has less noise overall.
The chart below highlights when the MVRV Z-Score trades below the mean (negative Z-Score values), as an indicator that significant unrealized losses have transferred up to the larger 1d-1m age band.
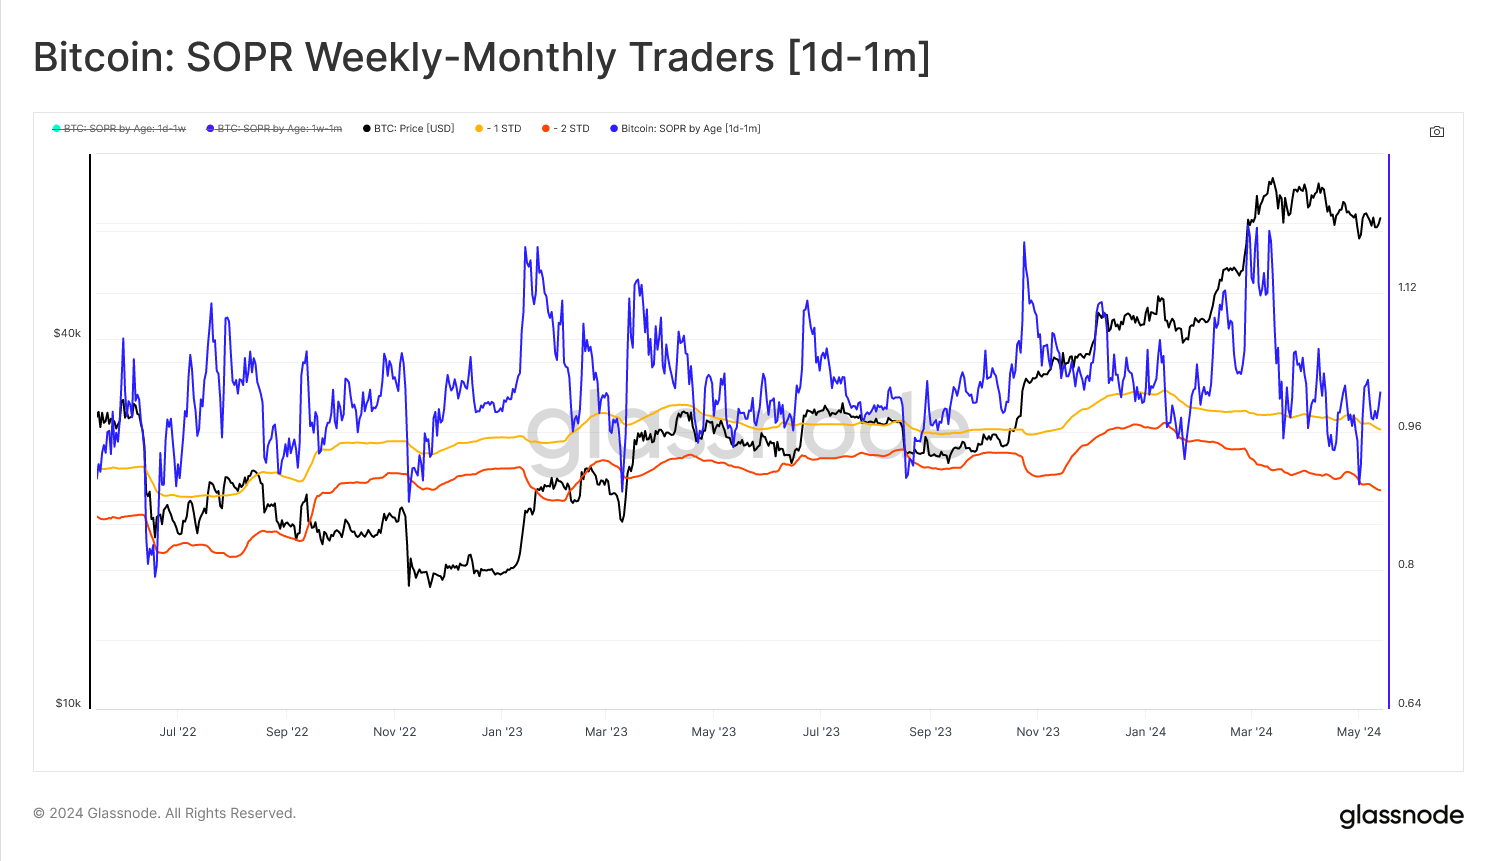
Again, we use the SOPR Ratio Z-Score to confirm whether these investors are under sufficient pressure to capitulate and lock in those losses. Similar to the MVRV Ratio Z-Score, we isolate points when the Z-Score trades below the mean. This provides a degree of confluence that realized losses are starting to reverberate from smaller to larger timeframes.
Lastly, we can establish one final layer of confluence using the with the Realized Loss Z-Score. In this instance, we distinguish for Z-Score values trading +2σ above the mean to confirm a significant USD denominated loss has been locked in by the Weekly-Monthly swing trader cohort.

Summary and Conclusions
On-chain data provides analysts and investors with a remarkable degree of transparency into the positioning, incentives, and actions of various market participants. We can use these tools to build models and tools for assessing how investor behavior changes in response to price action.
Utilizing our newly released breakdown metrics, we are able to isolate individual subsets of investors using the heuristic of age bands, as a proxy for their holding time. We then use confluence across three onchain metrics describing the profitability of these investor groups to identify points of micro-capitulation, which tend to accompany local market lows.
This framework helps us think about what incentives and actions we would expect to see when identifying points of seller exhaustion.
Disclaimer: This report does not provide any investment advice. All data is provided for information and educational purposes only. No investment decision shall be based on the information provided here and you are solely responsible for your own investment decisions.
Exchange balances presented are derived from Glassnode’s comprehensive database of address labels, which are amassed through both officially published exchange information and proprietary clustering algorithms. While we strive to ensure the utmost accuracy in representing exchange balances, it is important to note that these figures might not always encapsulate the entirety of an exchange’s reserves, particularly when exchanges refrain from disclosing their official addresses. We urge users to exercise caution and discretion when utilizing these metrics. Glassnode shall not be held responsible for any discrepancies or potential inaccuracies. Please read our Transparency Notice when using exchange data.
- Join our Telegram channel
- For on-chain metrics, dashboards, and alerts, visit Glassnode Studio
- For automated alerts on core on-chain metrics and activity on exchanges, visit our Glassnode Alerts Twitter