Dissecting Divergences
Despite impressive US ETF inflows, a market-neutral Cash-and-Carry trade appears to be subduing buy-side pressure, requiring non-arbitrage demand to further stimulate price action. Alongside this, we explore the divergence between declining active addresses and surging transaction counts.


Executive Summary
- In the advent of the Runes protocol, a counterintuitive divergence has formed between declining active addresses and increasing transaction counts.
- Major labelled entities now hold a staggering ~4.23M BTC, accounting for over 27% of the adjusted supply, with US Spot ETFs now commanding a balance of 862k BTC.
- The Cash-and-Carry trade structure appears to be a meaningful source of ETF inflow demand, with the ETFs being utilized as the instrument for obtaining the long spot exposure, whilst an increasingly large net short position for Bitcoin accrues in the CME Group futures market.
A Divergence in Activity
Onchain activity metrics like active addresses, transactions, and volumes provide a valuable toolkit to analyse the growth and performance of blockchain networks. When China imposed restrictions on Bitcoin mining in mid-2021, the number of Active Addresses on the Bitcoin network experienced an aggressive decline, plunging from over ~1.1M/day to just ~800k/day.
The Bitcoin network is currently experiencing similar contraction in network activity, albeit, with entirely different drivers. In the following sections, we shall explore how the advent of Inscriptions, Ordinals, BRC-20s, and Runes have significantly altered how on-chain analysts should perceive activity metrics moving forwards.
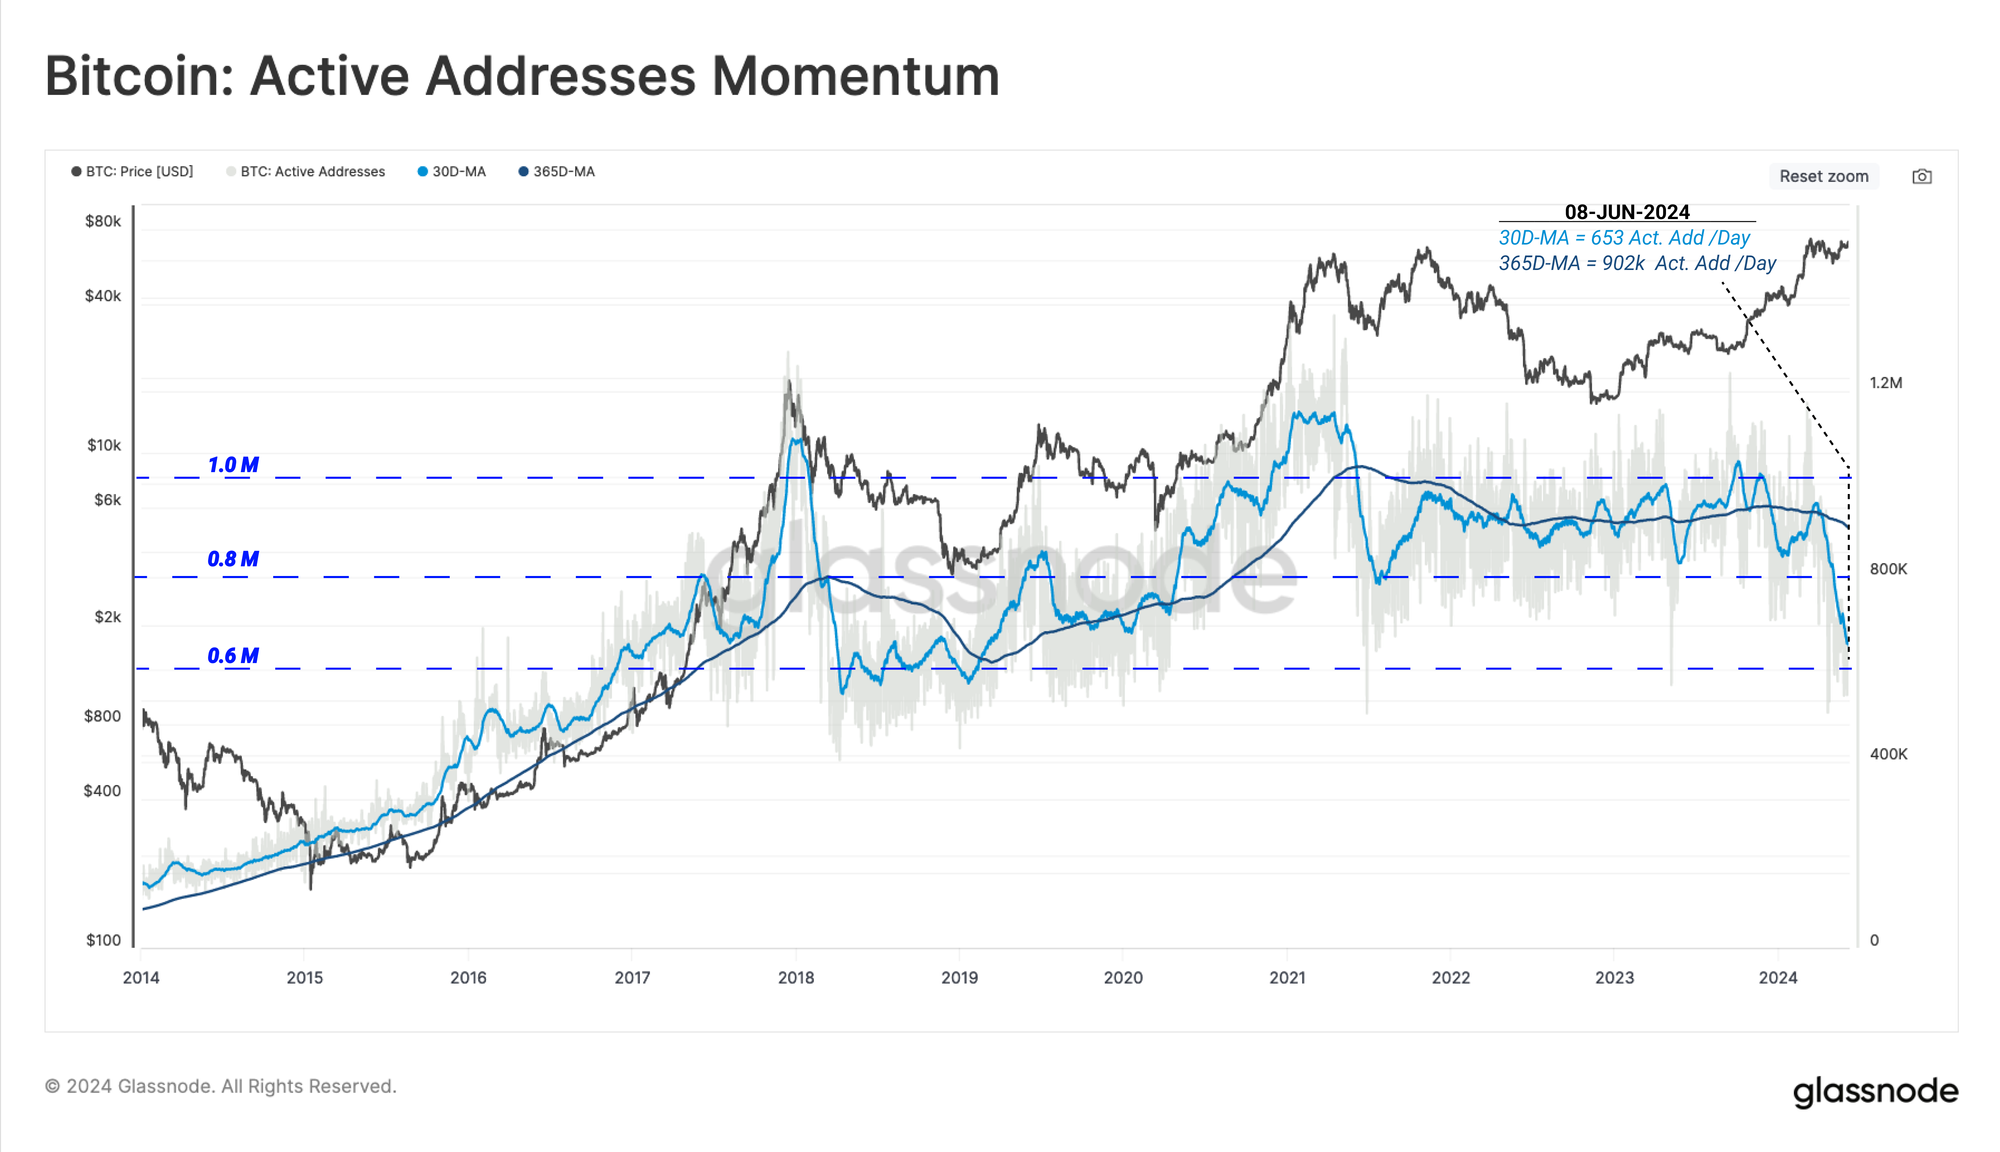
Despite the historical confluence between strong market momentum, and an expansion of active addresses and transaction counts per day, a deviation in this trend is underway.
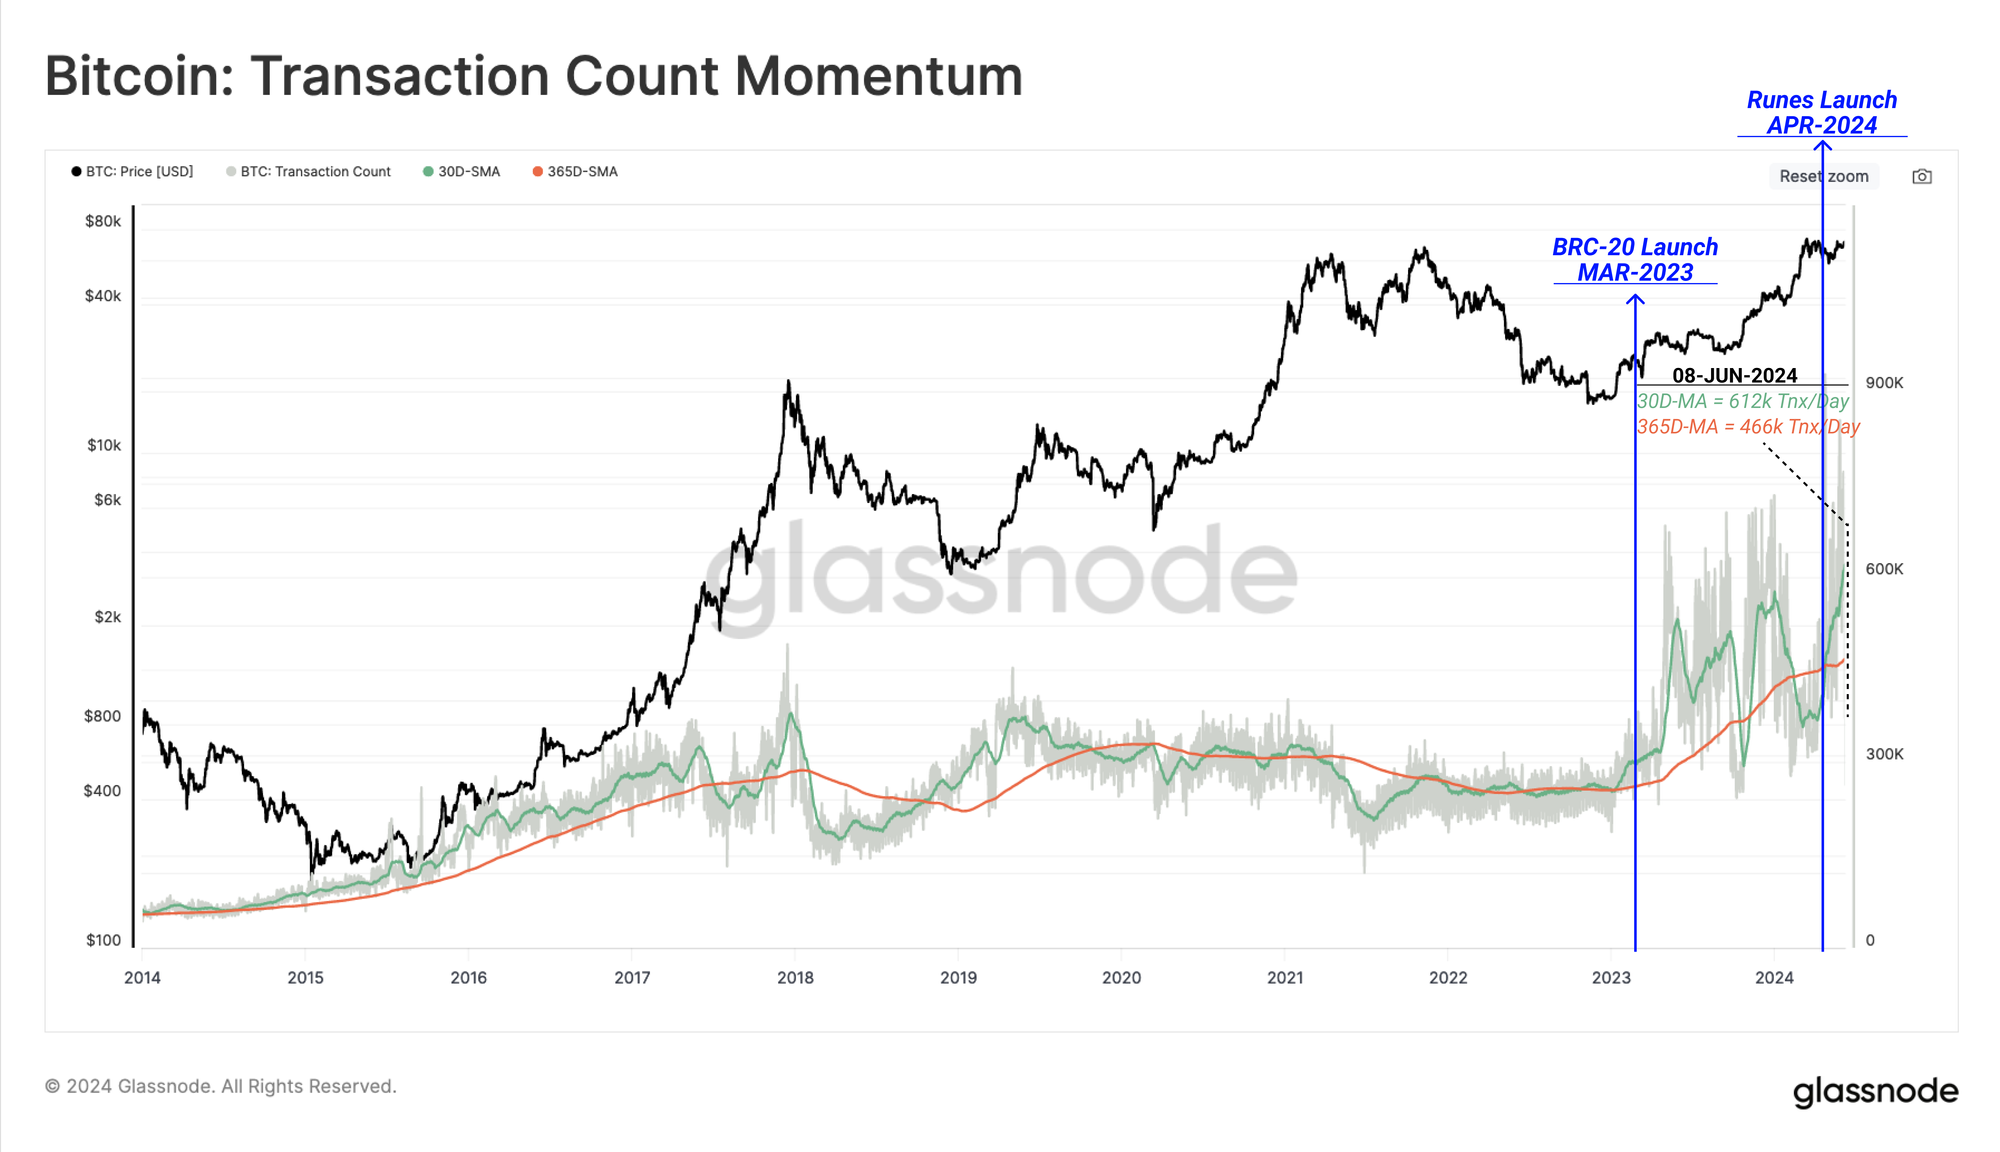
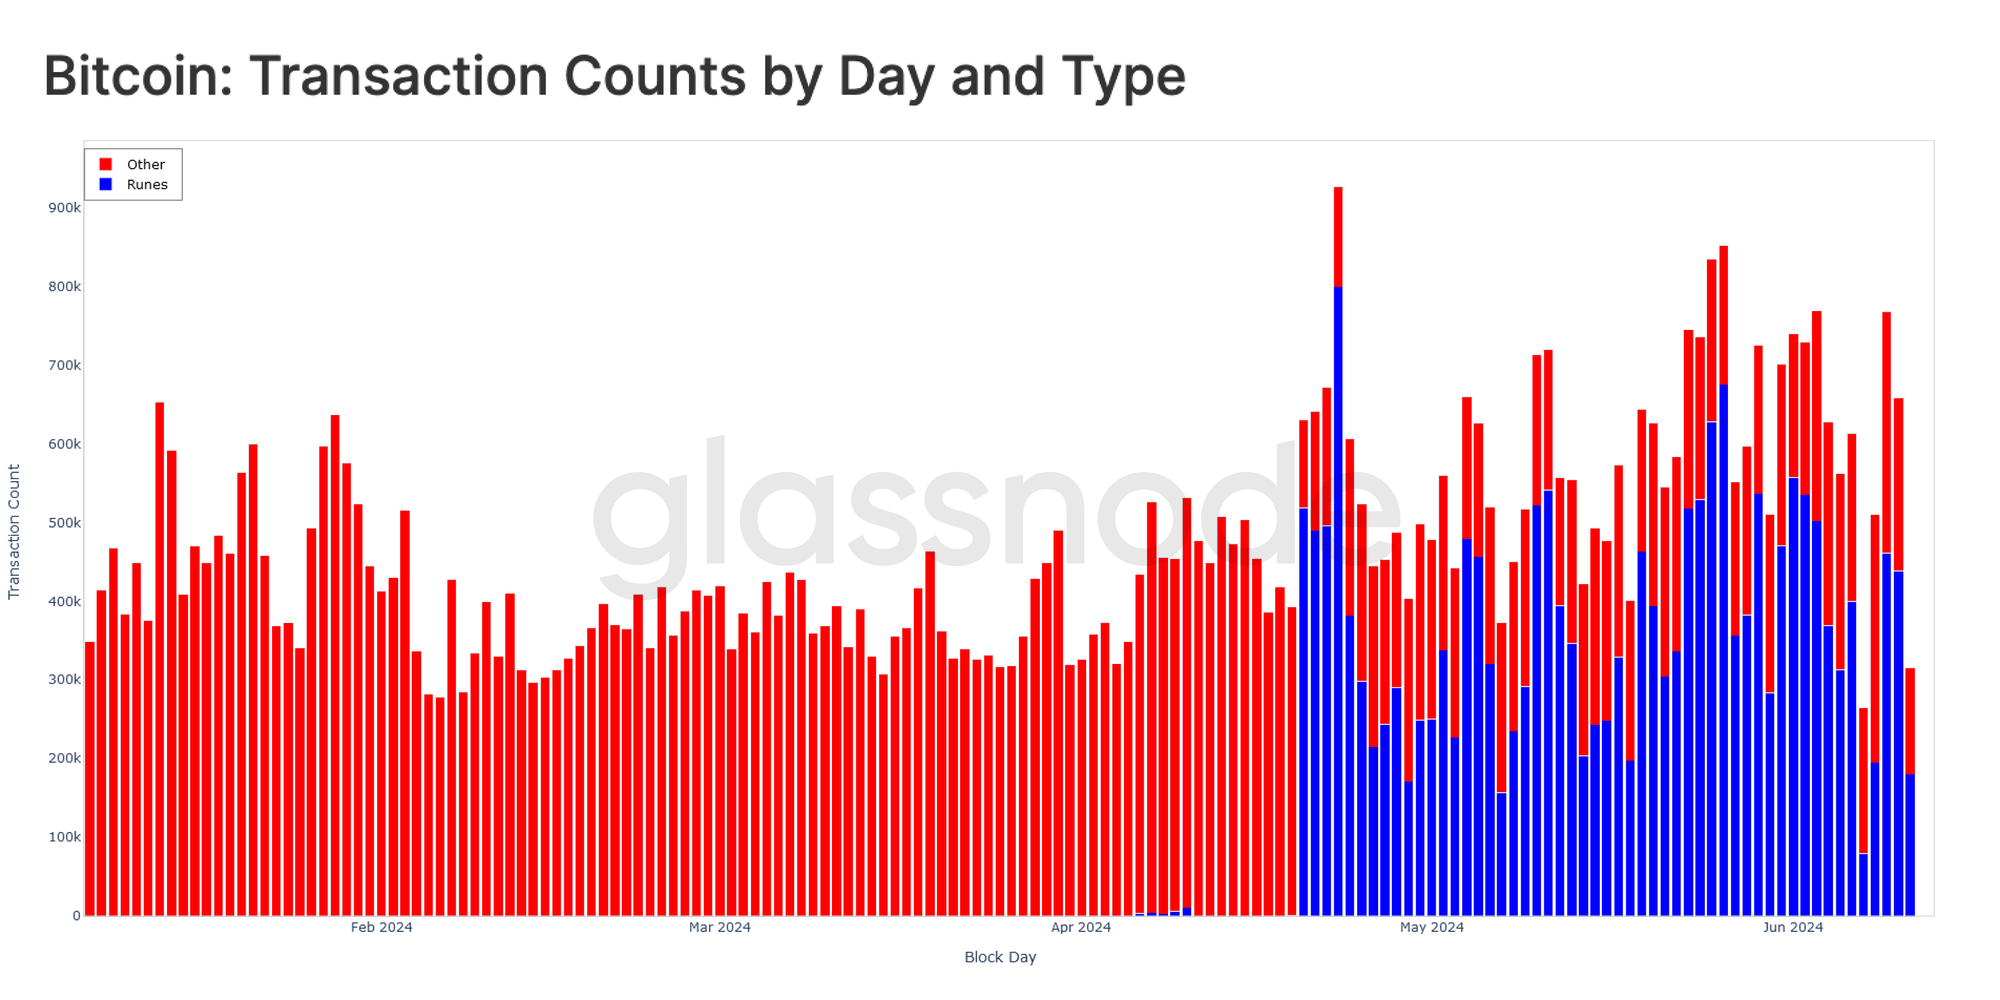
Whilst active addressees appear to be collapsing, the amount of transactions processed by the network has seen is near new all-time-highs. The present monthly average transaction count resides at 617k/day, which is 31% above the yearly average, and signifies a relatively high demand for Bitcoin blockspace.
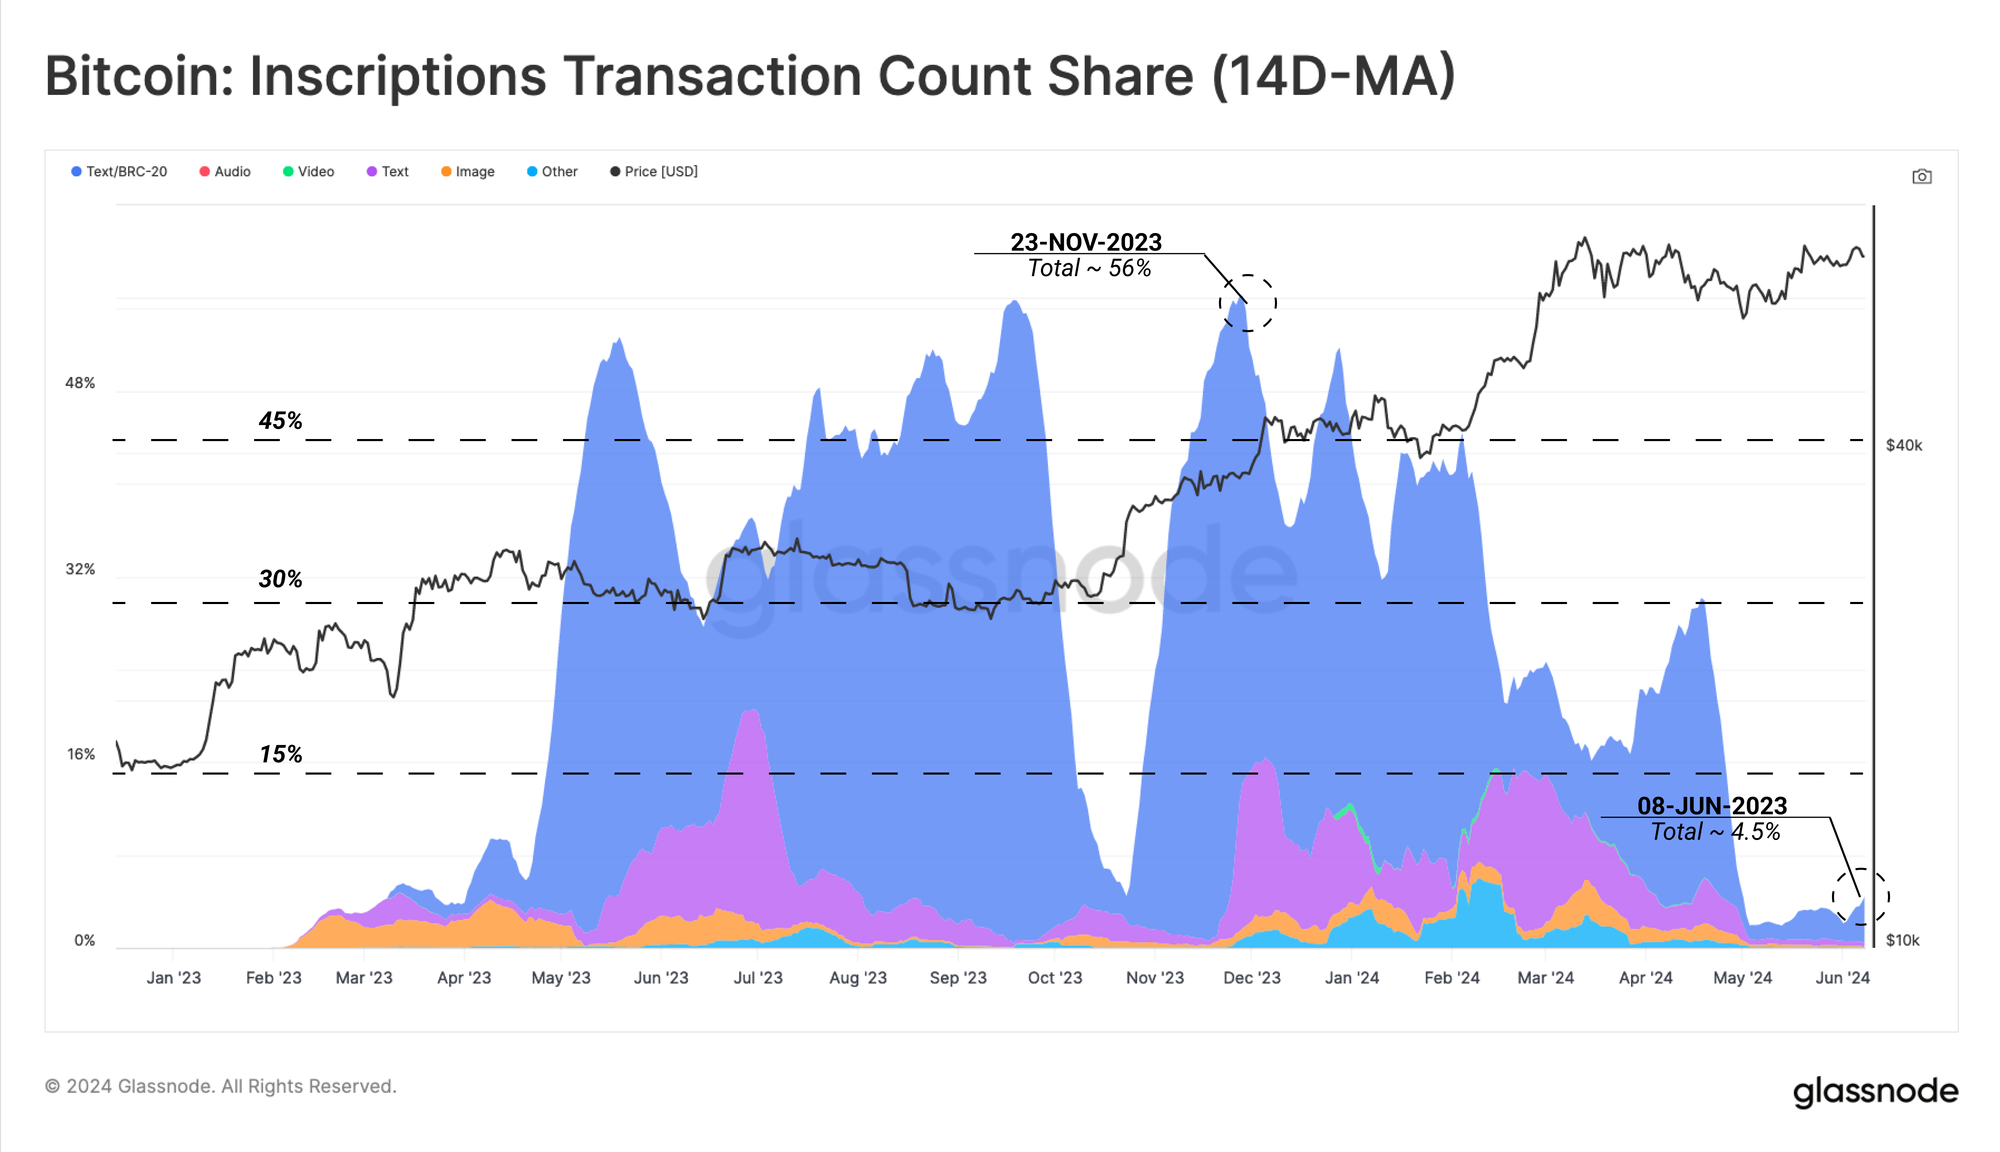
If we compare the recent decline of active addresses with the share of transactions attributed to inscriptions and BRC-20 tokens, we can observe a strong correlation. Of note, Inscription counts have also fallen off a cliff since mid April.
This suggests that the initial driver of the decline in address activity is largely due to reduction in inscription and ordinals usage. It is important to note that many wallets and protocols within this sector reuse addresses, which are not double counted if the address is active more than once in a daily period. As such, if a single address generates ten transactions in a day, it would appear as one active address, but ten transactions.
To illustrate how the inscriptions sector has grown since early 2023, we can see how the cumulative total inscription count has expanded. The number of inscriptions has reached 71M at the time of writing, however, since mid-April this year, the popularity of the protocol has declined markedly.
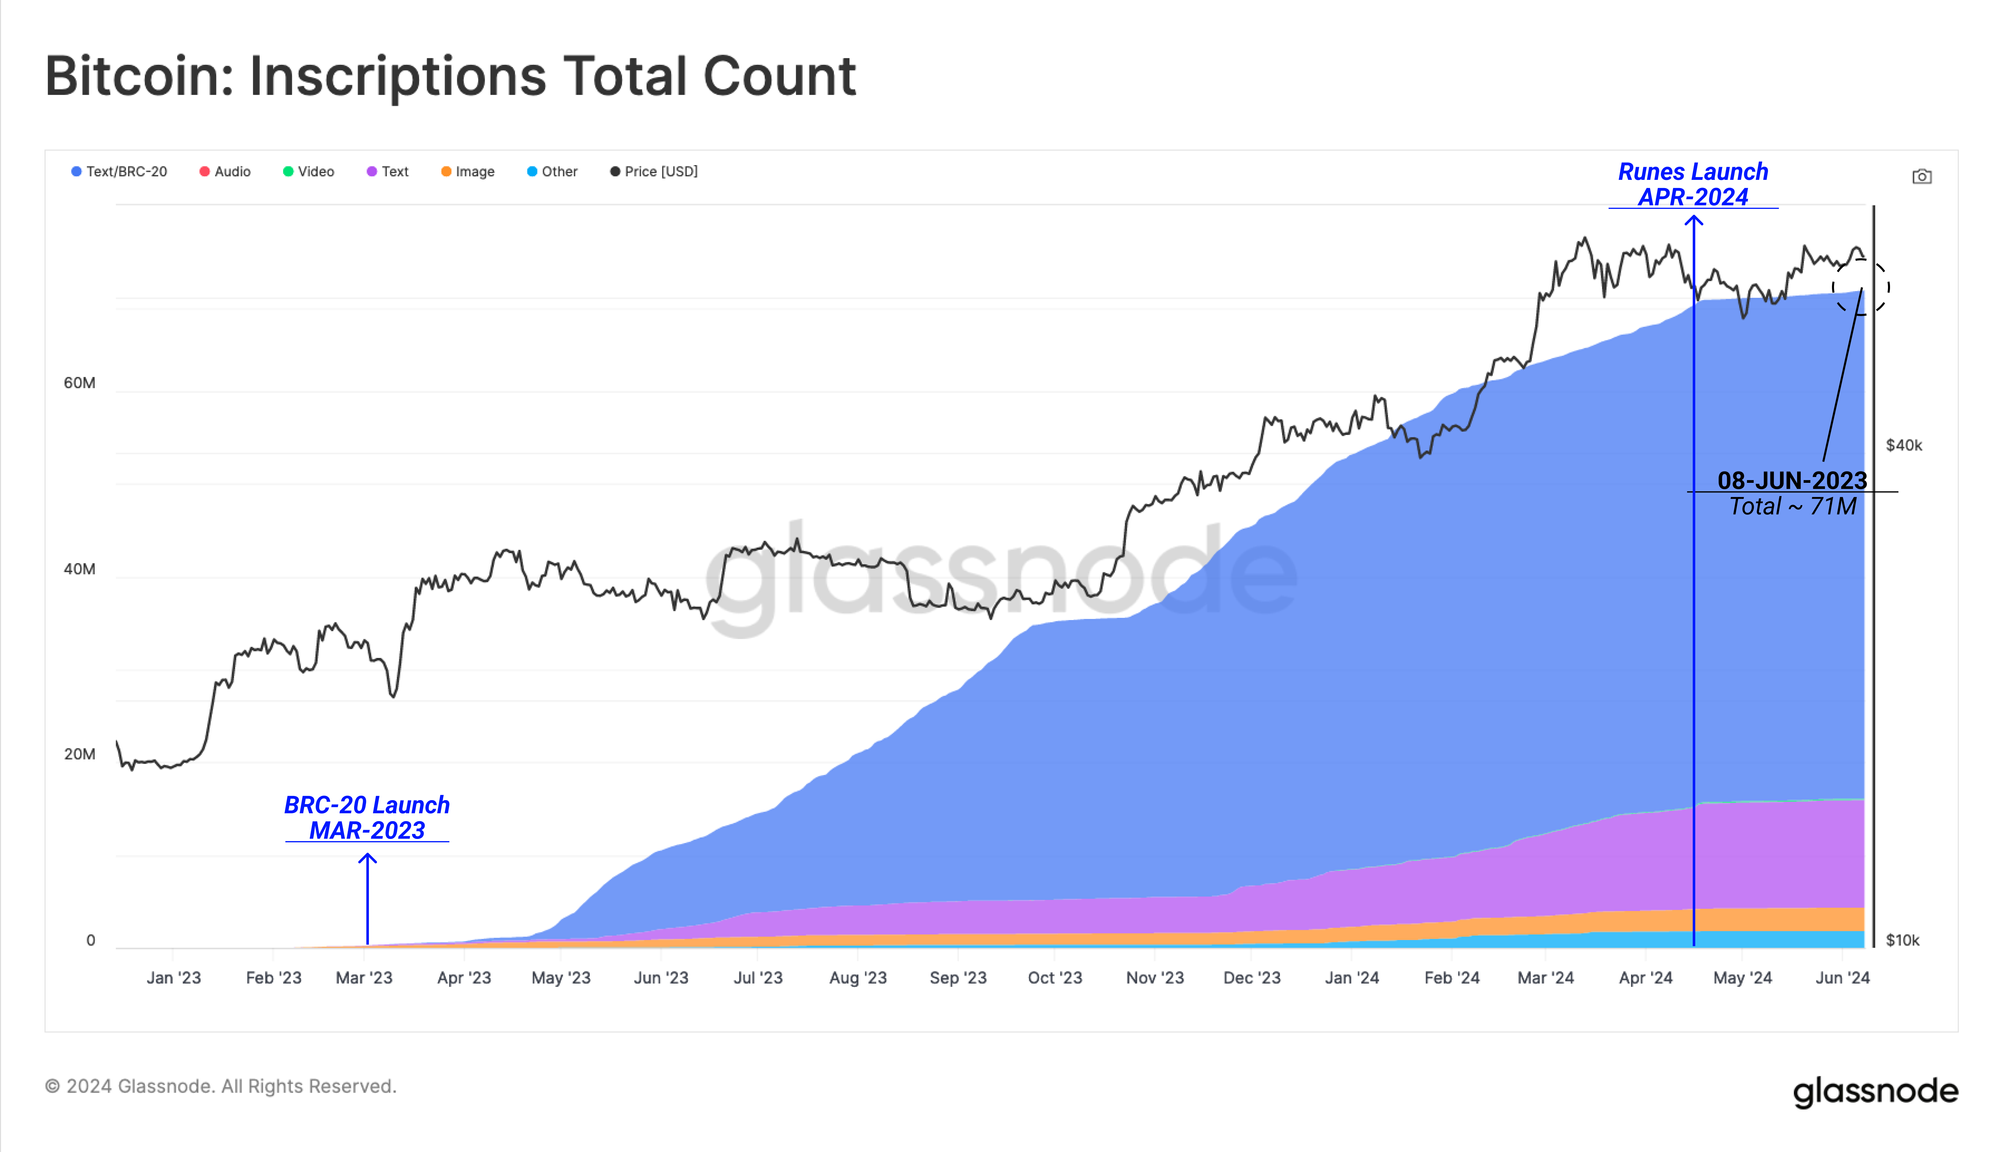
To explain the decline in inscription activity, we must highlight the emergence of the Runes protocol, which claims to be a more efficient method to introduce fungible tokens on Bitcoin. Runes went live on the halving block, which explains the inscription drop off in in mid-April.
Runes follow a different mechanism to Inscriptions and BRC-20 tokens, by utilziing the OP_RETURN field (80 bytes). This allows the protocol to encode arbitrary data to the chain whilst requiring significantly less blockspace.
With the Runes Protocol launching at the time of halving (20 April 2024), the demand for runes transactions skyrocketed to between 600k and 800k per day, and has remained elevated since.
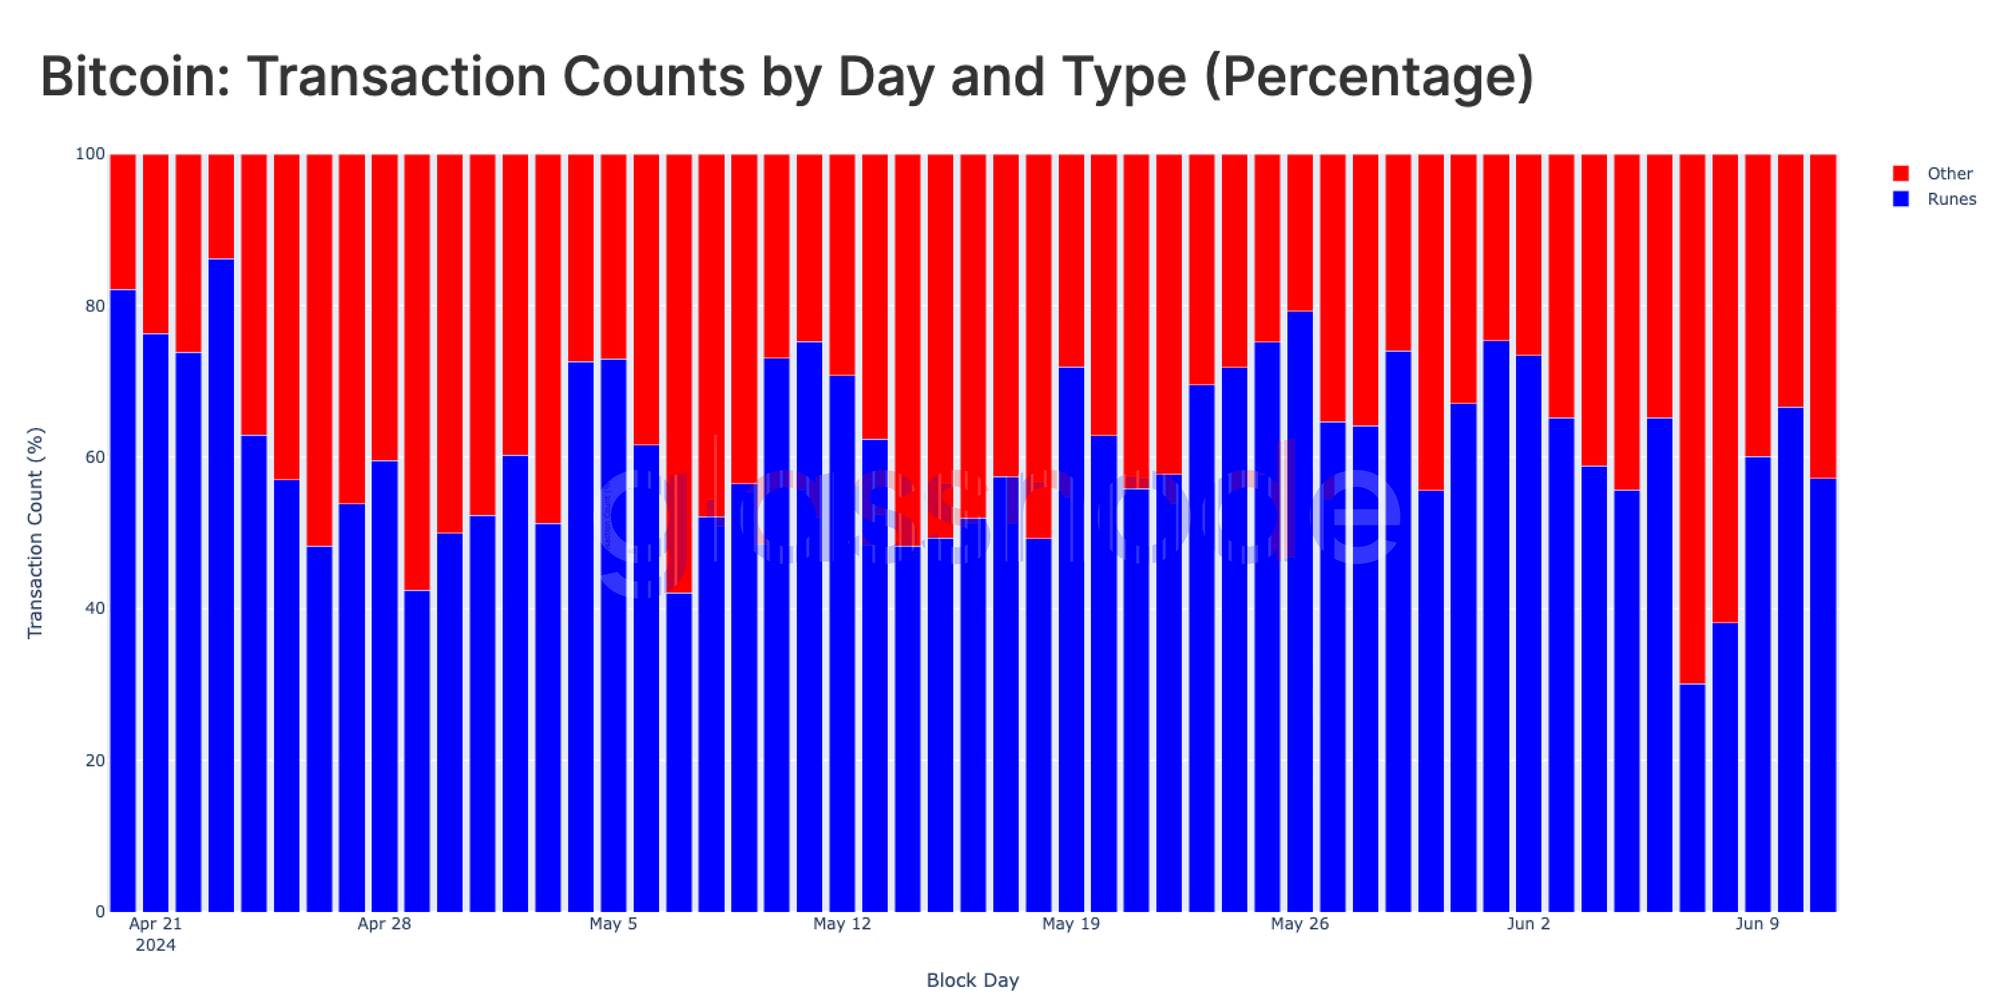
Runes-related transactions have now largely displaced BRC-20 tokens, as well as Ordinals and Inscriptions, commanding an impressive 57.2% of daily transactions. This indicates that collector speculation has likely shifted from Inscriptions to the Runes market.
A Divergence in ETF Demand
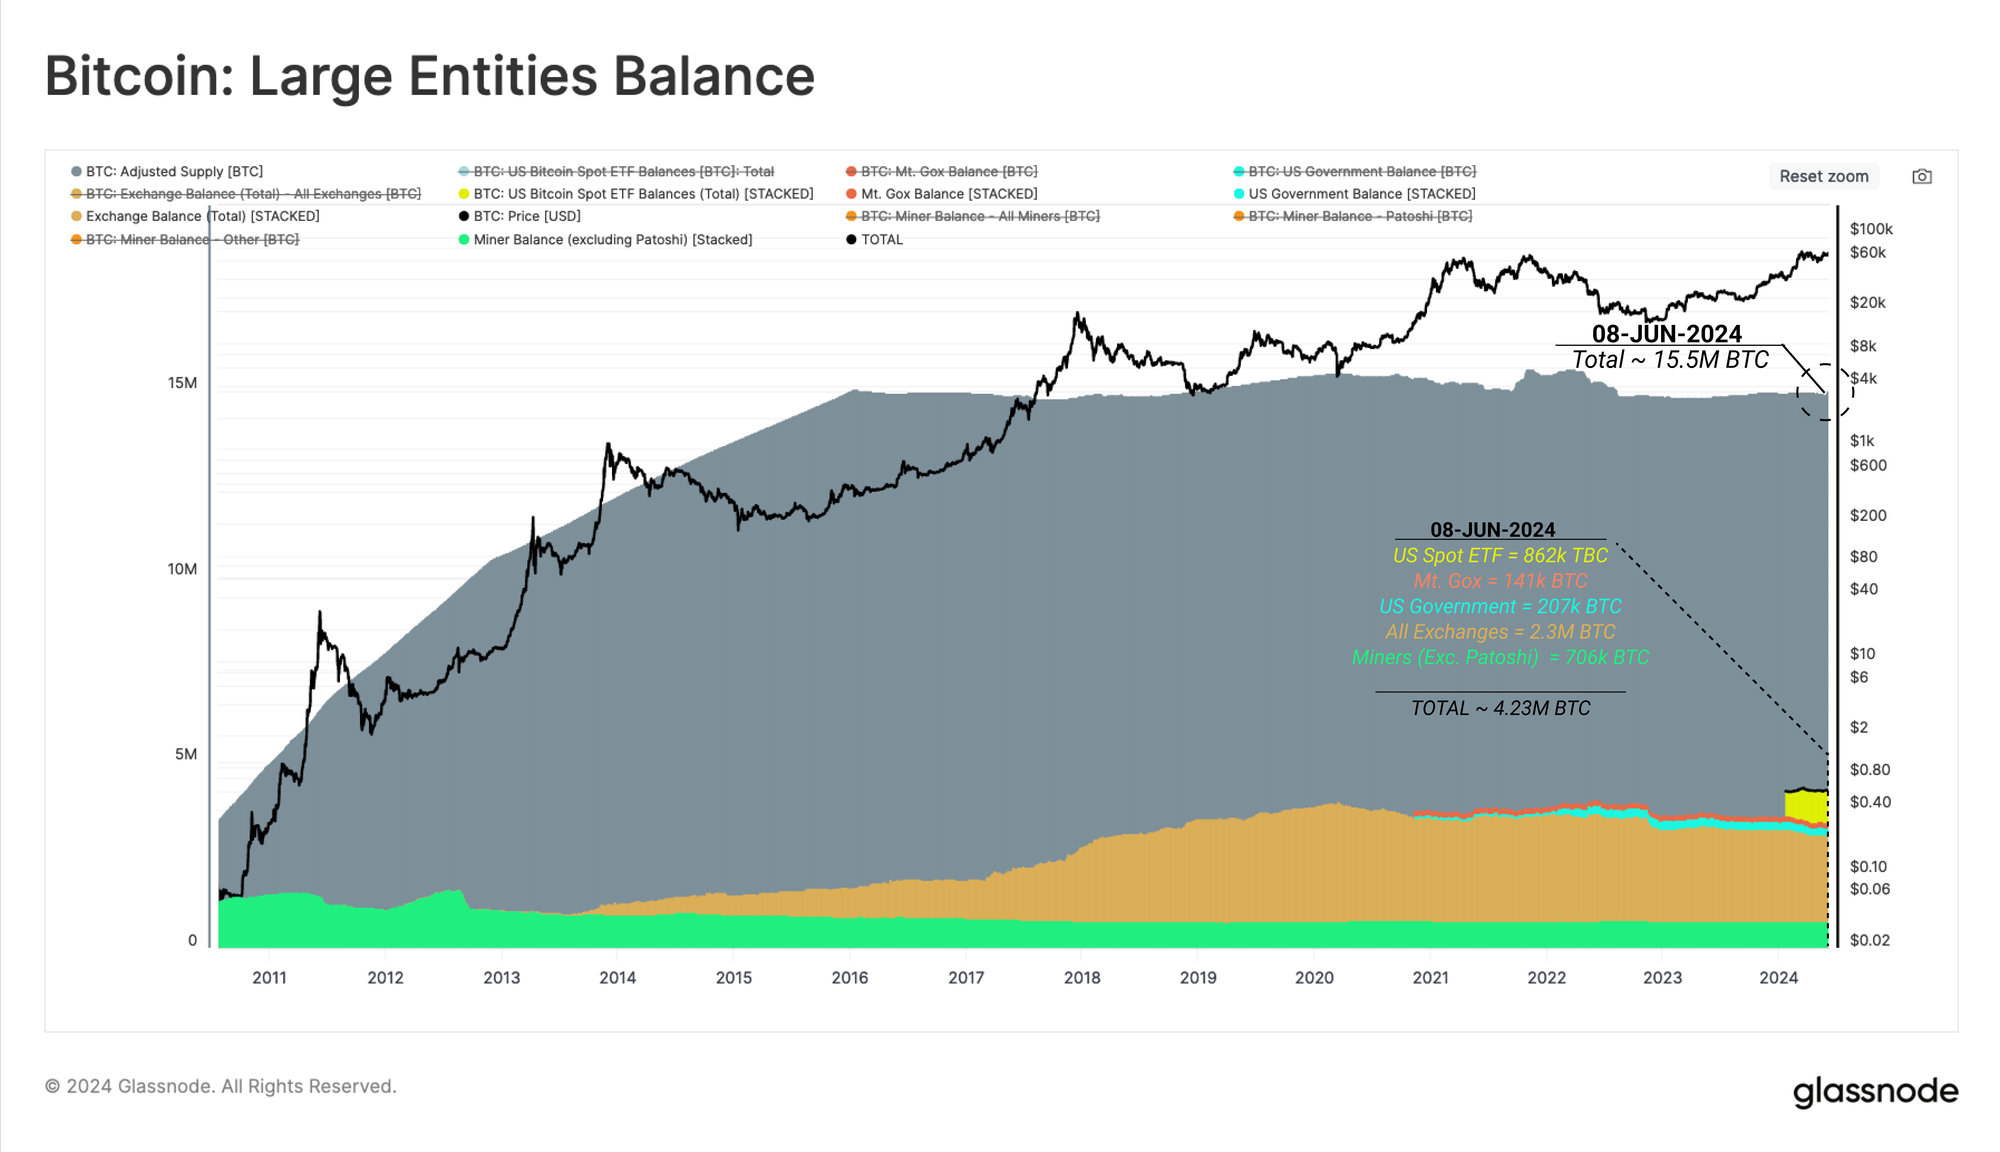
Another recent divergence which has garnered attention is the stagnant, sideways movement of price despite the impressive inflows into the US Spot ETFs. To ground and assess the ETF demand-side, we can compare the ETF balance (862k BTC) to other major labelled entities.
- US Spot ETF = 862k BTC
- Mt. Gox Trustee = 141k BTC
- US Government = 207k BTC
- All Exchanges = 2.3M BTC
- Miners (Exc. Patoshi) = 706k BTC
The aggregated balance of all these entities is estimated to be ~4.23M, which accounts for 27% of the overall adjusted circulating supply (which is the total supply minus coins that have remained dormant for more than seven years).
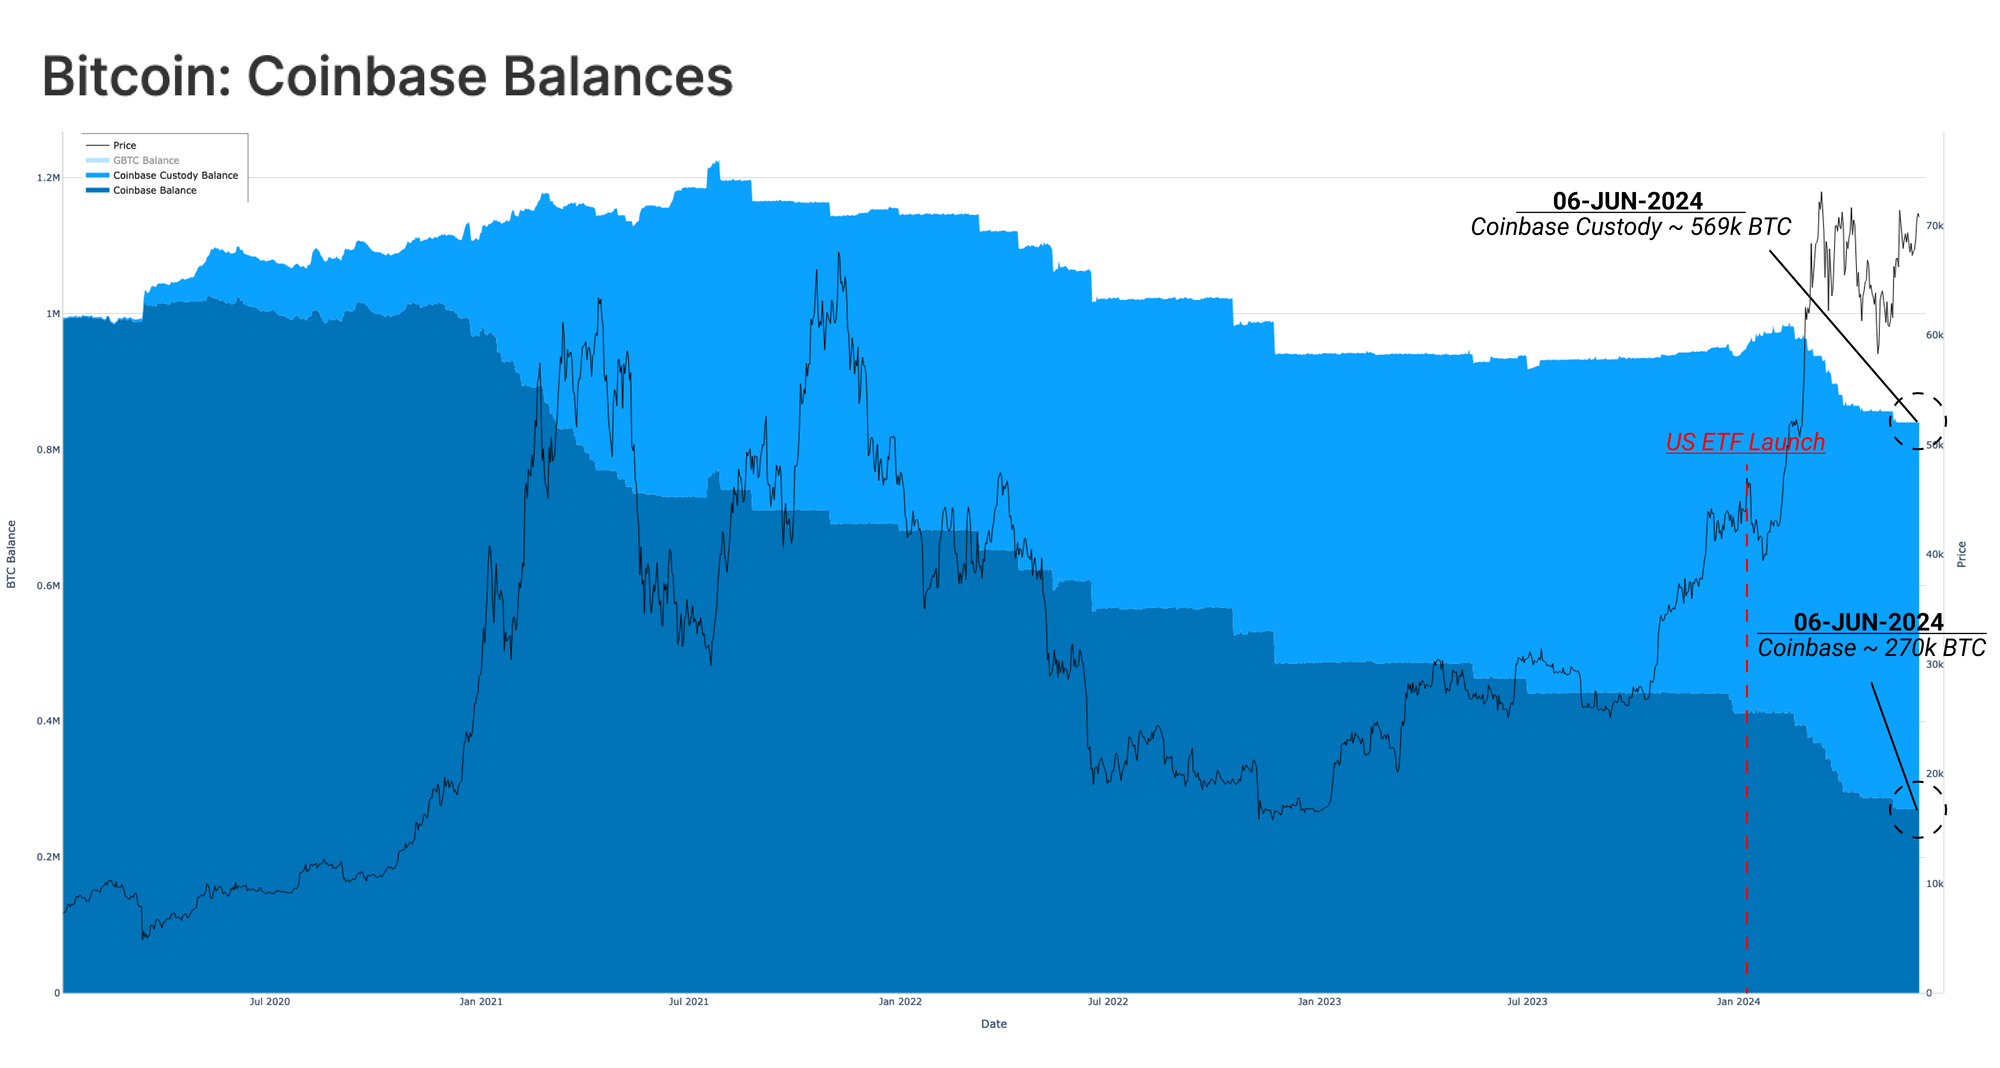
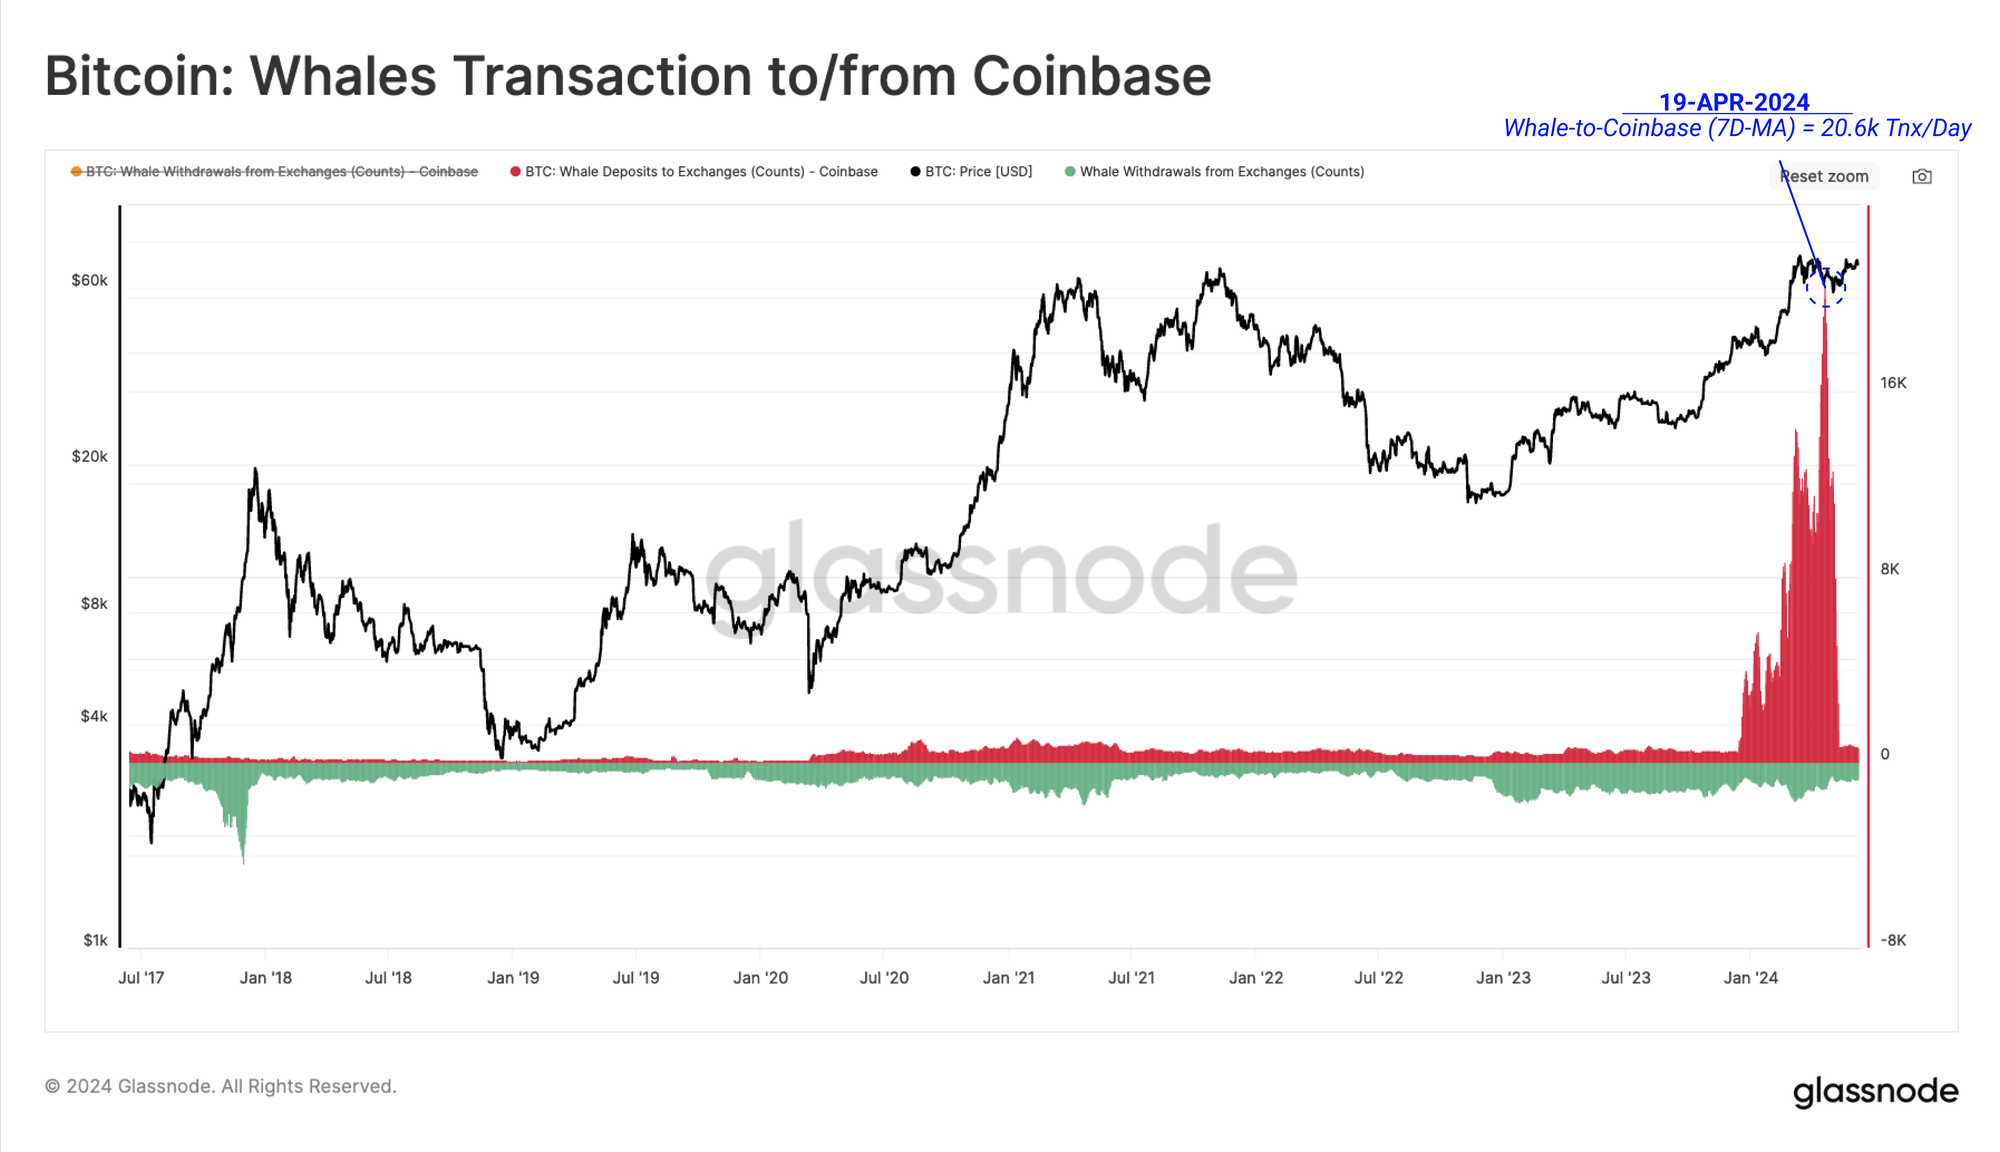
Coinbase as an entity holds a vast fraction of both aggregate exchange balances, as well the US Spot ETF balances via its custody service. The Coinbase Exchange and Coinbase Custody entities currently hold an estimated 270k and 569k BTC respectively.
With Coinbase serving both ETF clients and conventional on-chain asset holders, the gravity of the exchange in the market pricing process has become significant. Evaluating the number of Whale Deposits to Coinbase exchange wallets, we can see a considerable increase in deposit transactions following the launch of the ETFs.
However, we note a significant portion of the deposits are associated with the outflows from the GBTC address cluster, which has been a long-standing supply overhead throughout the year.
In addition to GBTC selling pressure as the market rallied to new ATHs, another factor has recently contributed to the dampening of US Spot ETF demand pressure.
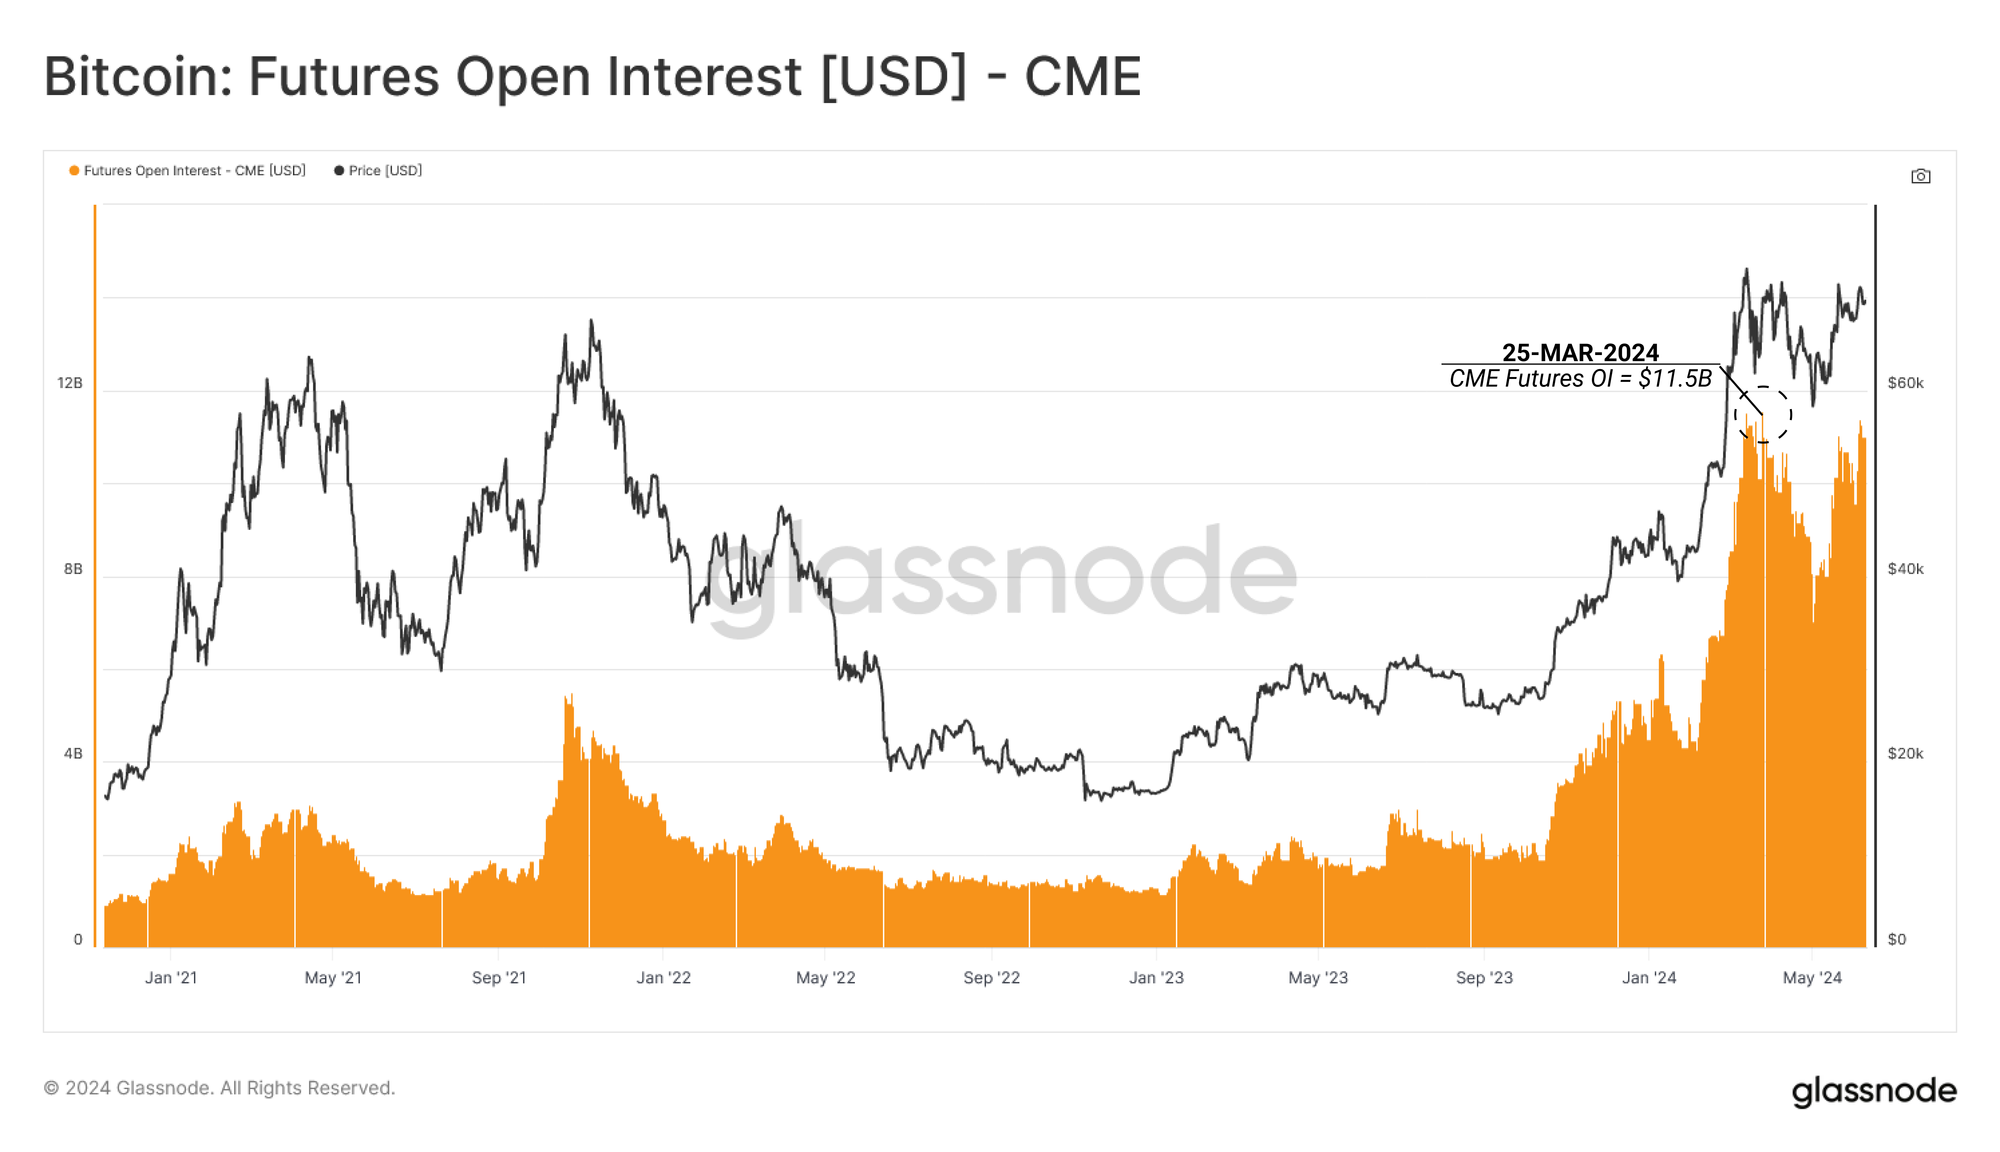
Looking at the CME Group futures market, open Interest has stabilized above $8B, after setting a new record high of $11.5B in March 2024. This may signal that an increasing number of traders from traditional markets are adopting a cash-and-carry-arbitrage strategy.
This arbitrage involves a market-neutral position, coupling the purchase of a long spot position, and the sale (short) of a position in a futures contract of the same underlying asset which is trading at a premium.
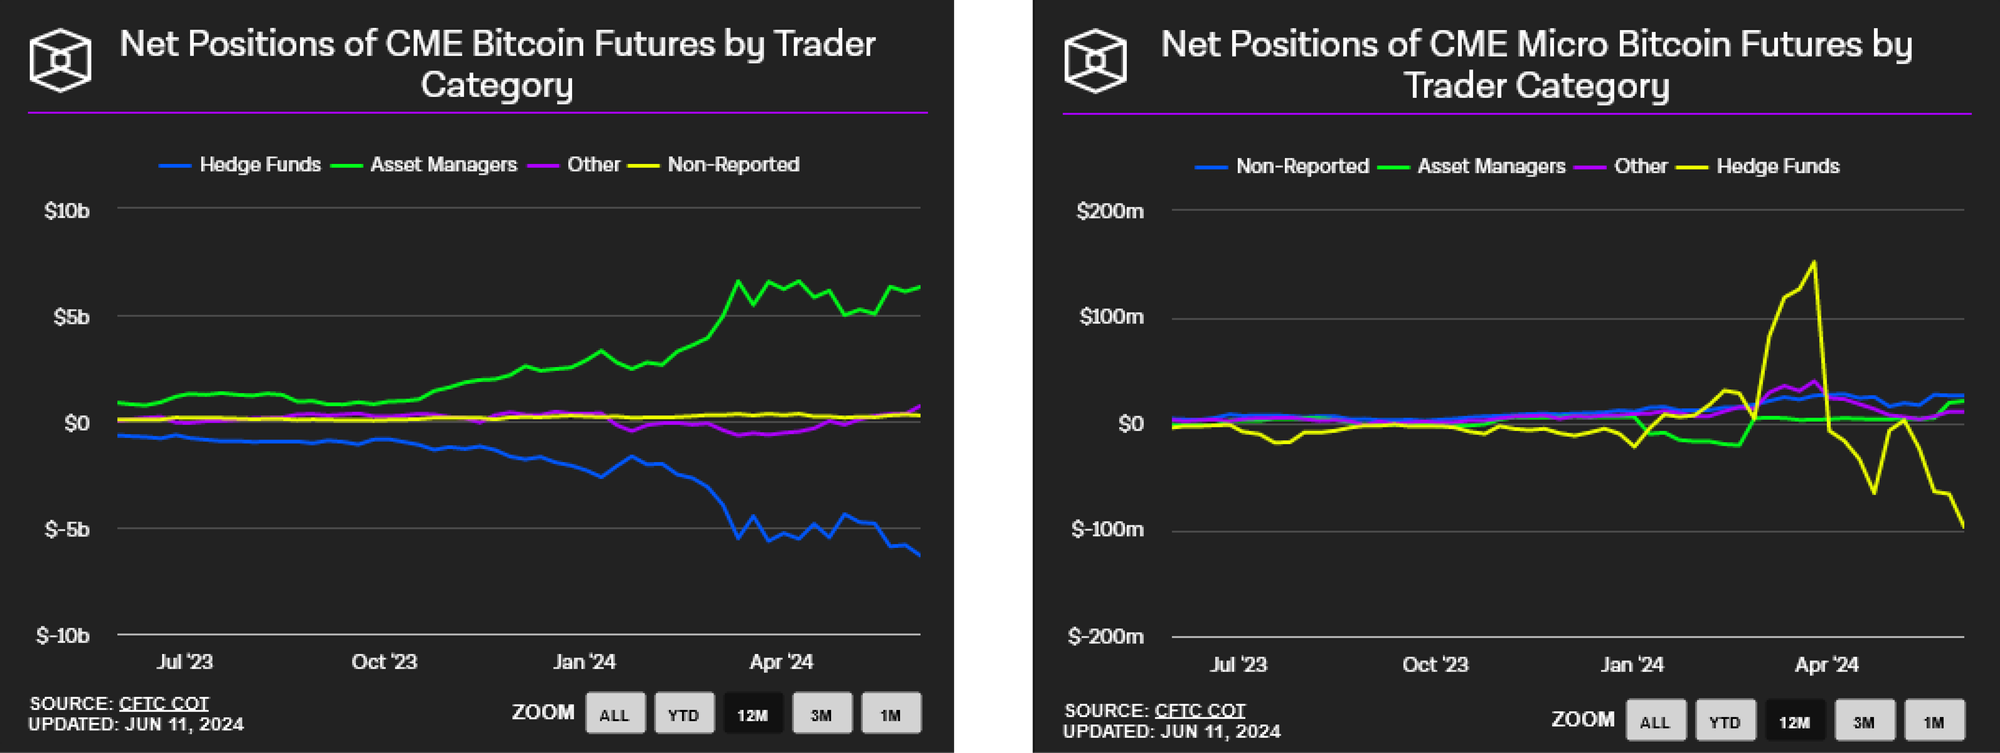
We can see that entities categorised as hedge funds are building up an increasingly large net short position for Bitcoin.
This provides confluence that the cash-and-carry trade structure may be a meaningful source of ETF inflow demand, where the ETFs are the instrument for obtaining the long spot exposure. The CME Group exchange has also seen a dramatic increase in both open interest, and overall market dominance since 2023, suggesting it is becoming a preferred venue for hedge funds to shorting futures via the CME Group exchange.
At present, Hedge Funds are net short in both CME Bitcoin and Micro CME Bitcoin markets by $6.33B and $97M, respectively.
Summary and Conclusions
The drastic divergence between activity metrics has been accelerated by the extreme popularity of the Runes protocol, which utilizes significant address reuse where singular addresses are generating multiple transactions.
The emergence and magnitude of the Cash-and-Carry trade between long US Spot ETF products and shorting futures via the CME Group exchange has largely neutered the buy-side inflows into ETFs. This has resulted in a relatively neutral impact on market prices, suggesting organic buy-side from non-arbitrage demand is required to further stimulate positive price action.
Disclaimer: This report does not provide any investment advice. All data is provided for information and educational purposes only. No investment decision shall be based on the information provided here and you are solely responsible for your own investment decisions.
Exchange balances presented are derived from Glassnode’s comprehensive database of address labels, which are amassed through both officially published exchange information and proprietary clustering algorithms. While we strive to ensure the utmost accuracy in representing exchange balances, it is important to note that these figures might not always encapsulate the entirety of an exchange’s reserves, particularly when exchanges refrain from disclosing their official addresses. We urge users to exercise caution and discretion when utilizing these metrics. Glassnode shall not be held responsible for any discrepancies or potential inaccuracies. Please read our Transparency Notice when using exchange data.
- Join our Telegram channel
- For on-chain metrics, dashboards, and alerts, visit Glassnode Studio
- For automated alerts on core on-chain metrics and activity on exchanges, visit our Glassnode Alerts Twitter