The Week On-Chain (26 Feb 2020 - 4 Mar 2020)
On-chain fundamentals continue to paint an optimistic picture for bitcoin, as the price rallies back up over $9000.


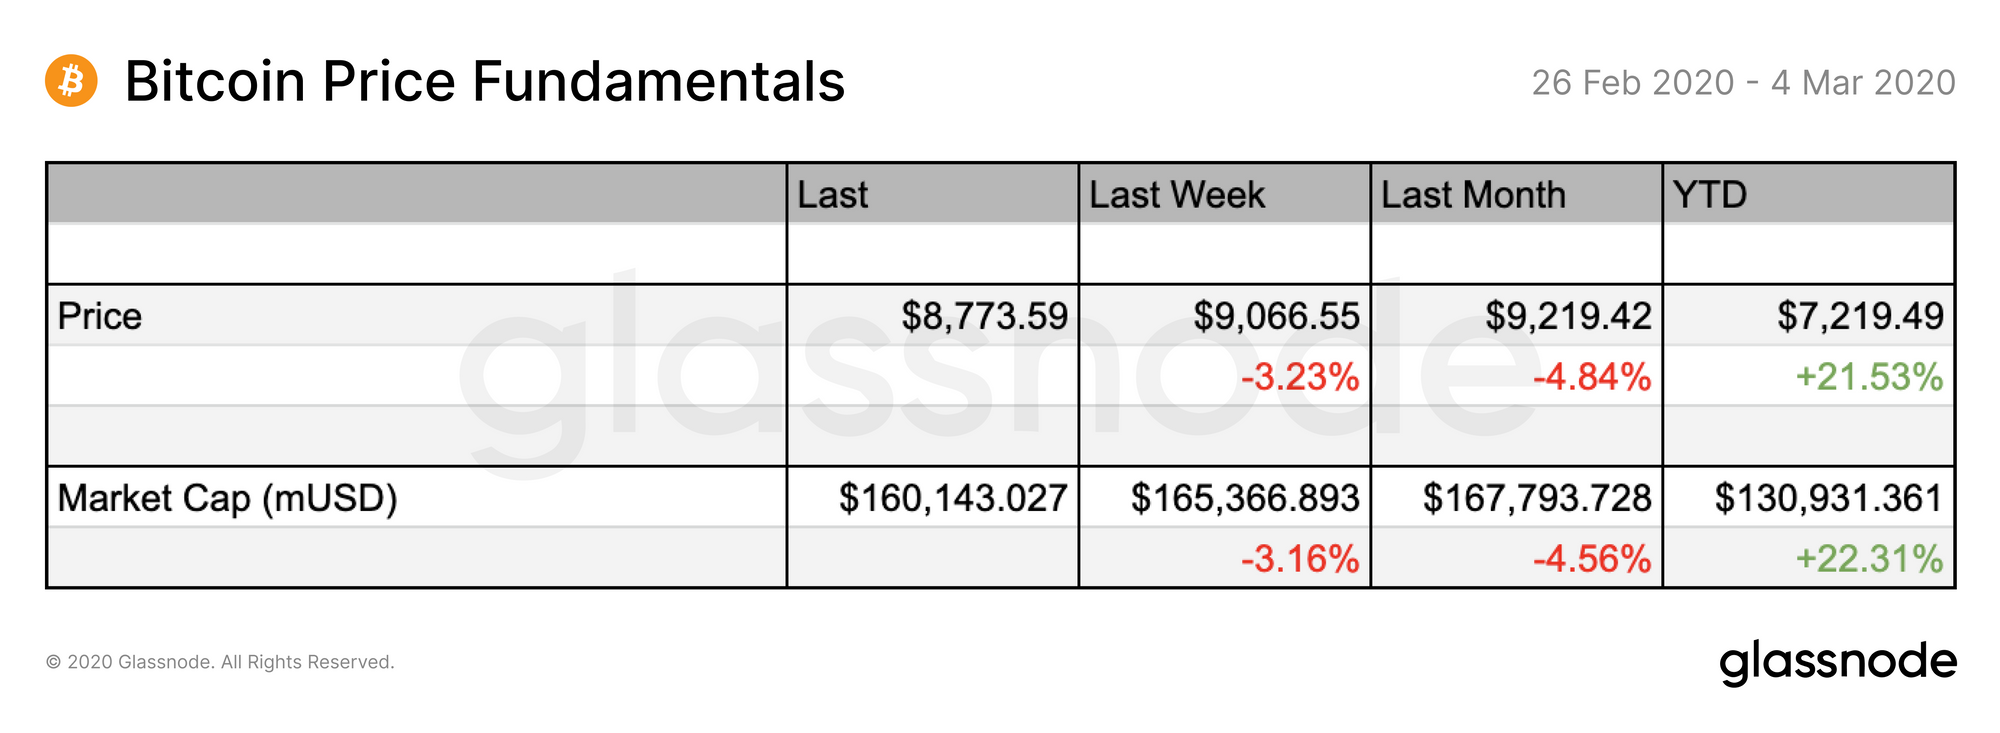
Bitcoin Market Health
For the third week in a row, BTC suffered a price drop - however, it is showing signs of recovering over the past few days. Since the table below was published (Wednesday 4 March), the price of bitcoin has risen back above the $9k mark.
Current BTC price (Thursday 5 Mar): ~$9100
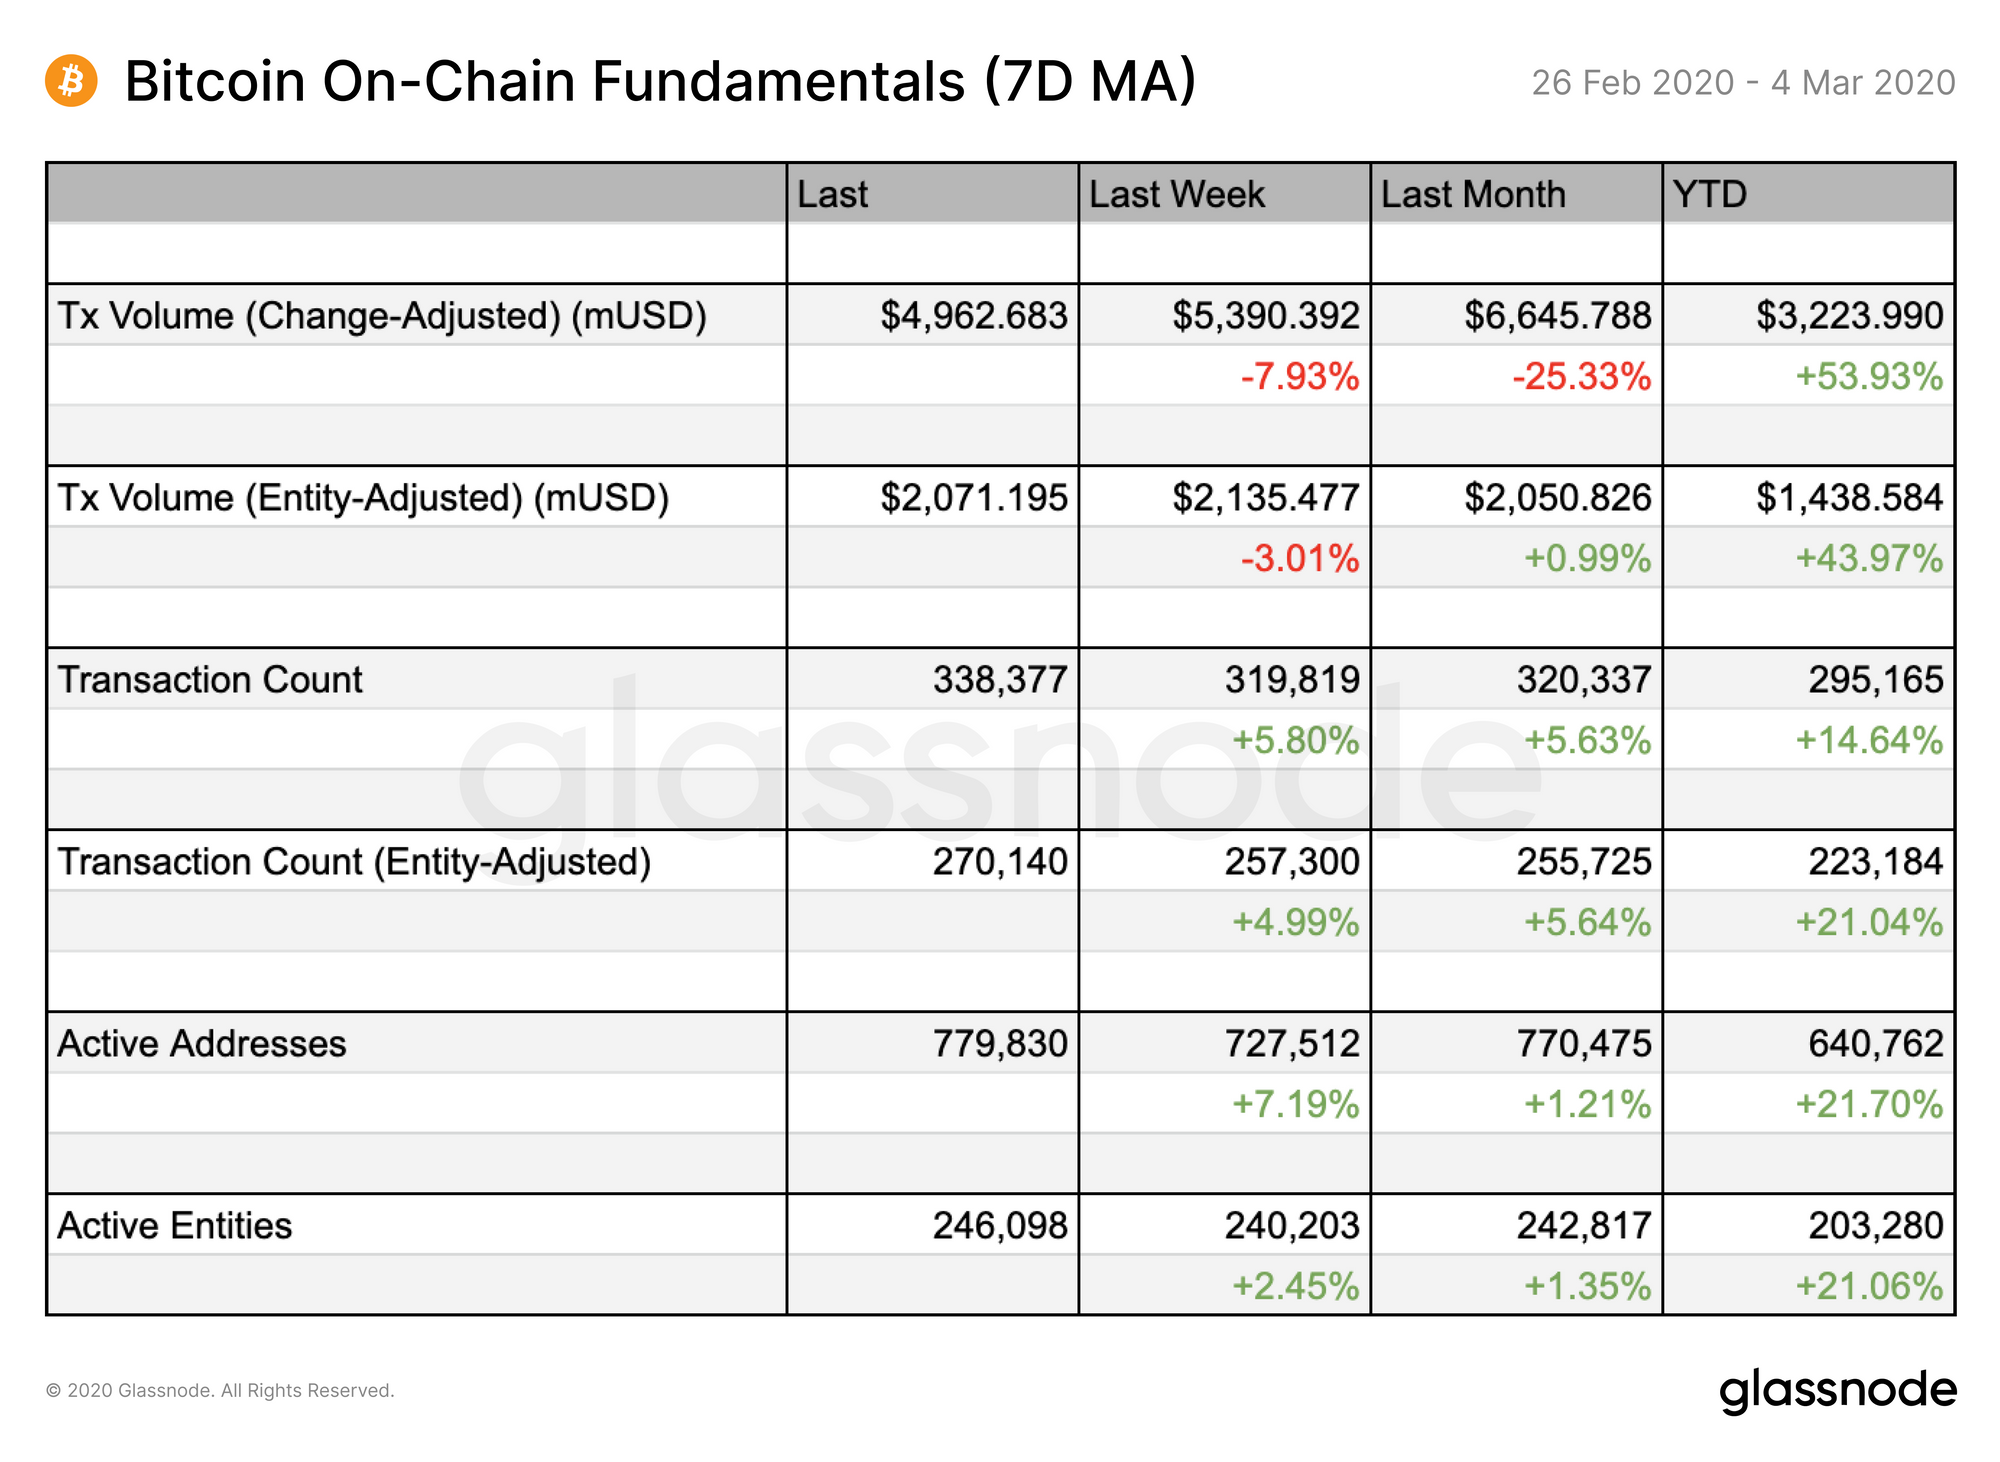
Along with price, on-chain fundamentals also show signs of recovering, with the number of transactions and active entities in the network on the rise.
While the 7-day moving average of on-chain USD volume appears to have decreased, this figure was brought down by the dip earlier in the week; absolute values (with no MA applied) are in fact on par with volumes seen a week and a month ago.
Last week, we predicted a recovery for BTC, with a support level at $8200-8500. At its lowest point last week, the price dipped briefly below $8500 before settling back up around $8800, as predicted by on-chain data and technical analysis.
While coronavirus fears threatened to push prices below this support level, this threat appears to have passed for the time being as markets recover both in and out of crypto.
Outside of these short-term trends, there is ongoing debate about whether overall crypto market sentiment is bullish or bearish. On-chain metrics continue to paint an optimistic picture...
Reserve Risk Indicates Current BTC Price is Very Attractive Due to Low Risk/Reward Ratio
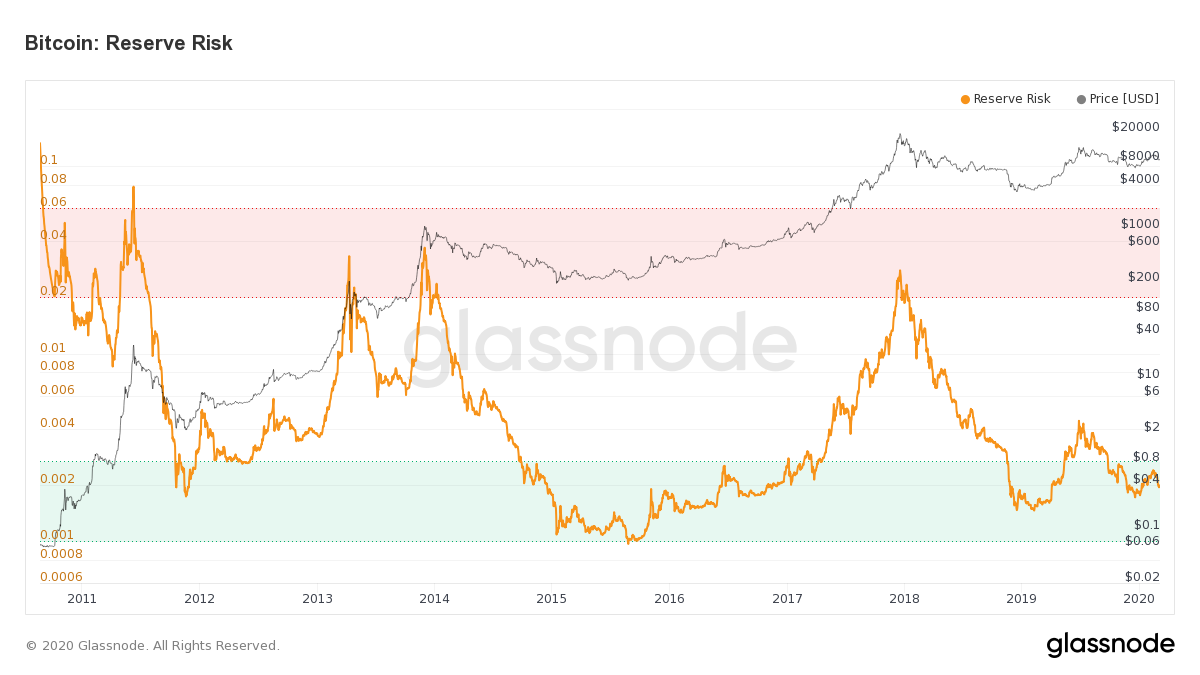
BTC’s Reserve Risk is currently at low levels, indicating an attractive risk/reward ratio for investing in bitcoin. This metric, which is used to assess the confidence of long-term holders relative to price, shows high investor confidence in BTC at current price levels. Along with other on-chain fundamentals, it suggests that BTC has more room to grow imminently.
Reserve Risk is defined as the current price divided by HODL Bank, which represents deferred spending as a result of HODLing, demonstrating investor confidence. The attractiveness of the current BTC price (i.e. Reserve Risk) can be determined in relation to this sum total of confidence built over time.
When confidence is high and price is low, there is an attractive risk/reward to invest (Reserve Risk is low). Current levels suggest that holding BTC is attractive at this price, and potential rewards outweigh the risks of entering the market now.
Low ASOL Values Also Indicate Strong Investor Confidence
ASOL (Average Spent Output Lifespan) represents long-term investor confidence by showing when long-term HODLers are exiting the market. Historically, increases in this metric have come simultaneously to big sell-offs as long-term investors sell their positions.
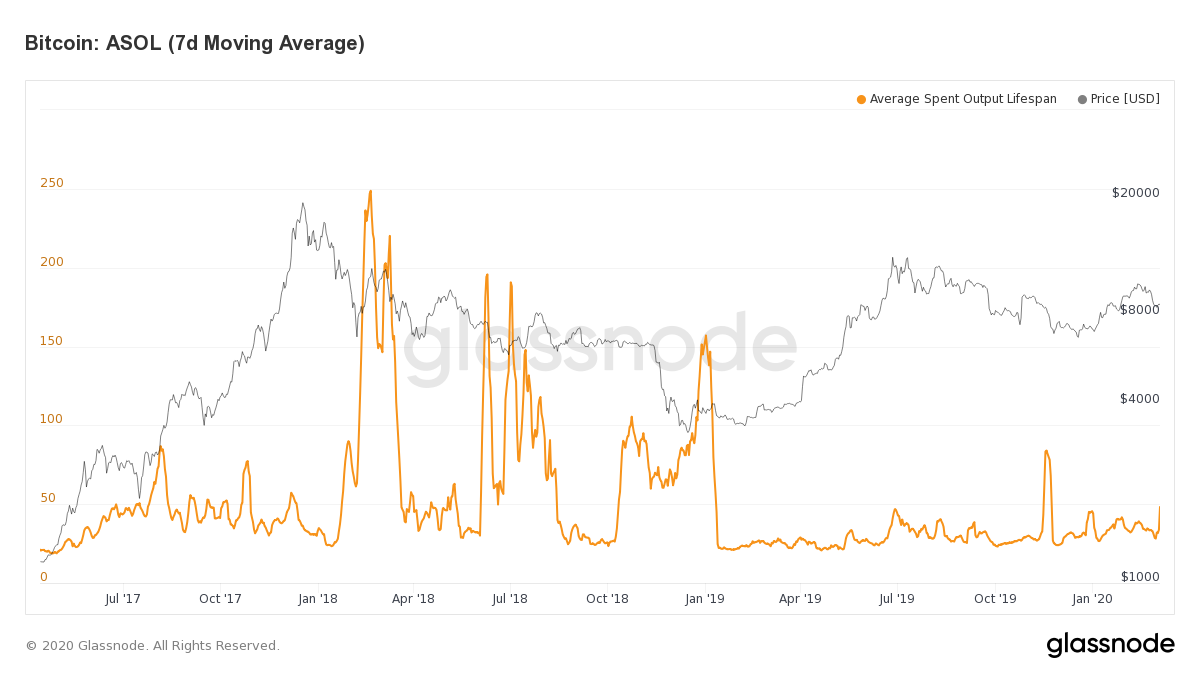
Close market observers may have noticed a significant spike in ASOL over the past few days. However, this is no cause for alarm; Glassnode's data scientists have traced this spike to an exchange aggregating BTC "dust" (i.e. very tiny amounts of BTC spread across many addresses) from Omni transactions.
When this activity is filtered out, ASOL levels remain low, supporting the thesis that long-term investors are not exiting their positions. Despite bitcoin's recent dip, confidence remains high.
Community Narrative
Content and insights derived from Glassnode data by our community
The whole crypto market has seen meaningful gains in 2020, and one of the best-performing assets is Kyber Network's KNC token, which has seen a radical +335% price increase since December 2019. Glassnode Studio user @Alex_Ged uses Glassnode's on-chain adaptation of the Herfindahl Index to illustrate why.
4/ With staking on the horizon, more people are entering and accumulating KNC (Data as of Feb 29) pic.twitter.com/XF5zp1U5LY
— Alex Gedevani 🧩 (@Alex_Ged) March 1, 2020
The Herfindahl Index measures addresses' shares of the current supply of a given token; a large score indicates high concentration of supply, whereas a small score is an indicator for more evenly distributed funds across addresses.
In his thread, Gedevani looks at KNC's decreasing Herfindahl Index value to show that KNC is becoming increasingly distributed, as more people enter the market and accumulate the token in anticipation of the launch of its staking mechanism this year, which will allow holders to receive a portion of network fees.
He points out: "Adoption is still one of the most useful yet overlooked indicators in crypto".
View his twitter thread for the full analysis, and send us your own content using Glassnode data to be featured in our weekly update.

- Follow us and reach out on Twitter
- For on–chain metrics and activity graphs, visit Glassnode Studio
- For automated alerts on core on–chain metrics and activity on exchanges, visit our Glassnode Alerts Twitter
Disclaimer: This report does not provide any investment advice. All data is provided for information purposes only. No investment decision shall be based on the information provided here and you are solely responsible for your own investment decisions.