The Week On-Chain (Week 25, 2020)
Bitcoin's on-chain fundamentals are staying consistent along with price, but a catalyst is needed to push these up into bullish territory.


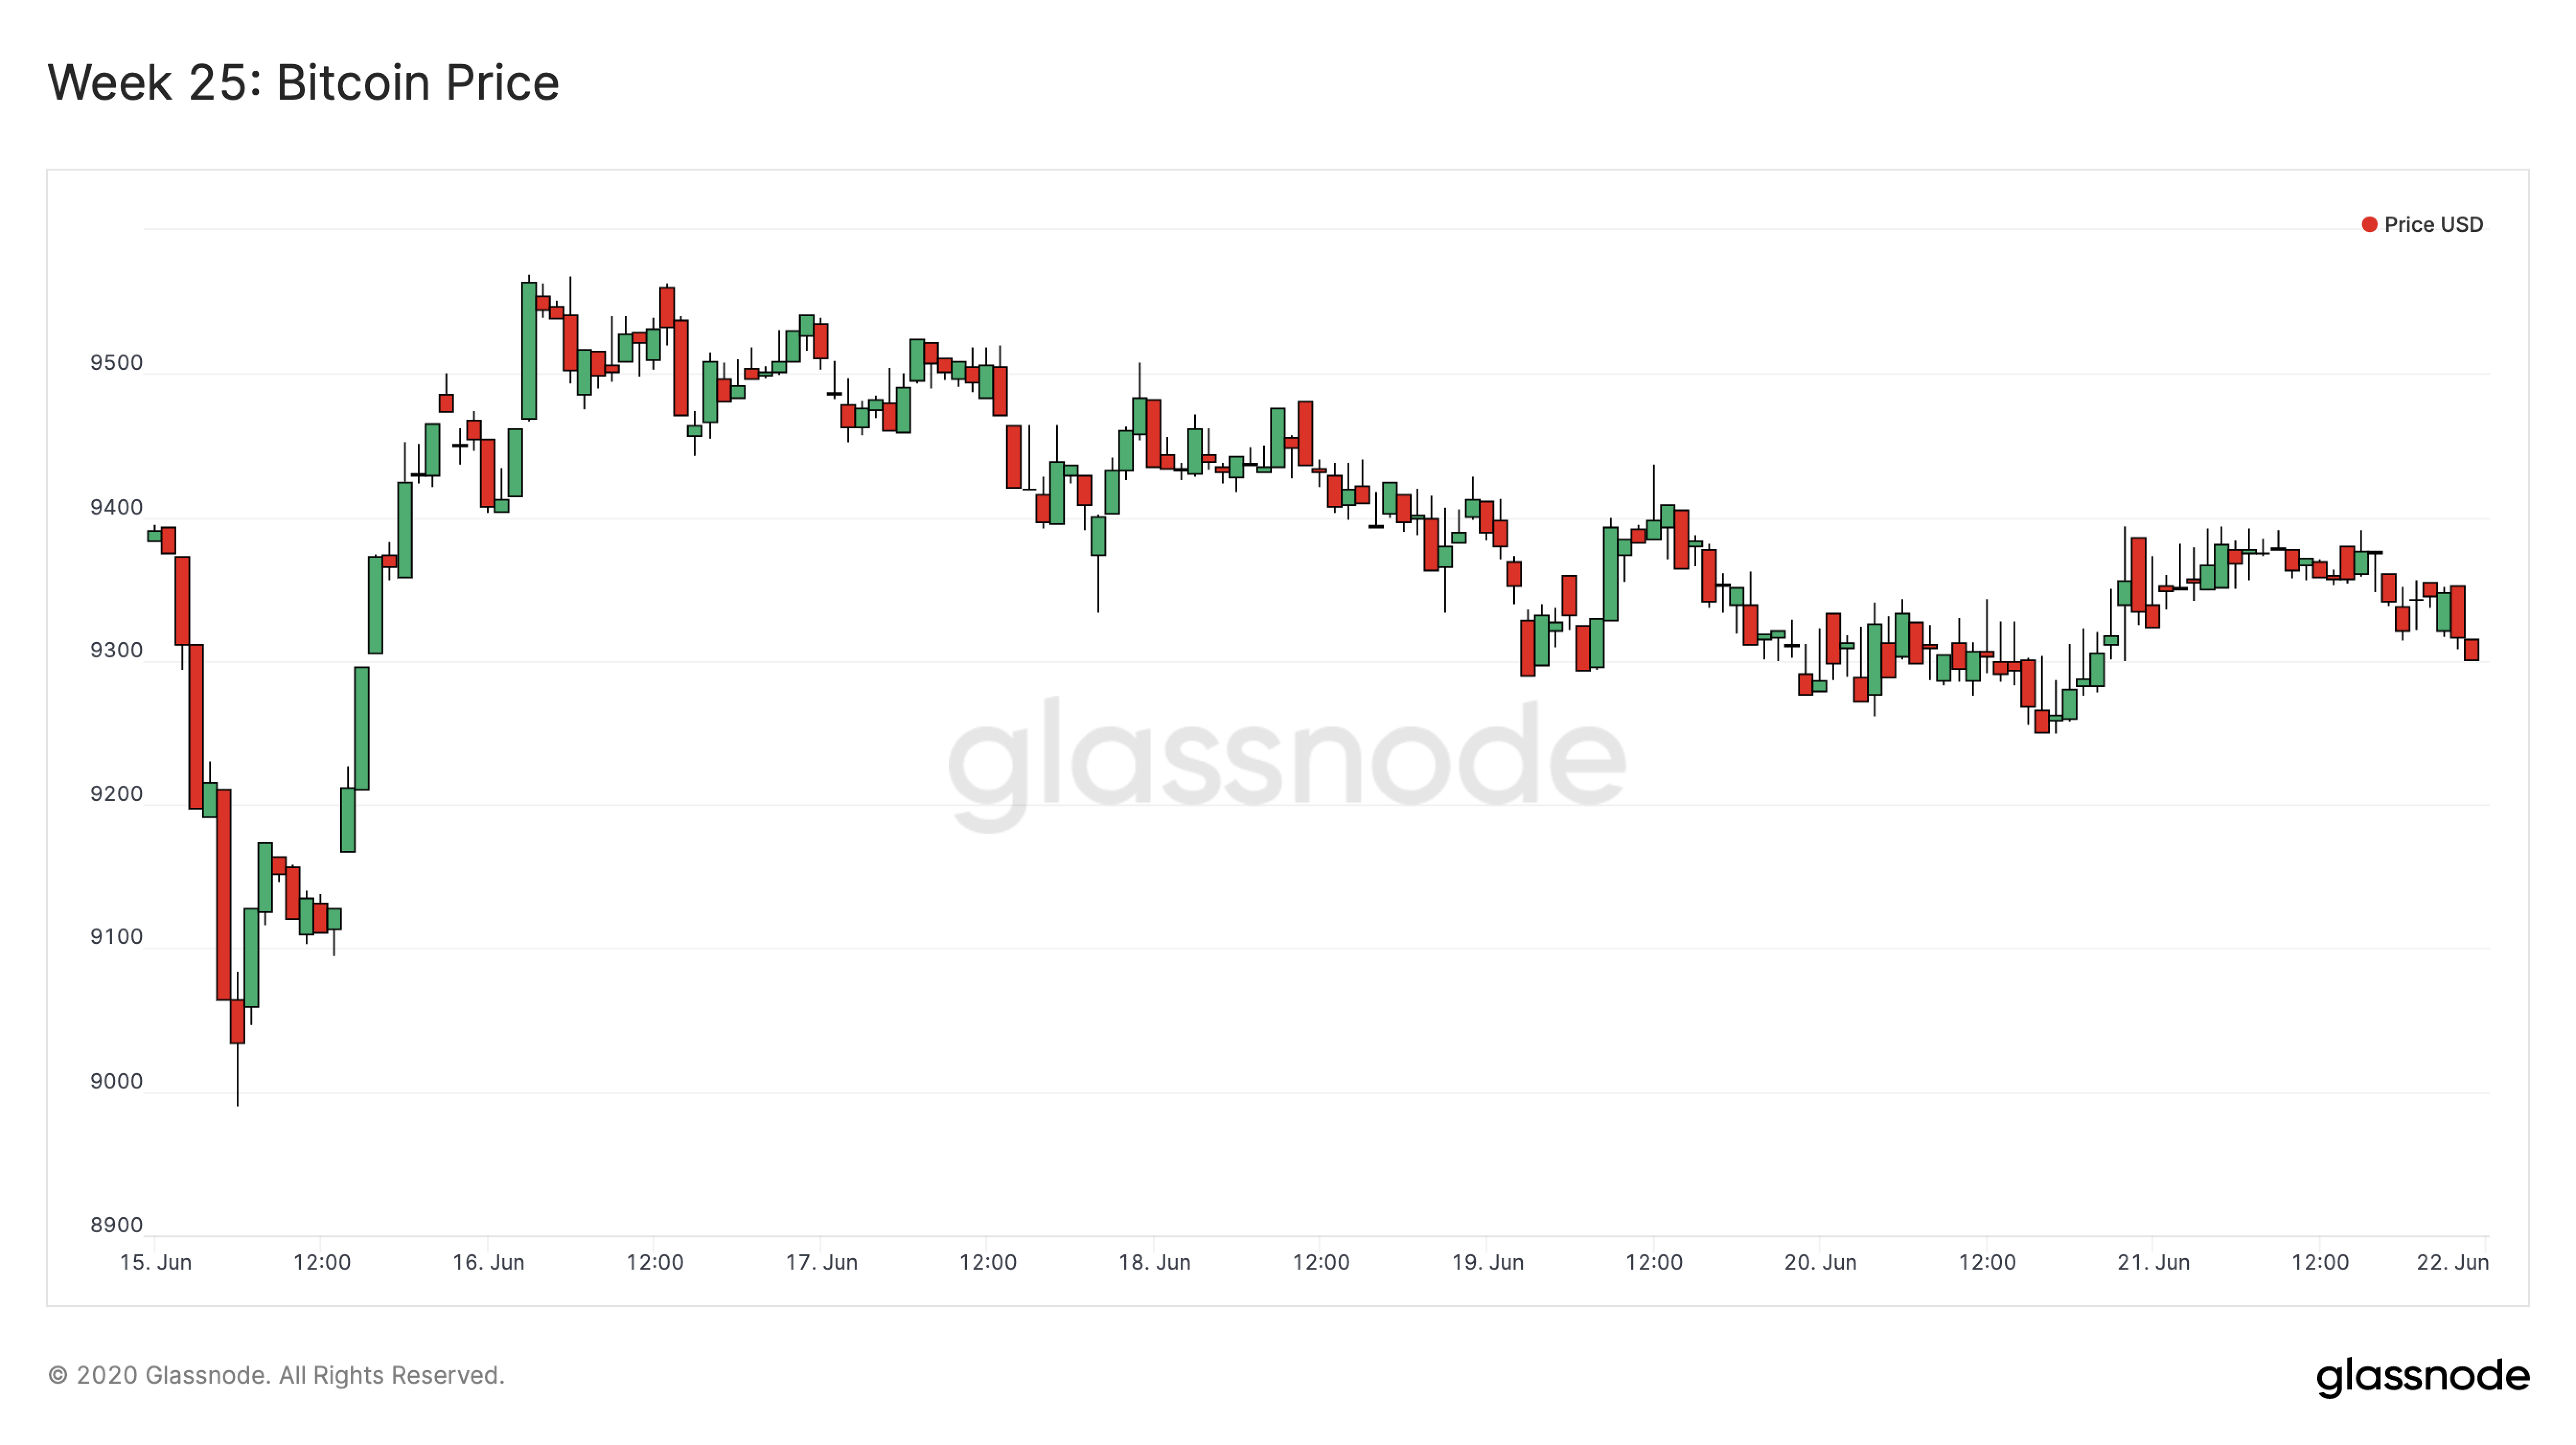
Bitcoin Market Health
Despite a few large fluctuations, bitcoin's price has been surprisingly stable for the past 2 months, rarely leaving the $9k-10k range. After a brief drop below $9k last Monday, BTC recovered back to a peak of around $9560 on Tuesday before slowly decreasing for the remainder of last week, closing out around $9340.
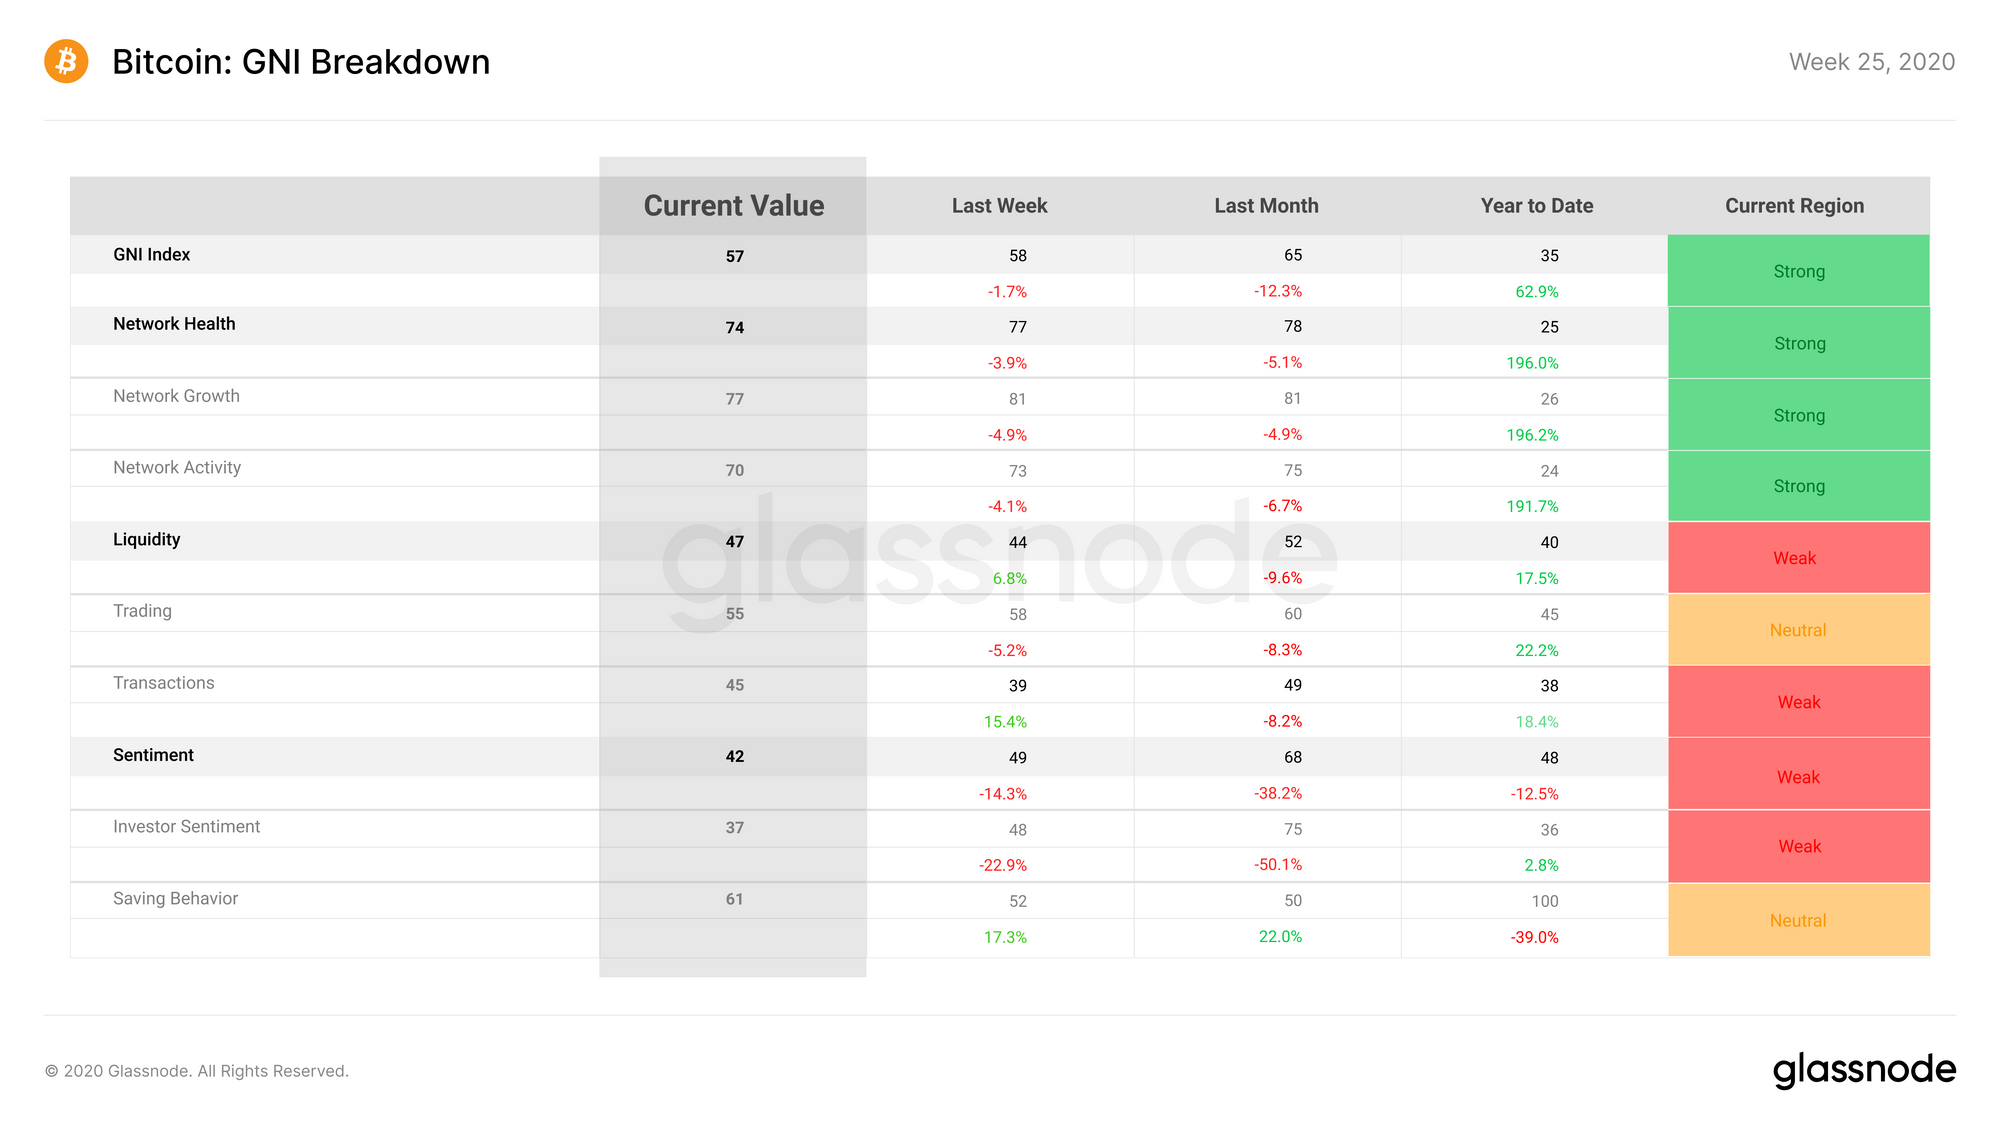
Bitcoin on-chain fundamentals stayed relatively consistent over Week 25. GNI decreased by only one point, staying in the strong range at a value of 57 points. Its slight decrease was driven by a drop in the Sentiment subindex, which saw investor sentiment decrease for the second week in a row.
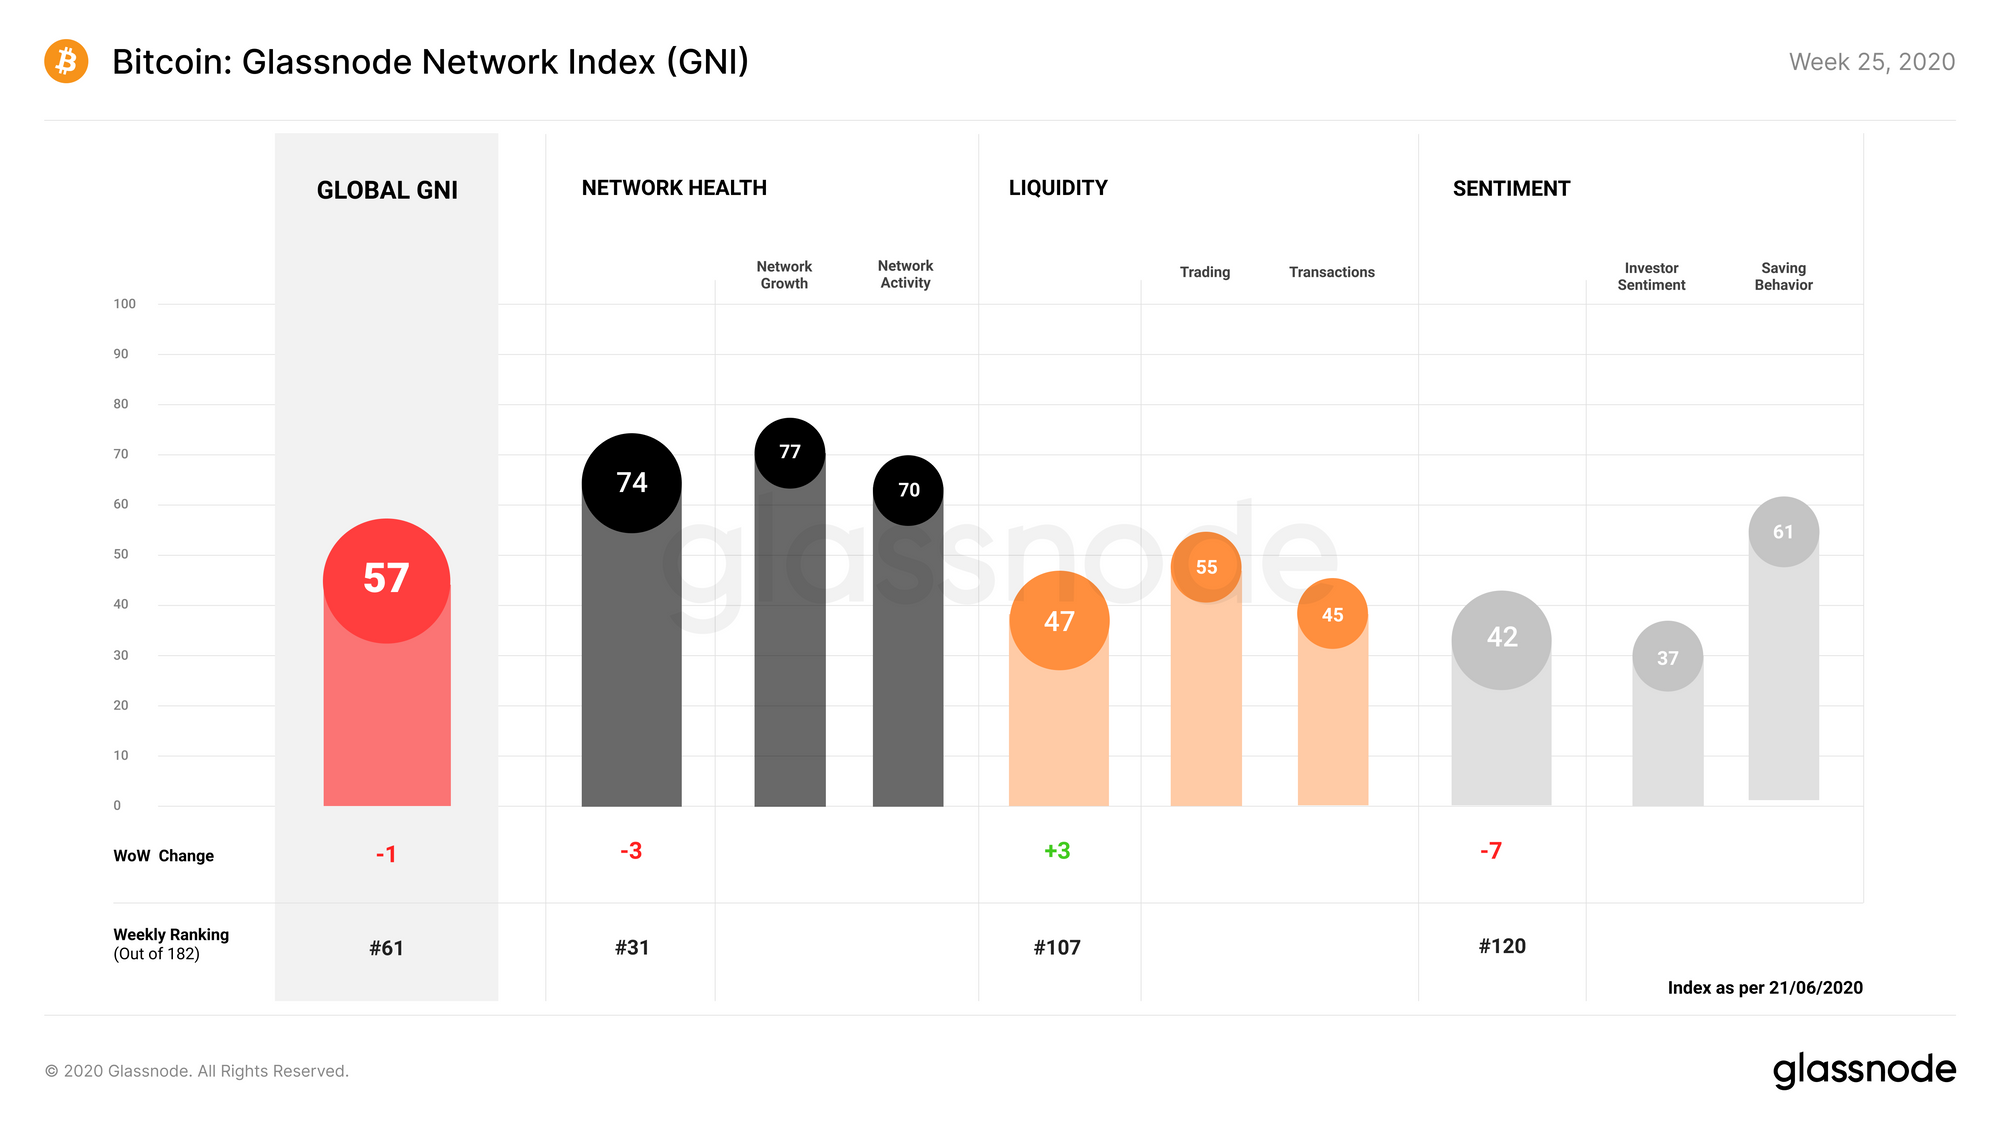
Network Health lost 3 points last week, with small reductions in both the network growth and network activity subcategories. While on-chain activity and growth stayed largely consistent, small declines impacted the overall Network Health subindex.
Liquidity gained 3 points, reversing losses seen the previous week and bringing it to a value of 47 points. Its incline over the past week was caused by an increase in on-chain transaction activity, while trading liquidity (i.e. exchange flows and volumes) saw a small decrease.
Sentiment was the biggest loser of the past week, losing 7 points and dropping to a value of 42 points. Although the saving behaviour subcategory increased, this was negated by a large decrease in investor sentiment, which suffered as a result of the slight price decrease and the requisite loss in BTC's supply in profit.
Glassnode Compass
The Glassnode Compass outlines the general regime in which Bitcoin is currently located, based on its on-chain fundamentals (as determined by the GNI) and its recent price behavior.
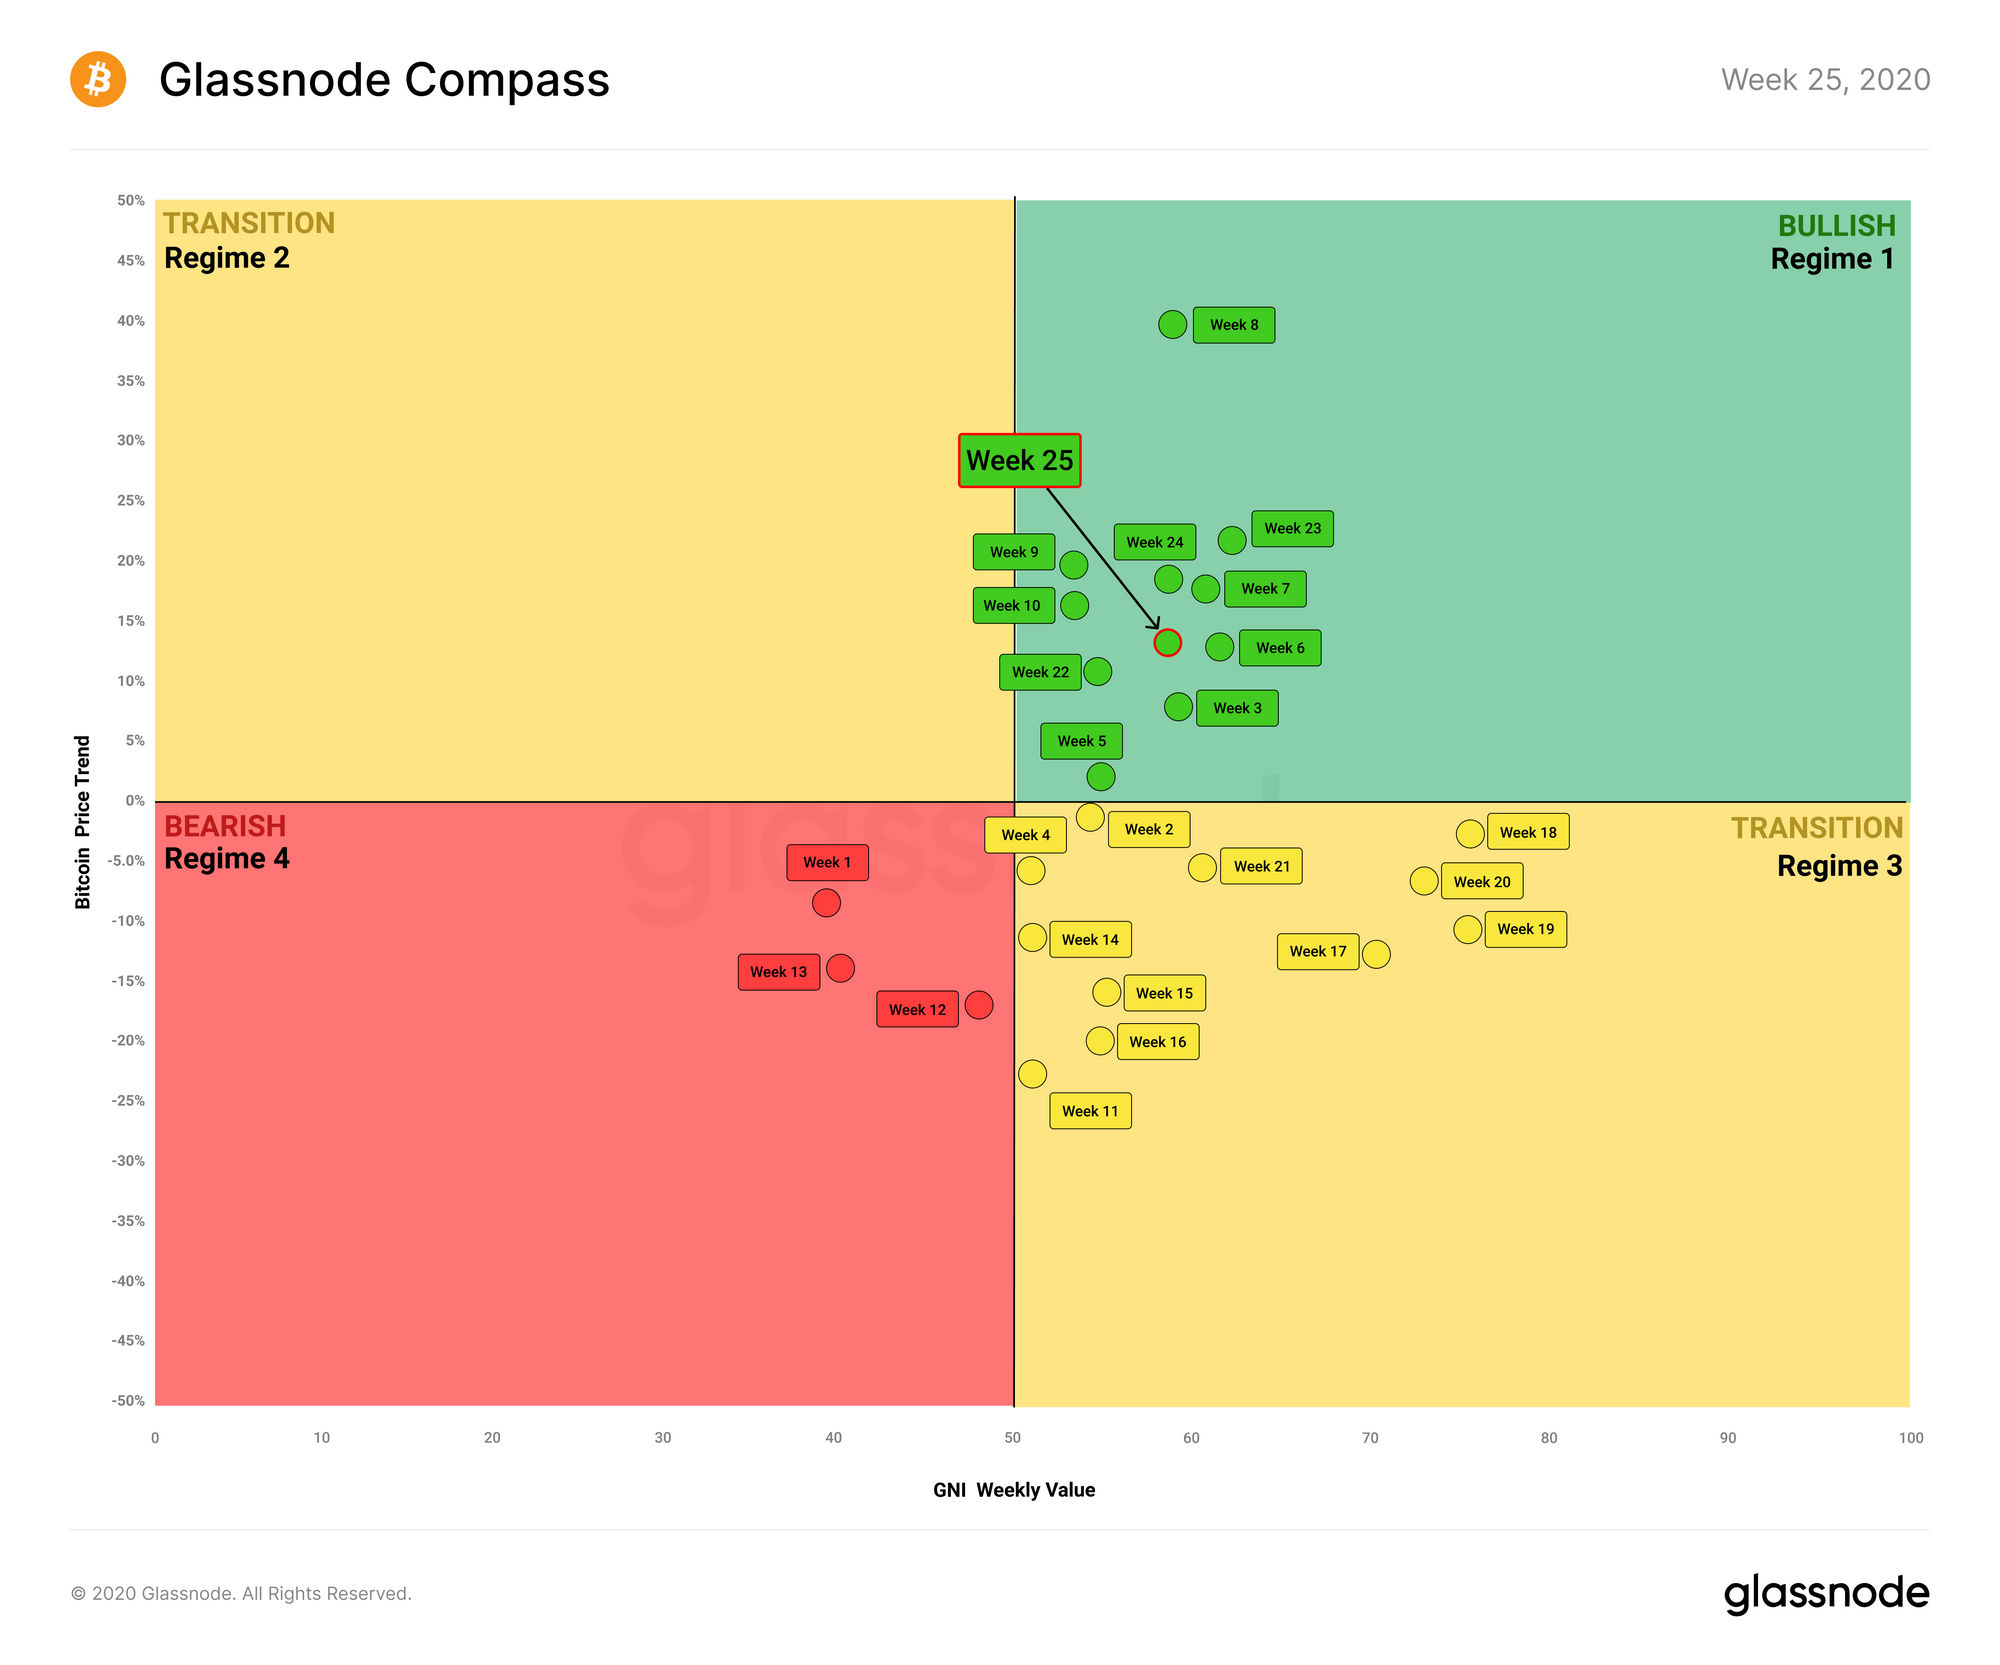
The slight decreases in both GNI and price caused the compass for Week 25 to drop down closer to a bearish position. However, despite the decreases, it still sits firmly in the bullish Regime 1 for the fourth week in a row.
This provides a positive signal for bitcoin, suggesting some stability in on-chain activity as well as off-chain action. Despite healthy activity however, it appears that the market is being held back in terms of upward price movement for the time being. In order to break the $10k mark, the market will need to overcome the psychological barrier that comes with that price level.
Bitcoin's Realized Cap at All-Time High
Bitcoin's Realized Cap is continually hitting all-time highs, having just reached a new high of $106.7b after surpassing its previous high attained just before Black Thursday.
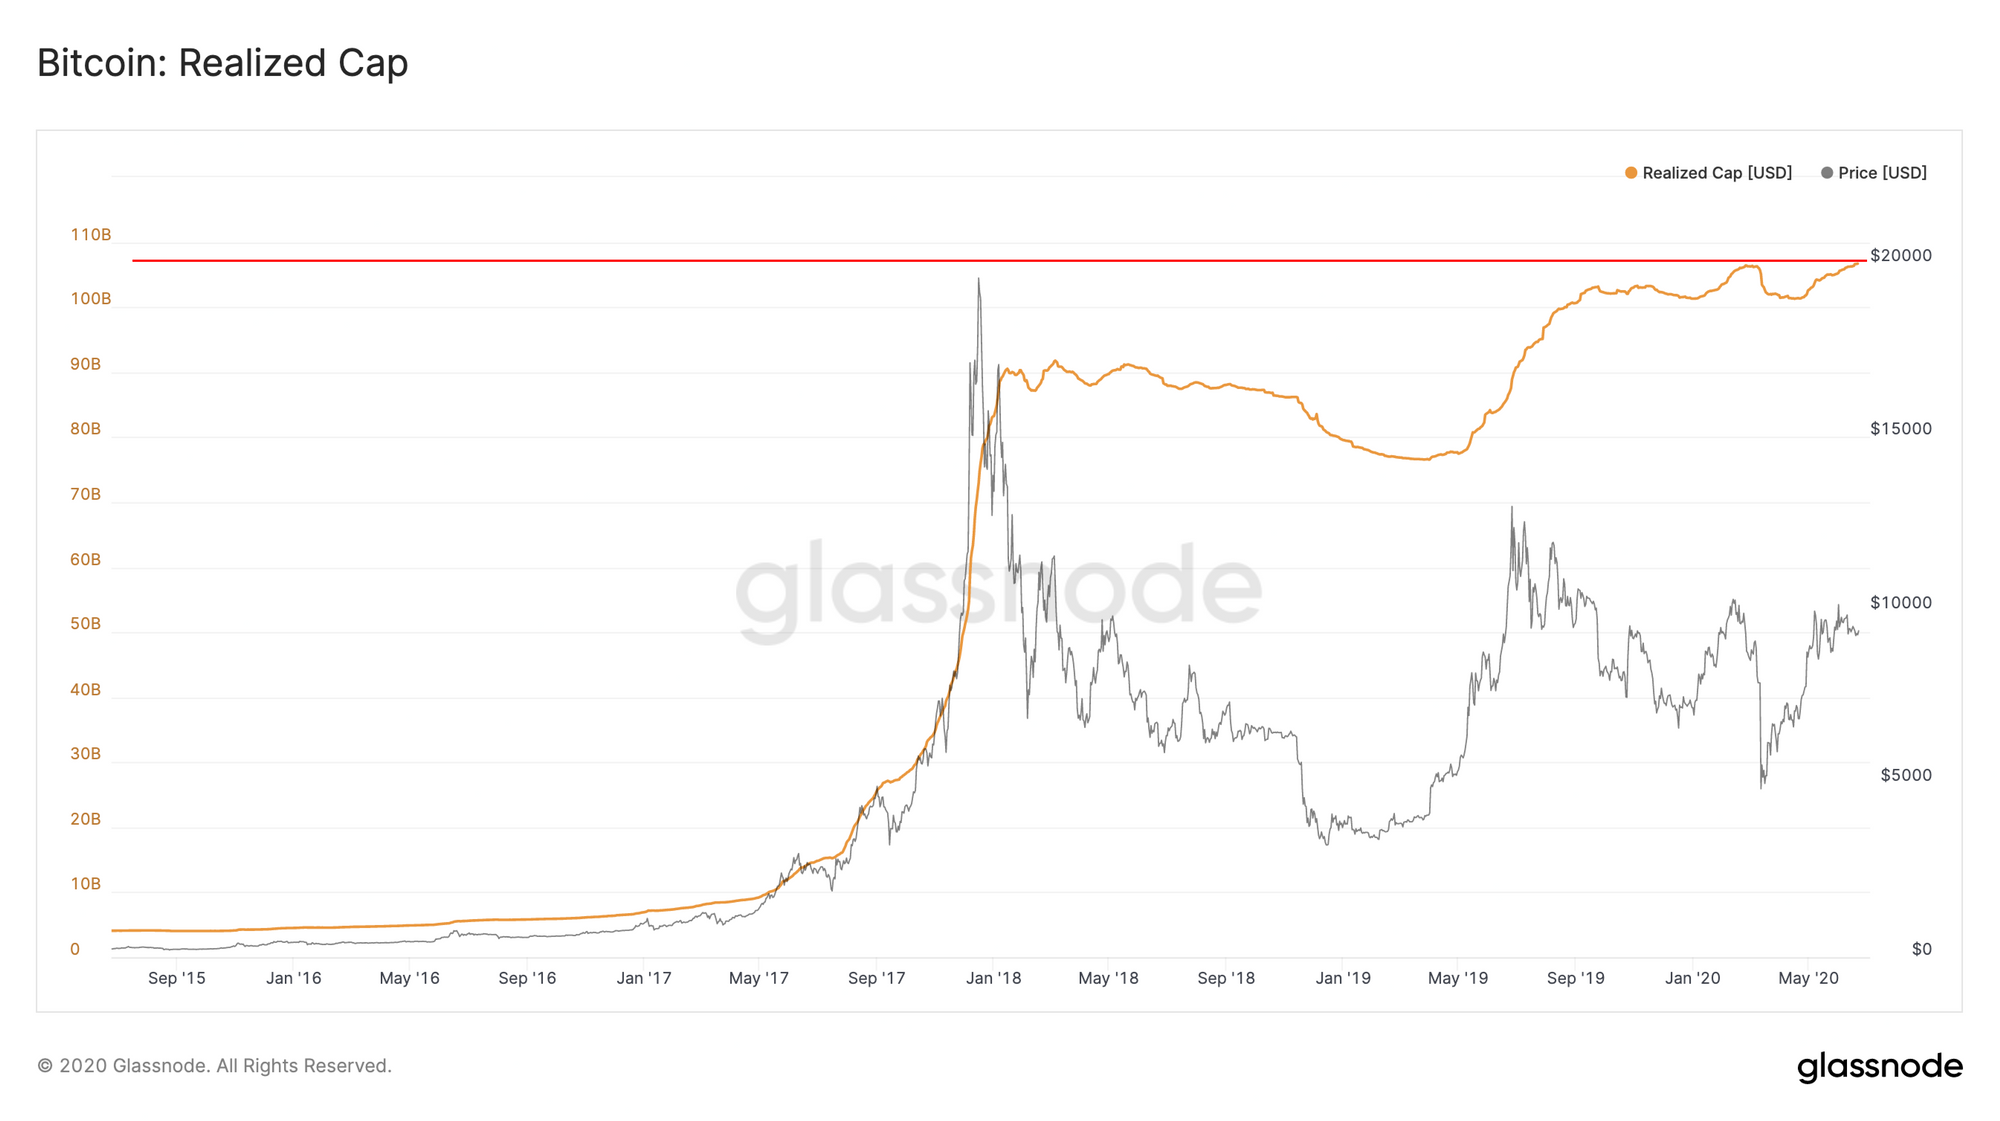
Realized Cap values bitcoins at the price at which they were last moved, in order to discount the value of lost coins and give active coins a more realistic economic weighting. Its high value means that BTC's MVRV Ratio can stay relatively low, despite prices being quite high.
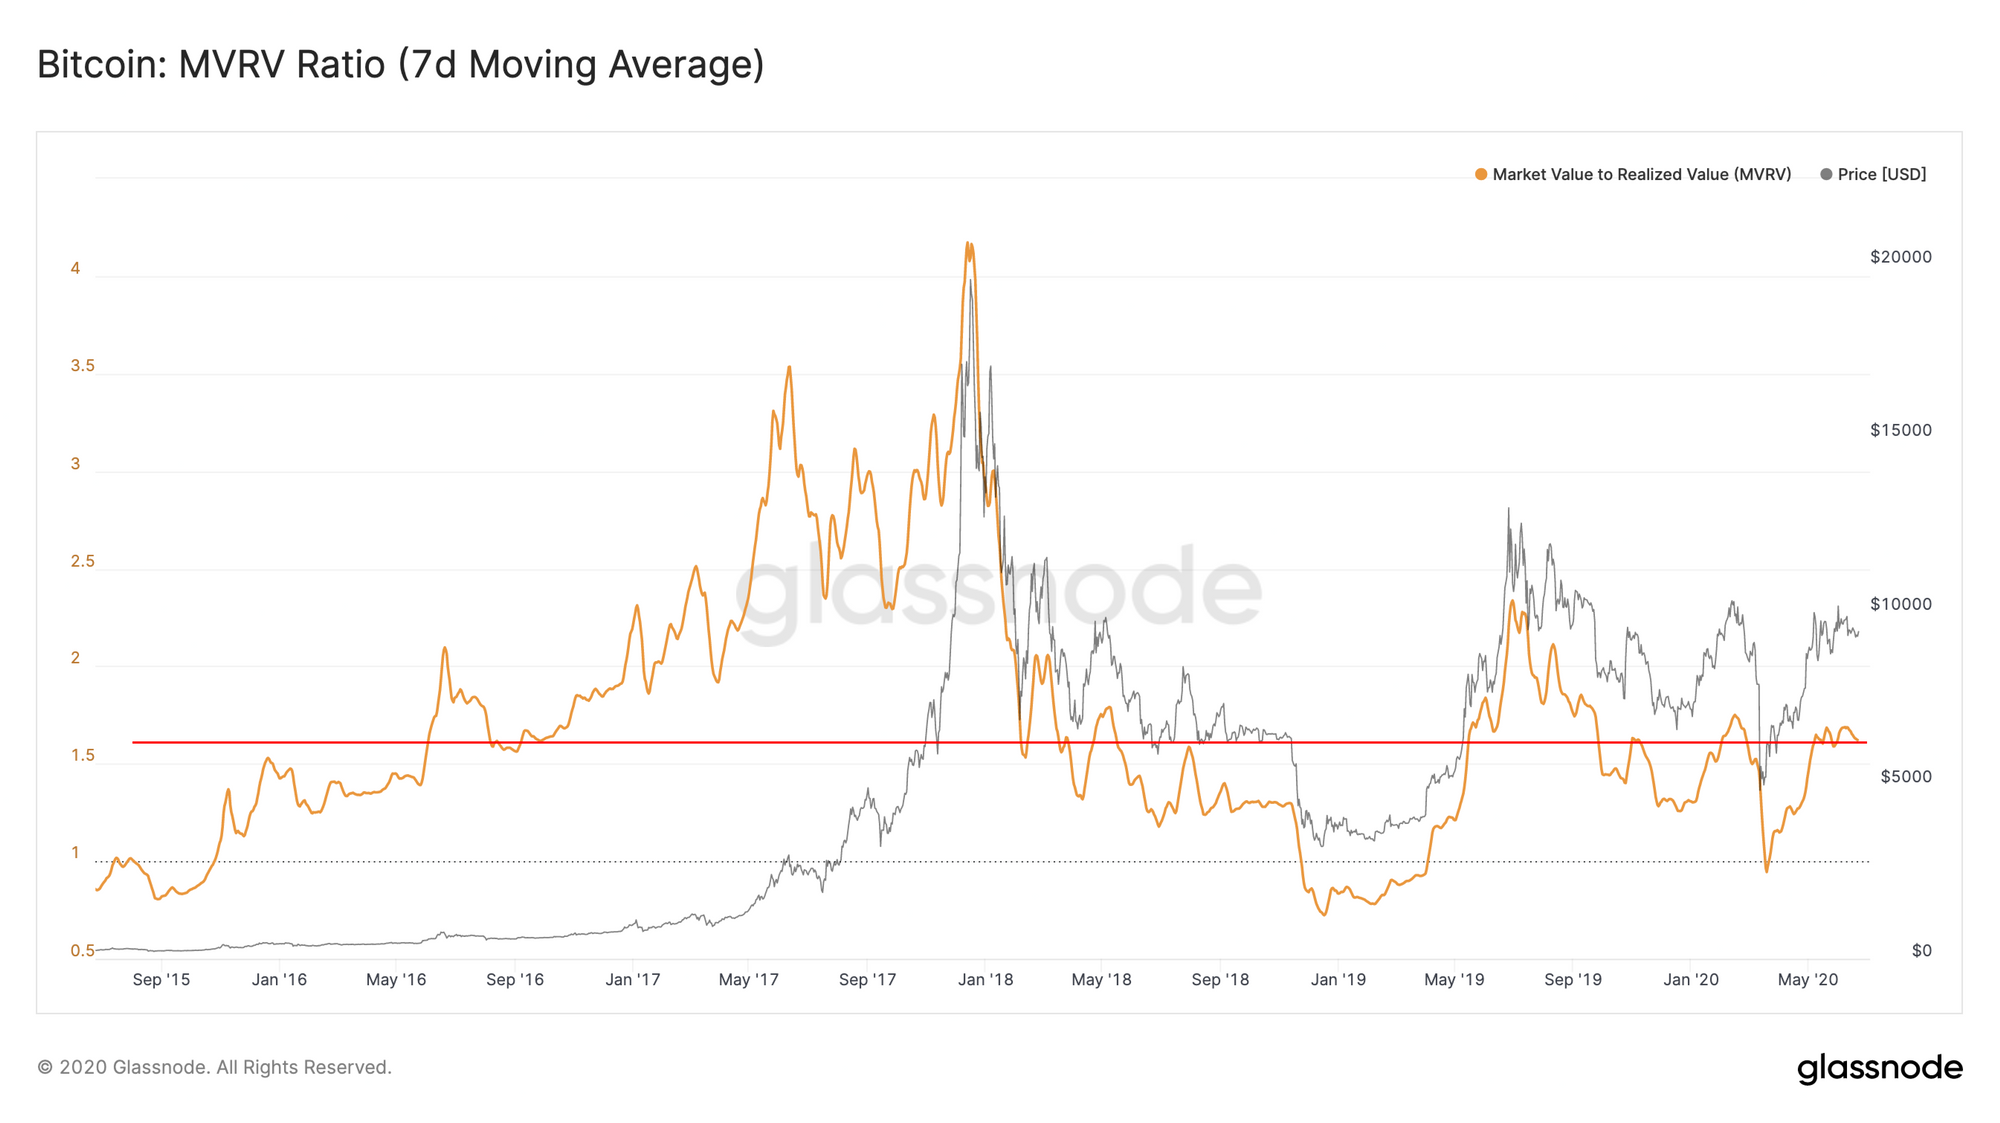
MVRV (the ratio of Market Cap to Realized Cap) shows when BTC is being traded at above or below "fair value" relative to its realized price. When the market value (i.e. price) drops below the realized value, this implies that bitcoin is being traded at below "fair value".
Thus, a consistently high (and growing) Realized Cap means that the price of BTC has more room to grow while still being in the realm of fair value in terms of the actual economic weight of all coins in circulation.
Product Updates
Metrics and Assets
- Addresses in Profit/Loss (BTC, ETH) - New metrics added for Percent Addresses in Profit, Addresses in Profit, and Addresses in Loss.
- Supply Last Active (BTC, BCH) - New metrics for percentage of supply inactive for 1+ years, 2+ years, 3+ years, and 5+ years.
- Exchange metric updates (BTC) - Updated labels to improve accuracy of exchange metrics for Binance, Bitstamp, Bittrex, HitBTC, Huobi, OKEx, Poloniex, and Luno.
Features
- Higher resolution - Added 10 minute resolution for most Tier 2 metrics.

- Follow us and reach out on Twitter
- Join our Telegram channel
- For on–chain metrics and activity graphs, visit Glassnode Studio
- For automated alerts on core on–chain metrics and activity on exchanges, visit our Glassnode Alerts Twitter