The Week On-Chain (Week 50, 2020)
BTC started and ended the past week just above $19k, failing to top its recent ATH. But despite its mostly sideways movement over the past few weeks, on-chain signals remain long-term bullish.


Bitcoin Market Health
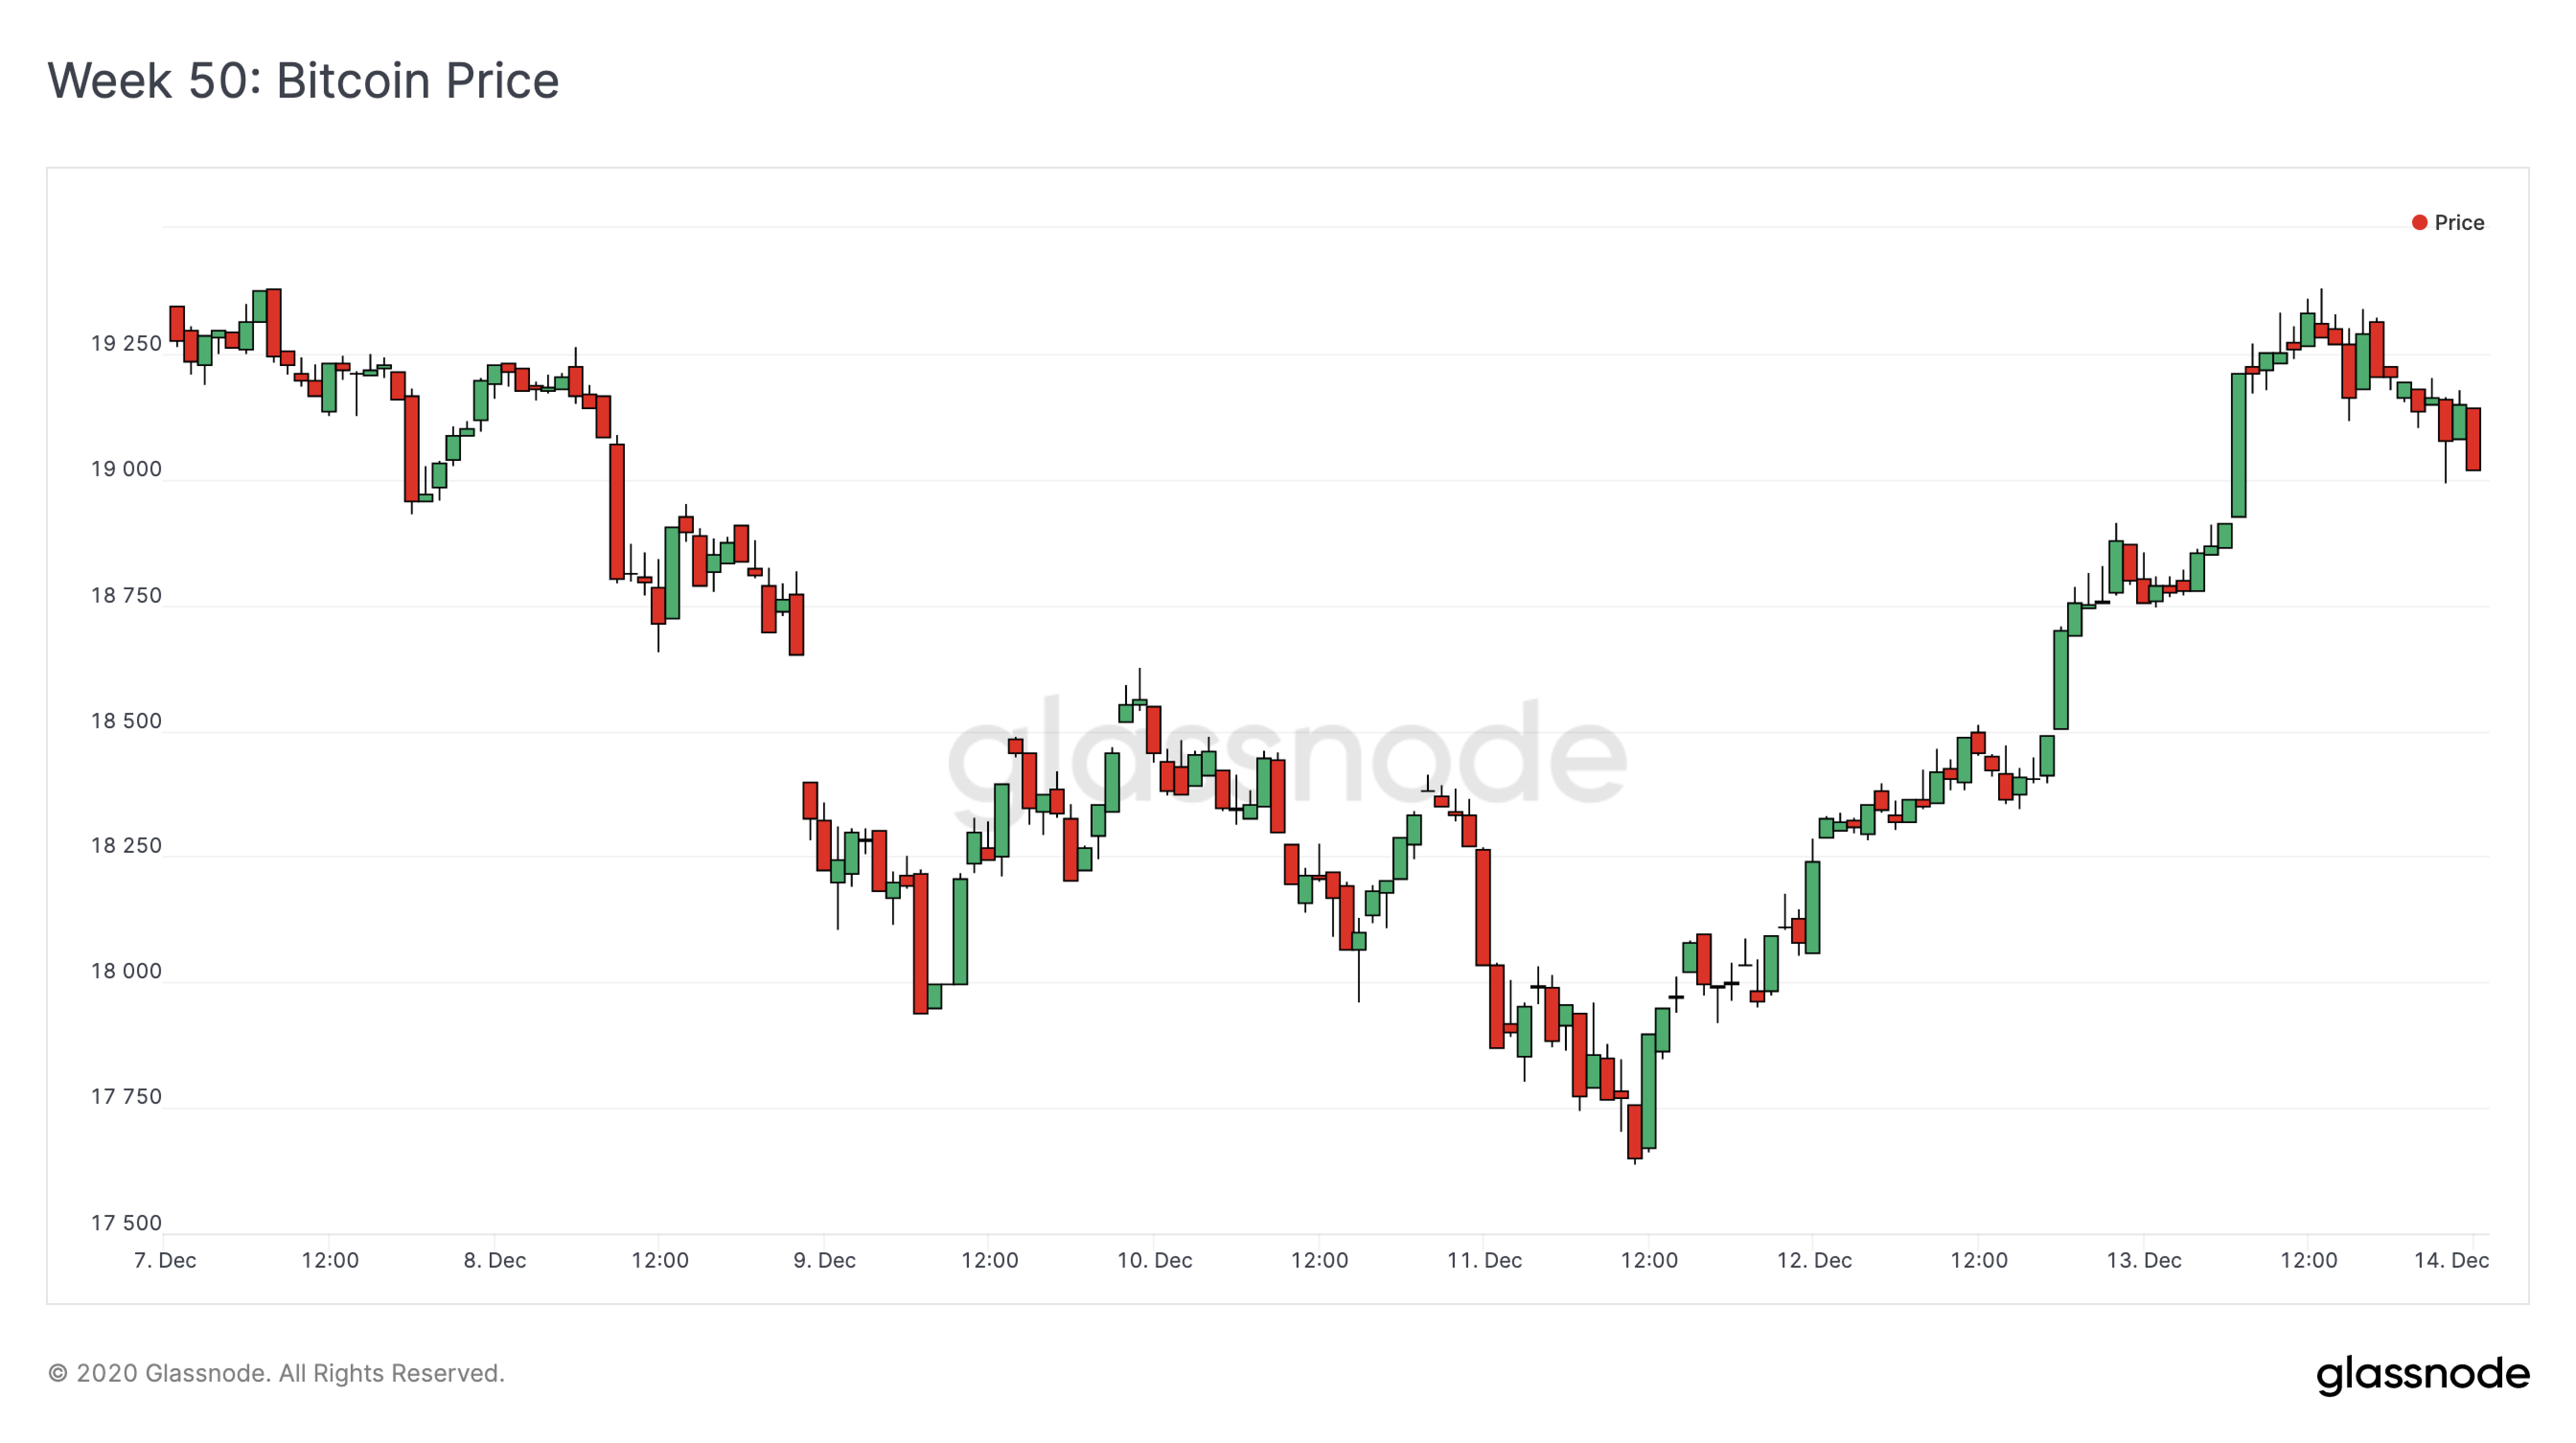
After starting Week 50 at $19,360, BTC started to gradually decline in price, reaching a weekly low of $17,640 on Friday. After this point, though, it quickly began to rebound, ending the week back above $19k at $19,180.
For the Bulls
Bitcoin's Long-Term Holder MVRV Ratio (LTH-MVRV) is currently providing an extremely bullish signal. MVRV is the ratio of market cap to realized cap, and gives an indication of when the traded price of BTC is above or below "fair value"; LTH-MVRV is a variant of this metric that accounts for coins which are at least 155 days old.
When LTH-MVRV reaches the red zone (above 20), this generally indicates a global top. But as we can see in the chart below, bitcoin's LTH-MVRV is still very far from the red zone.
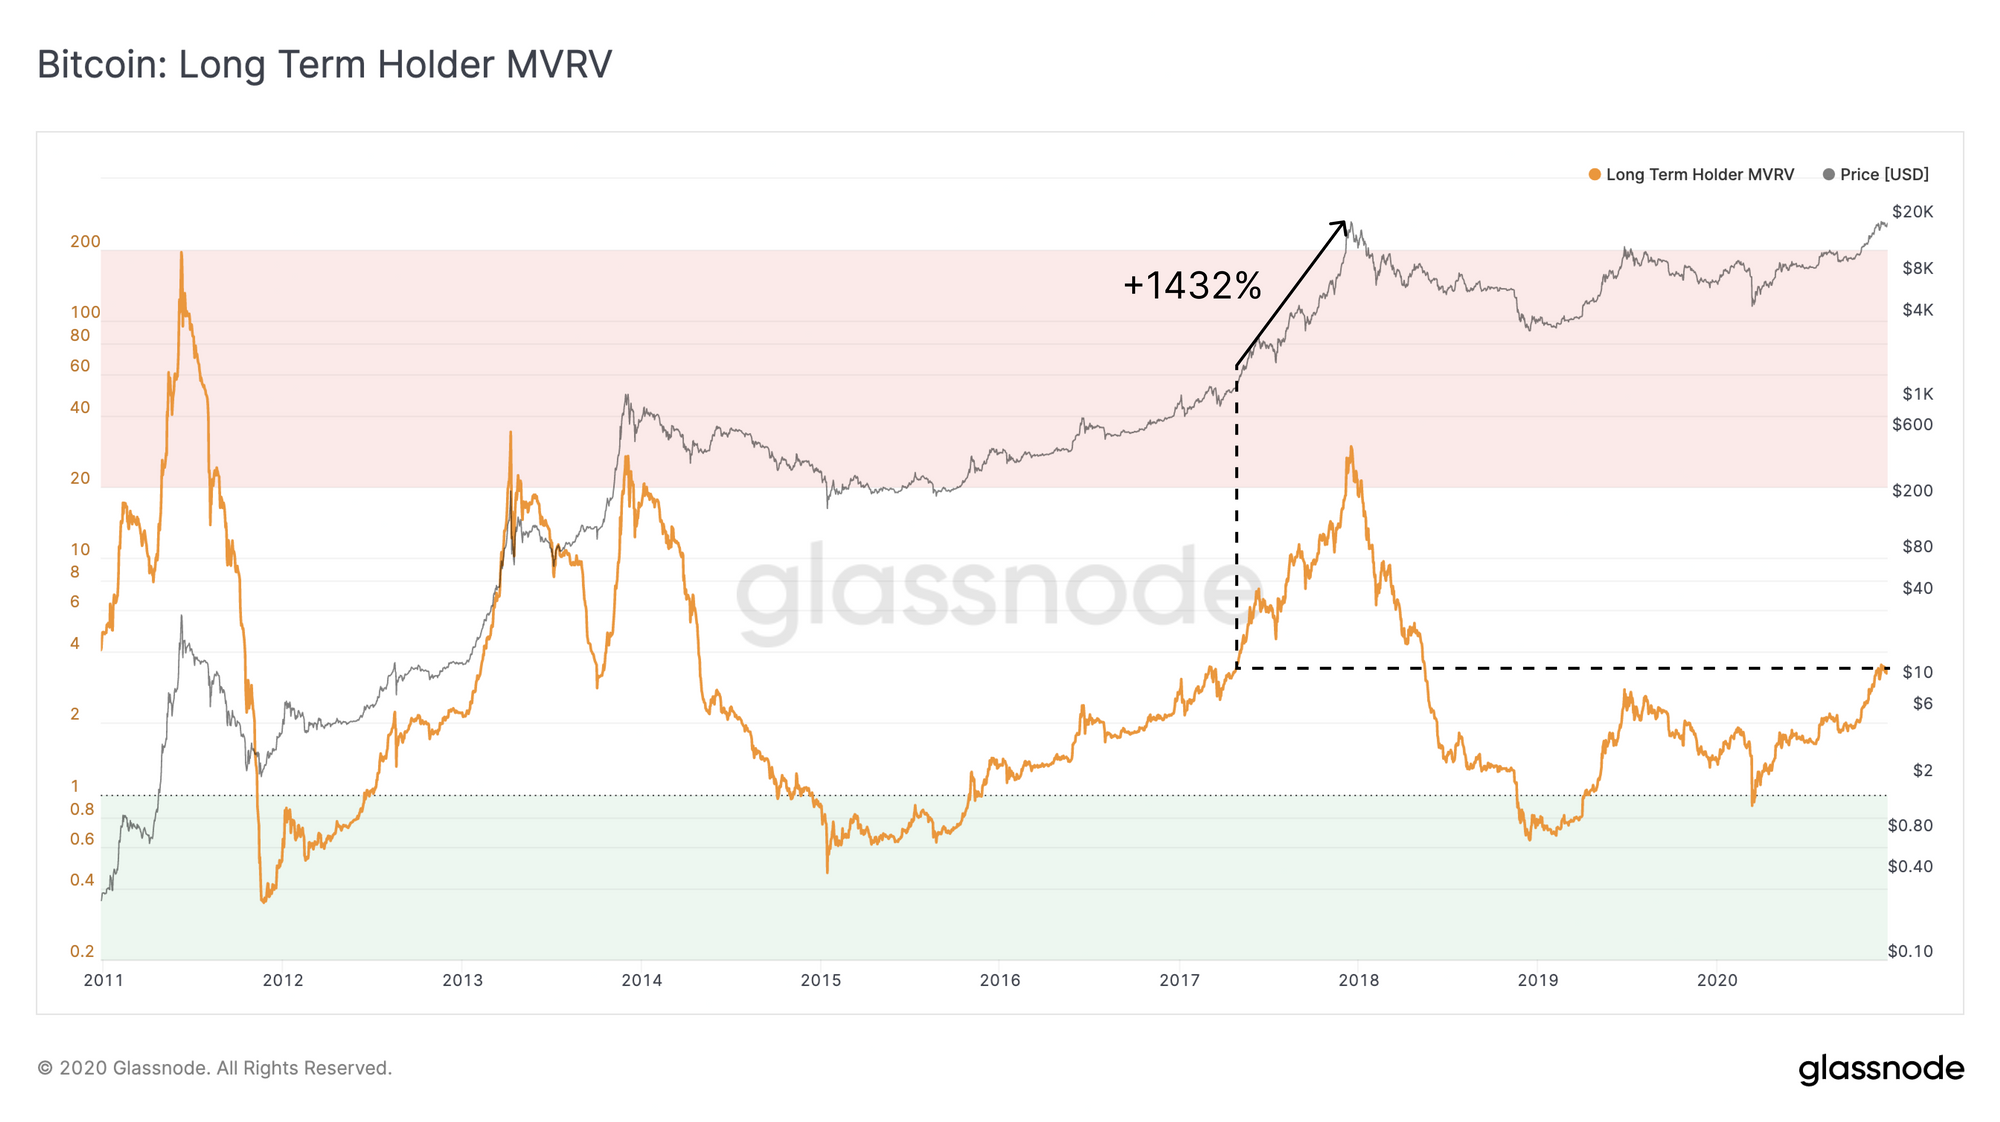
In fact, the last time LTH-MVRV was this low during a bull run, the price of BTC was barely over $1000, and still experienced a 1432% increase before the top. If bitcoin were to follow the same trend again, this would translate to a market top of over $270,000 for this bull market.
For the Bears
Despite overwhelmingly bullish on-chain signals, bitcoin's entity-adjusted SOPR may indicate some short-term bearish sentiment. SOPR shows the extent to which BTC holders are selling at a profit or loss; a value above 1 indicates that sales are on average occurring at a profit, while a value below 1 indicates sales at a loss.
Bitcoin's entity-adjusted SOPR is still comfortably above 1, but it has been declining since late November, indicating that the amount of profit being realized is decreasing, despite price staying relatively consistent during this period.
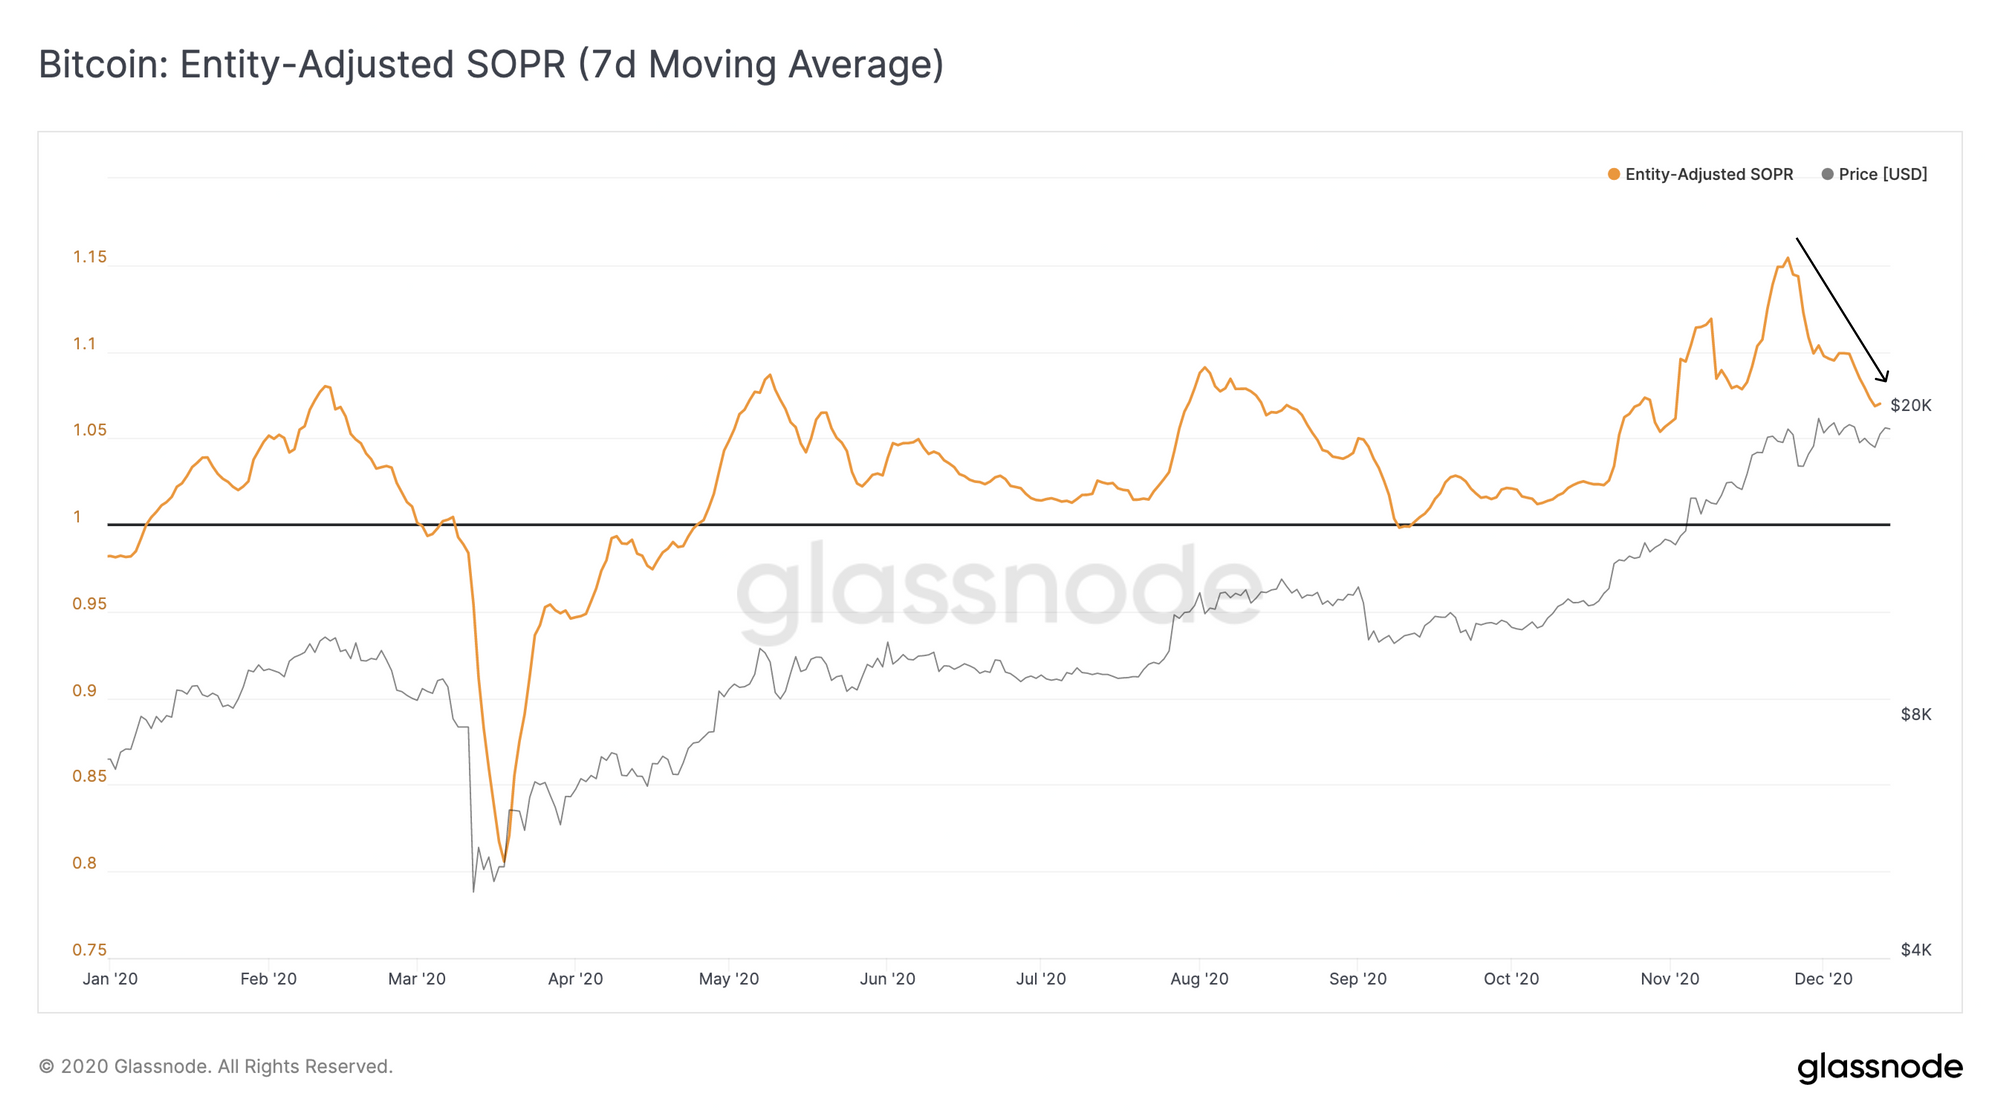
These kinds of dips in SOPR usually indicate micro-bearish sentiment, as sellers are taking less profit. However, historically, these represent more of a shake-out than a trend reversal. In fact, when SOPR declines during a bull market, this usually corresponds with sideways price movement; then, when it approaches or dips below 1, this consistently results in an upwards price correction.
As such, even though SOPR's decline may appear to imply bearish sentiment, it is actually a signal of an approaching upwards trend. Investors should keep an eye on SOPR's decline to identify a potential local bottom before the next bull run.
A Bullish Comment from Willy Woo
Woo's Take: Despite an imminent retrace seeming likely, the greater environment is of continued buyer demand.
While SOPR indicates profit taking is still in process, net flows are once again leaving the exchanges which indicates continued spot buyer demand. This buying pressure will mitigate and any large downside move.
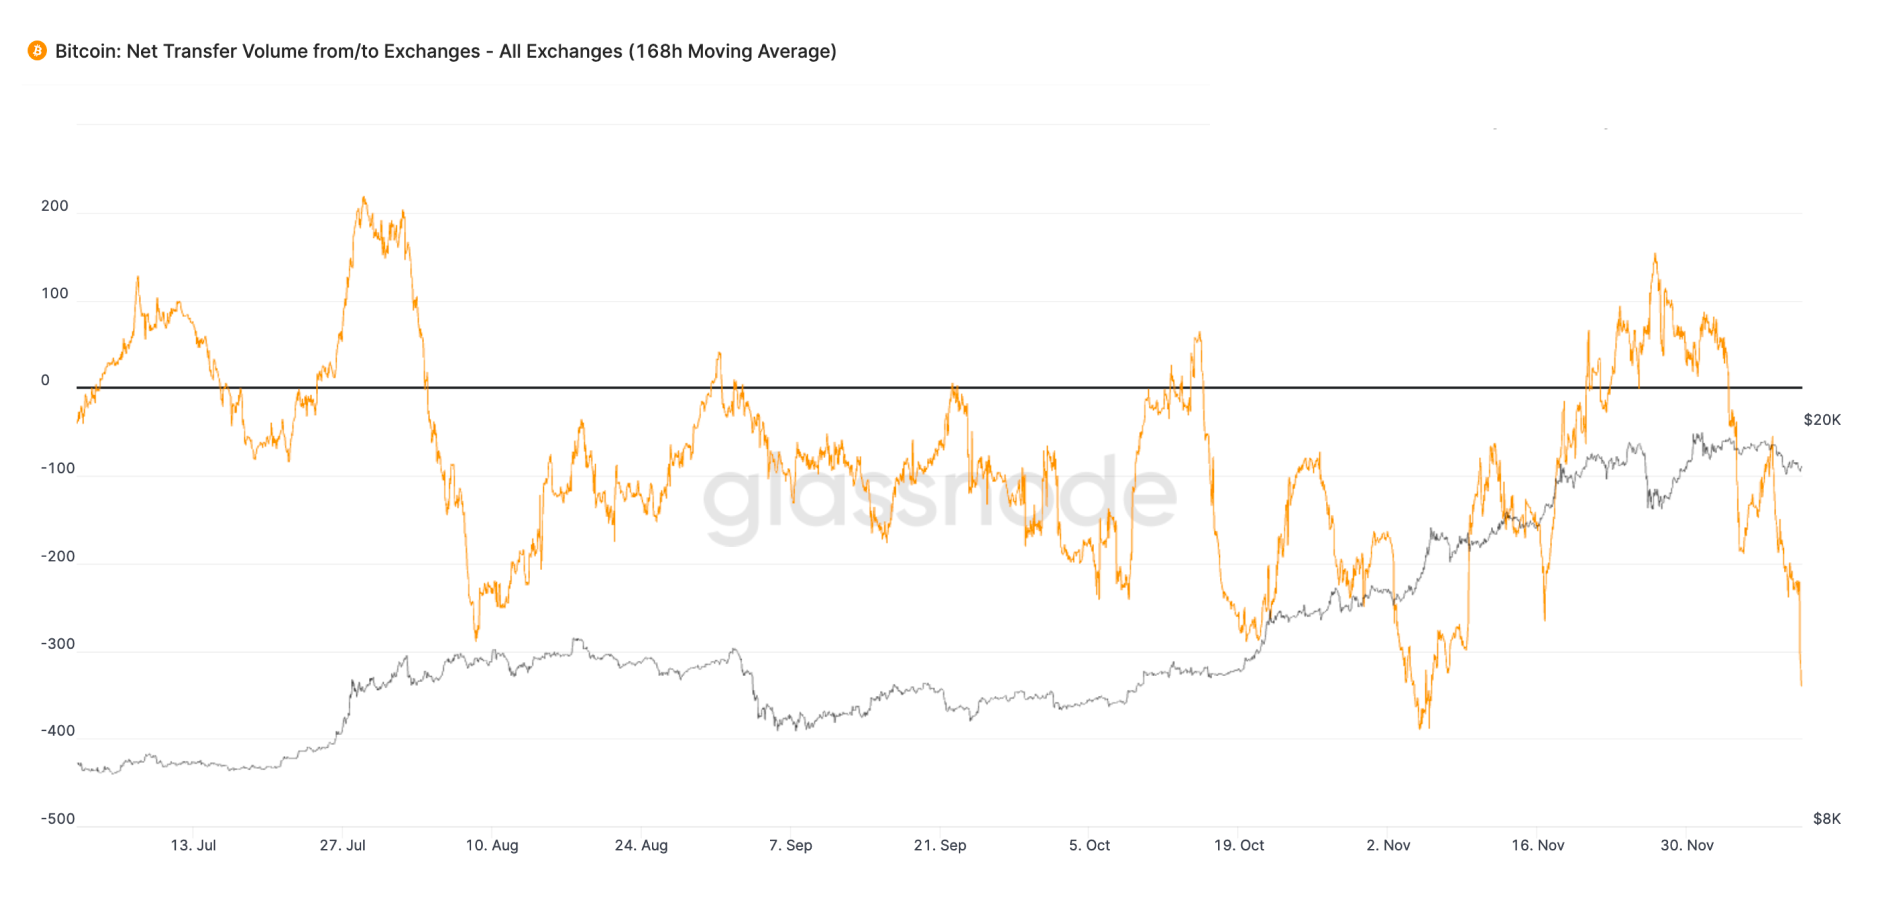
In other words, large pullback targets like $14k even $15.5k which I’ve seen floating around are very unlikely, this would take some bearish changes to the on-chain structure which simply have not developed yet. We are in a solid bullish environment over the medium term environment (next 3 months).
Read more from Willy Woo in his newsletter, The Bitcoin Forecast.
Altcoin Feature: Stablecoin Lockup is Increasing - But So is their Buying Power
After dropping sharply following the end of UNI farming, the supply of stablecoins locked in smart contracts has begun to increase once again over the past few weeks. This new upward trend can be seen across USDC, USDT, and DAI.
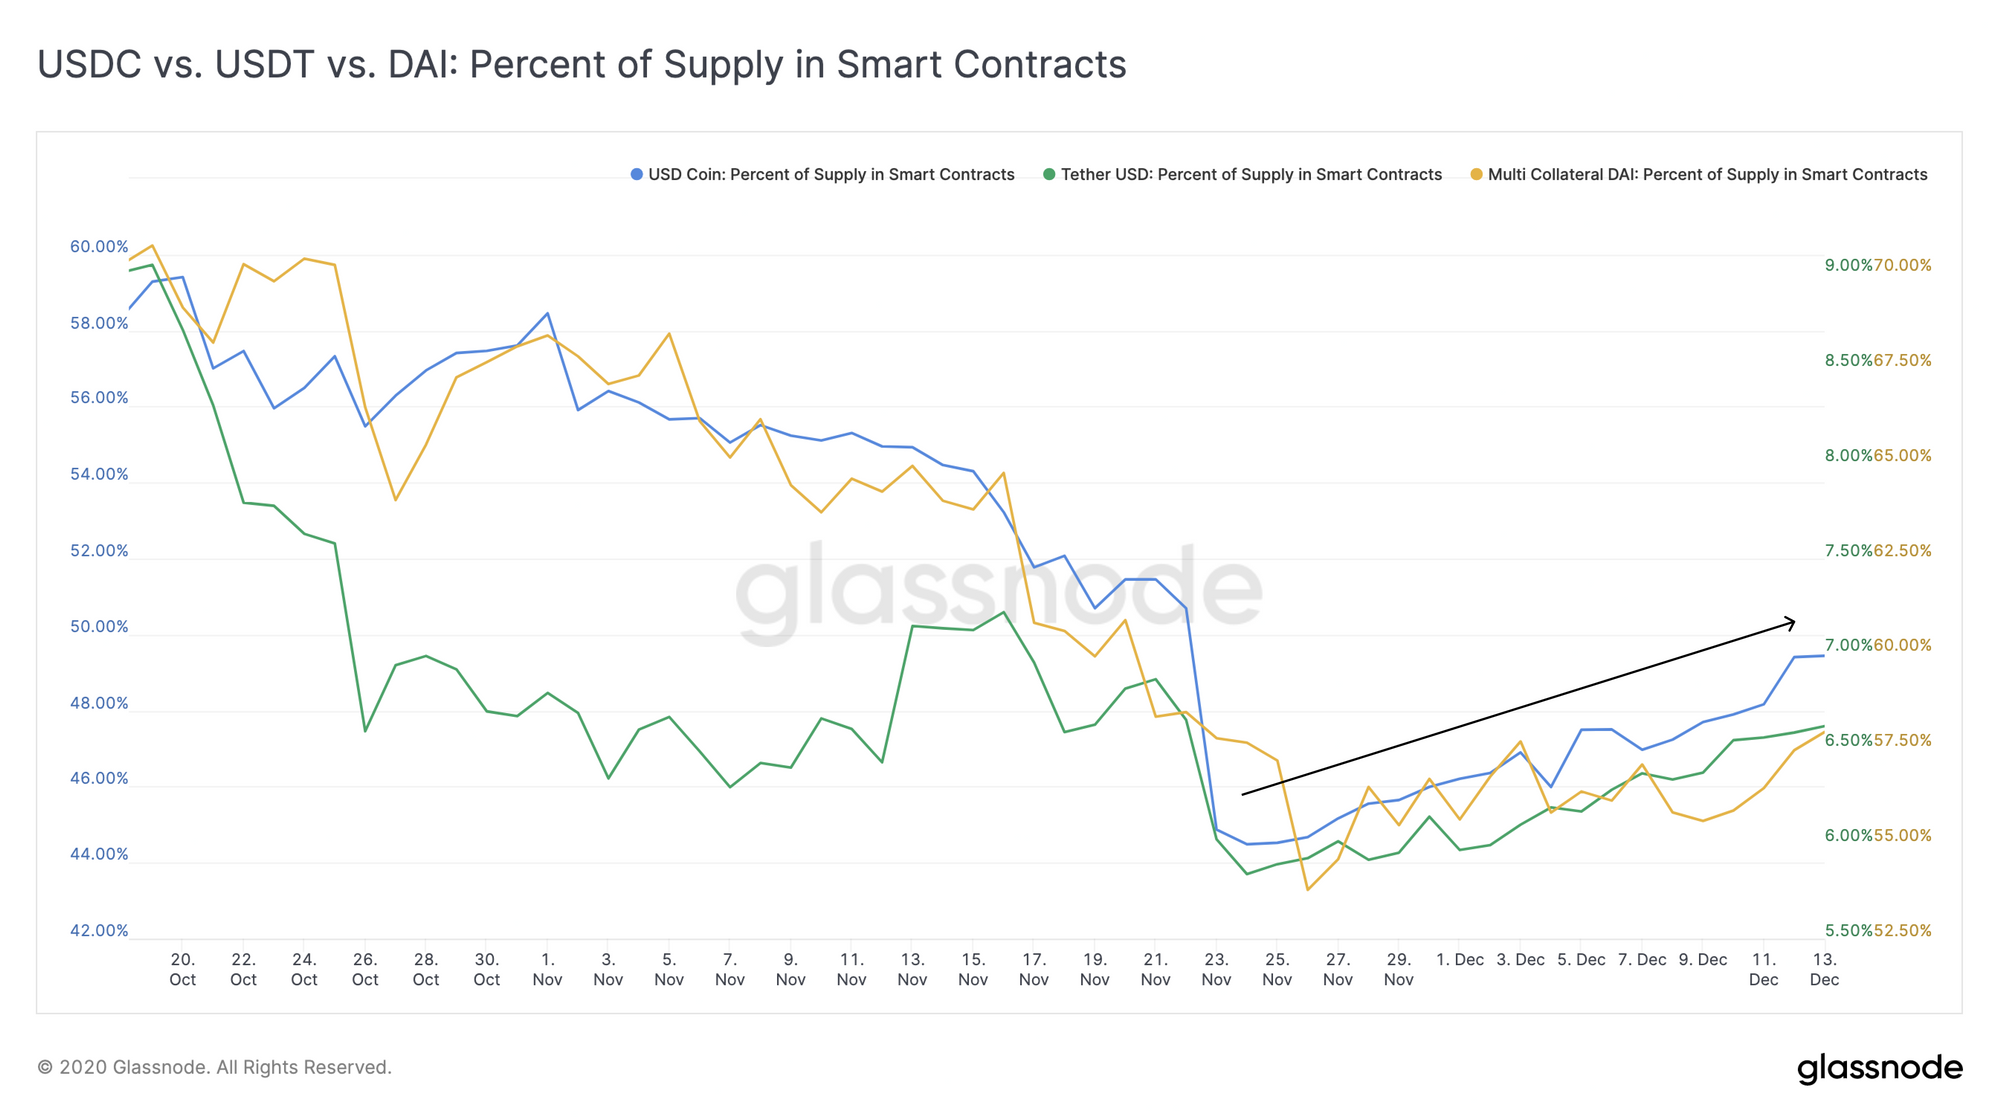
As more stablecoins are locked up - usually for yield farming purposes - the supply available to be moved into non-stable coins (such as BTC and ETH) decreases, lowering the available "buying power" for these assets. However, this effect is countered by the continued large increases in stablecoin supply, which more than makes up for the increase in locked stablecoins.
Using USDC as an example (although this holds true for all major stablecoins), we can see that the increase in total circulating supply outstrips the growth in the supply locked in smart contracts, meaning that the freely available supply of stablecoins is still increasing despite more of them being locked up.
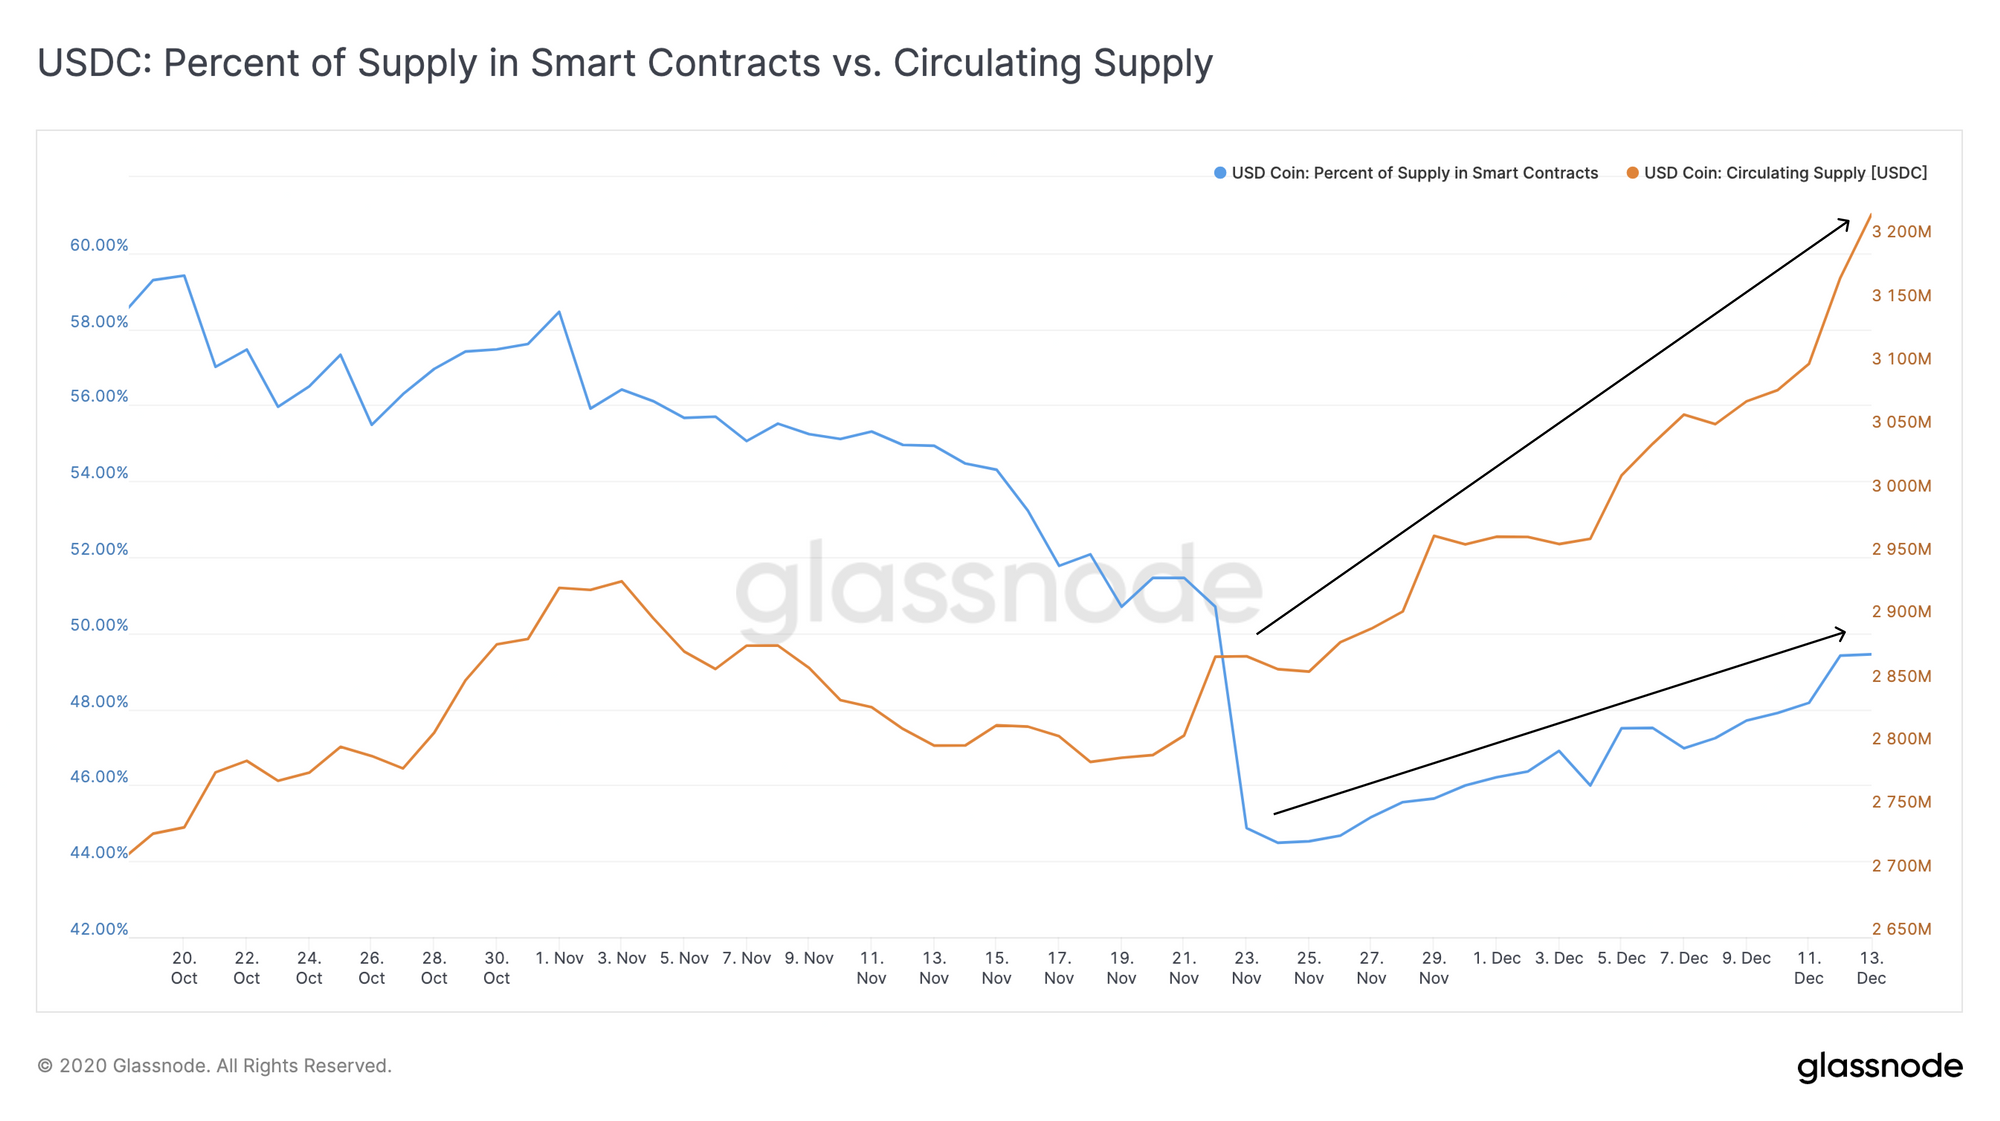
This illustrates that not only is there growth in the DeFi world (which incentivizes the locking up of stablecoins), but there is still even further growth in the number of liquid stablecoins. In other words, the supply of stablecoins available to buy into volatile assets such as BTC and ETH continues to increase, even as DeFi takes up more of the total supply.
This trend is highly bullish, as it signifies growth (and continued growth potential) across both traditional crypto trading and novel forms of yield generation in crypto.
Which altcoins would you like to see us cover in future editions of The Week On-Chain? Let us know on Twitter.
Weekly Feature: Why 10x BTC is Entirely Possible
Last week, our CTO, Rafael Schultze-Kraft, published a Twitter thread outlining why he is "insanely bullish" on BTC. Looking at some core on-chain metrics, he explains why "we could see more than 10x BTC from here".
Note that this does not represent Glassnode's official stance, and is not financial advice - but it is a compelling analysis nonetheless.
1/ Where are we in the #Bitcoin market cycle?
— Rafael Schultze-Kraft (@n3ocortex) December 8, 2020
A look at some of the most important on-chain market indicators.
TLDR: Insanely bullish, most metrics are far from the top. If things develop anything like 2017, we could see more than 10x $BTC from here.
A THREAD 👇 pic.twitter.com/d1jU0h5fxA
The thread covers important on-chain metrics such as MVRV, NUPL, and Reserve Risk, noting that their values are well below the points reached at previous market tops. This suggests that BTC has plenty of room to grow before becoming overvalued, supporting the narrative that the current bull market is still in its early stages.
Check out the full thread to dive deeper, and follow Glassnode on Twitter for more analyses like this one.
Product Updates
Metrics and Assets
- Futures Liquidations (BTC, ETH) - Total Long Liquidations, Mean Long Liquidations, Total Short Liquidations, Mean Short Liquidations.

- Lesen Sie diesen Artikel jetzt auf Deutsch bei unserem offiziellen Partner Bitcoin2Go
- Follow us and reach out on Twitter
- Join our Telegram channel
- For on–chain metrics and activity graphs, visit Glassnode Studio
- For automated alerts on core on–chain metrics and activity on exchanges, visit our Glassnode Alerts Twitter