A Short History of the Etherverse
We deep dive into Ethereum's most prominent use cases by quantifying gas consumption across major token, protocol, and transaction categories. Our analysis shines a light on the complexity and ever-evolving nature of the Ethereum ecosystem.


It's been two years since our last research piece on the Ethereum ecosystem from the gas market perspective – a long time in this turbulent and fast-evolving industry. Entirely new use cases have emerged since, and for existing ones, new protocols have come to existence and gained market share. This follow-up article is long overdue, and coincides with the release of a new suite of Ethereum activity breakdown metrics in Glassnode Studio. We can't wait to see what insights will be discovered by the community – meanwhile, let us share ours.
New Metrics Released
This suite of new Ethereum breakdown metrics are now available in Glassnode Studio:
– Pre-Set Dashboard Exploring the Etherverse
– Transaction Type Breakdown (Relative)
– Transaction Type Breakdown (Absolute)
– Gas Usage by Transaction Type (Absolute)
– Gas Usage by Transaction Type (Relative)
Motivation and Methodology
Ethereum is a permissionless platform, and as such, doesn't have an inherent purpose that is enforceable. In any meaningful sense, a permissionless platform is defined empirically by its usage. Therefore, understanding Ethereum starts with a purely descriptive task – observing what it is being used for.
We argue that the best measurement tool for usage is the relative amount of gas used by activity type. While it's less intuitive than transaction count, this approach is rooted in Ethereum’s design itself:
- The throughput of the Ethereum platform is limited in units of gas available per block. As use cases compete for the scarce block space, the winner is determined by the ability to provide sufficiently high fees, and the losers are effectively priced out of the platform.
- As gas market is very competitive, gas expenditure is indicative of the user demand and the economic value assigned by users to a specific use case or a protocol. Note that the declining gas share might still represent increased spending in fiat or Ether terms, and vice versa – for this, you might need to refer to the corresponding absolute fee values in Glassnode Studio. We are only focusing on gas share within this article, as our goal is to compare the relative prevalence of use cases within the Ethereum ecosystem.
- We selected gas share in preference to transaction count as it represents a true economic expense by the user, and is thus harder to manipulate. Transaction counts are easier to artificially inflate, especially in periods of lower network congestion.
There are two types of accounts on the Ethereum platform: externally owned accounts (EOA), controlled by private keys, and contract accounts, controlled by their contract code. We’ve made a conscious decision to attribute all gas within a transaction to the initial contract call by EOA, as it represents user-driven demand. Accounting for internal transactions would paint a different, yet correlated picture.
Overview
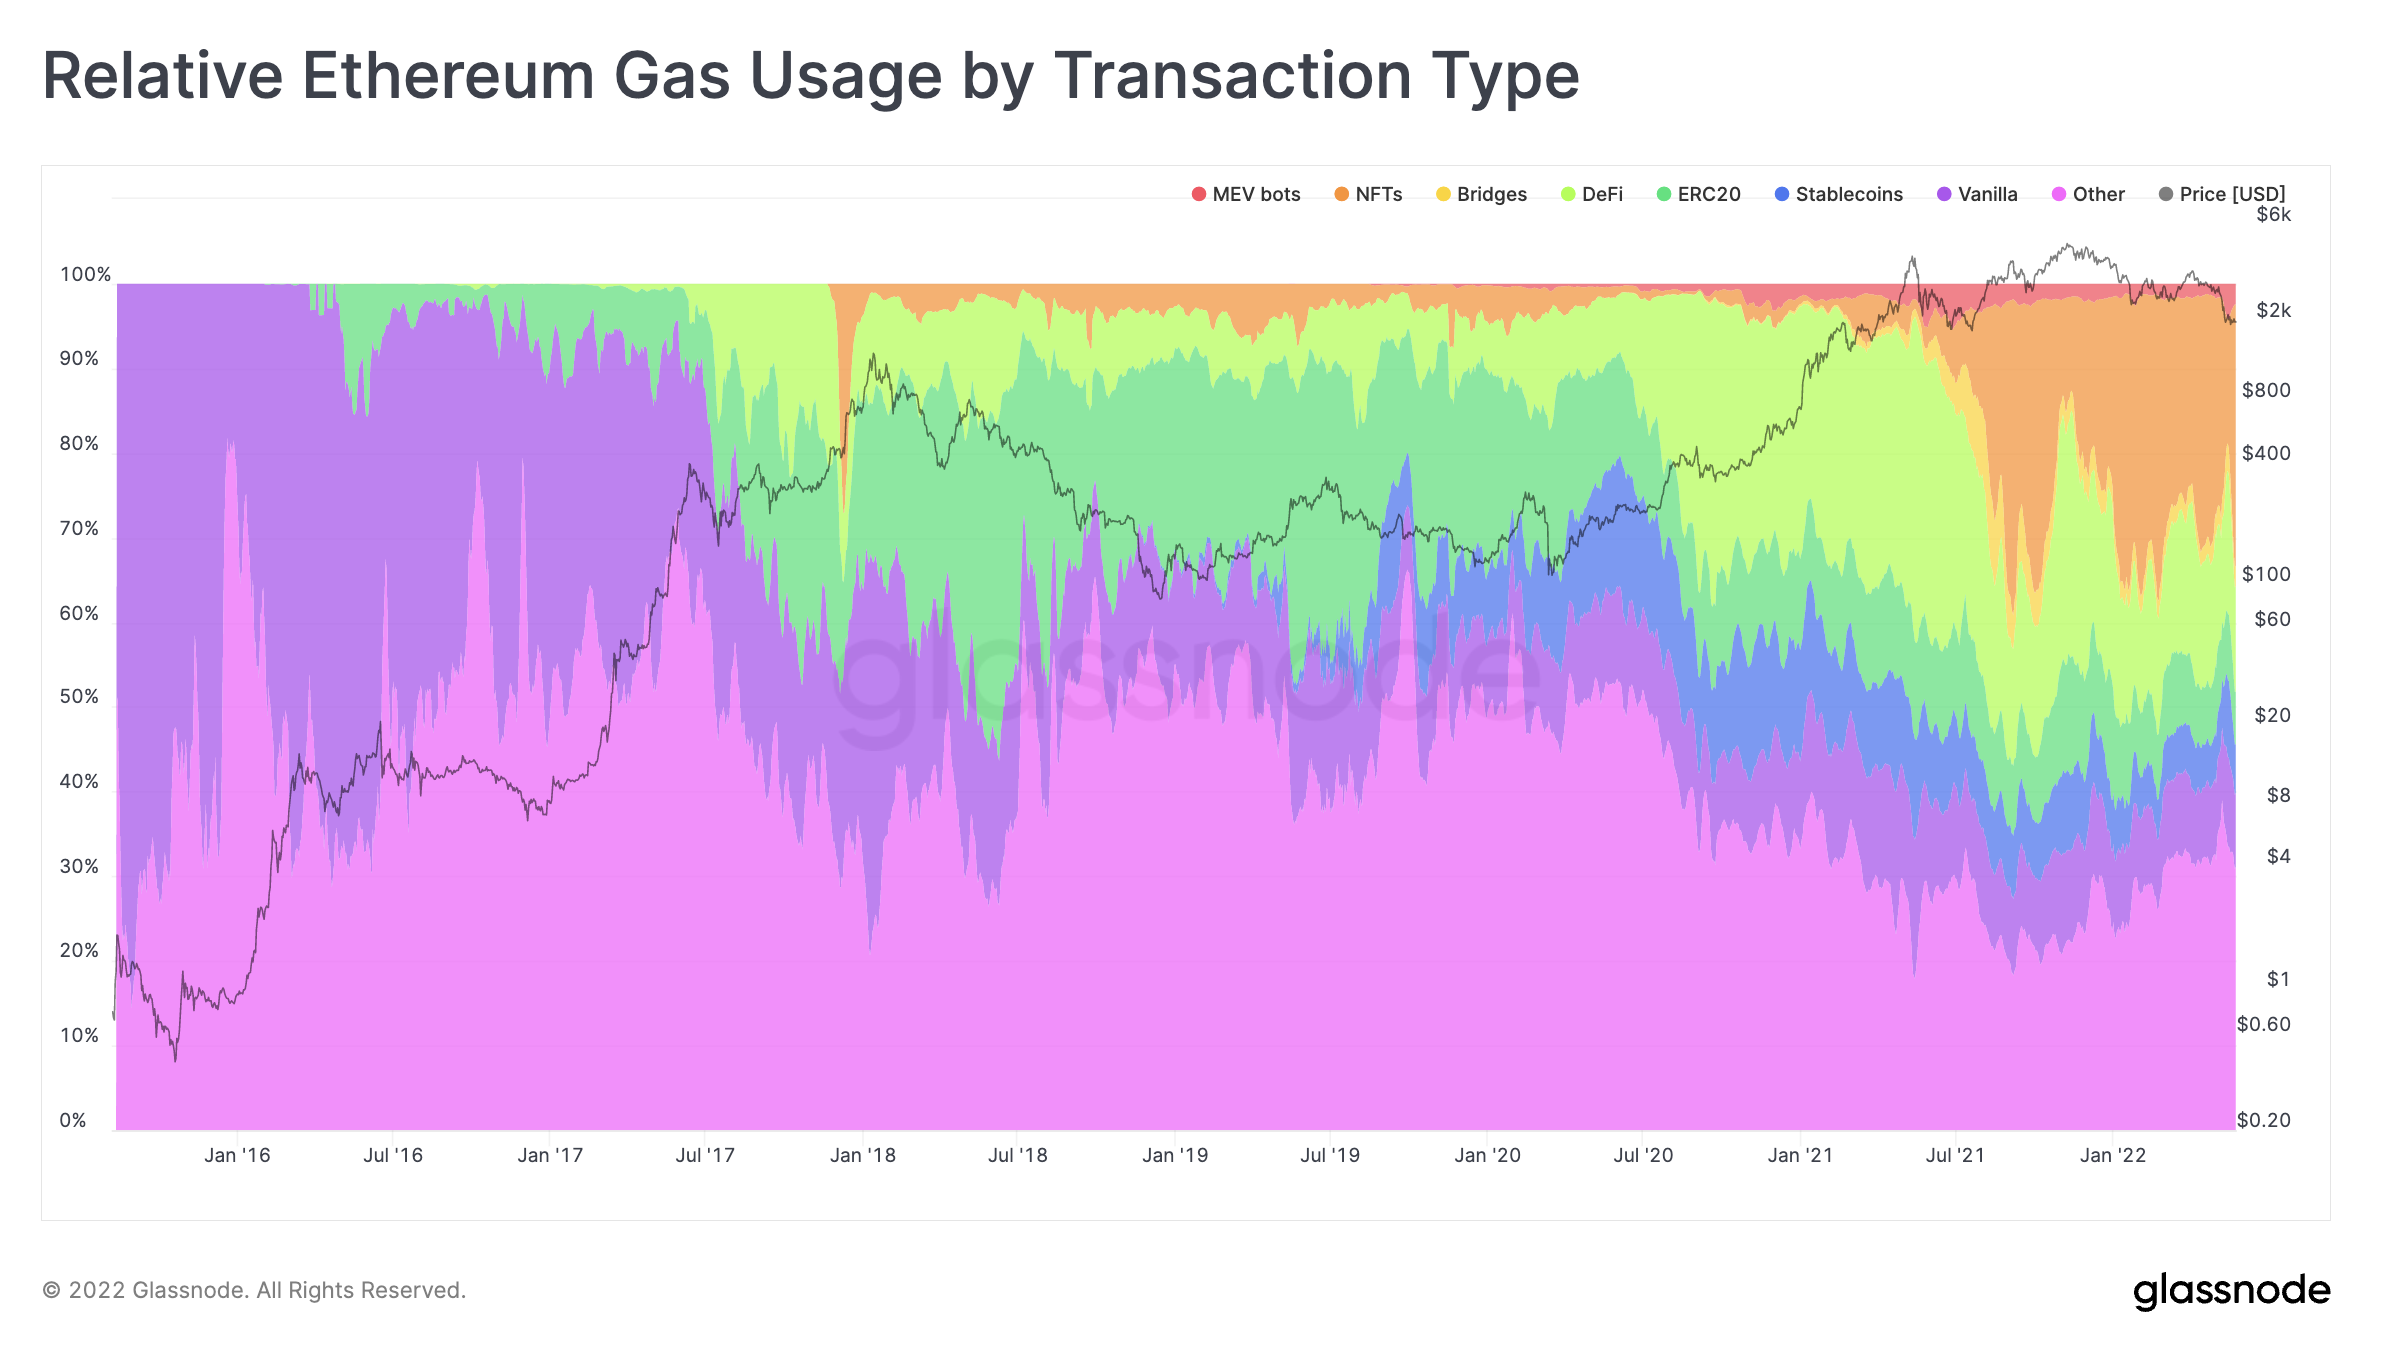
We start with a comprehensive overview over Ethereum's history. Figure 1 illustrates the relative gas usage across all transactions ever recorded on the Ethereum blockchain, broken down into the most dominant use cases. Seven different categories were significant enough to deserve representation, with two of them (Bridges, MEV bots) only reaching prominence in the last year:
- Vanilla: Pure Ether transfers between EOAs, with no contract being called.
- Stablecoins: Fungible tokens that have their value pegged to an off-chain asset, either by the issuer or by an algorithm. The majority of them are pegged to USD. We include 150+ stablecoins in this category, with USDT, USDC, UST, BUSD, and DAI being the most prominent ones.
- ERC20: In scope of this article, we included all ERC20 contracts that aren’t stablecoins in this category.
- DeFi: On-chain financial instruments and protocols implemented as smart contracts, generally without traditional intermediaries. Most popular of them currently are decentralized exchanges (DEXs), the peer-to-peer platforms for trading tokens. We include over 90+ DeFi protocols in this category, such as Uniswap, Etherdelta, 1inch, Sushiswap, Aave, and 0x.
- Bridges: Contracts allowing transfer of tokens between different blockchains. We include 50+ bridges in this category, such as Ronin, Polygon, Optimism, and Arbitrum.
- NFTs: Uniquely identifiable pieces of data that can be owned and transferred on-chain. This category includes of both token contract standards (ERC721, ERC1155), as well as NFT marketplaces (OpenSea, LooksRare, Rarible, SuperRare) for trading those.
- MEV Bots: Miner Extractable Value (MEV) bots execute transactions for profit by reordering, inserting, and censoring transactions within blocks.
- Other: This category includes all transactions not included in categories listed above. Examples include multi-signature contracts of exchanges, centralized lending platforms, and gambling sites.
Qualitatively, today’s usage distribution is much different compared to two years ago, with each category mentioned above having dramatic changes in share. We believe this highlights the evolving nature of the platform and the dynamic research framework needed to evaluate it – approaching Ethereum in 2022 as if it was Ethereum of 2019 would clearly be misguided. As the data suggests, there are no signs of stabilization either - we fully expect Ethereum of 2024 to be used quite differently from today. In the following, we’ll look at each one of seven components in greater details.
Vanilla
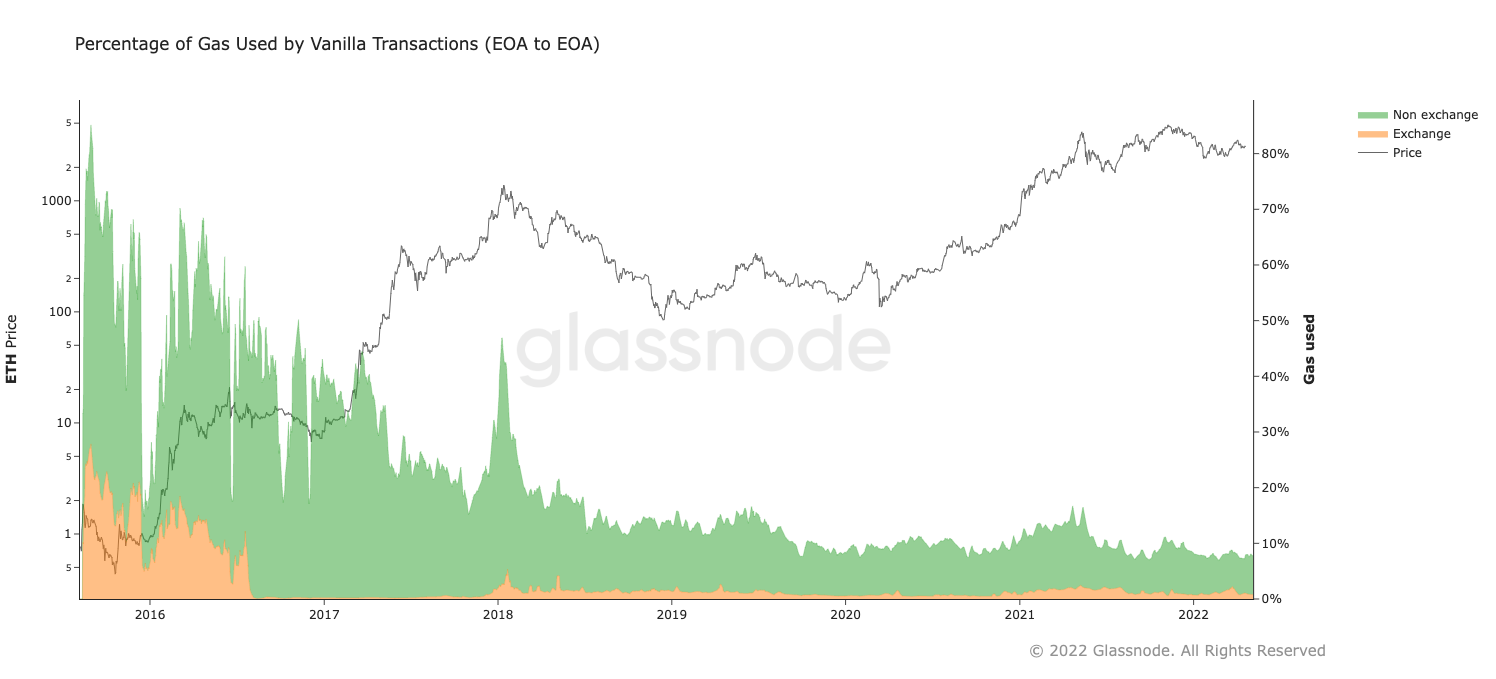
Conceptually, vanilla transfers represent Ether being used as a currency. From a gas consumption perspective, this use case declined from being the most dominant one in the early days (80% of gas in 2015), to ~10% range in the last two years. In other words: empirically, Ethereum is not primarily – or even prominently – used to transfer ETH between users.
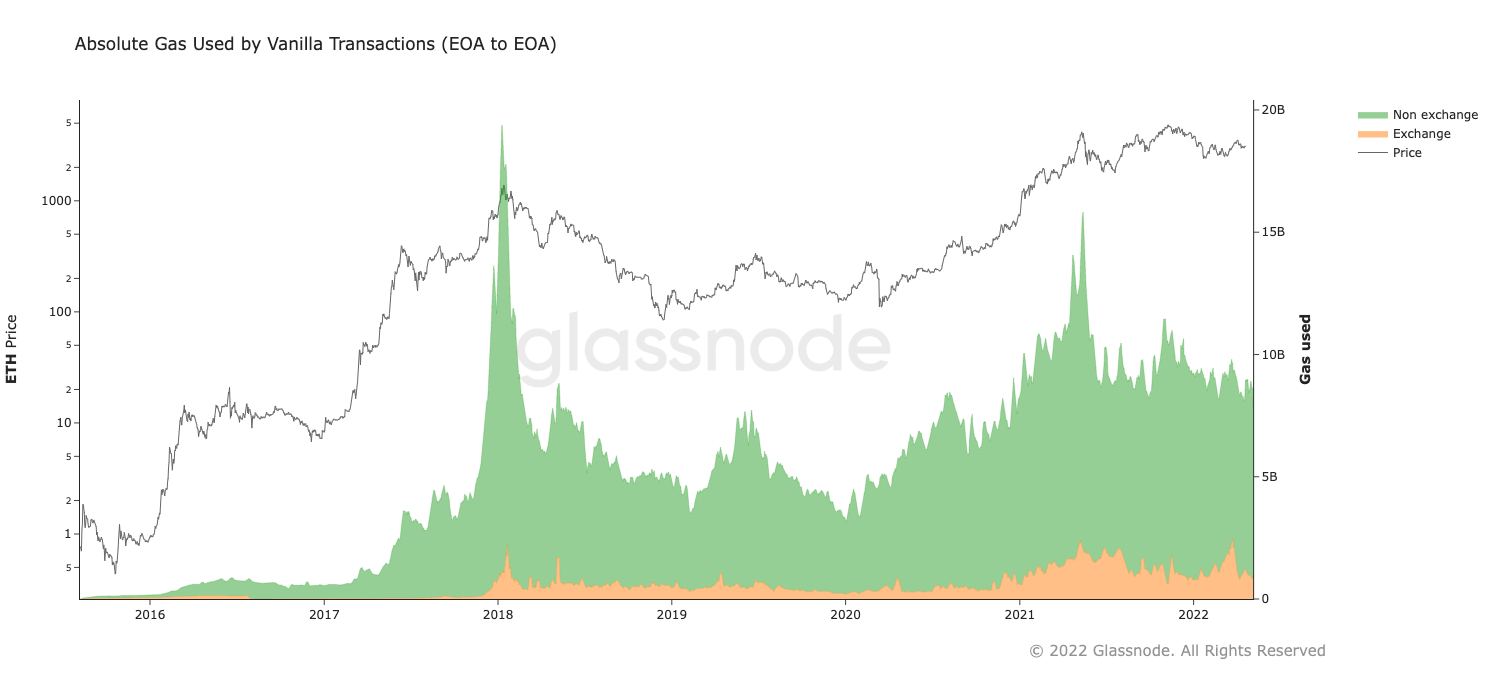
It would be wrong, however, to assume that Ethereum blockchain records less Ether transactions now than it did in 2016. The reason for that is gas limits being raised multiple times over the history. When Ethereum first launched in 2015, the gas limit used to be 5000 units of gas per block. It since grew gradually towards 15 million target block limit – and can go twice as high during network congestion periods after the London Upgrade. So, while the relative importance of Ether transfers went down over time, the absolute throughput went up many orders of magnitude.
Stablecoins
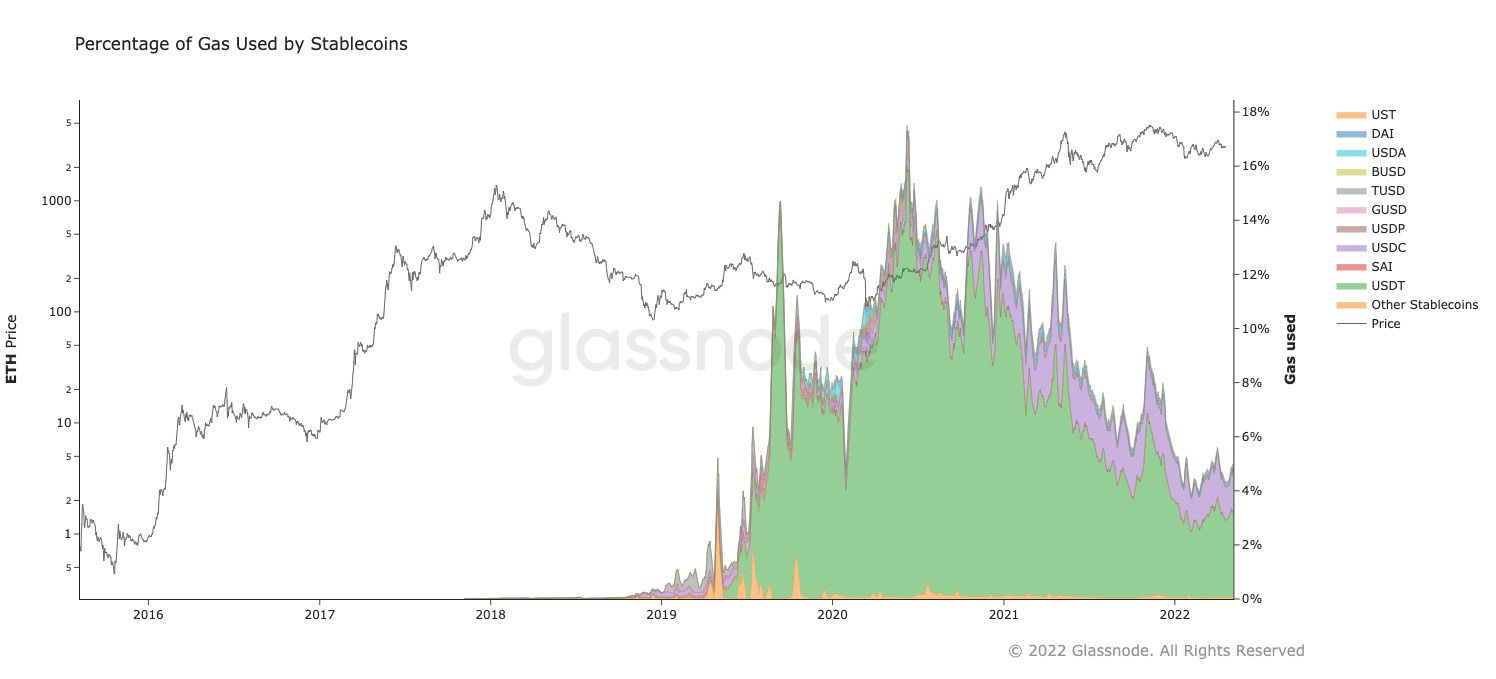
Stablecoins weren't born on Ethereum, but it's where they first thrived. Pioneered by USDT migrating from Bitcoin in search of lower fees and faster confirmation times, stablecoins quickly became a powerhouse in gas consumption. Over the last three years, most of the time Ethereum was used more as a payment platform for dollars than it was for Ether, with stablecoins monthly transfer volumes being higher than Ether’s every month since late 2019.
Besides USDT, there is an ever increasing competition of both centralized (USDT and USDC) and algorithmic (peg maintained by incentive structure, e.g. DAI and UST) projects in the thriving stablecoins space. Yet, the dynamics of this competition can’t be inferred from the plot above.
As fiat-denominated fees on Ethereum became an issue, stablecoins expanded to other blockchains. There is currently more USDT issued on Tron platform than there is on Ethereum. USDC supports 8 different blockchains. UST supports 10. To the extent Ethereum is being used as a decentralized general purpose computer, it might continue losing market share to competing platforms that are cheaper, or faster, or both.
Note this many-to-many relationship between platforms and protocols in a multichain age. Not only Ethereum, the platform, is utilized by many protocols – many of these protocols run on multiple platforms. You can not fully understand the Ethereum ecosystem without accounting for stablecoins – and you can not fully understand the stablecoins ecosystem without investigating other chains as well.
ERC-20
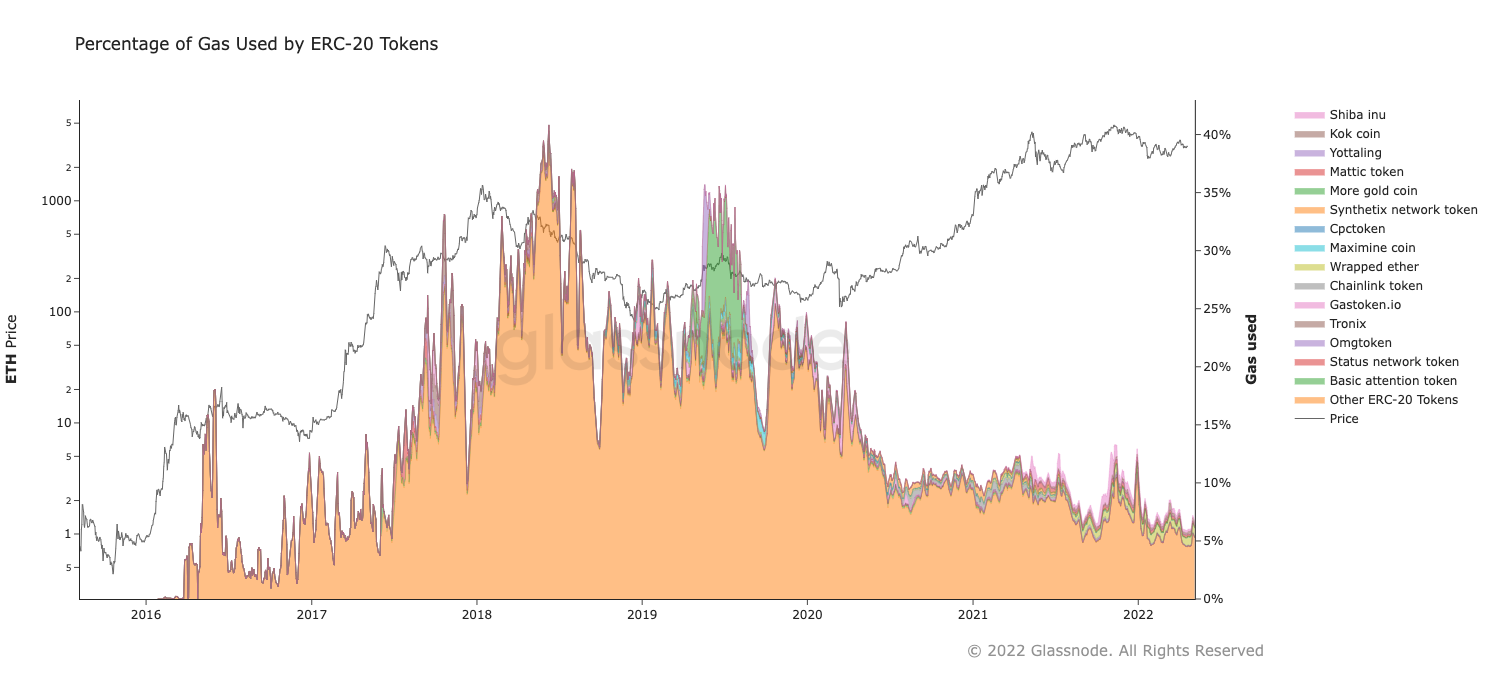
For fungible tokens, most of which are implemented as ERC-20 contracts, the 40% of gas market share in 2018 was the historical top. The days of the ICO craze appear to be behind us, and for the last couple of years the use case sports a modest 5-10% share range of the gas market. You've probably noticed the dominance of the Other ERC-20 Tokens subcategory on the plot. Over the history, a plethora of projects enjoyed their 15 minutes of fame, and at any given point this category is dominated by a few flavor of the month tokens.
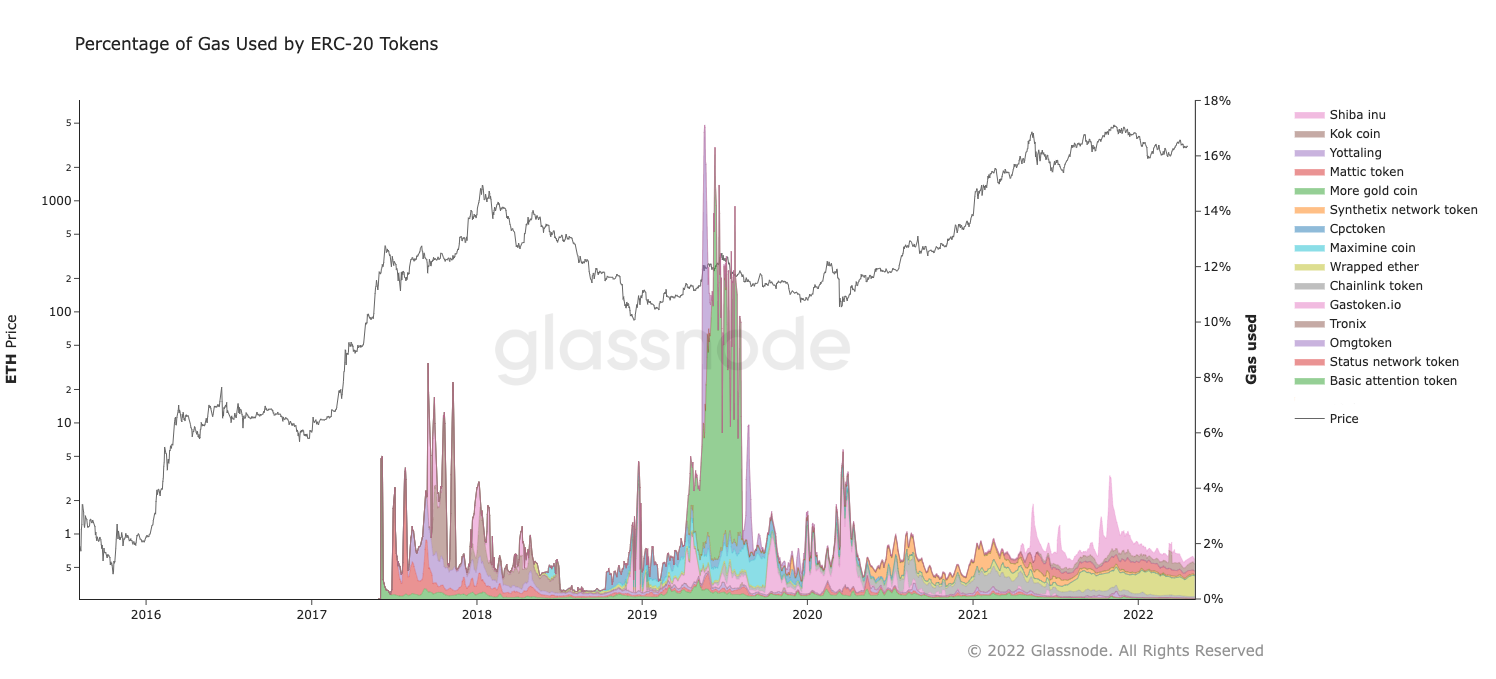
Even if we zoom into the most popular tokens over the history, none of them are prevalent for a period longer than one year.
A notable sub-category of fungible tokens are wrapped assets, most notably WETH and WBTC, enabling token interface to the native tokens of corresponding chains and decentralized finance use cases for them. That means that even Ether-denominated volume exists on Ethereum in two forms – as native ETH and as a wrapped token.
DeFi
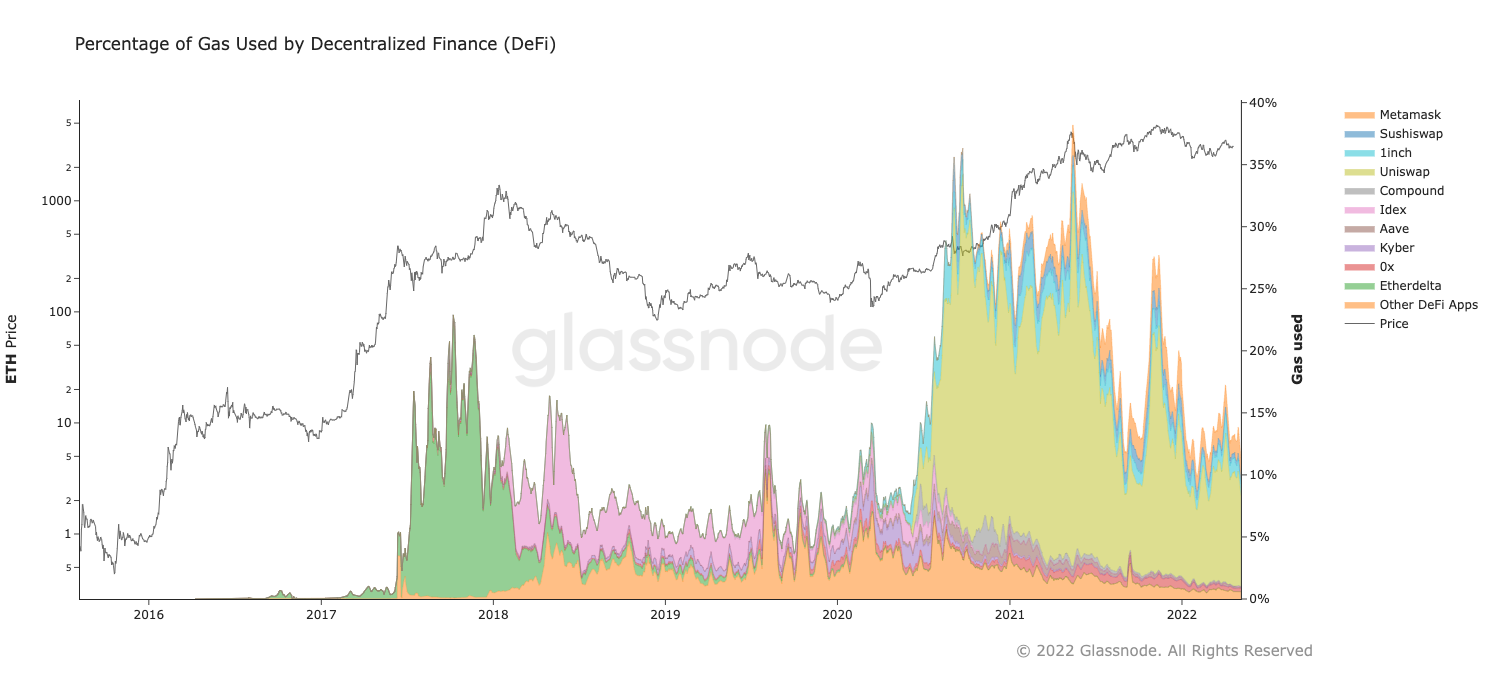
Many applications were envisioned for Decentralized Finance (DeFi) – lending, borrowing, spot and derivatives trading, interest earning, insurance and others. As of now, most of the impact we’ve seen comes from one: decentralized asset trading. In the last two years, liquidity providing and yield farming emerged as rather popular applications as well, and further segmentation of the DeFi space might be justified in the future.
Decentralized Exchanges (DEXs) first gained popularity with the emergence of EtherDelta in 2017, and were a major consumer of gas ever since. As liquidity is both provided by traders and attracts them, there is a natural centralizing force in play – at most points in time, just one or two platforms dominate this category, with Uniswap currently leading the pack (peaking at 88% of DeFi gas consumption, and currently being at ~60%). Note also the presence of Metamask (orange, top band) in this space, which is not directly a DEX, but rather an aggregator that uses a "best swap price" for a given pair from other providers, abstracting them away from the client. That's yet another trend we expect to see more of – as the industry matures, some functionality might become implicit rather than explicit, with users interacting with platforms that provide the most convenience by abstracting away all the nitty gritty of on-chain and cross-chain interactions.
Bridges
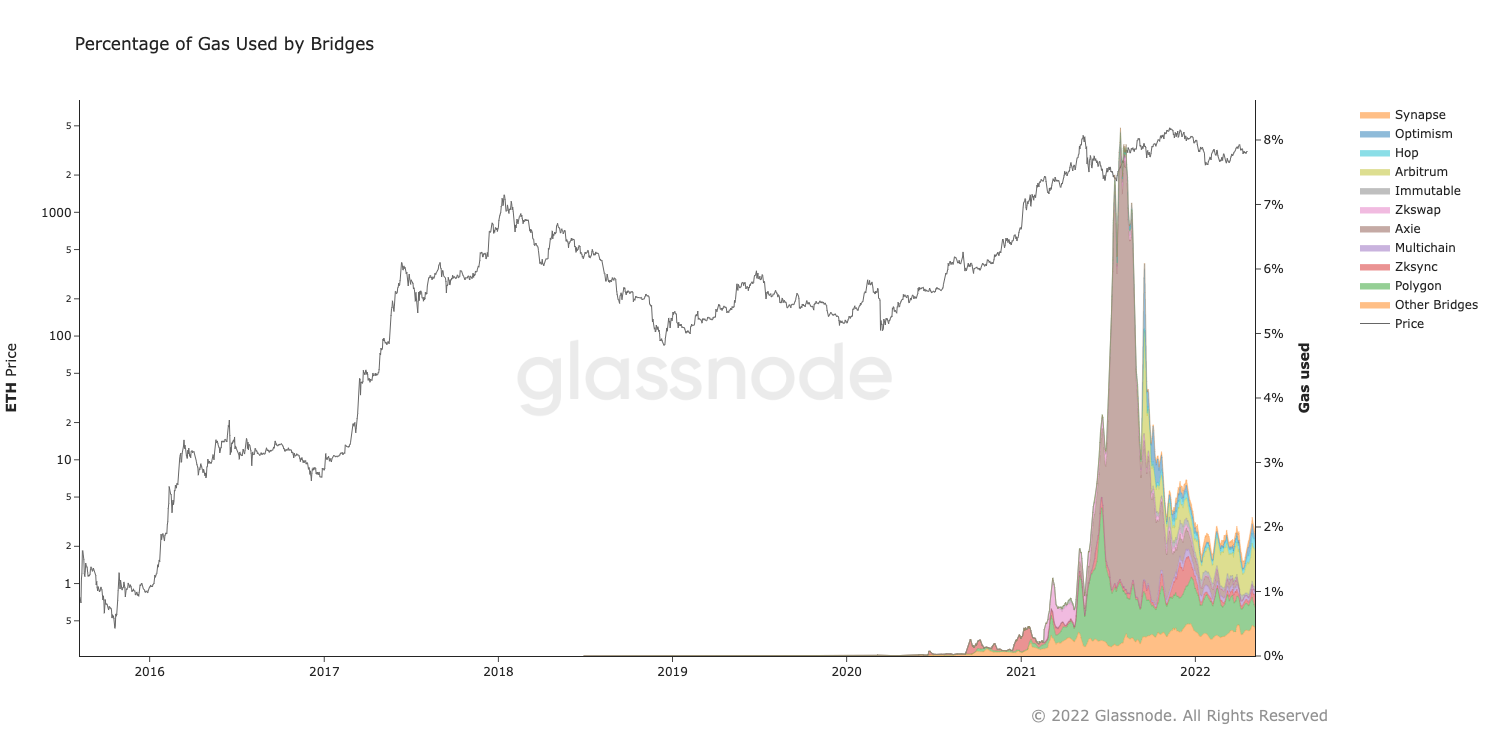
Speaking of cross-chain, bridges are among the newest notable consumers of gas. As transacting on Ethereum becomes quite expensive in fiat terms, and competitor chains mature in terms of stability and functionality, we see emergence of cross-chain capital flows. Besides a short-lived spike of the Ronin bridge at the peak of the Axie Infinity popularity (peaking at ~8% gas consumption for a few days), bridges' gas consumption has doubled over the last year (from 1% to 2%), connecting Ethereum blockchain to L2 solutions within the ecosystem (Polygon, Arbitrum, Optimism), as well as competing ecosystems (Avalanche, Polkadot). We might approach a point at which any meaningful insight into the flow of funds might require a multi-chain mindset and tooling.
Not even Bitcoin is immune to that – more than 1% of its total supply is currently bridged to the Ethereum platform in the form of WBTC, a centralized bridge.
NFTs
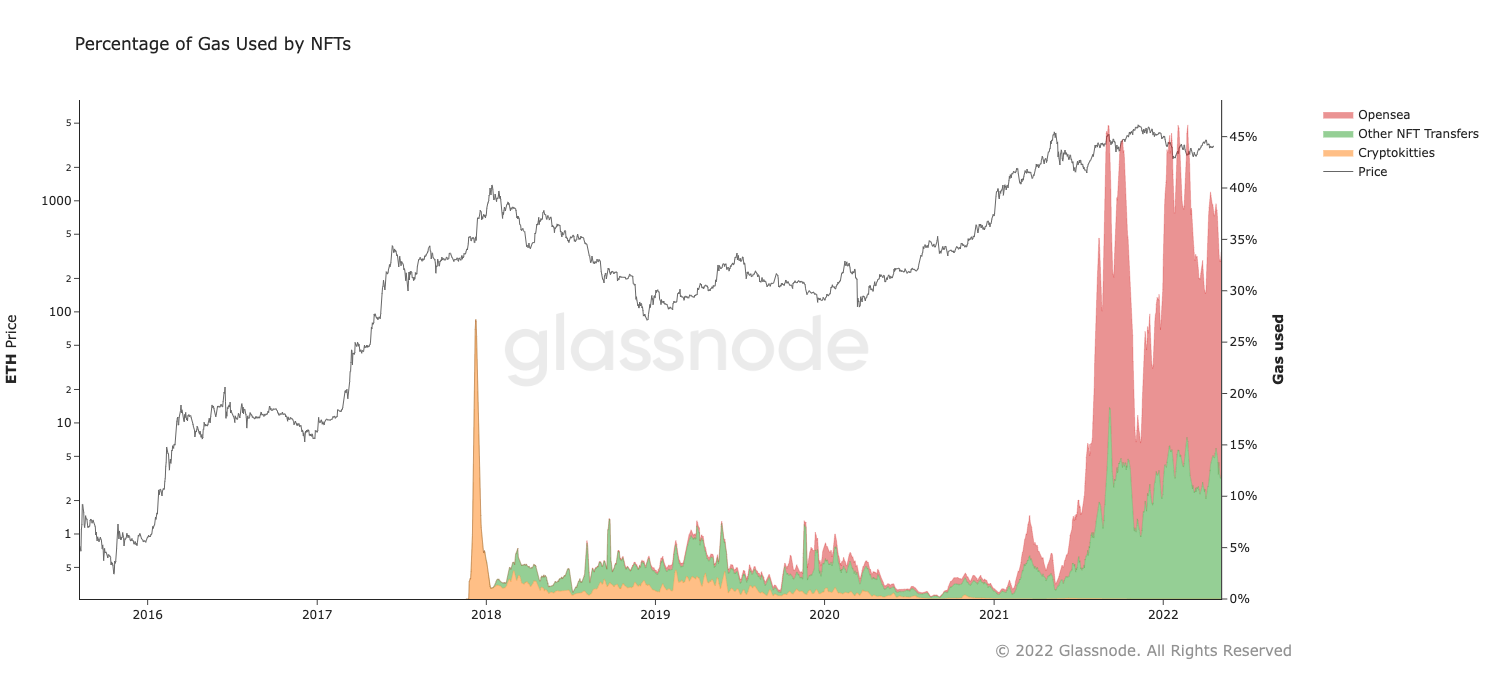
Few might remember Cryptokitties today, but back in 2017 the first popular NFT project briefly contributed about a third of the network throughput, driving network fees up significantly. In the same year, the beta version of OpenSea was released. However, it would not be until the second half of 2021 before the NFT space would become prominent on the gas market again. Ever since it was a force to be reckoned with – as of now, about a third of all gas consumed on Ethereum is used for NFT activity. Neither high gas consumption per transaction, nor adversarial price conditions seem to affect this at the moment. In this category, OpenSea is leading the market, consuming above 60% of all NFT-related gas, with several other platforms trailing behind.
Some efficiency gains were made by the introduction of the ERC-1155 token standard, utilized notably by the OpenSea Wyvern exchange – the adoption of this standard is yet another trend to keep an eye on.
MEV Bots
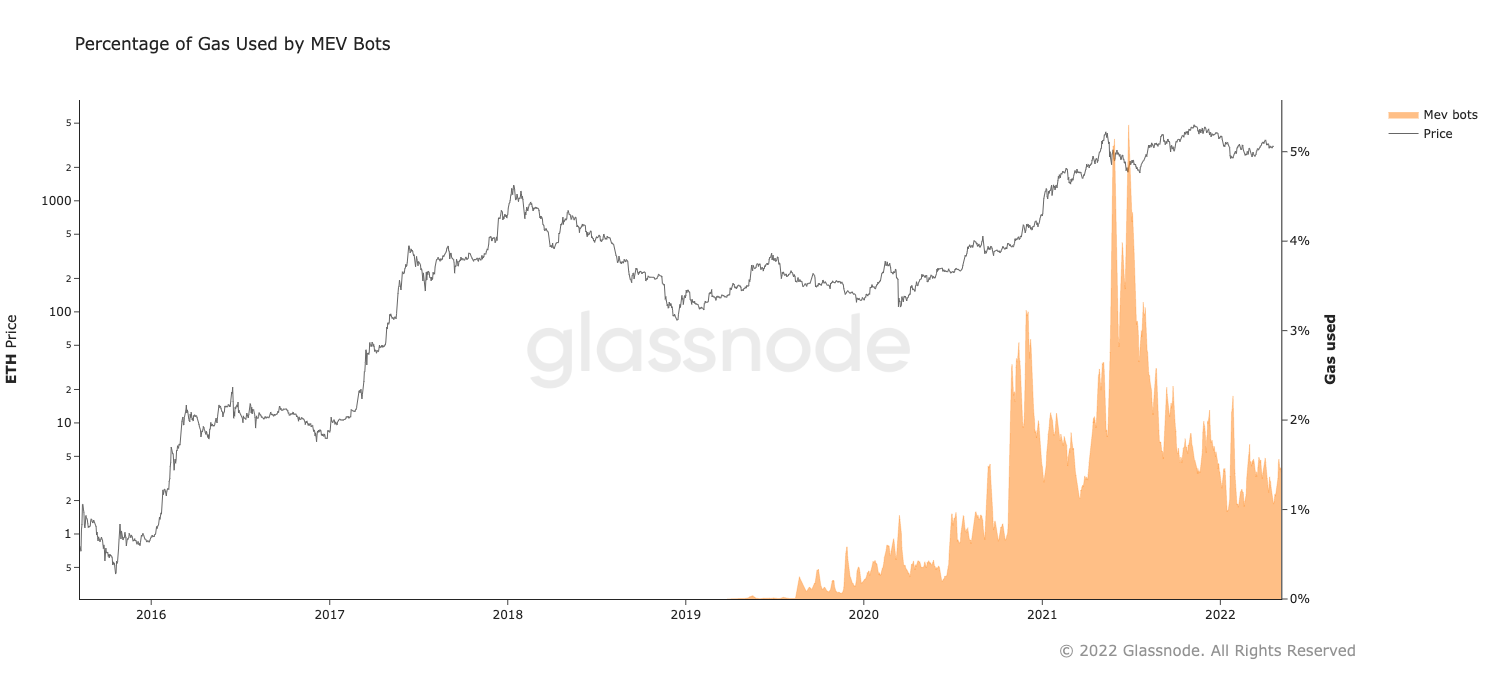
The general consensus is that Miner Extractable Value (MEV) is an inherent artifact of Ethereum’s design, and serves an important role of increasing efficiency of DeFi ecosystem, namely by arbitraging away price differences between decentralized exchanges, which accounts for 95%+ of MEV activity.
Despite what the name suggests, the main beneficiaries of MEV aren't generally miners, but a community of searchers and extractors, utilizing automated tools for creating MEV transactions. Miners, however, enjoy the elevated fees associated with urgent nature of the arbitrage transactions, which tend to be winner-takes-all opportunities and pay for gas well above market prices.
Given the MEV extractors often don’t advertise themselves, and the heuristics for MEV transactions classification are imperfect, we might be underestimating the real figure – according to the Flashbots team, at least 4% of gas is being expended by MEV transactions.
If competing chains can at least reduce the MEV impact, it could incentivize users to migrate away from Ethereum.
Other
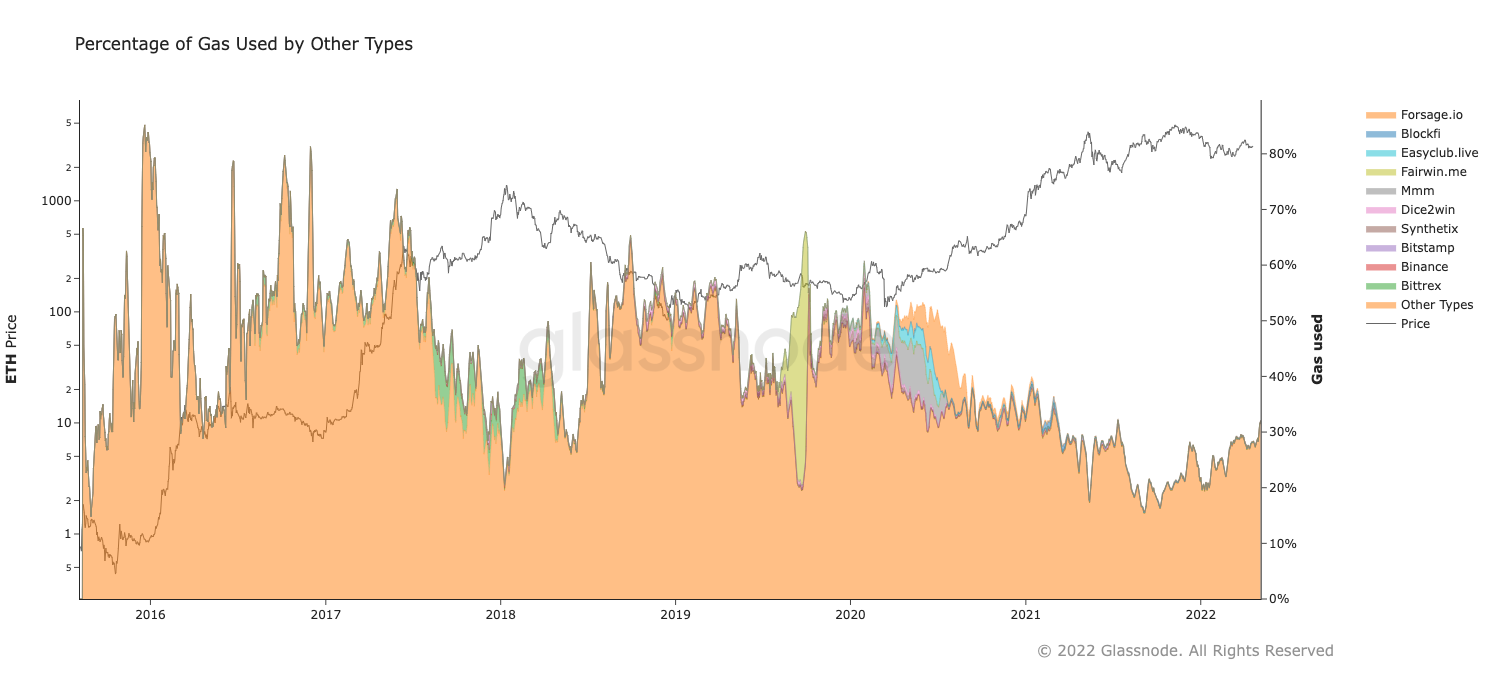
Ethereum’s design as a permissionless platform gives rise to a great many use-cases beyond the ones we listed above, ranging from on-chain gaming and multi-signature protocols to Ponzi schemes. At their peak, Ponzi schemes like MMM (peaking at 10% of gas usage) and FairWin (briefly reaching 40%) were among the most popular use cases for Ethereum. But these days seem to be behind us. Exchange contracts are also included here, notably multi-signature contracts utilized for funds management. Undetected MEV extraction, obscure DeFi protocols and non-standard tokens might also be counted in this category.
The categorization of all Ethereum activity is a never ending effort.
We will be improving the coverage of all categories above continuously, as well as adding new ones when emerging use cases reach sufficient impact levels.
Conclusion
As far as Ethereum's purpose is being defined empirically by its usage, Ethereum has been many things. From native asset payment network in the early days, to fungible tokens in 2018, and non-fungible tokens recently, many use cases enjoyed the spotlight of being the largest fee payer of the platform. Much aligned with the original Ethereum vision, we have to concede that Ethereum appears to be a general purpose decentralized computer, almost agnostic to the computations it performs.
Understanding the resulting dynamic ecosystem is not a trivial task. Value flows through the network in a myriad of different forms through multiple distinct channels. To make it harder still, Ethereum is increasingly interconnected with a plethora of other L1 and L2 chains. An ever-increasing amount of assets, projects, protocols and entities exists on multiple chains simultaneously and migrate between the platforms freely.
Approaching Ethereum today with same mindset as if it was Bitcoin, or even Ethereum of 2019, just doesn't make the cut. Relying on single-asset, single-chain metrics yields an incomplete and superficial understanding – comprehending the current state of the network requires vigilant awareness of new developments, broad area of expertise and appreciation of the nuance.
As always, Glassnode will be there to provide just that.
The newly released Ethereum breakdown metrics are now available in Glassnode Studio:
– Pre-Set Dashboard Exploring the Etherverse
– Transaction Type Breakdown (Relative)
– Transaction Type Breakdown (Absolute)
– Gas Usage by Transaction Type (Absolute)
– Gas Usage by Transaction Type (Relative)
Key Takeaways
Ethereum remains a platform mostly used for transferring value, yet the scope of what constitutes value, and what constitutes a transfer is ever-changing. As opposed to Bitcoin, Ethereum requires tooling and a mindset that are:
- Use-case sensitive and accommodating to new developments.
- Multi-asset, with a broad definition of value that includes fungible and non-fungible tokens.
- Multi-protocol and multi-chain, with a broad definition of transfers that includes decentralized finance protocols and cross-chain bridging.

- Follow us and reach out on Twitter
- Join our Telegram channel
- Visit Glassnode Forum for long-form discussions and analysis.
- For on–chain metrics and activity graphs, visit Glassnode Studio
- For automated alerts on core on–chain metrics and activity on exchanges, visit our Glassnode Alerts Twitter