An On-Chain Distribution Analysis of Basic Attention Token (BAT)
An on-chain analysis of Basic Attention Token (BAT) giving insights to the distribution of BAT funds across the network and showing that the richest 1% hold 87% of funds.

Whale Accumulation at ATH: The Richest 1% Hold 87% of Funds
At Glassnode we delve into the world of blockchain data, in order to provide contextualised insights that help foster market maturity and support investors and traders make informed decisions.
In this post we are taking a look at the token holder distribution of Basic Attention Token (BAT).
BAT is a utility token on the Ethereum blockchain that is “used to obtain a variety of advertising and attention-based services on the BAT platform”.
The present analysis is based on block 7504775 on April 4th 2019, at which point ~104,600 addresses were holding BAT, whose total supply is 1.5 billion tokens.
Special Addresses
BAT tokens in contracts
Of the aforementioned 104,600 addresses 1.25% are smart contracts, holding a total of 30.9 million BAT (2.0% of total supply). In the following analyses we discard these and consider only non-contract (externally owned) account addresses, in order to get the most accurate distribution analysis of token holders.
Team balance, UGP balance, and balance on exchanges
When BAT first launched, portions of tokens were kept for the development team and another amount for the User Growth Pool (UGP). Below we show the current amount of tokens held in the development pool, the UGP, as well as the amount of tokens currently held in exchange addresses.
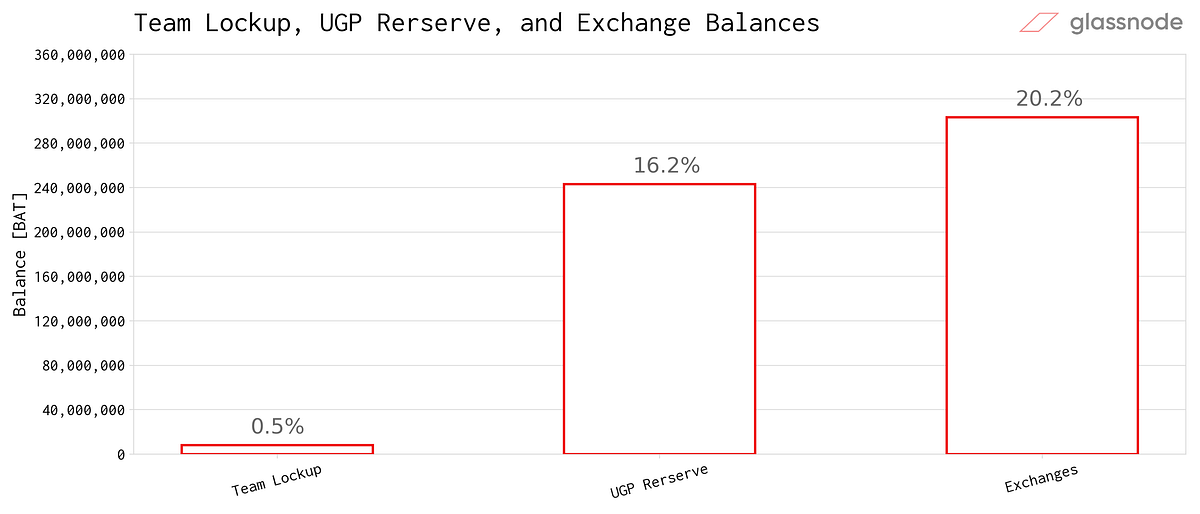
Although it is self-evident that a significant amount of BAT is being held by the UGP (as it’s part of their token distribution model and has in fact decreased from initially 300M to 243M since the launch), it is interesting to see that more than 20% (300M) of BAT tokens are currently being held by exchanges*.
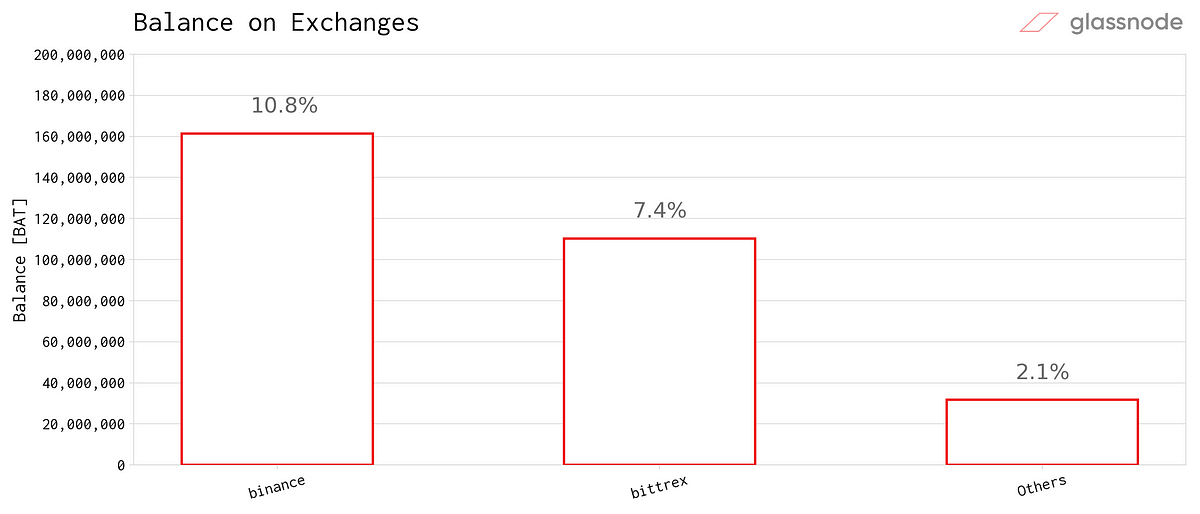
Most of the BAT held by exchanges is on Binance and Bittrex, amounting to a total of 17.8%, with other exchanges holding the remaining 2.1% of the total exchange balance.
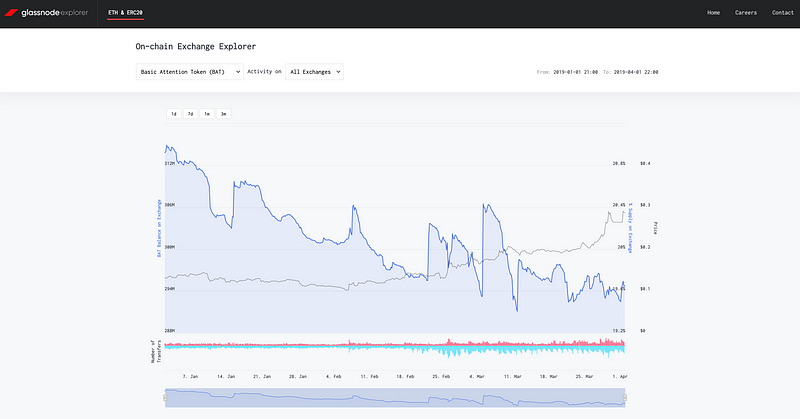
* Exchange balances are based on Glassnode’s internal address flags database. We’ve built an interactive tool that monitors on-chain activity of ETH and ERC20 on exchanges over time. Check it out on explorer.glassnode.com:
BAT Distribution: Current State
In order to get the best possible picture on how BAT funds are distributed across participants in the network, in all subsequent analyses we discarded the above addresses belonging to the development pool, the UGP, and exchanges.
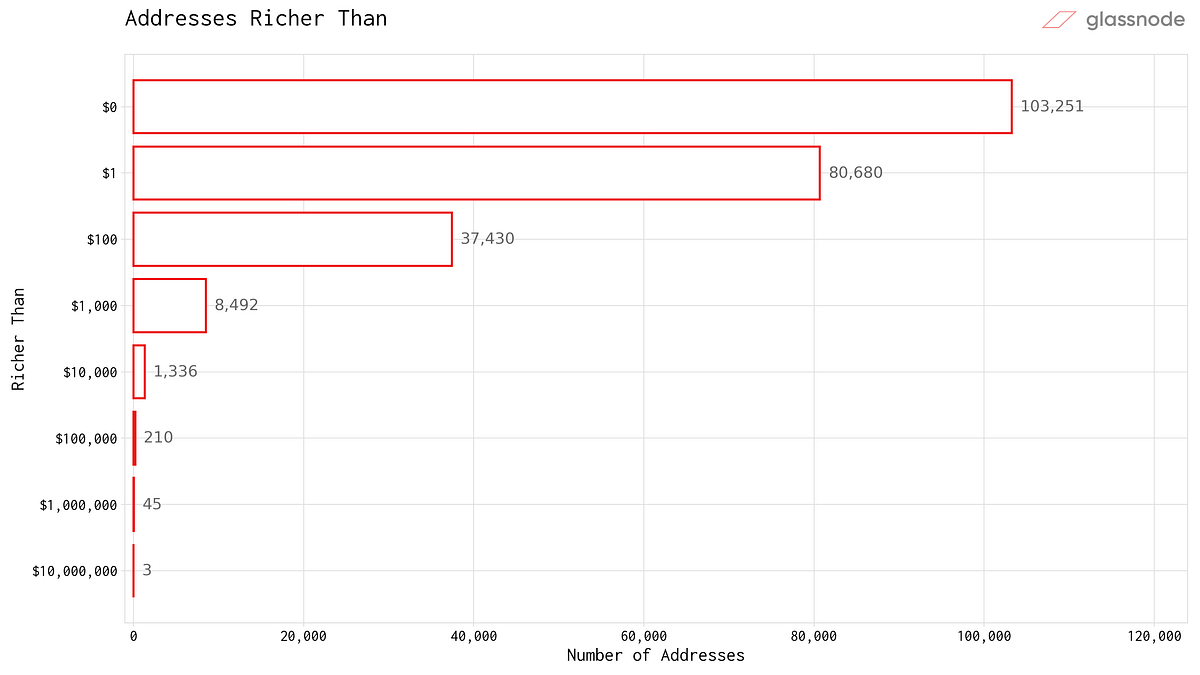
First, we looked at the amount of addresses richer than a certain value. The thresholds are in USD and we used a price of $0.29 (approximate BAT price on April 10th according to CMC) to compute USD balances.
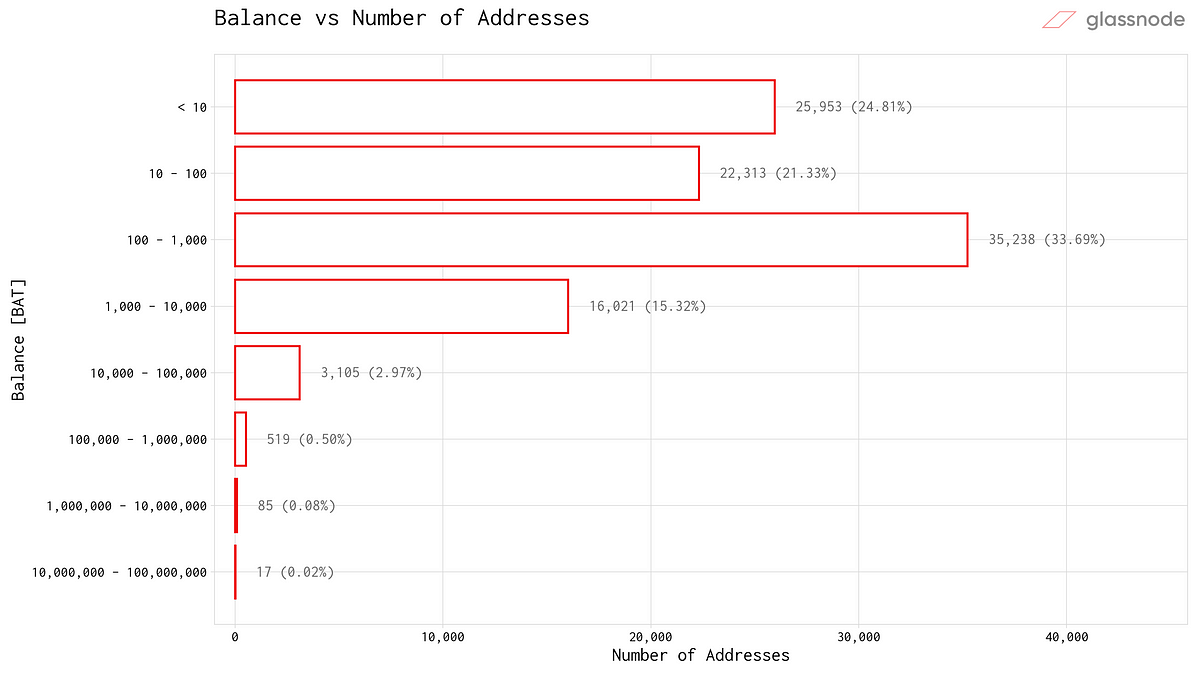
Next, we analysed the amount of addresses within certain balance ranges. As can be seen in the graph below, most addresses holding BAT (35.2%) hold between 100 and 1000 tokens (given a price of $0.29 per token that amounts to balances of $29–$290).
Nonetheless, we found that most of the funds are concentrated within only few addresses. To illustrate this, we looked at the total amount of BAT held by addresses with particular balance ranges:
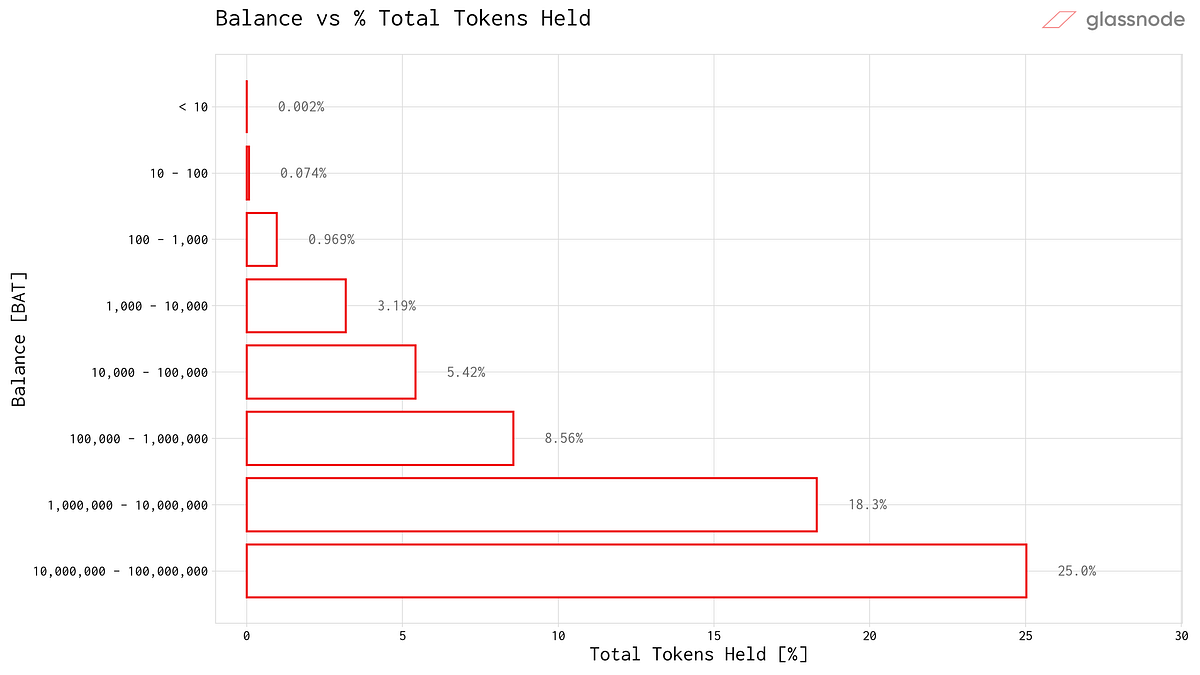
These results are substantial, showing us that 52% of BAT tokens (sum of three largest bars in above graph) are held by only the top 0.6% of addresses! Remember that this analysis excludes contract, team, UGP and exchange addresses (as flagged by Glassnode), therefore providing a more accurate approximation on the underlying distribution of all other players in the BAT network.
To highlight this concentration of value we looked at the full picture illustrating the relationship between number of addresses and the amount of tokens held:
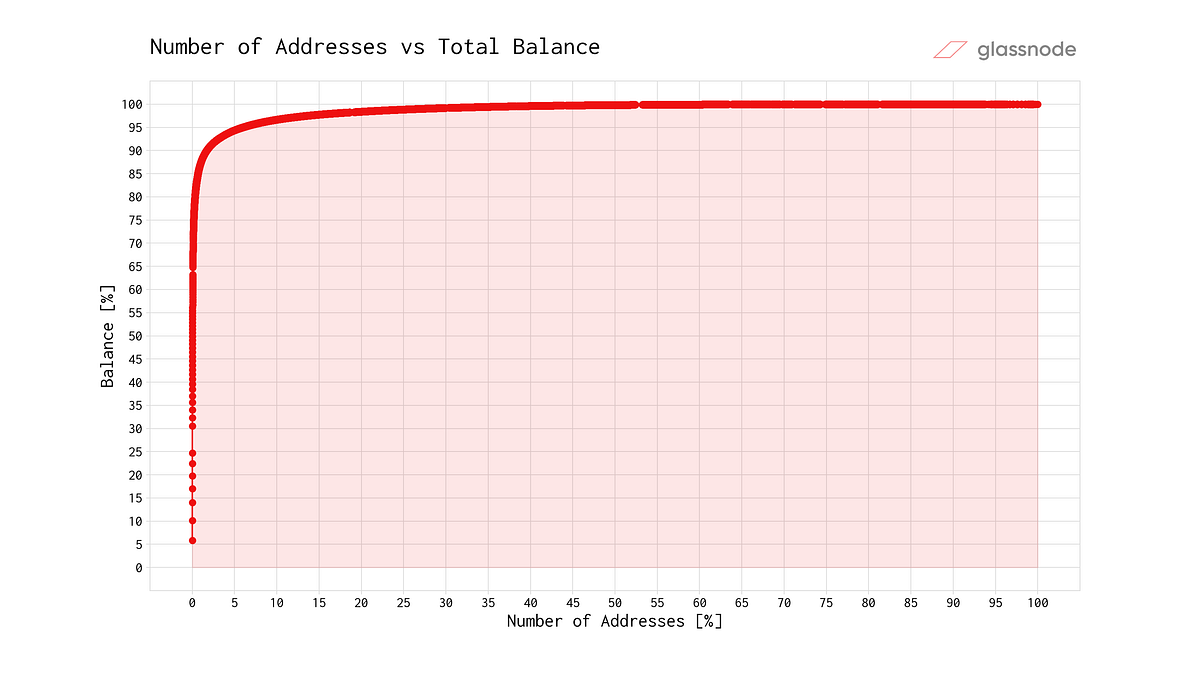
Note that the percentages displayed here are with respect to the total balance (and number of addresses) excluding team address, UGP address and exchange addresses, thereby making both axes sum up to 100%.
The plot clearly reveals how most of BAT tokens are concentrated over only few addresses, with the plotted curve showing a rapid initial rise towards 100% and quickly saturating.
The resulting Gini coefficient of this distribution is ~0.97.
In order to highlight this outcome through a few reference numbers, our analysis shows that …
- … the top 0.01% addresses hold 30% of BAT,
- … the top 0.1% addresses hold 70% of BAT,
- … the top 1% addresses hold 87% of BAT,
- …. and the top 5% addresses already hold more than 94% of all BAT!
BAT Distribution: What is the Trend?
Now that we outlined the current state of BAT token holder distribution, and identified a high concentration of funds held by a small amount of addresses, we set out to investigate how this distribution evolved over time, and to explore whether a trend is evident in the data.
In order to do so, we analysed the amount of BAT held by the top 1% addresses over time (since August 2017). And the results show a clear recent direction:
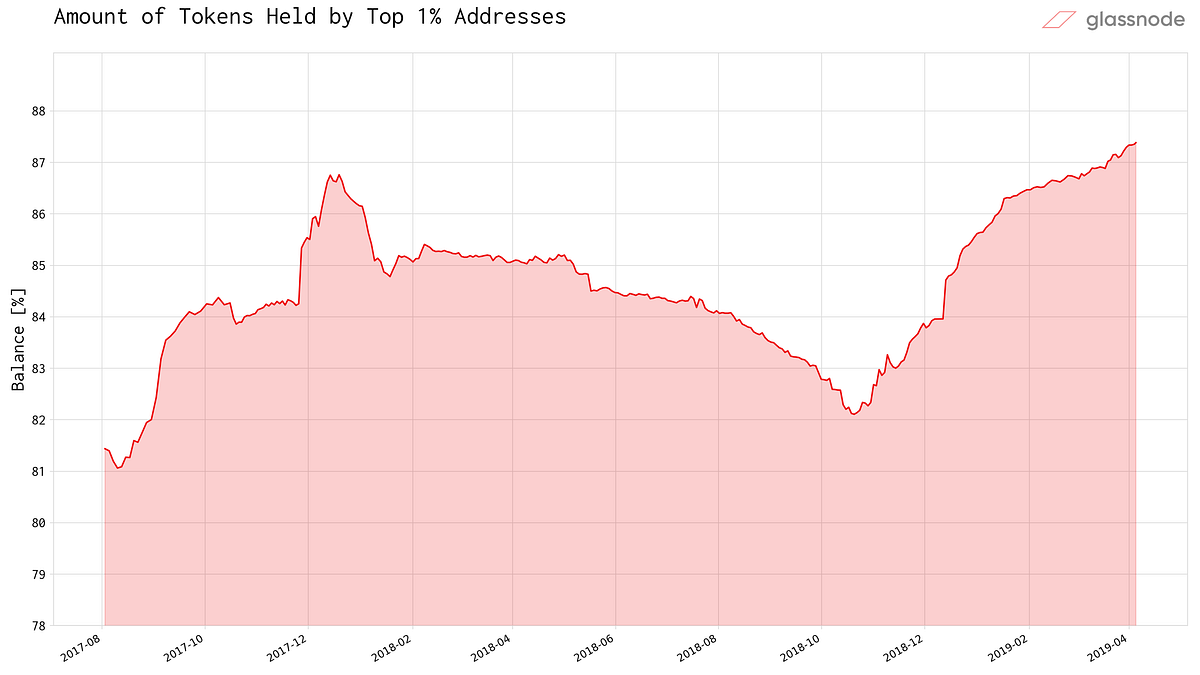
While the balance of the top 1% accounts had decreased from late 2017 to Oct 2018, it has since been rapidly surging, with the richest accounts increasing their holdings by +5% within the last 5 months!
Whales have recently been accumulating BAT and the total amount they currently hold is at an All Time High.

- Follow us and reach out on Twitter
- For on–chain metrics and activity graphs, visit Glassnode Studio
- For automated alerts on core on–chain metrics and activity on exchanges, visit our Glassnode Alerts Twitter
Disclaimer: This report does not provide any investment advice. All data is provided for information purposes only. No investment decision shall be based on the information provided here and you are solely responsible for your own investment decisions.