Asymmetric Correlations of On–Chain Activity: Using Litecoin when Sending Bitcoin Becomes Expensive
Asymmetric on-chain data correlations show significant increases Litecoin network activity as a result of increased Bitcoin transaction fees.


TL;DR Analysing blockchain data we show that substantial correlations between on–chain metrics across multiple blockchains exist. Interestingly, many of these correlations are asymmetric, meaning that if you swap the metrics of the investigated metric pair between chains, the correlation wears off. Notably, the data shows that there are significant increases in Litecoin network activity when Bitcoin transaction fees rise. These results suggest that in order to move funds faster and cheaper, users could be switching to the Litecoin network whenever the Bitcoin network congests and sending bitcoins becomes too expensive.
If you’re no stranger to crypto, this is probably old news to you: The cryptocurrency market moves largely together, prices of digital assets correlate with each other.
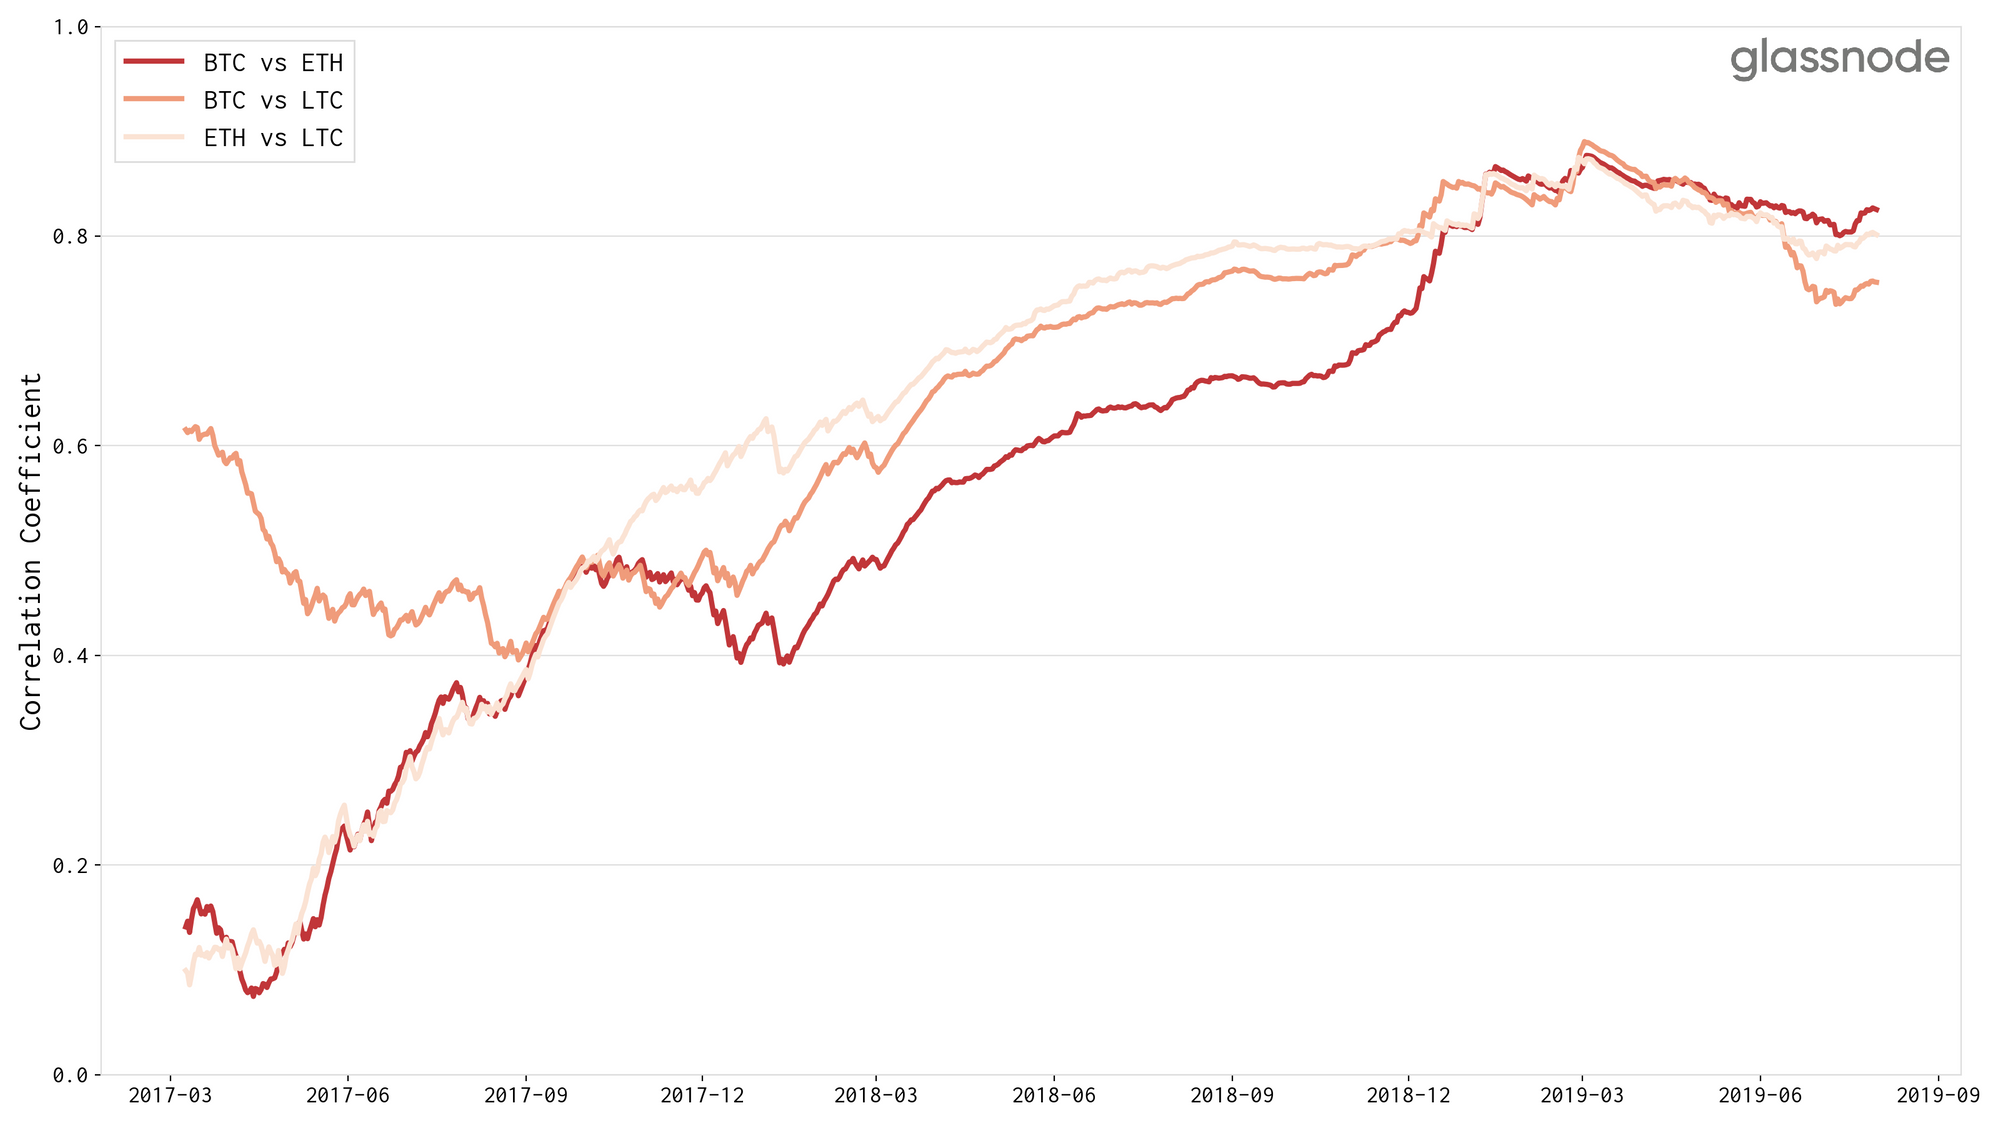
Take a look at the following chart illustrating the correlation of price changes over time for BTC, ETH, and LTC.
We used a daily rolling window and computed the yearly (previous 365 days) correlation of daily price changes. Note that this effect has been increasing over the years (reaching almost r=0.9), and only started to decline recently, in March 2019.
Prices Move Together – but what about On–Chain Activity?
At Glassnode we’re primarily concerned with on–chain activity of blockchains in order to fundamentally understand the behavioural economics of these networks.
So the obvious question we asked ourselves was: If the digital asset markets tend to move together, what about blockchain activity itself? Do we observe similar patterns when comparing on–chain data across multiple networks?
We took a close look at some core on–chain metrics (transactions count, transfer volume, addresses, and fees) on three major blockchains currently supported on the Glassnode platform: BTC, ETH, and LTC.
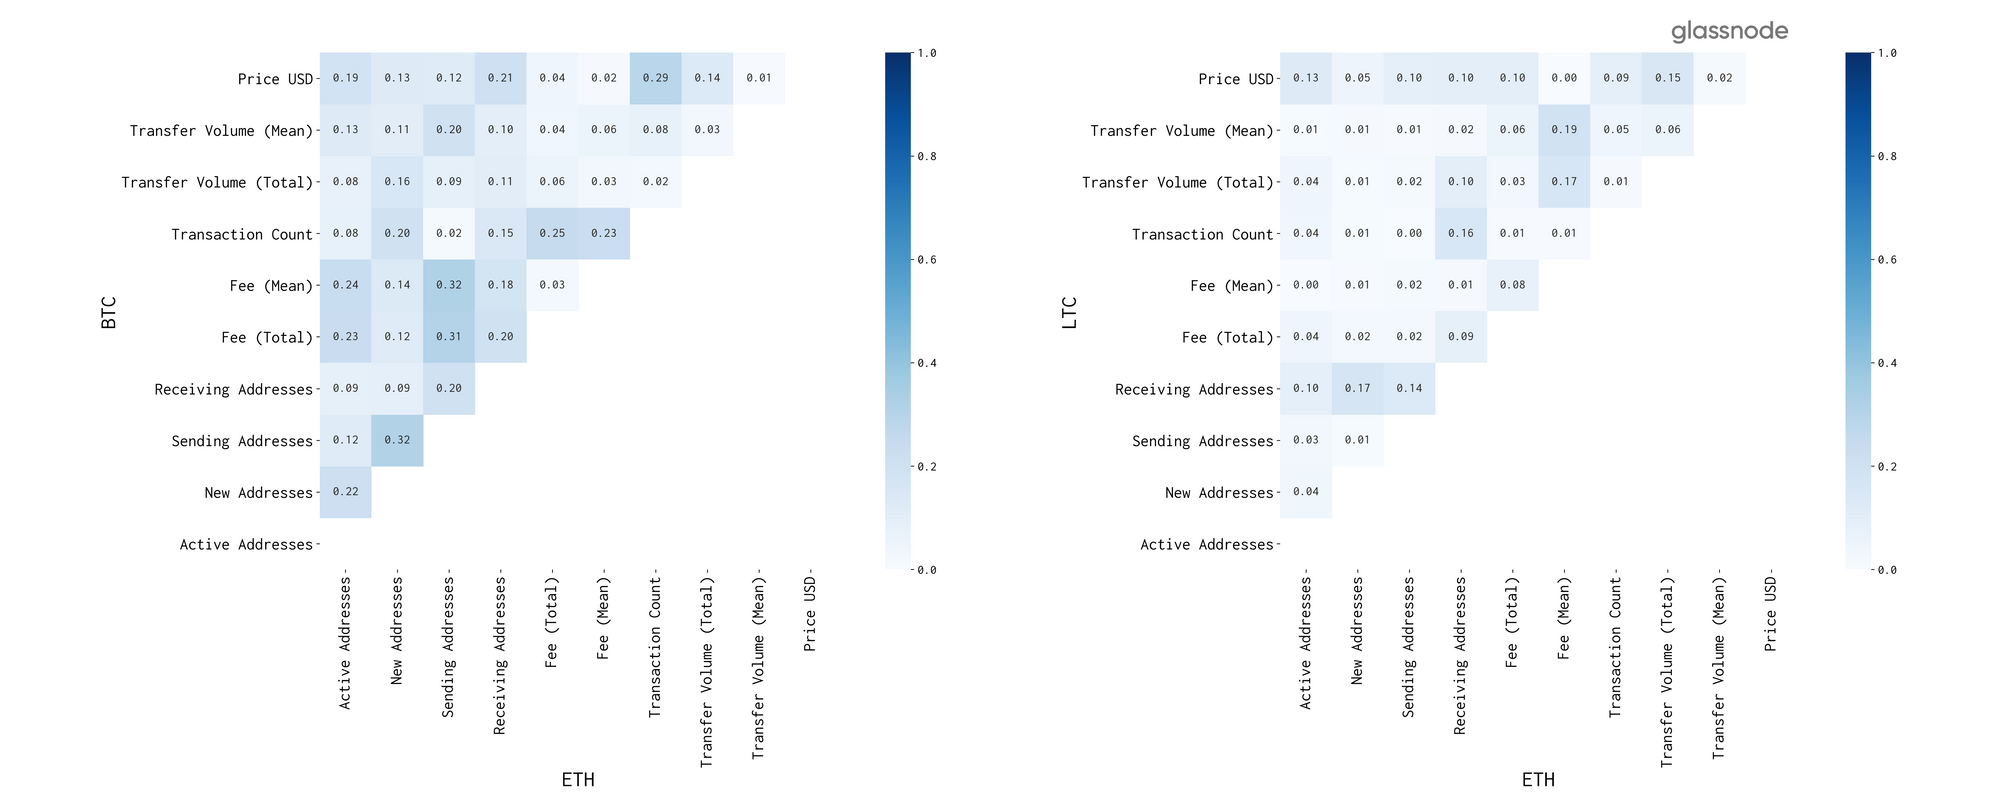
Below you can see an BTC-LTC correlation matrix of historic core on–chain metrics, as well the assets' price in USD. We used data with a weekly resolution and de-trended it in order to account for non-stationarity by differencing subsequent datapoints, i.e. we used the change of values rather than the values themselves to compute the correlation coefficient.
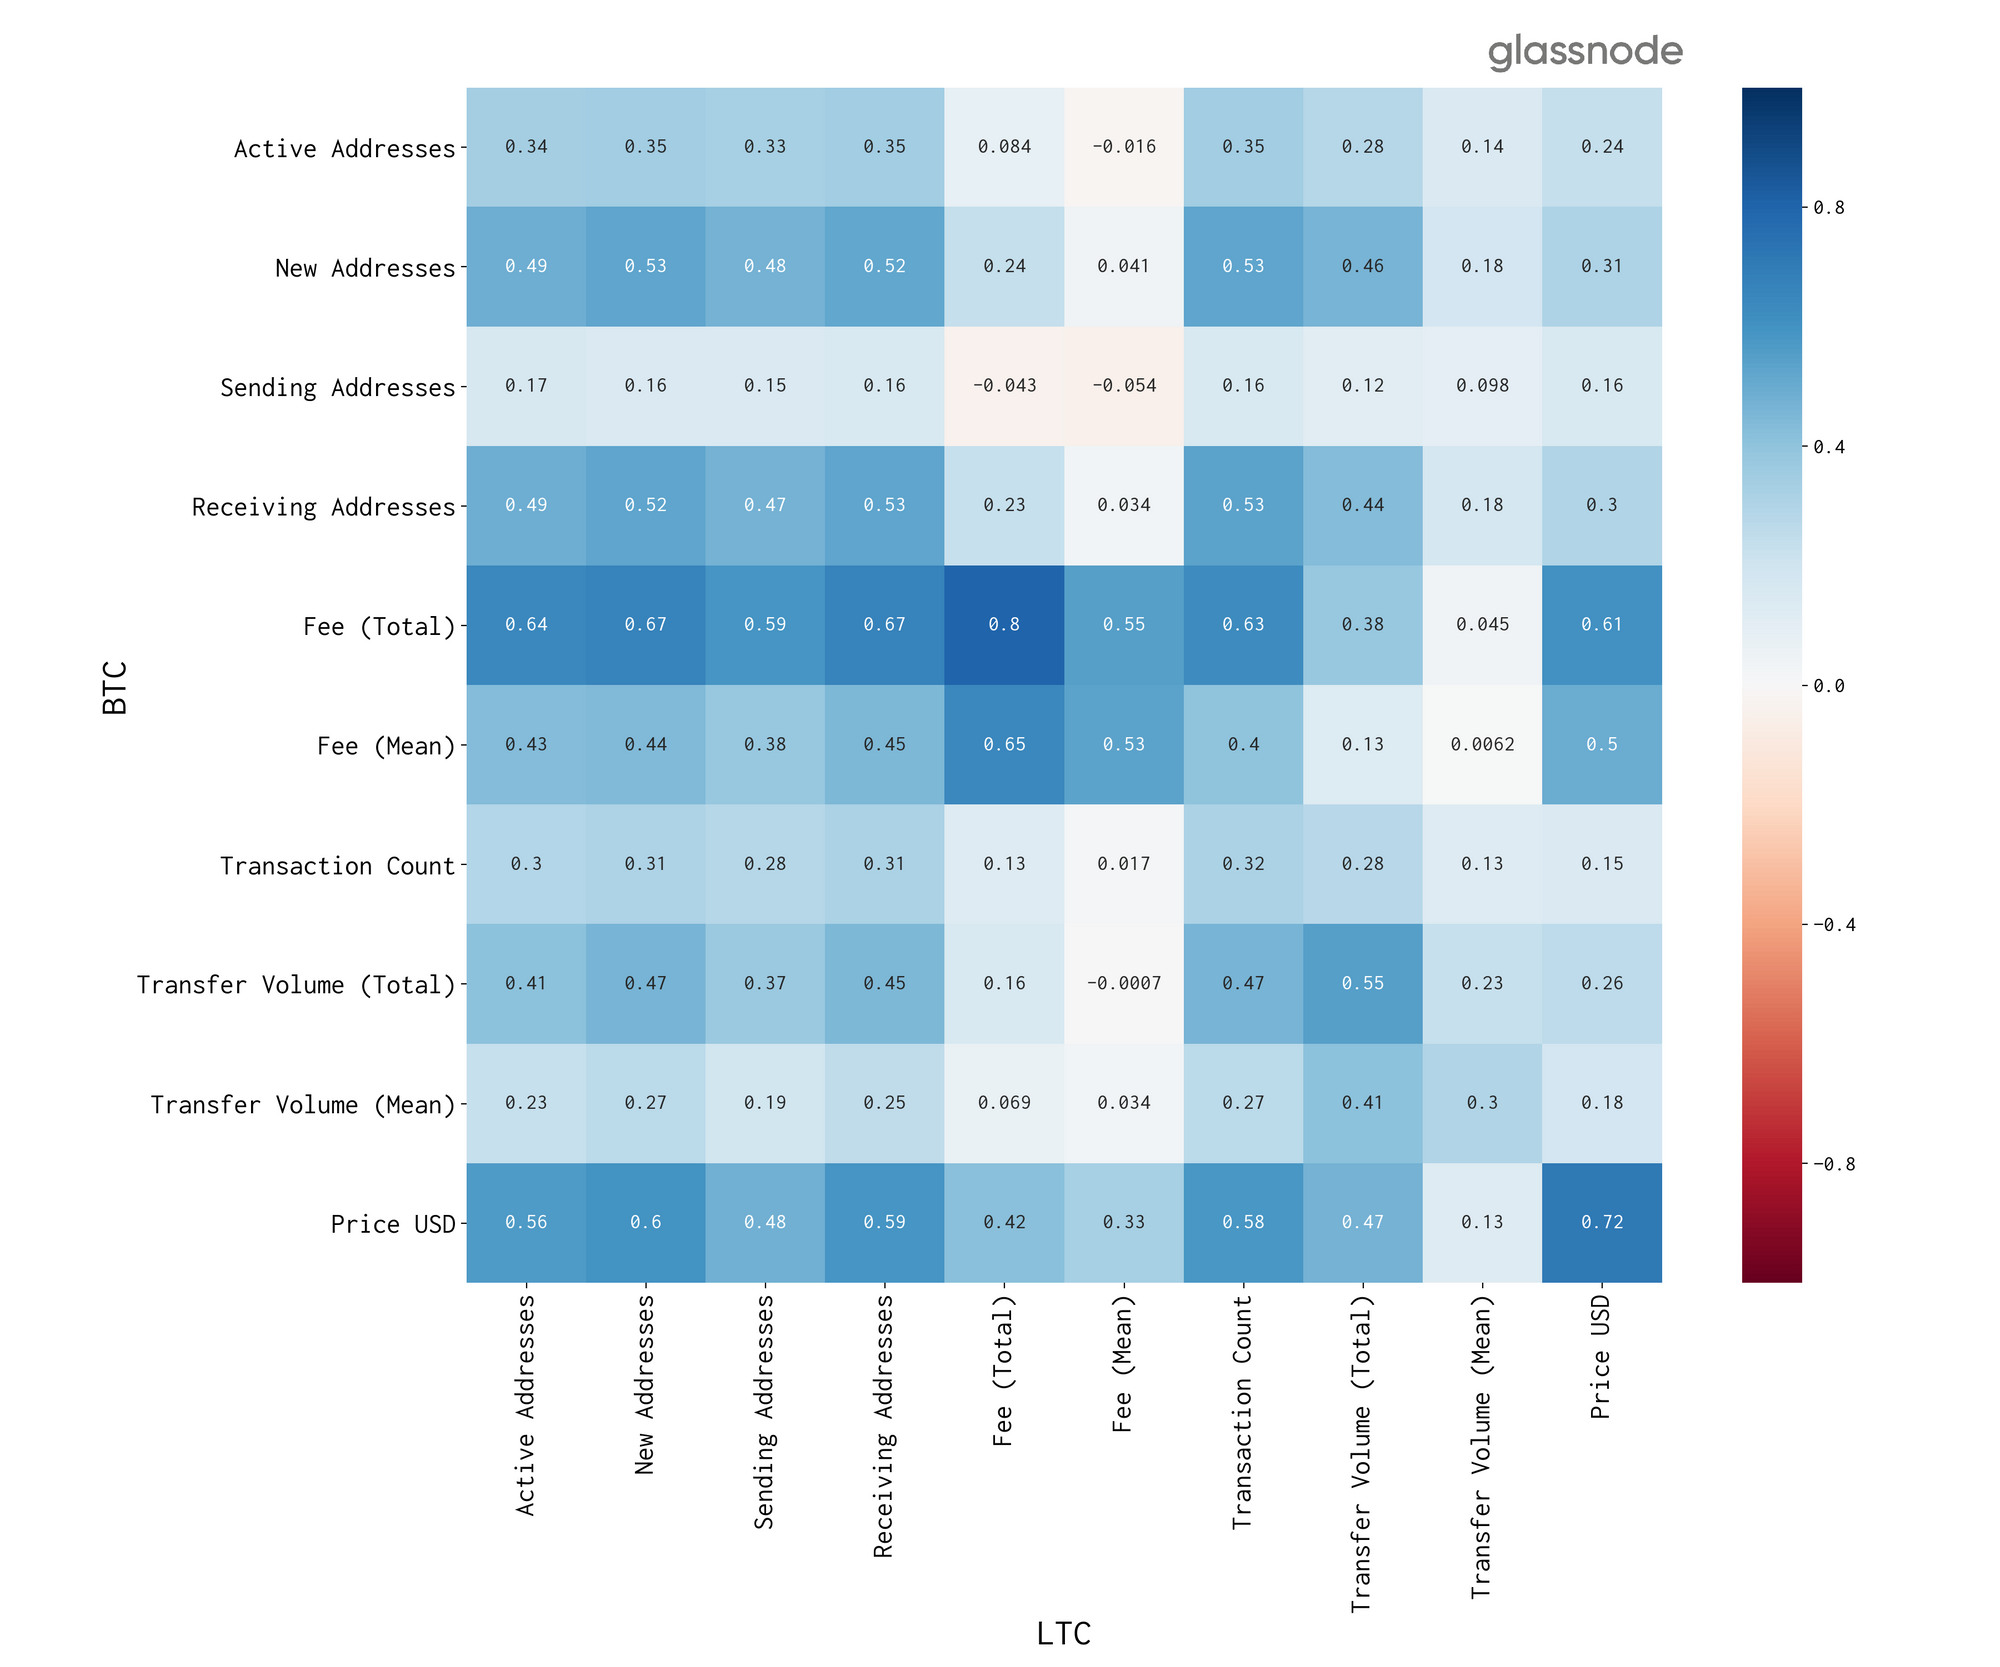
There’s a couple of immediate observations in this correlation analysis:
- First, in becomes instantly apparent that correlations across on–chain metrics (as well as price) between Bitcoin and Litecoin exist.
- Second, these correlations are exclusively positive, i.e. the increase of one metric correlates with the increase of other metrics.
- And third, these correlations are not restricted to the same metric across both blockchains, otherwise we would see a predominant diagonal line comprising high correlation values as compared to the rest of the matrix.
In fact, we observe multiple strong cross-metric correlations (> 0.6), most dominantly with respect to Bitcoin’s fee (5th row,Total Fee).
Are these Correlations Bidirectional?
The observed on–chain metric correlations become more interesting when we assess the symmetry of correlations across chains.
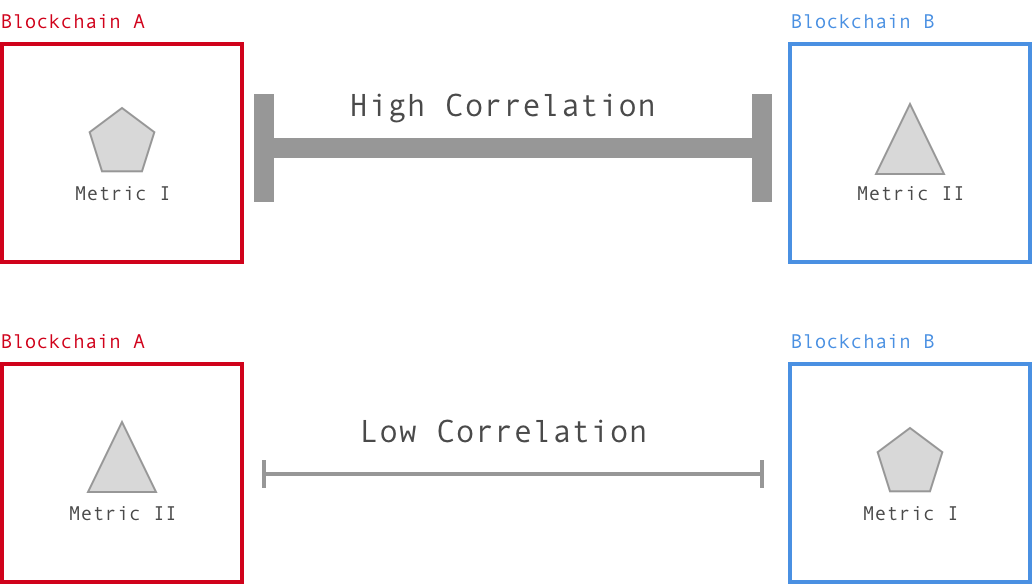
A symmetric correlation here means that Metric I on Blockchain A correlates with Metric II on Blockchain B to the same extend as Metric I on Blockchain B correlates with Metric II on Blockchain A. Otherwise the correlation is considered asymmetric.
In order to assess the amount of symmetry we compute the the so-called correlation asymmetry matrix. To do so, we take the raw correlation matrix, subtract it from its transpose, and compute the absolute values.
This results in the following triangular matrix:
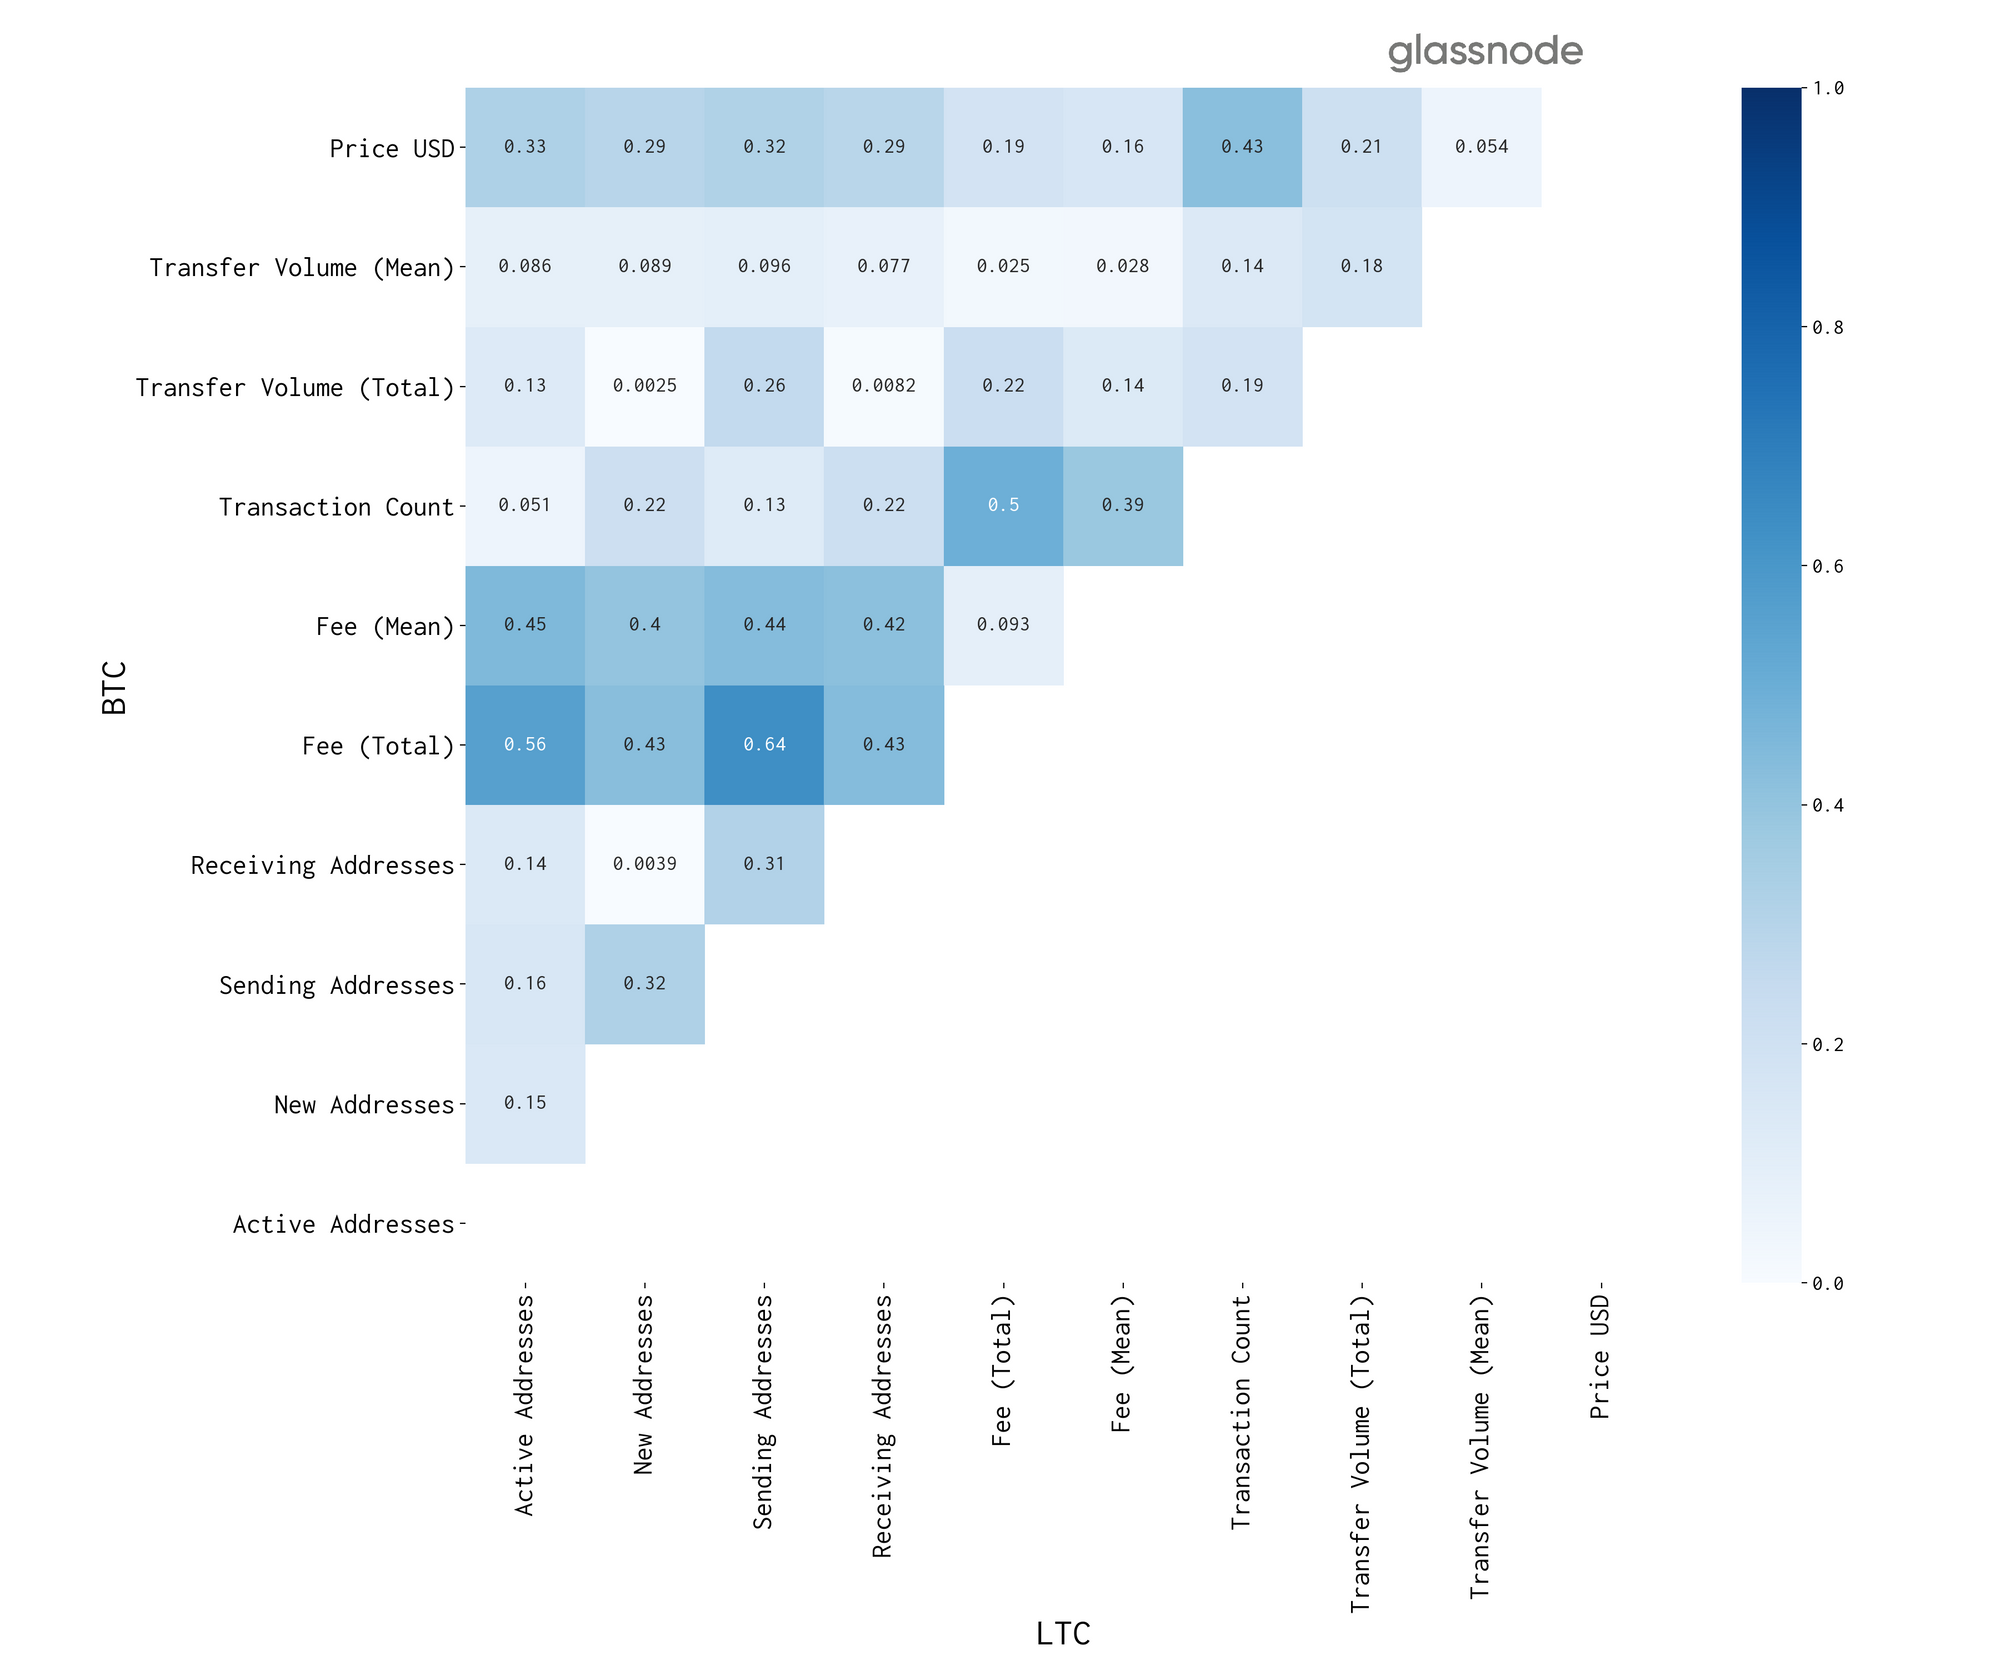
The way to read this matrix is: The higher the value, the higher the correlation asymmetry between the corresponding metrics across chains, i.e. Metric I in Blockchain A correlates with Metric II in Blockchain B, but the opposite is not the case: Metric I in Blockchain B does not correlate with Metric II in Blockchain A.
Specifically, the above asymmetry of BTC-LTC on–chain metrics shows the biggest asymmetry with respect to fee metrics, with the largest being between
- the total fee volume and
- the number of sending addresses.
Concretely, this means is that if the fees in one chain increase, the number of sending addresses in the other chain increases as well – but this correlation is uni-directional/asymmetric.
Hence, the obvious hypothesis here is:
If it becomes too expensive to send bitcoins over the network, the activity in the Litecoin network increases.
The reverse however not being true: An increase in Litecoin fees does not correlate with an increase of Bitcoin activity.
In order to test this hypothesis, we dug deeper and took a look at total fees and transaction count (as a proxy for network activity) in both networks.
The following graph displays the relationship between those two metrics in both directions:
- BTC transaction fees vs LTC transaction count, and
- LTC transaction fees vs BTC transaction count.
We again used the delta instead of absolute values in order to account for trends in the data.
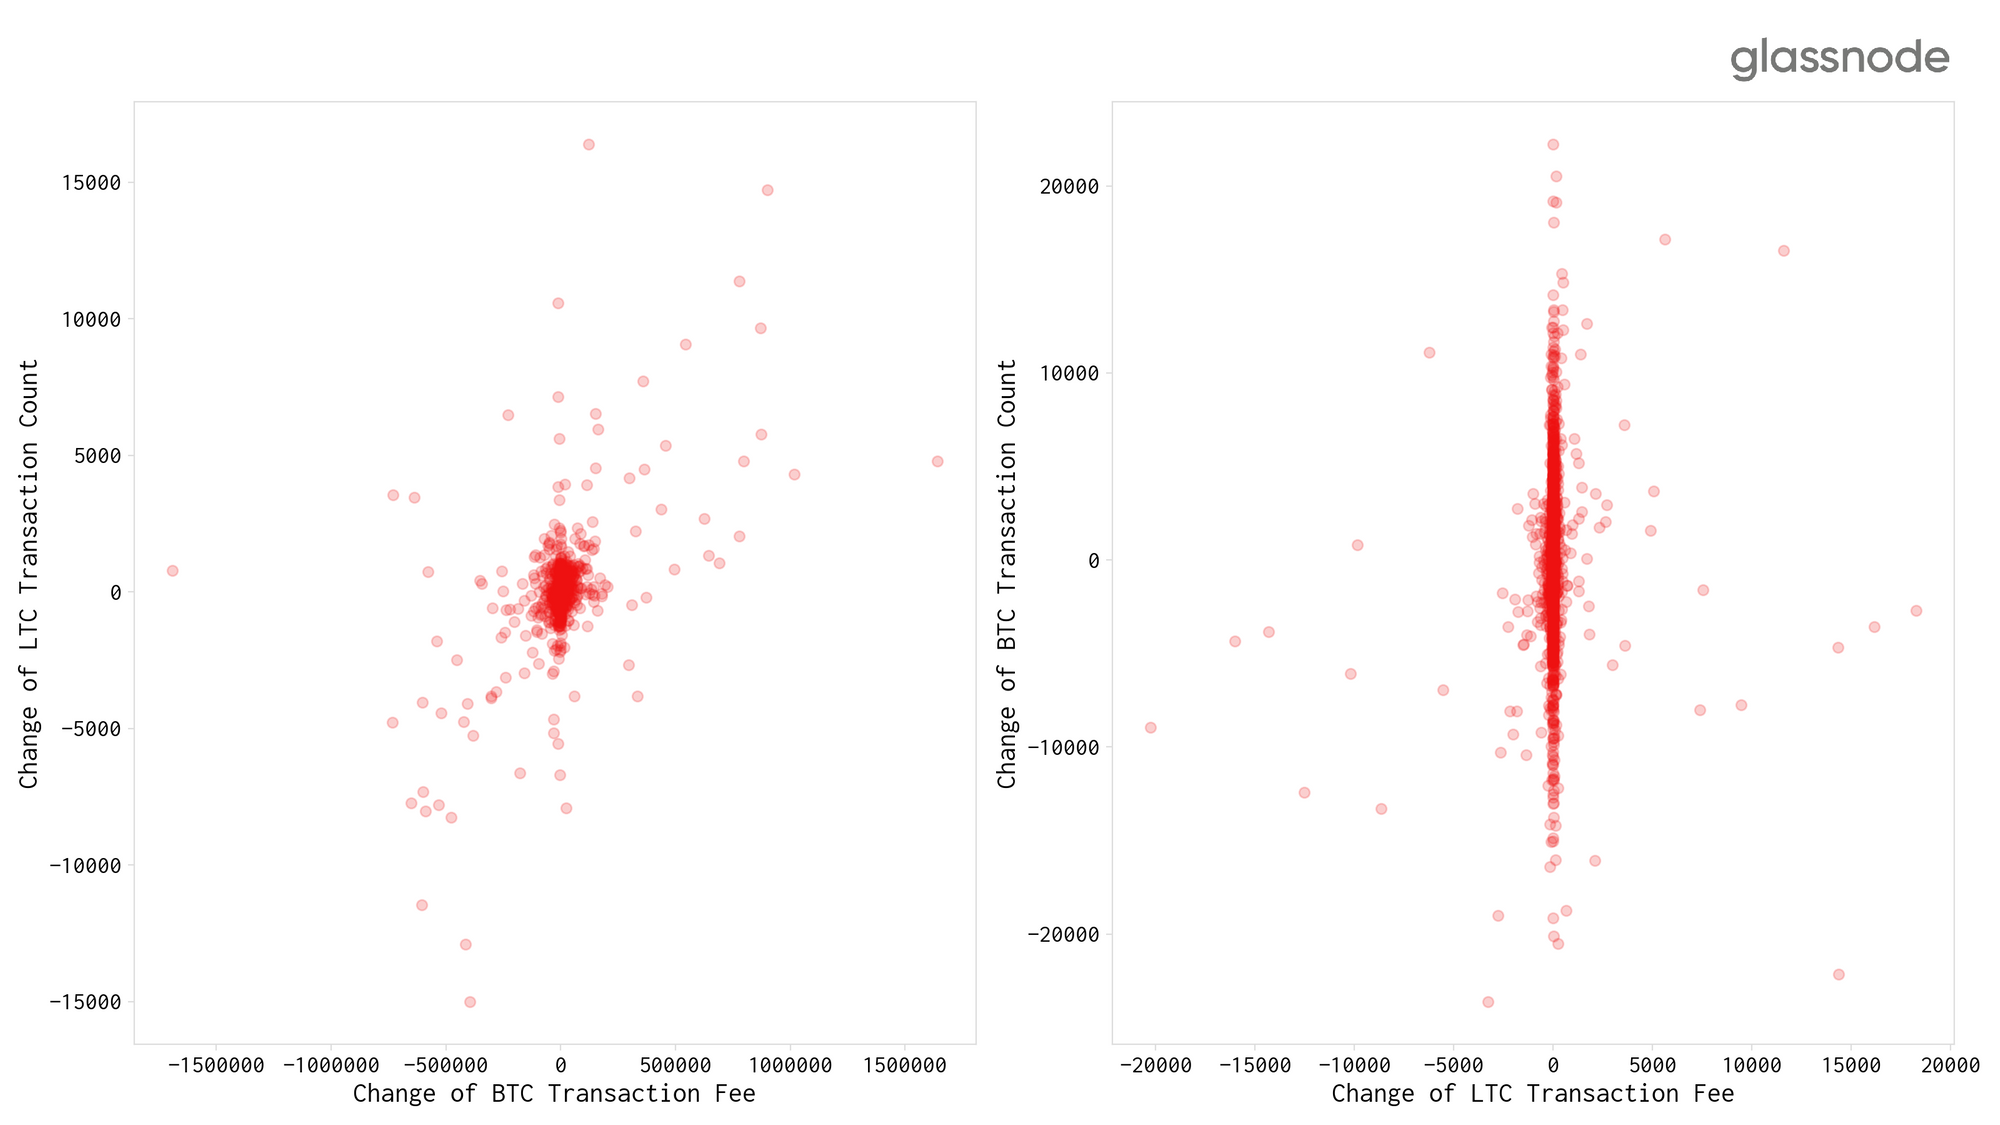
An asymmetry becomes visually apparent: Both scatter plots are substantially different. While the number of BTC transactions seems to behave independently of LTC fees (right plot), the opposite is not true (left plot). And this visual observation is backed by the corresponding numbers:
- Correlation coefficient of BTC fees vs LTC transactions (left plot): 0.64
- Correlation coefficient of LTC fees vs BTC transactions (right plot): 0.09
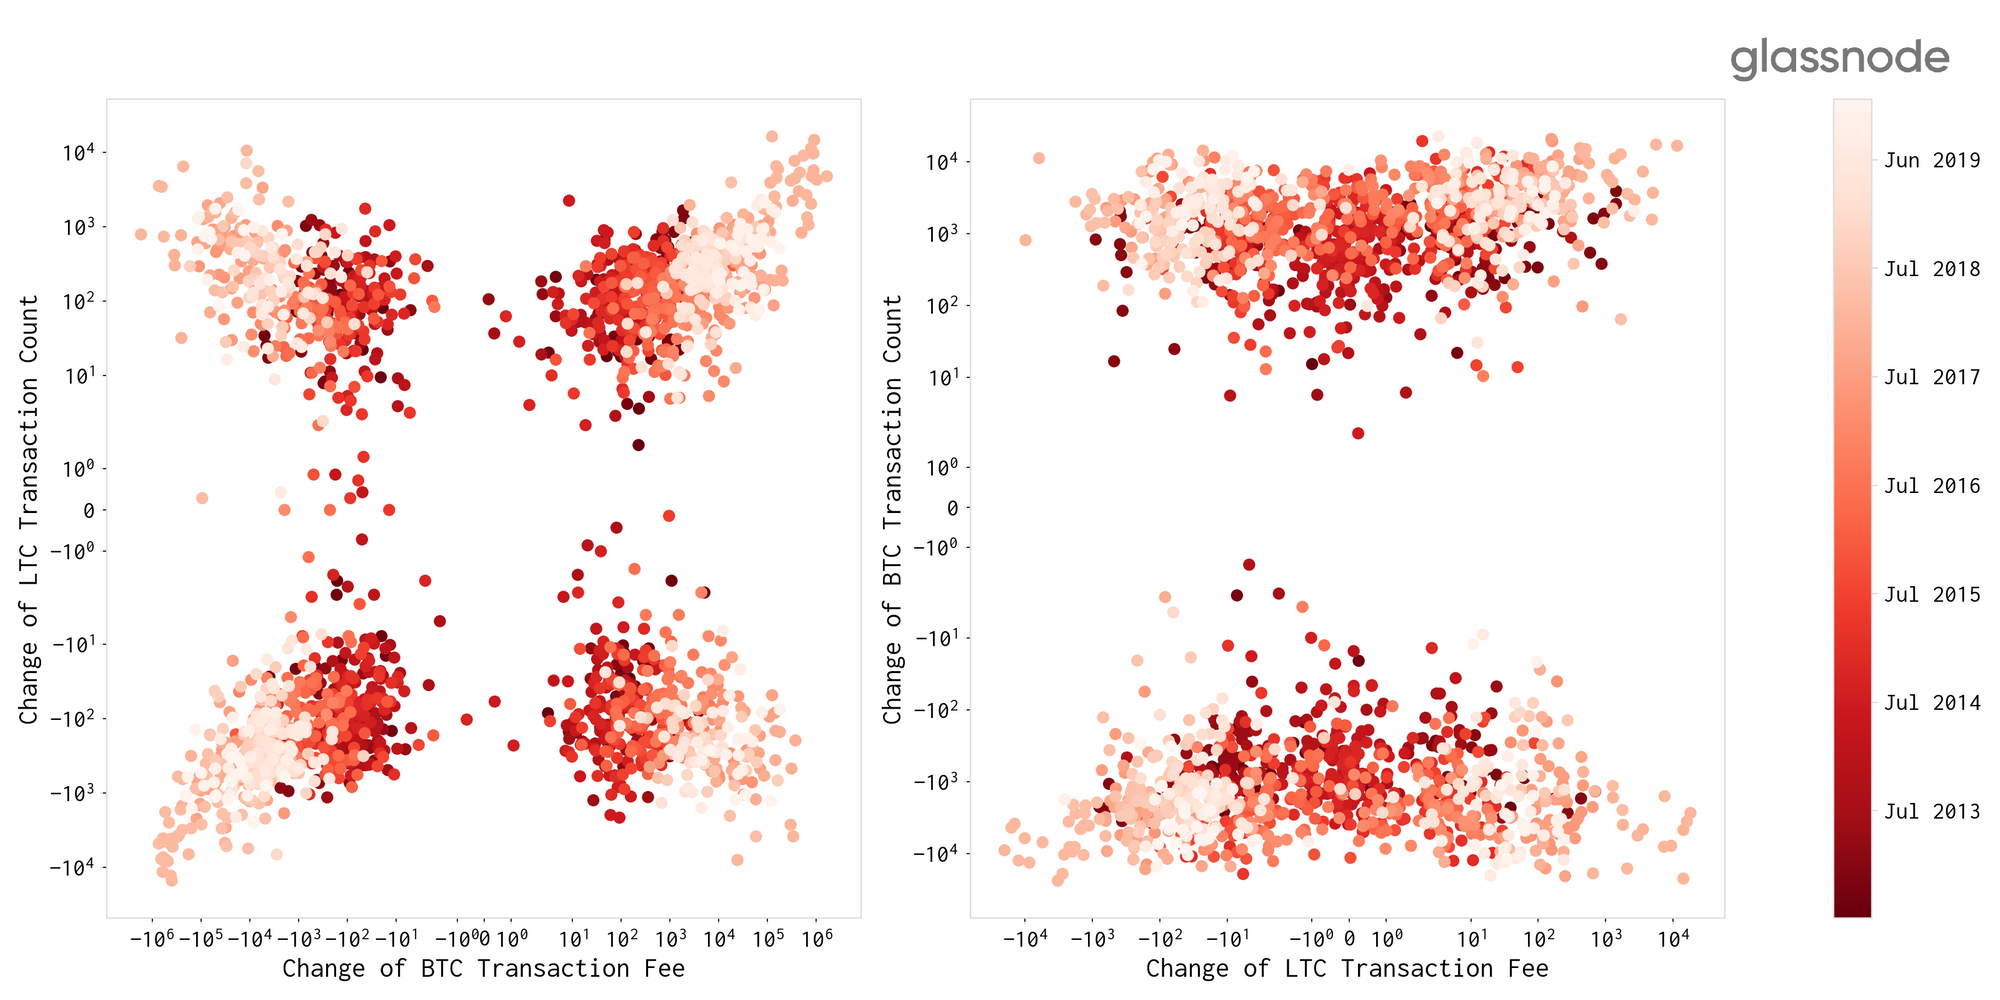
Visualising the above data on a symlog scale makes this asymmetry even more clear, and highlights a much stronger linear relationship between Bitcoin transaction fees and LTC transaction counts (left plot below). Note that over 63% of datapoints are located in the lower-left and upper-right quadrants.
What about Ethereum?
Is this a phenomenon specific to the comparison of Bitcoin and Litecoin? How do these effects look like when compared to on–chain metrics in the Ethereum network?
In the following we illustrate the above computed correlation asymmetry matrices, this time for BTC-ETH and LTC-ETH.
The first observation from these graphs is that the asymmetric correlation between Bitcoin and Ethereum in the left plot is substantially lower (at most moderately correlated) as compared to our BTC-LTC matrix above, suggesting that it is in particular Litecoin that shows increased activity when Bitcoin transactions become too expensive. Ethereum in contrast, seems to be much less affected by this phenomenon.
Importantly the LTC-ETH correlation asymmetry matrix (right plot) shows no real asymmetries (all values are close to zero). This serves as a baseline and suggests that the above observed asymmetry effect for BTC-LTC is a phenomenon particularly driven by the Bitcoin network and not a mere result of the global crypto market patterns.
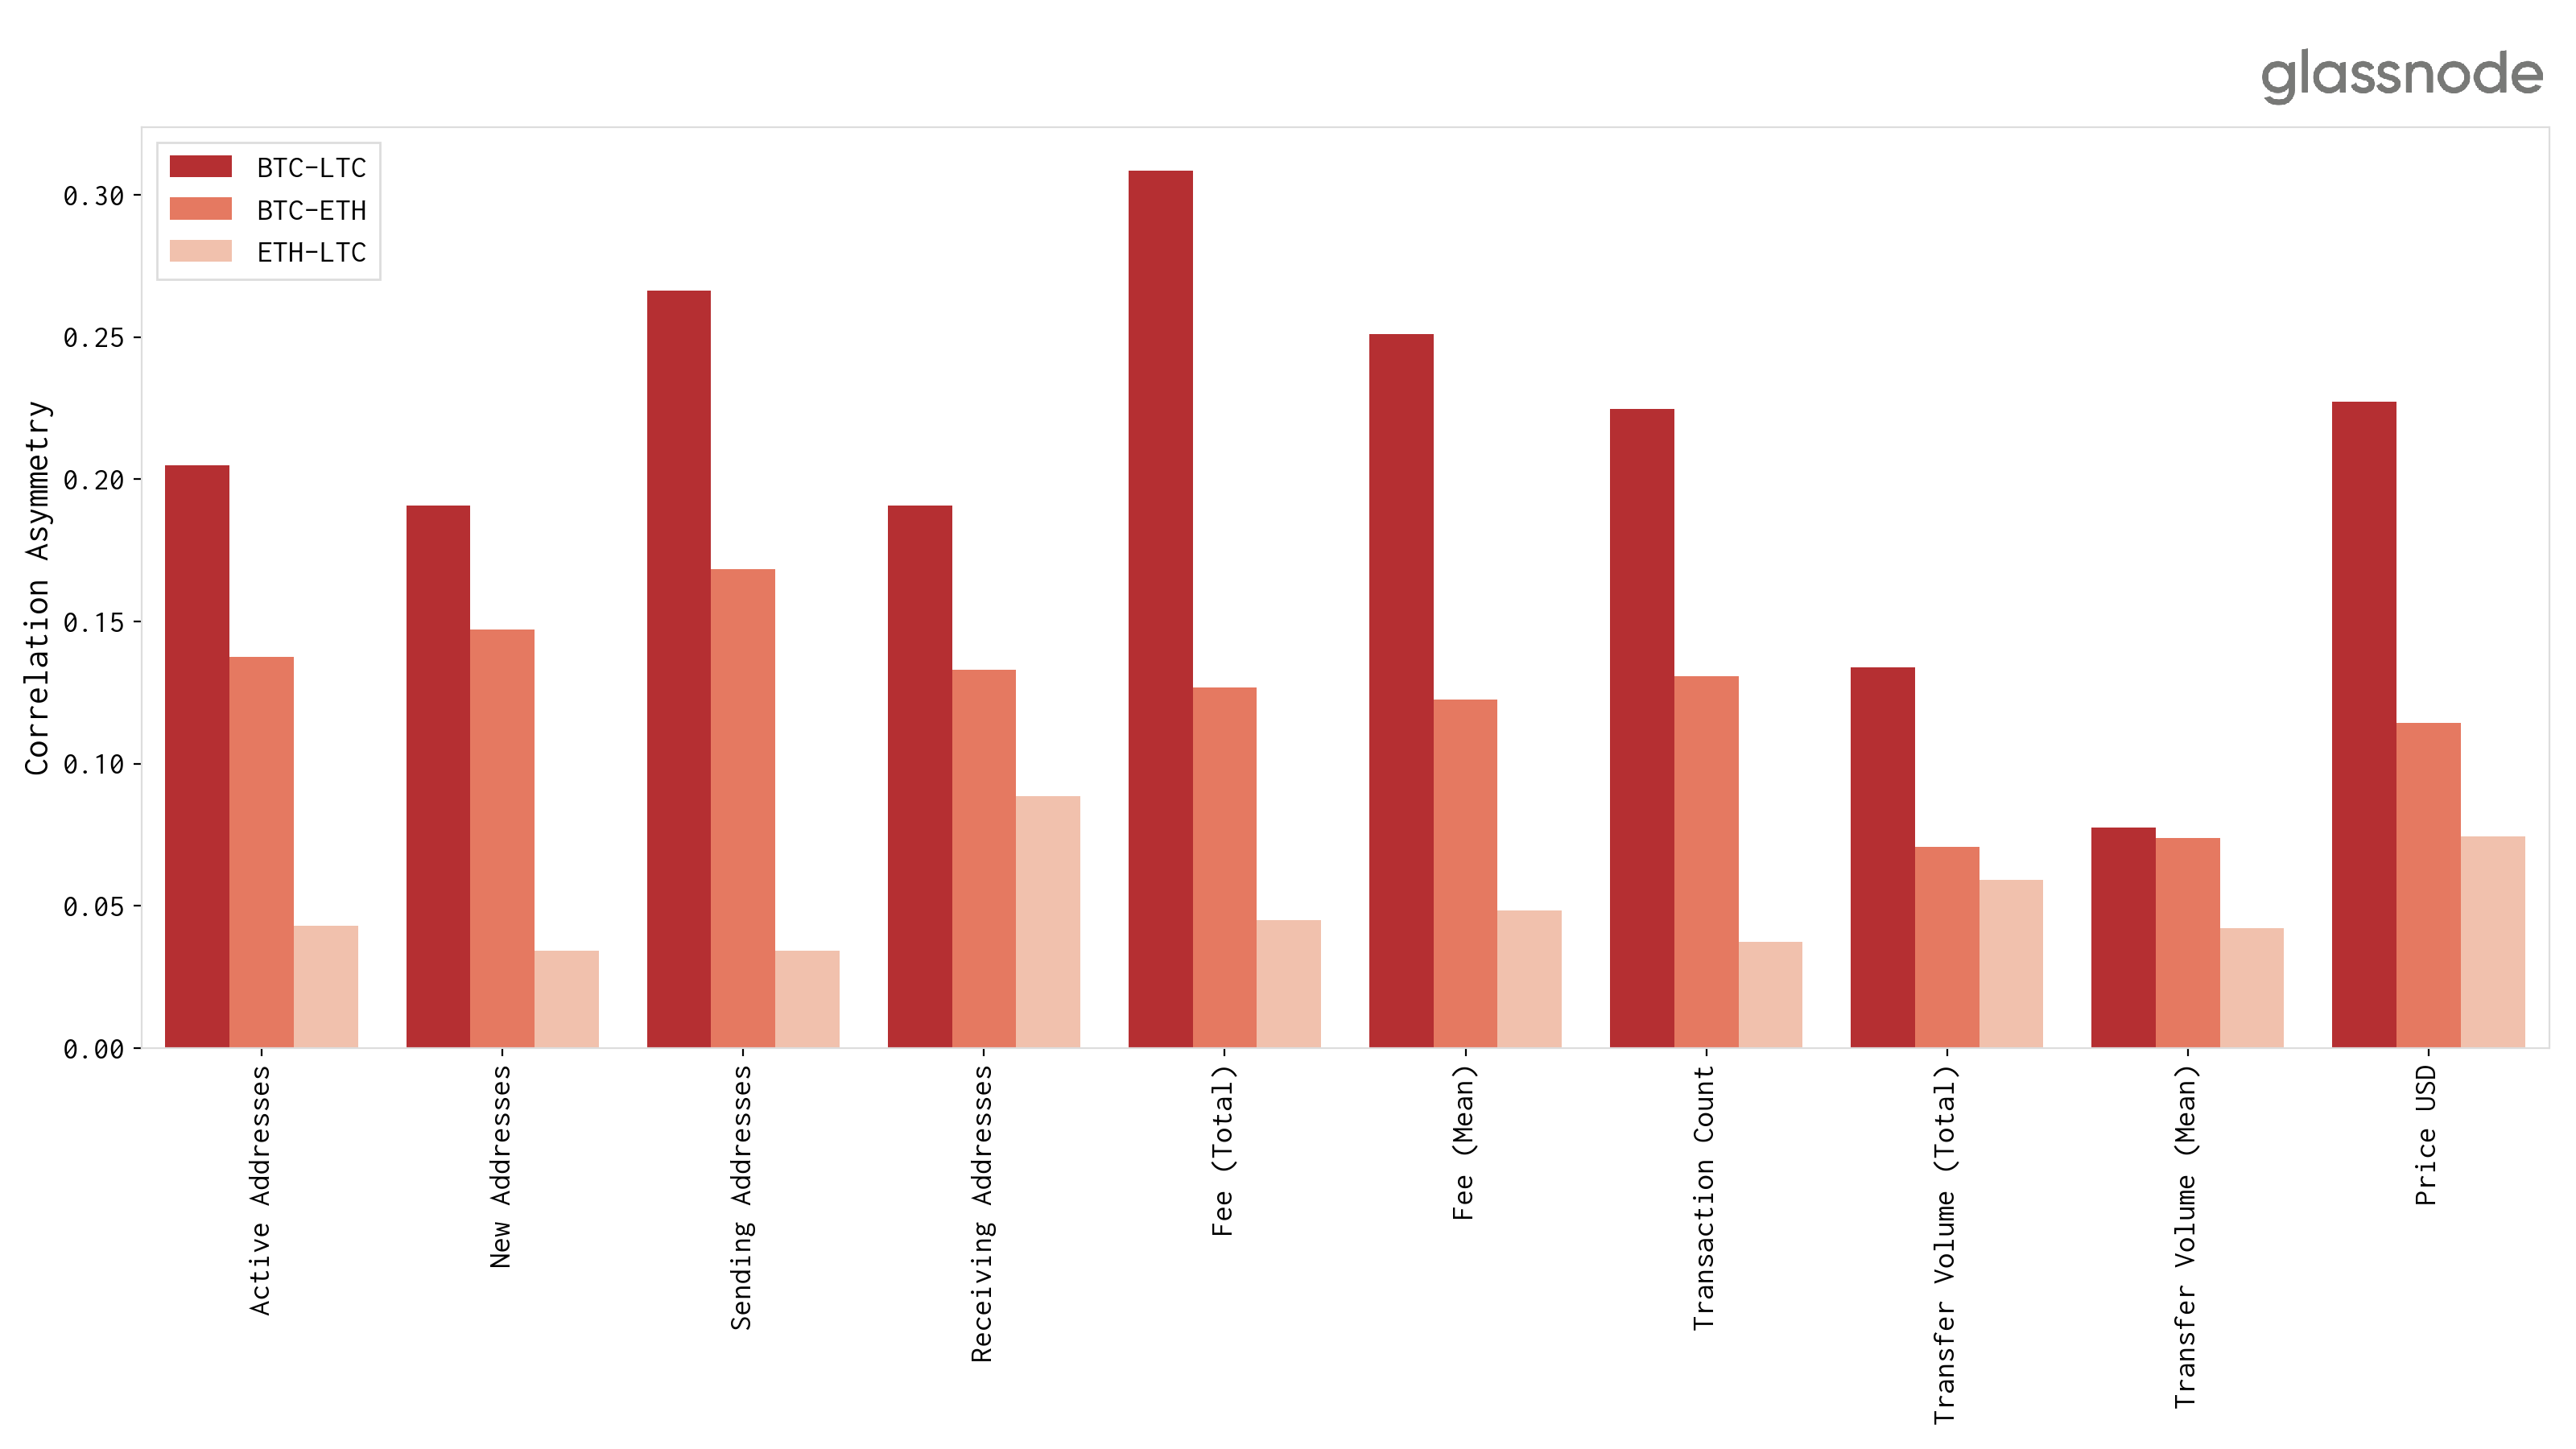
In summary, the differences in asymmetries of on–chain metric correlations are visualised below by taking the mean over correlation asymmetry values across each metric for each asset pair investigated here, clearly showing the strongest correlation asymmetries between Bitcoin and Litecoin metrics.
Conclusion
Analyses of on–chain data across blockchains can serve to shed light and understand the usage of crypto networks, not only in isolation but cross-chain, as interconnected components in the digital assets ecosystem.
In particular, our analyses show substantial correlations between on–chain metrics across multiple blockchains. Interestingly, many of these correlations are asymmetric, meaning that if you swap the metrics in the investigated metric pair between chains, the correlation vanishes. In the investigated networks, these asymmetries are most prominent between Bitcoin and Litecoin.
Notably, the data suggests that there are significant increases in Litecoin network activity when Bitcoin transaction fees rise. In order to be able to move funds faster and cheaper, users could be switching to the Litecoin network whenever the Bitcoin network congests and sending bitcoins becomes too expensive.

All analyses in this article were done using data from Glassnode Studio. For API access to this data visit the Glassnode API page.
Many thanks to Kilian Heeg for support with data analysis.
- Follow us and reach out on Twitter
- For on–chain metrics and activity graphs, visit Glassnode Studio
- For automated alerts on core on–chain metrics and activity on exchanges, visit our Glassnode Alerts Twitter
Disclaimer: This report does not provide any investment advice. All data is provided for information purposes only. No investment decision shall be based on the information provided here and you are solely responsible for your own investment decisions.