No, Bitcoin Ownership is not Highly Concentrated – But Whales are Accumulating
We analyze the distribution of Bitcoin across network participants, and show that BTC ownership disperses over time and is much less concentrated than often reported. Meanwhile, BTC supply held by whales has recently increased, suggesting institutional investors are entering.

A recent report by Bloomberg states that "2% of accounts control 95% of all Bitcoin". Bitinfocharts shows a similar distribution of BTC across addresses. And others have reported comparable statistics suggesting a vast concentration of wealth in the Bitcoin network.
The problem with these reports is that they analyze the distribution of BTC across network addresses. This leads to misleading statistics, which result in false narratives around BTC ownership among stakeholders.
In particular, this approach has two major caveats:
- Not all Bitcoin addresses should be treated equal. For instance, an exchange address holding the funds from millions of users needs to be distinguished from an individual's self-custody address.
- A Bitcoin address is not an "account". One user can control multiple addresses, and one address can hold the funds from multiple users.
In the present work, we analyze the distribution of Bitcoin across entities of different sizes, taking into consideration addresses that belong to exchanges and miners as well. We aim to shine more light on the true underlying distribution of BTC across network participants, and show that Bitcoin ownership is much less concentrated than often reported – and has in fact seen a dispersion over the years. In addition, we demonstrate that over the course of the past year the BTC supply held by whale entities has considerably increased, suggesting an inflow of institutional investors.
Excursion on Bitcoin Entities: Bitcoin addresses are the basic public addresses recorded on the blockchain that send and receive BTC. Through the application of a variety of heuristics and advanced clustering algorithms, one can identify with very high confidence which cluster of addresses are controlled by the same participant, i.e. network entity. This creates an upper bound for the actual number of network participants, and subsequent analyses based on entities are therefore closer to the true underlying number. Please refer to our previous work for more information.
Bitcoin Supply Distribution
We divide network entities according to their Bitcoin holdings into the following marine species:
- Shrimps (<1 BTC)
- Crab (1-10 BTC)
- Octopus (10-50 BTC)
- Fish (50-100 BTC)
- Dolphin (100-500 BTC)
- Shark (500-1,000 BTC)
- Whale (1,000-5,000 BTC)
- Humpback (>5,000 BTC).
In addition, we remove known exchange and miner entities from these categories and treat them separately.
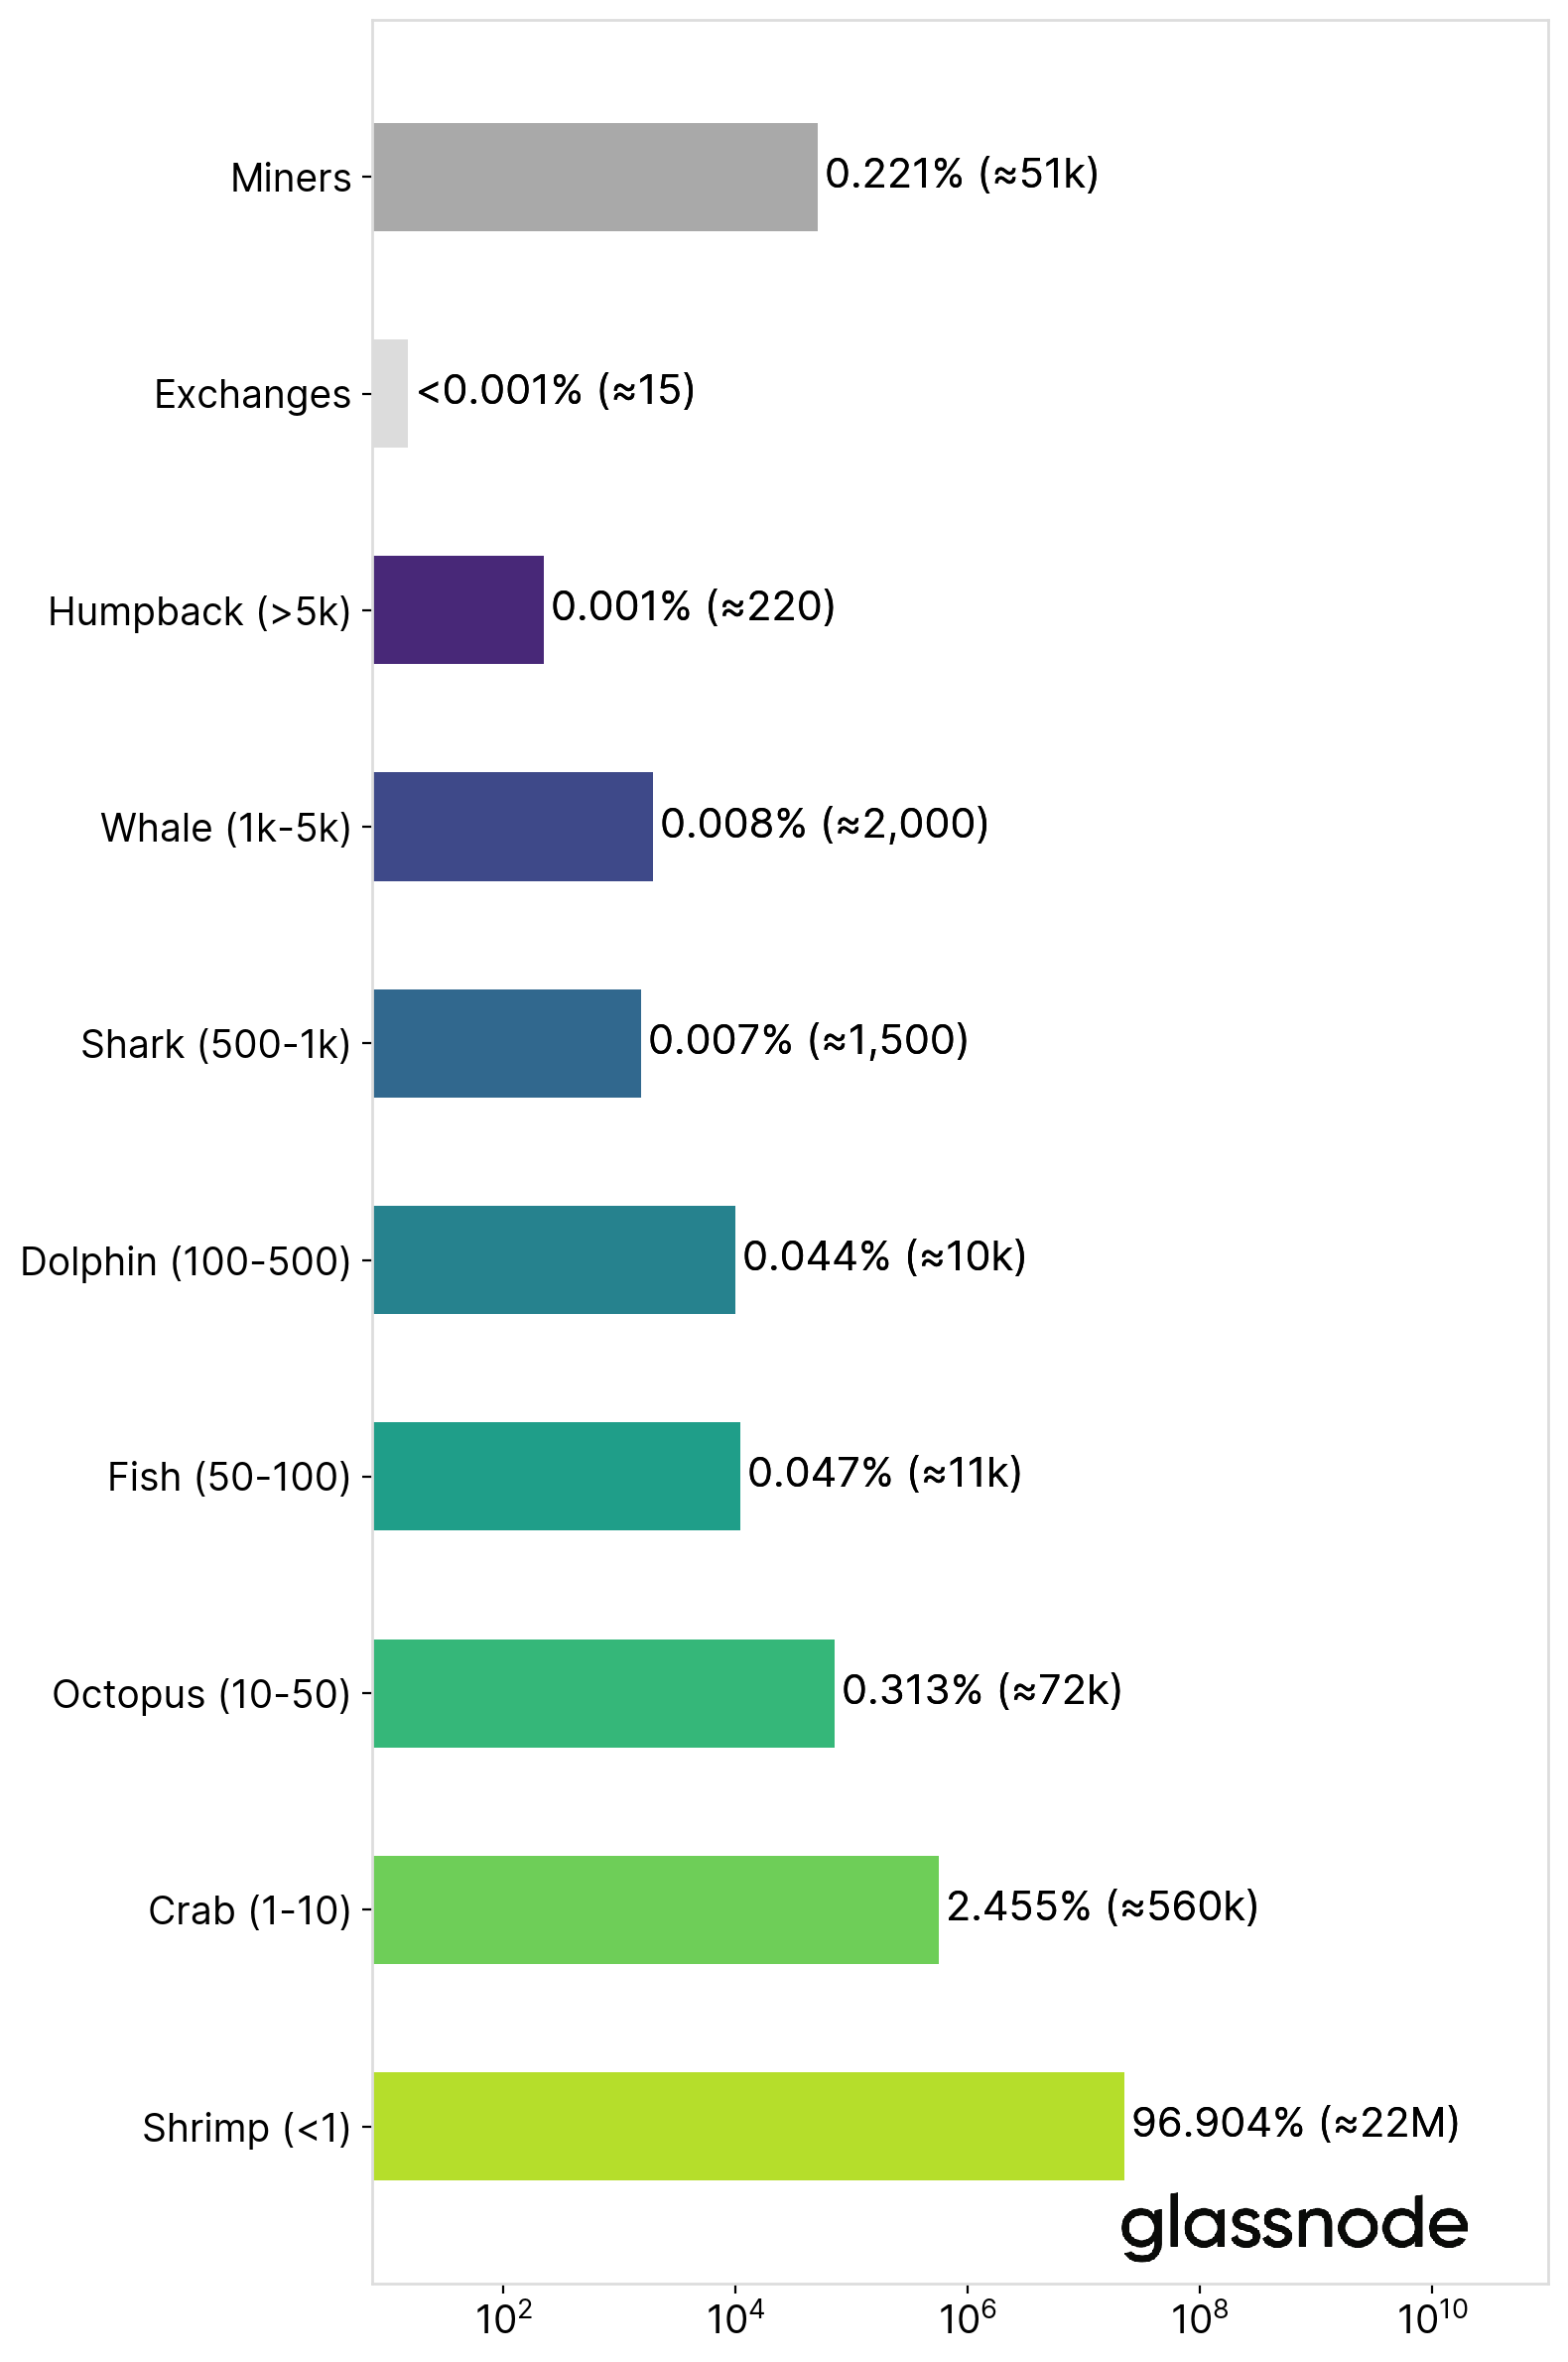
As of January 2021, the Bitcoin supply distribution across these categories looks as follows:
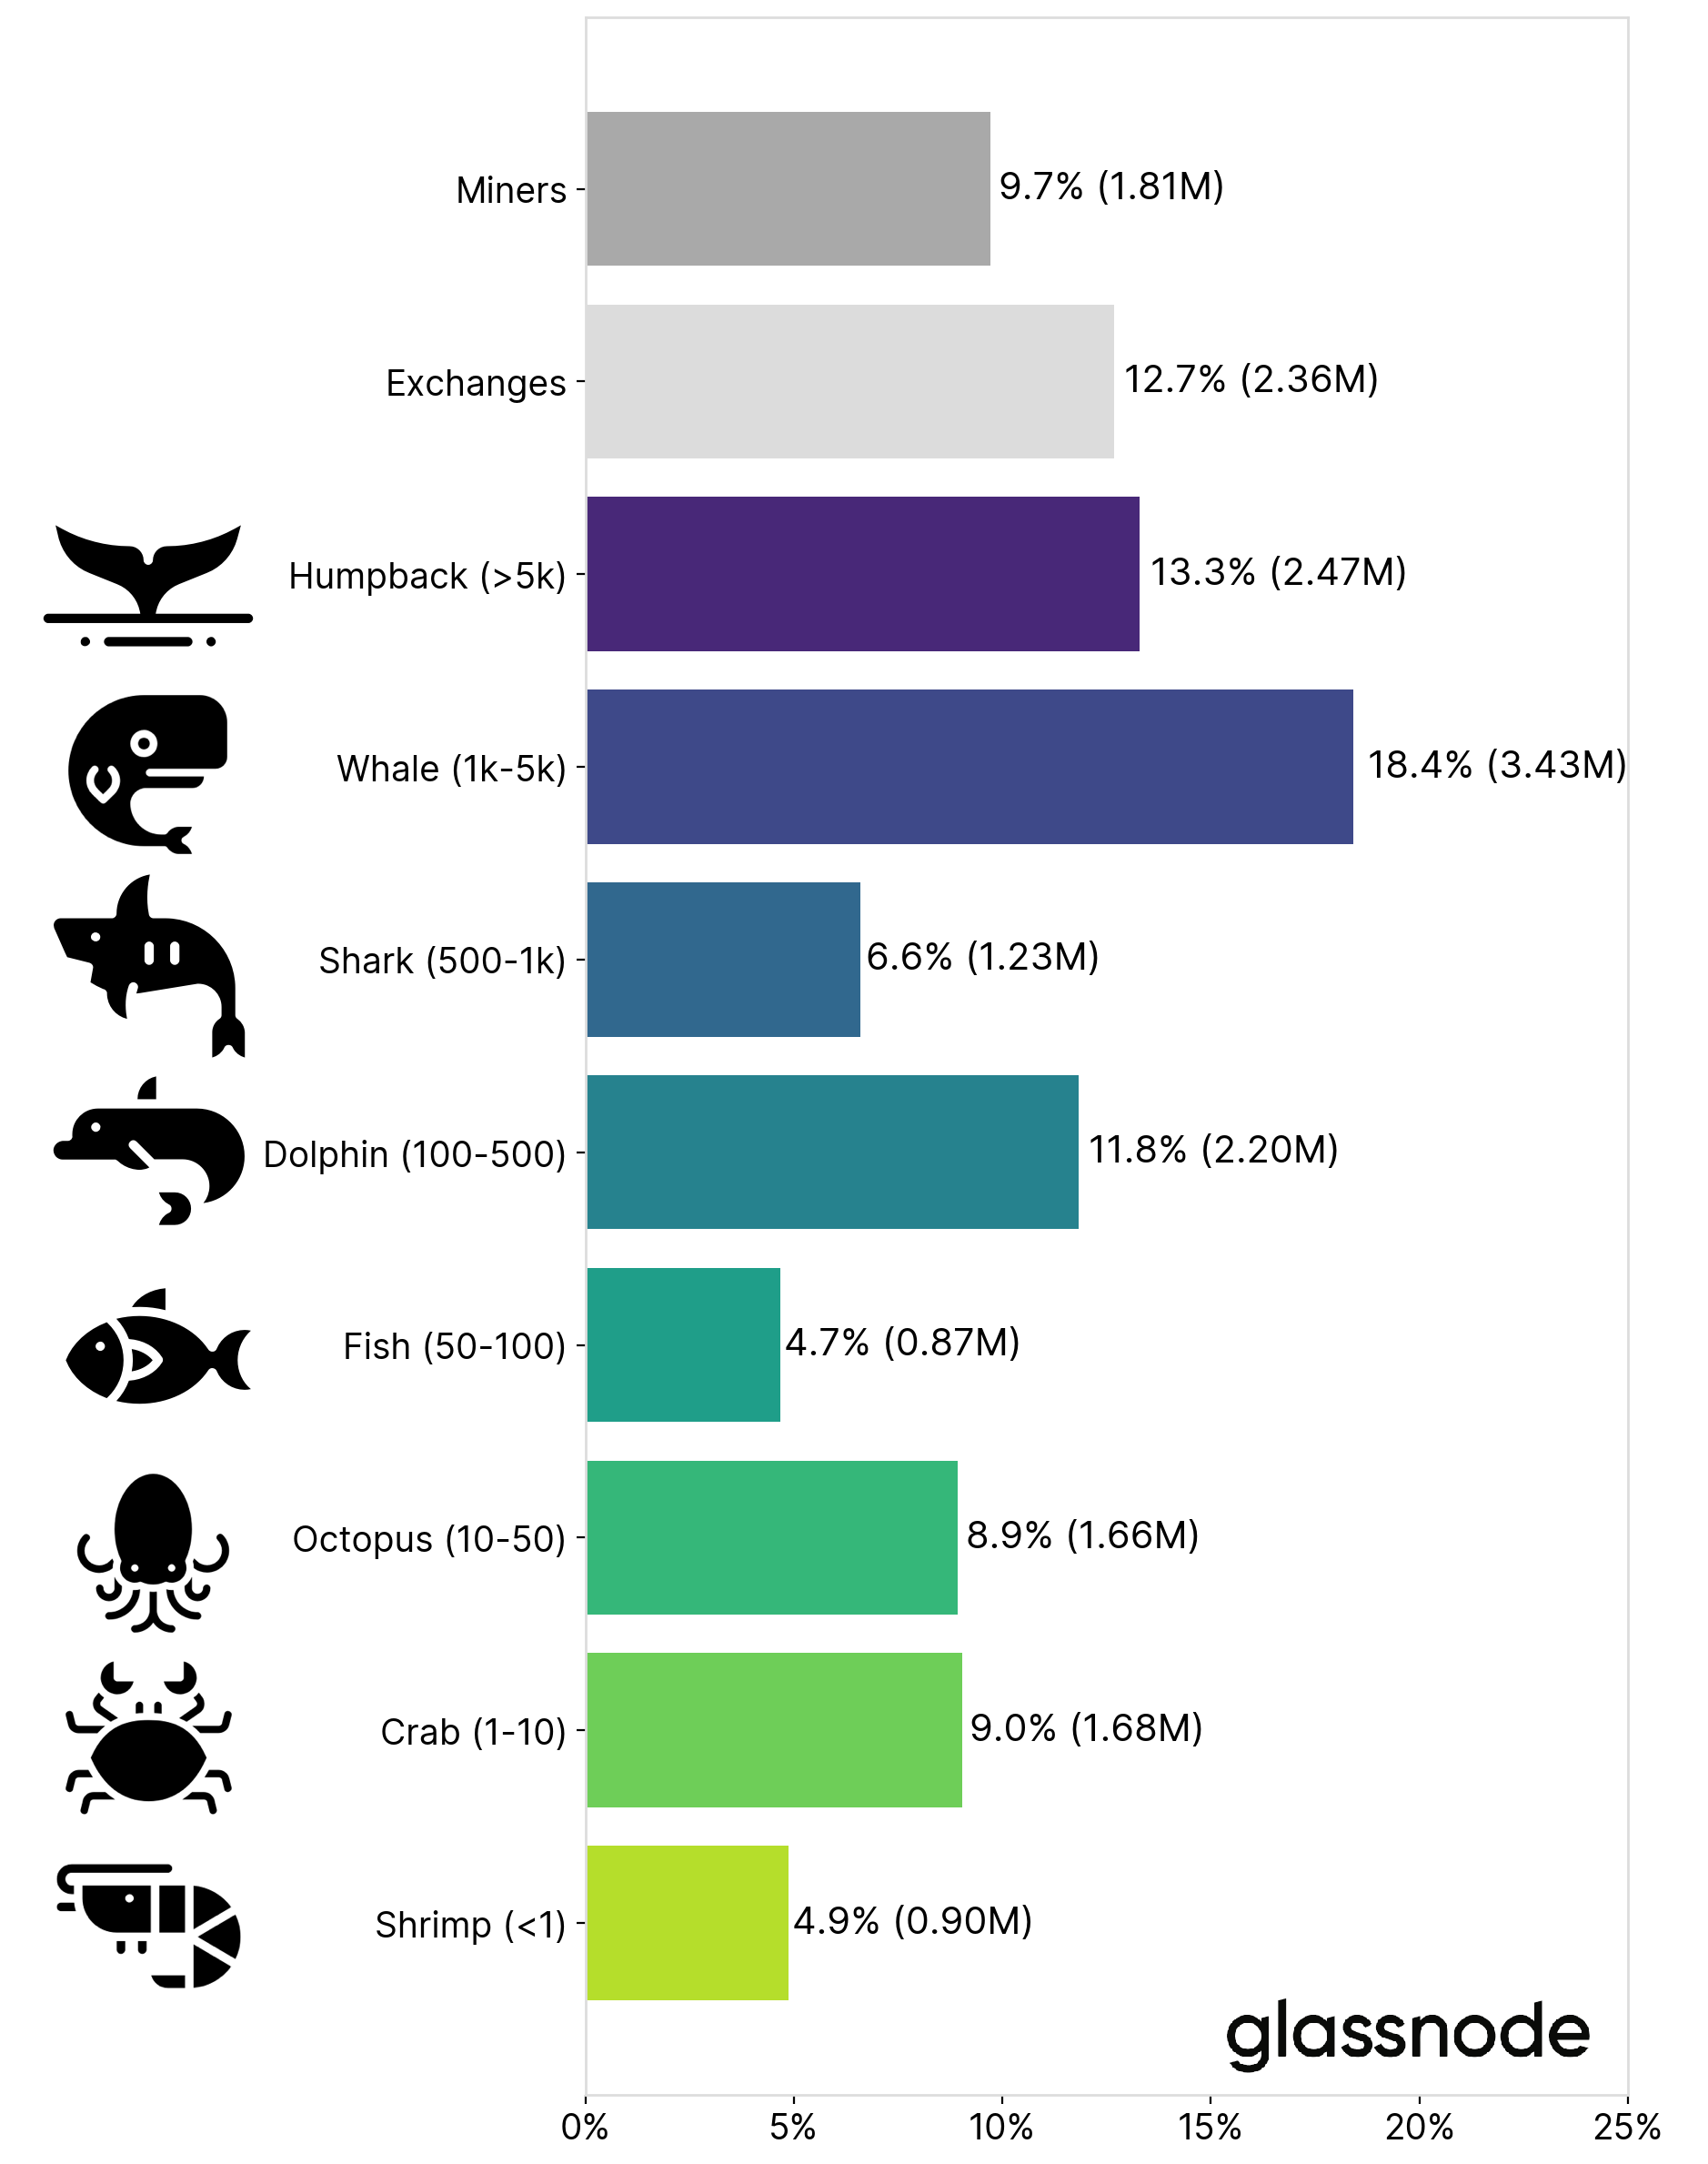
On the large end of the spectrum whales and humpbacks are the biggest non-exchange entities that together control around 31% of the Bitcoin supply. These are most likely institutions, funds, custodians, OTC desks, and other high net worth individuals.
On the other hand, smaller entities holding up 50 BTC each (shrimp, crab, and octopus) control almost 23% of the supply. This shows that a substantial amount of bitcoins are in the hands of retail investors.
Figure 2 + 3 show the supply distribution across entities over time. In particular, it becomes apparent that the (relative) amount of BTC held by smaller entities has been growing over the course of Bitcoin's lifetime.
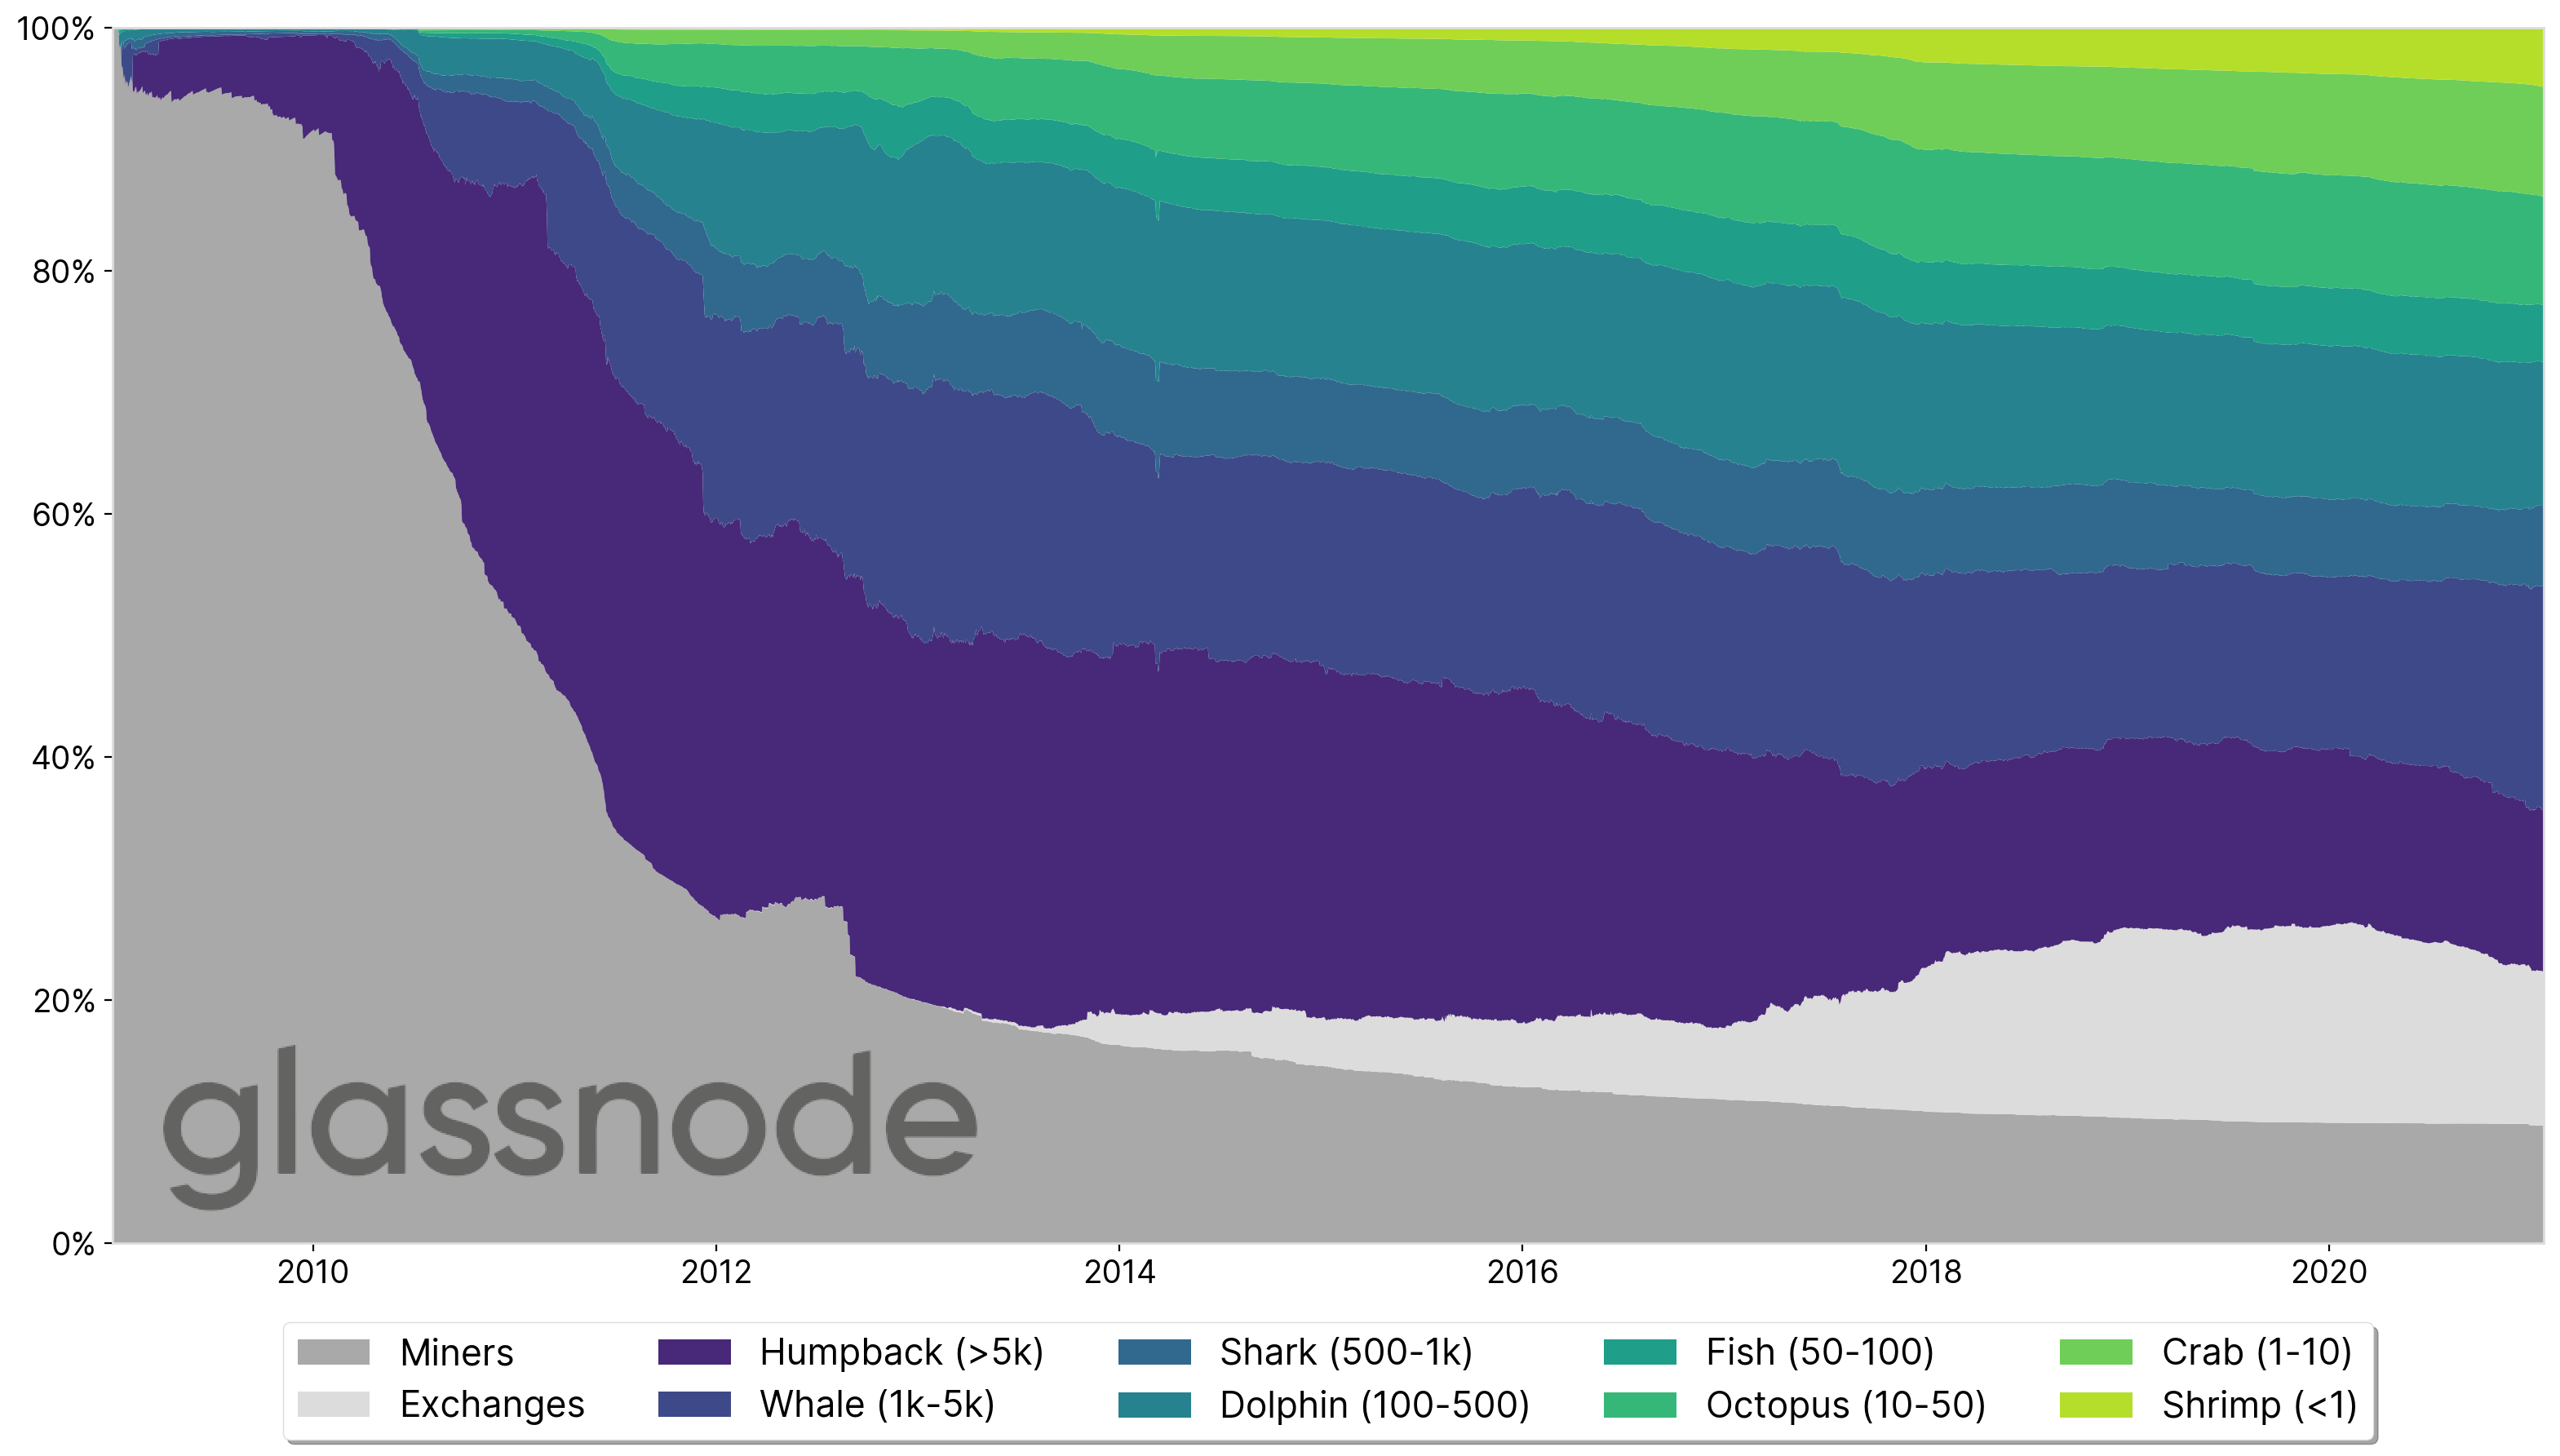
Note that there is an uptrend in whale ownership that occurred over the past year. We address this matter further below.
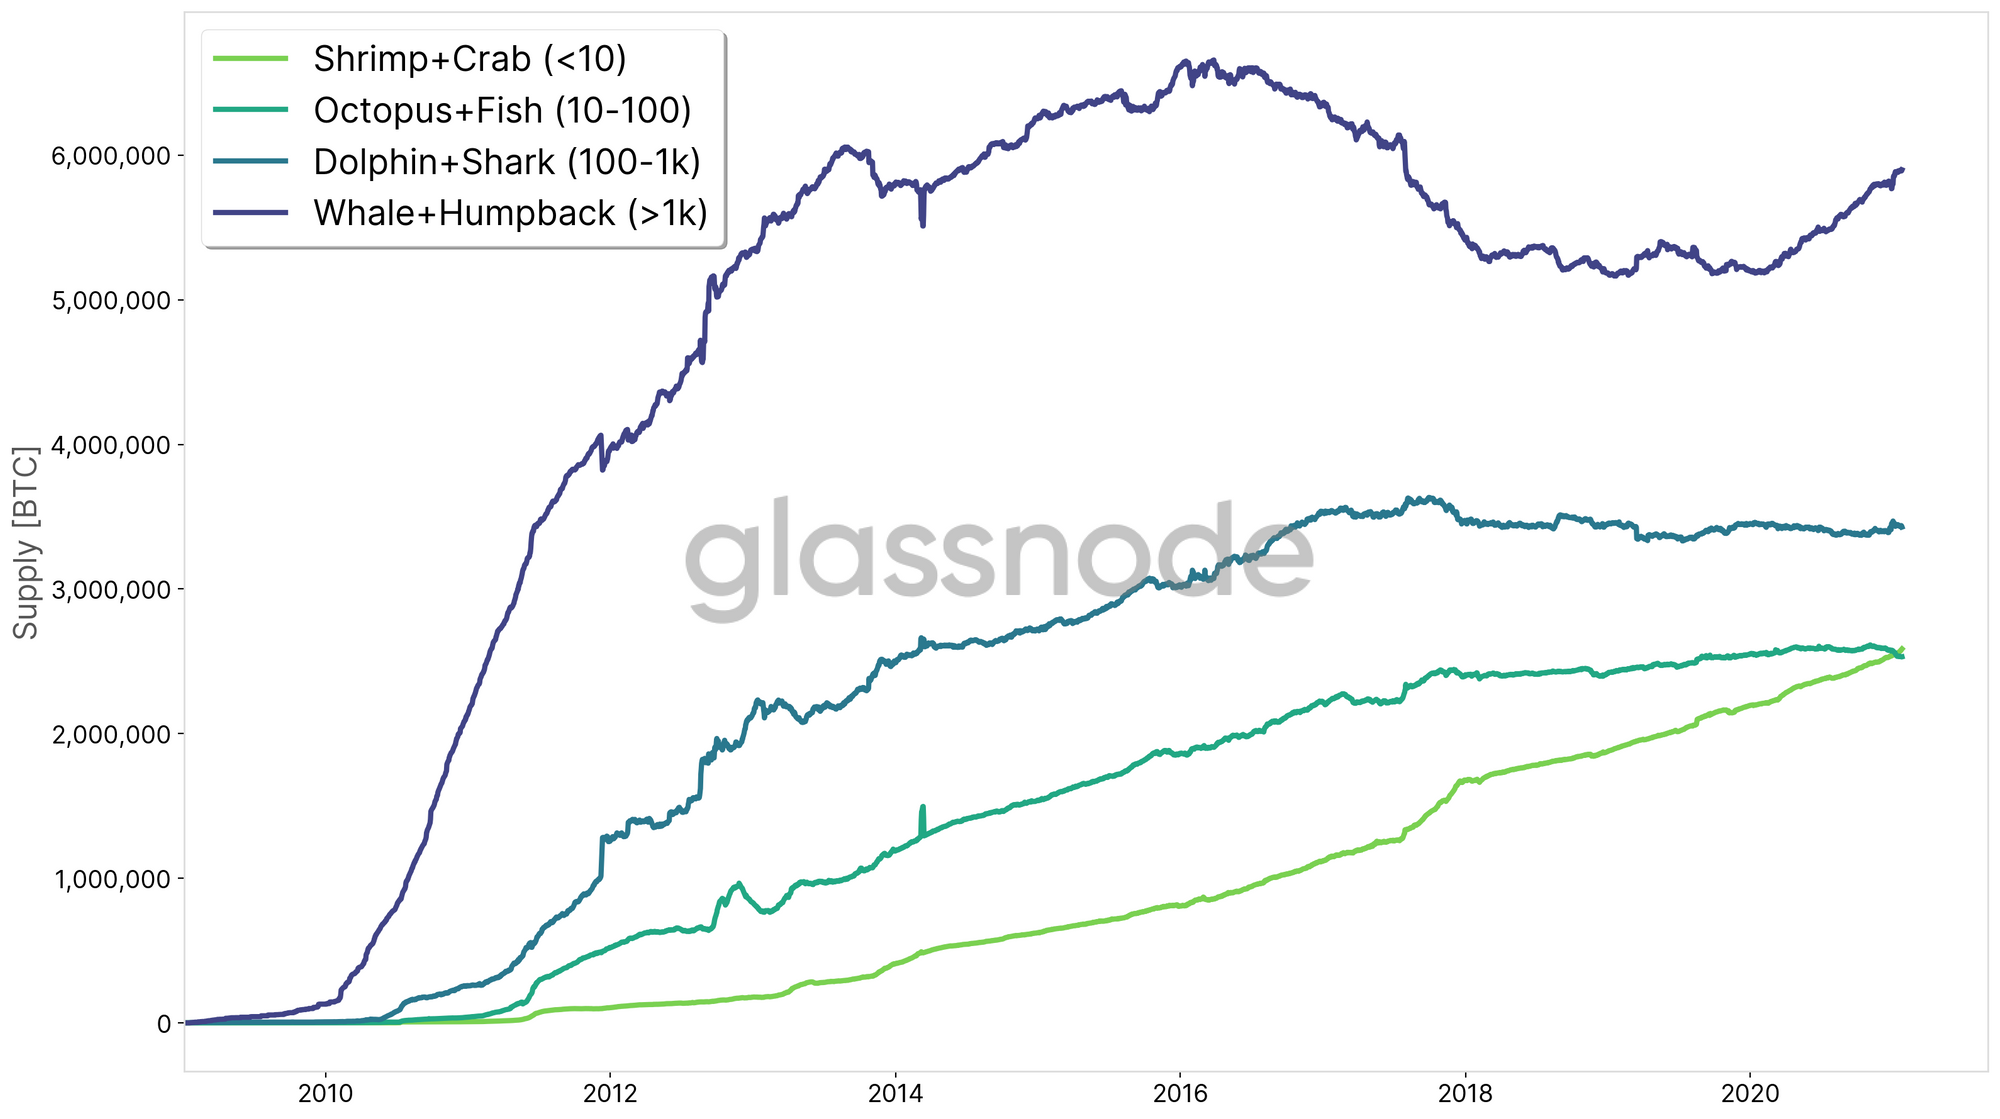
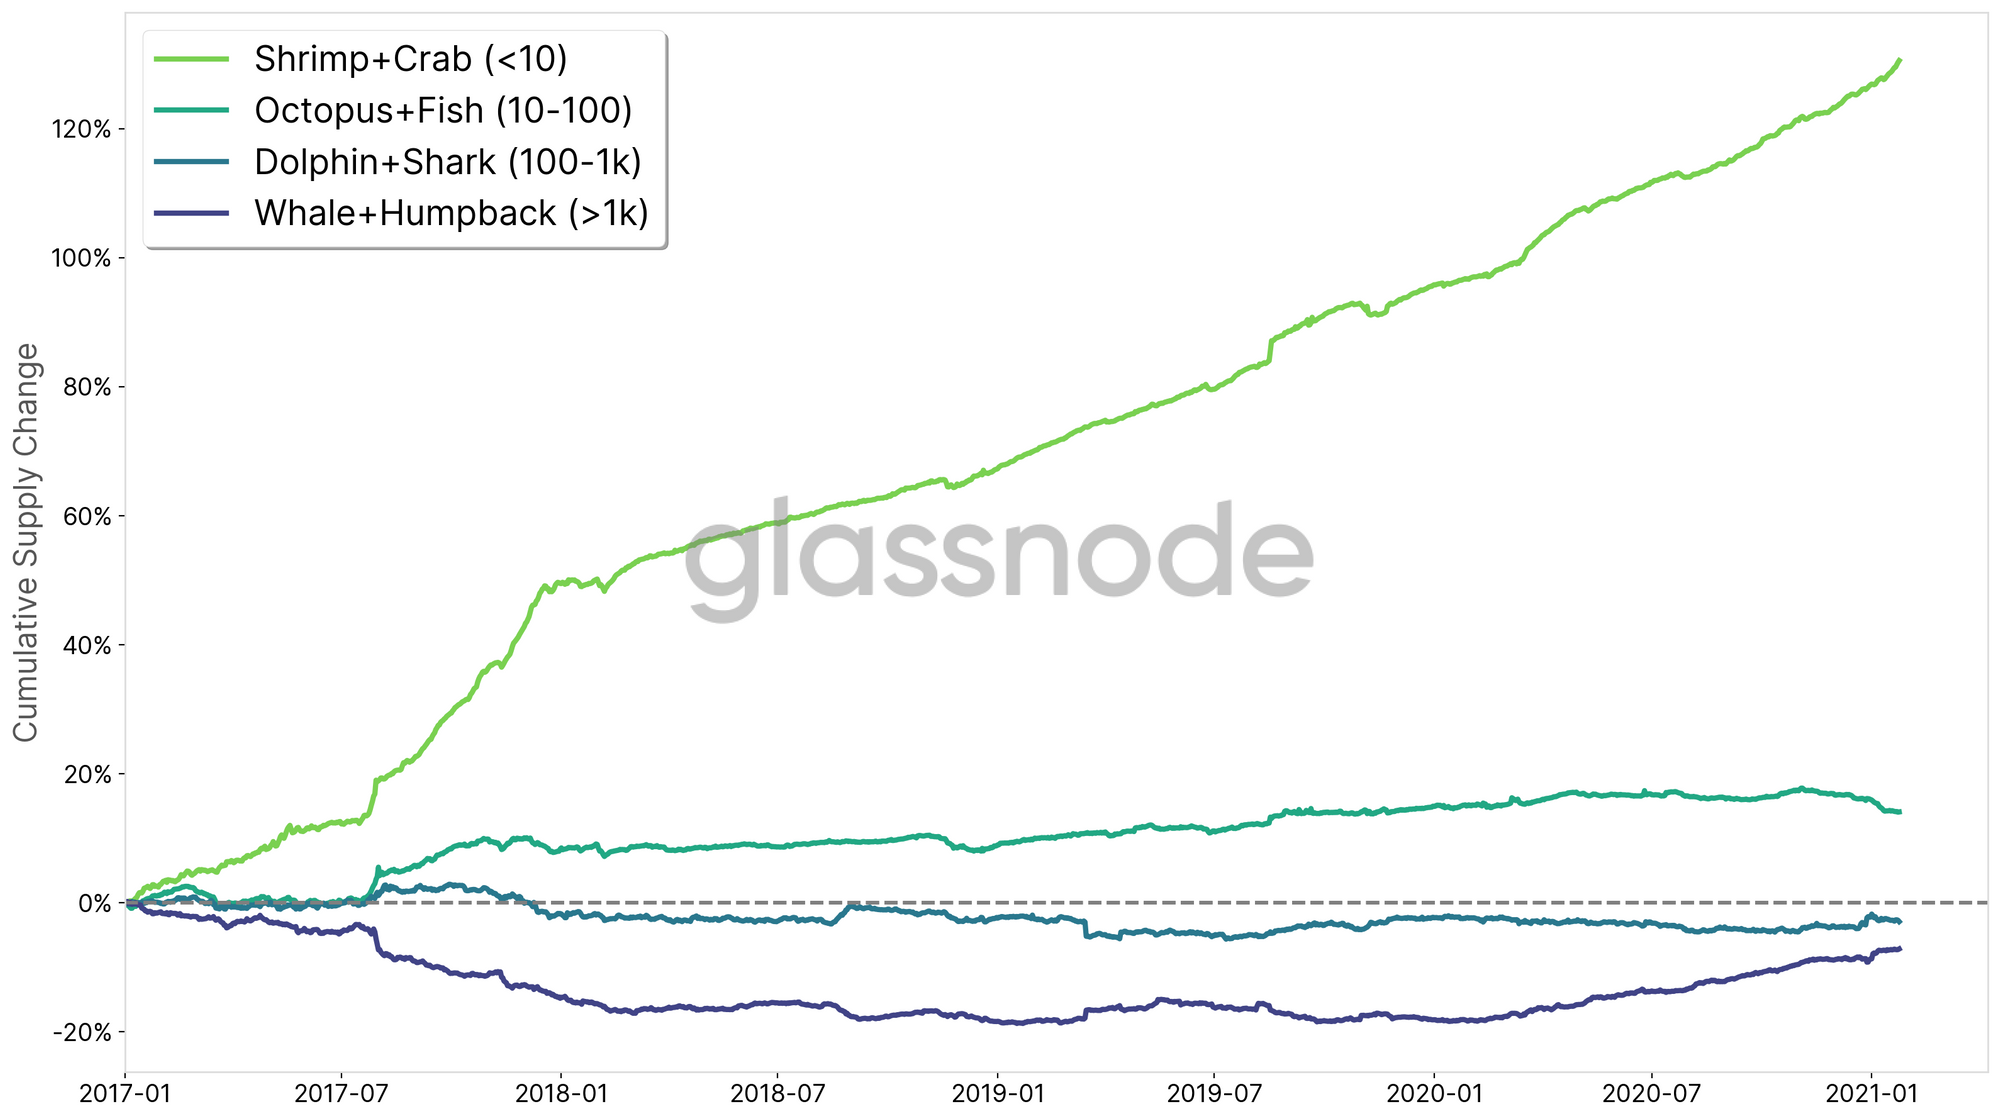
The shift towards a more dispersed ownership of BTC supply over the past years becomes more apparent when we look at the relative change in supply across these entity sizes. Figure 4 shows how the smallest players (shrimps + crabs) have increased their holdings by 130% since 2017. The second smallest holders (octopus + fish) have also grown their supply by 14% in this time period.
On the other hand, large entities (dolphins + sharks as well as whales + humpbacks) have decreased their BTC ownership by -3% and -7%, respectively.
The Number of Entities
Now, we can also take a look at the number of entities associated with the above defined categories. Figure 5 shows the estimated number of participants in each holder category.
As expected, the number of estimated entities is heavily skewed towards small holders. Relating these numbers to above supply holdings, we arrive at the following graph giving us an insight about the Bitcoin wealth distribution:
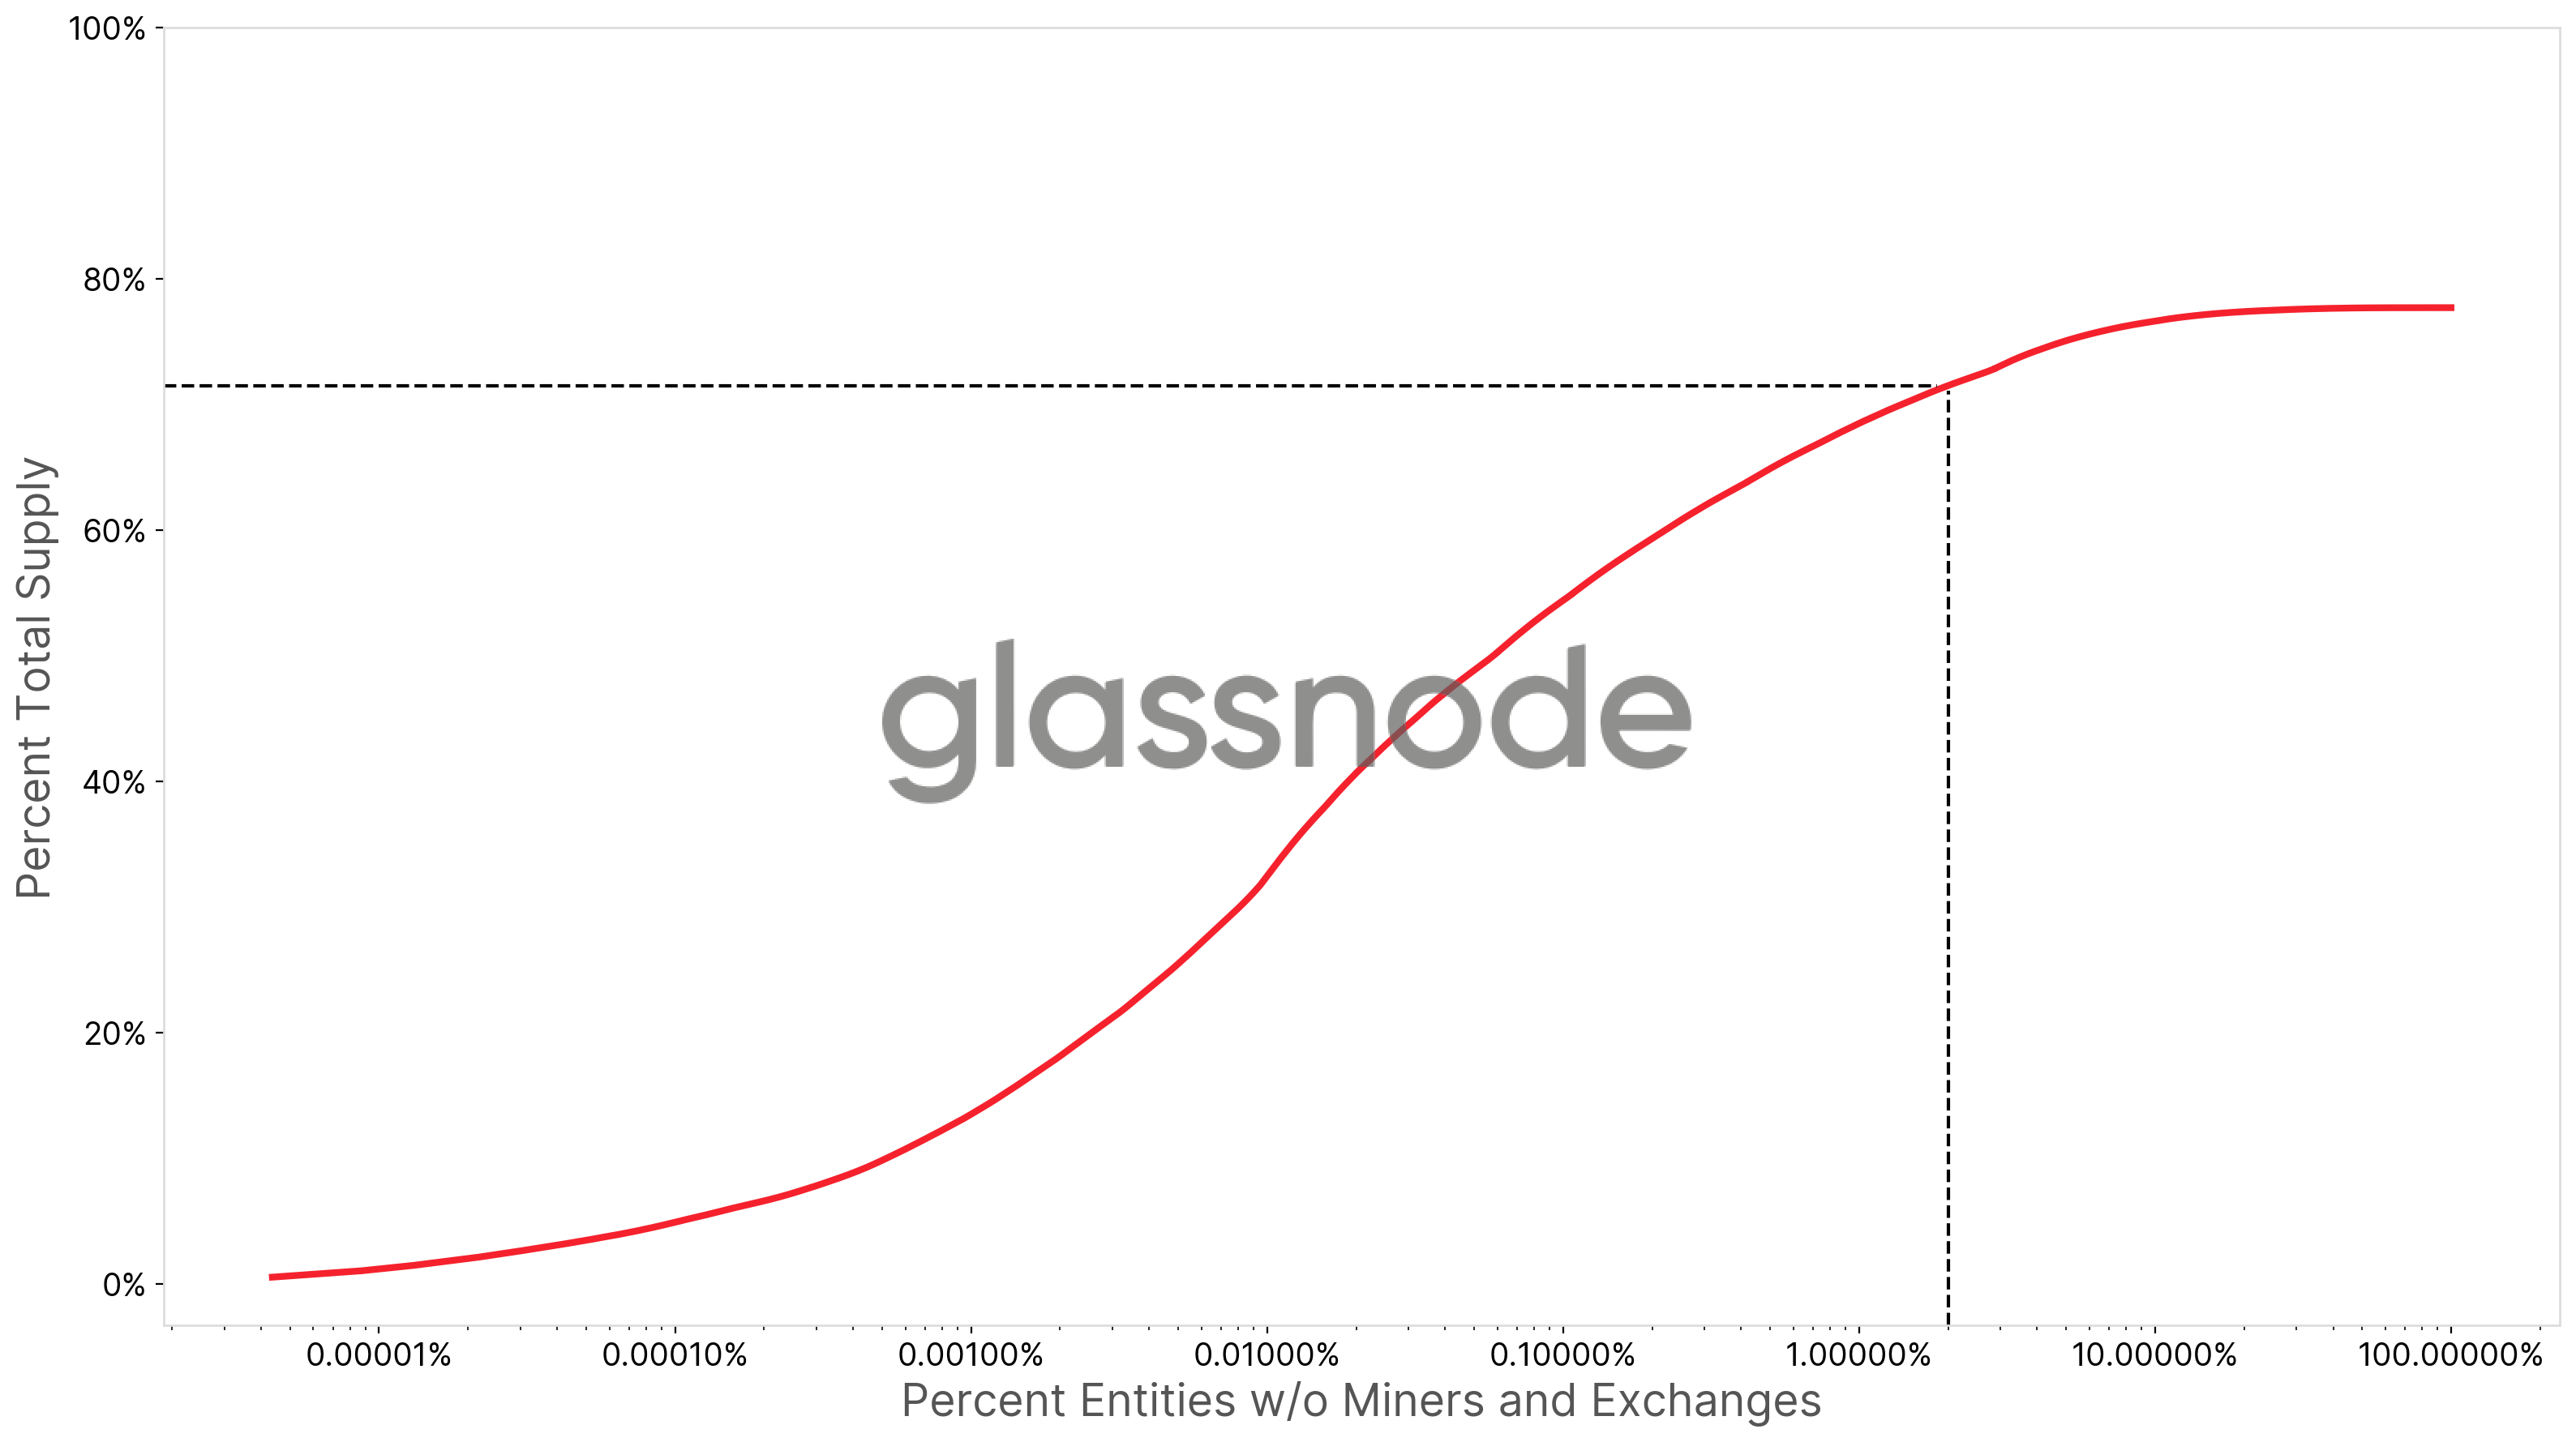
We can derive that around 2% of network entities control 71.5% of all Bitcoin. Note that this figure is substantially different from the often propagated "2% control 95% of the supply".
Discussion
The above figures are an estimate for an upper bound of the true distribution of Bitcoin ownership. We expect the actual distribution to be more evenly distributed across entity sizes.
Here are several points to take into consideration:
- Custodians. Grayscale and other institutional custody services are not accounted for in this analysis. However, their BTC is most likely located in the whale and humpback buckets. Given that their holdings (Grayscale has ~650,000 BTC at the time of writing) are owned by multiple participants, this would shift some of the whale supply towards smaller players.
- Lost coins. Many lost coins are from the early Bitcoin days, before best practices of how to hold BTC were not commonly adopted. In addition, given the low price of Bitcoin early on, large amounts of BTC were held in single addresses/wallets. Factoring in lost coins would potentially add to a push towards a more widespread supply distribution.
- Wrapped BTC. Currently, there are around 115,000 BTC wrapped in the WBTC ERC20 token. The custodian stores those BTC in addresses that all have a balance of at least 1,000 BTC. Again, given that these coins belong to many investors, the ownership of BTC disperses further across entities.
- The estimated number of small network entities. The total number of network entities is most likely much lower. Our methodology is very conservative, meaning that we optimize to avoid false-positives. However, many addresses could still fail to be clustered into a single entity. After all, not all heuristics and clustering algorithms will always be immediately triggered, especially if coins don't move on-chain. For instance, the current accumulation supply (i.e. supply in addresses that have never spent funds) is currently at 2.6M BTC. This effect is especially true for small entities (e.g. shrimps), meaning that the actual number of network participants is most probably significantly lower for these ranges.
- Supply on exchanges. Exchange users can have a large impact on the above distributions. The estimated number of users on exchanges is in the ballpark of 130 million. It is reasonable to assume that the grand majority of those are retail investors, located in the small entity buckets. Including the exchanges into the participants' buckets would have two effects: The number of small entities would heavily increase, skewing the count distribution even more. On the other hand, allocating the exchange supply (2.3M BTC) to the small buckets will flattens the supply distribution more towards retail. The exact interplay of these two factors needs to be further assessed.
The Rise of Whales: Institutional Investors are Entering
As mentioned above, in the past couple of months there has been a significant increase in the number of whales and the supply they hold. This can be seen both in their recent supply increase, as well as in the rise in the absolute number of whale entities.
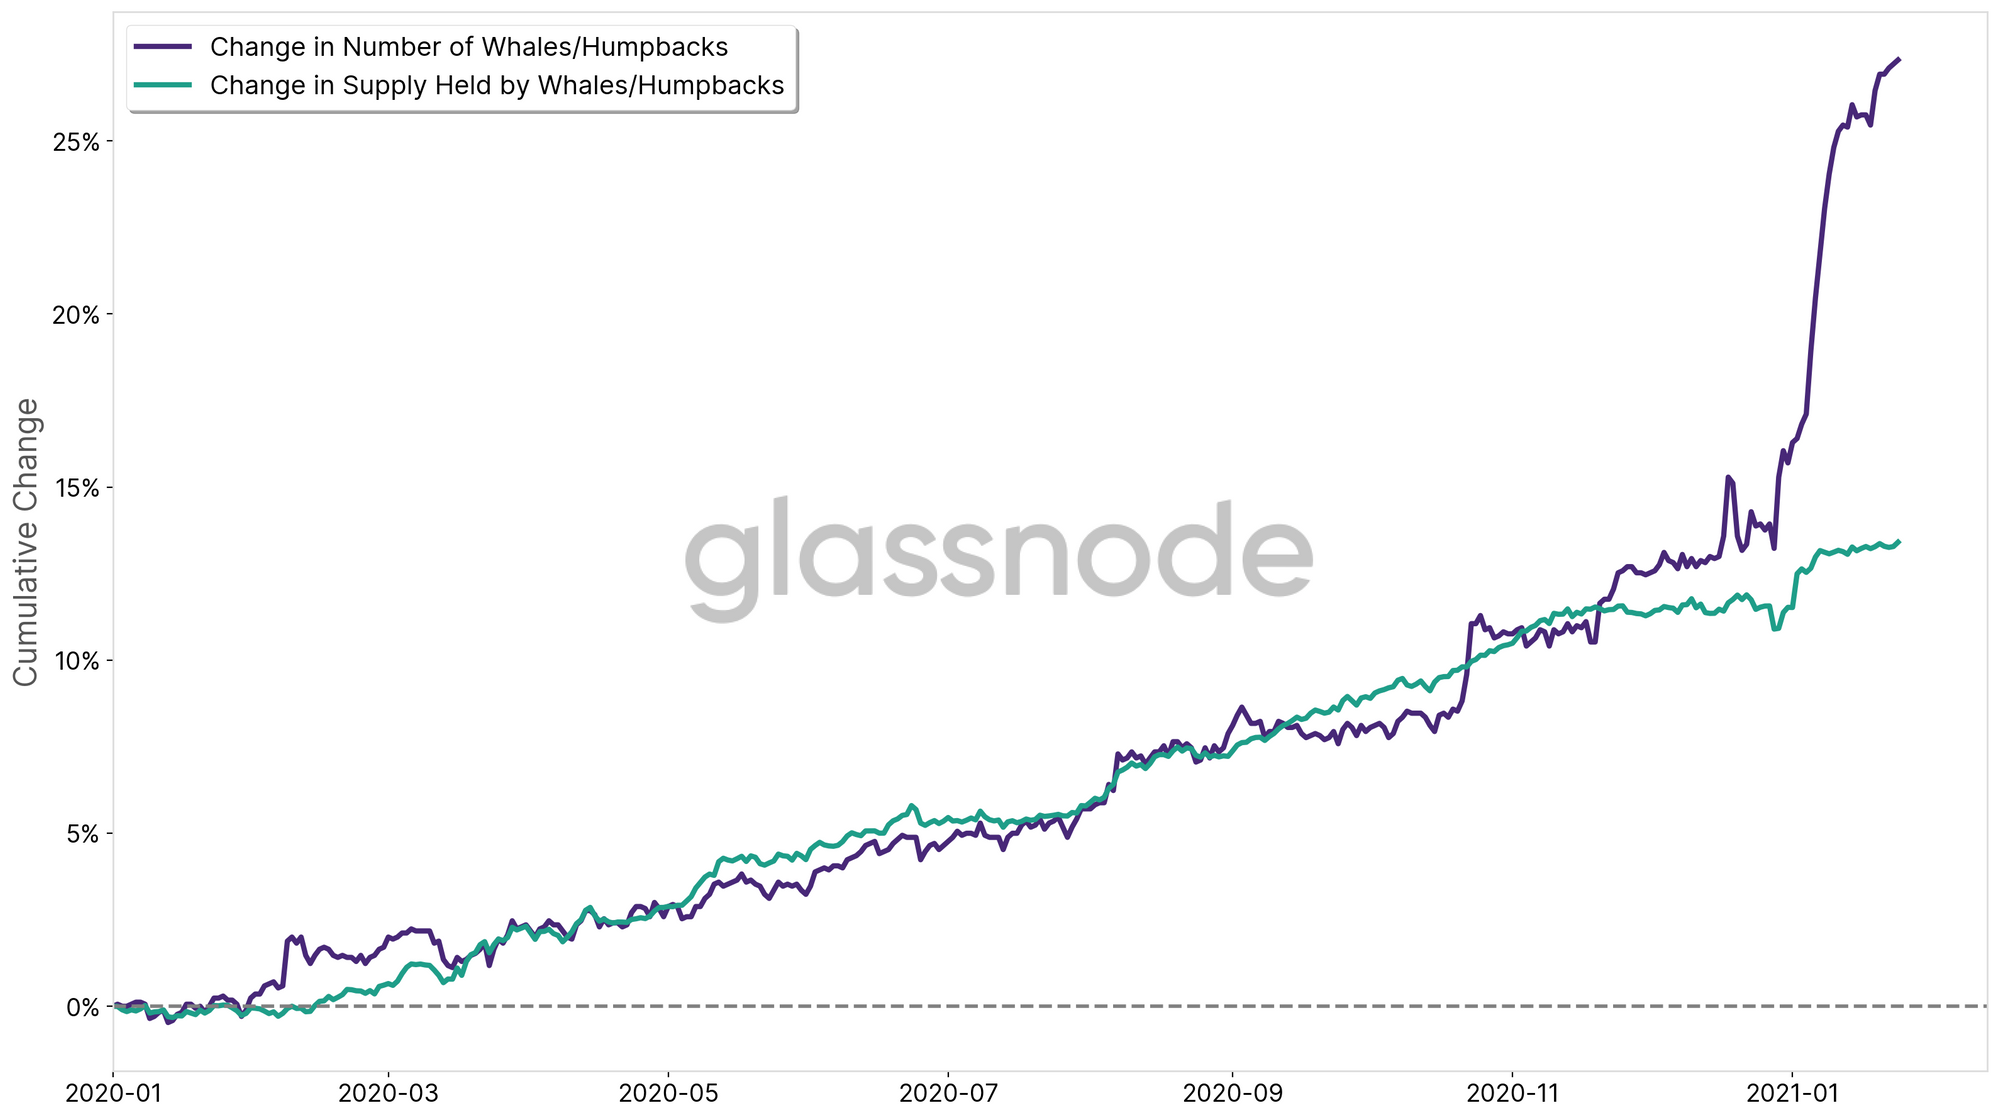
Since the beginning of 2020 the supply held by large entities (whales + humpbacks) has increased 13.4%, and their number by more than 27% to over 2,160 whale entities. See in particular the huge uprise in 2021 – this supports the current narrative that high net worth individuals and institutional investors have been entering the space.
I believe this to be bullish for the future price of Bitcoin in the upcoming months.
Many thanks go to Kilian Heeg for analyses and reviewing this work, as well as our partner Willy Woo for valuable discussions and feedback!

- Follow us and reach out on Twitter
- Join our Telegram channel
- For on–chain metrics and activity graphs, visit Glassnode Studio
- For automated alerts on core on–chain metrics and activity on exchanges, visit our Glassnode Alerts Twitter