How Many Entities Hold Bitcoin?
Introducing a New Generation of Entity–based On–chain Metrics Using Clustering and Advanced Data Science that Quantifies the Number of Bitcoin Holders.

The Problem with Quantifying the Number of Bitcoin Users
A major question amongst Bitcoin researchers and investors has been that of knowing how many people actually own and use Bitcoin.
And even though Bitcoin’s entire transactional history is publicly accessible through its open ledger, assessing the number of users in the Bitcoin network is a non–trivial task.
Down to the present day, it is most often still the number of addresses in the Bitcoin network that is being used as a proxy to the number of Bitcoin users/holders.
However, it is well established that this approach is fallacious, mainly because there is no one–to–one mapping between users and Bitcoin addresses:
- Bitcoin addresses can hold funds from more than one individual (e.g. exchange addresses).
- A single entity can own and control multiple Bitcoin addresses holding BTC.
Beyond Address Counts
In order to obtain a more precise estimate of the actual number of users in the Bitcoin network, and how this number changes over time, more advanced methodologies are required.
At Glassnode, we have been working on this problem by applying a combination of industry–standard heuristics, proprietary clustering algorithms, and advanced data science methods on top of raw on–chain data.
In the present work we show the results of our approach and set a new upper limit on the number of entities holding BTC. To the best of our knowledge this work is the first to introduce a more sophisticated quantification of Bitcoin entities that goes beyond plain address counts and over–simplified heuristics.
Entities, not Users
Note that with our approach we only aim at solving one of the two confounding factors that follows from using addresses as a proxy to the number of users: mapping multiple addresses to a single entity.
We do not tackle the case in which a single address holds funds of multiple users: In this case the address holding the bitcoins is still controlled by a single entity on the network level (e.g. an exchange) — therefore we deliberately refer to our numbers as “entities” rather than “users” or “individuals”.
As a result of this work we implemented a set of live on–chain metrics that are live on Glassnode Studio and through our API as of today:
- Number of New Entities
The number of unique entities that appeared for the first time in a transaction in the Bitcoin network. - Entities Net Growth
The net growth of unique entities in the network. This metric is defined as the difference between new entities and “disappearing” entities (entities with a zero balance that had a non–zero balance at the previous timestamp). - Number of Whales
The number of unique entities holding at least 1,000 BTC. - Number of Active Entities
The number of unique entities that were active either as a sender or receiver. - Number of Sending Entities
The number of unique entities that were active as a sender of BTC. - Number of Receiving Entities
The number of unique entities that were active as a receiver of BTC.
Note: Because our entity metrics rely on clustering techniques and statistical information that changes over time, these metrics are mutable, i.e. most recent data points are subject to slight changes as time progresses. However, we have put the necessary mechanisms in place in order to obtain highly stable values that keep these fluctuations to a minimum (on average < 1%).
Quantifying the Number of Bitcoin Entities
In the following we present the results of our approach.
Figure 1 shows the number of new entities coming into the Bitcoin network per day — along with the number of new addresses as comparison.
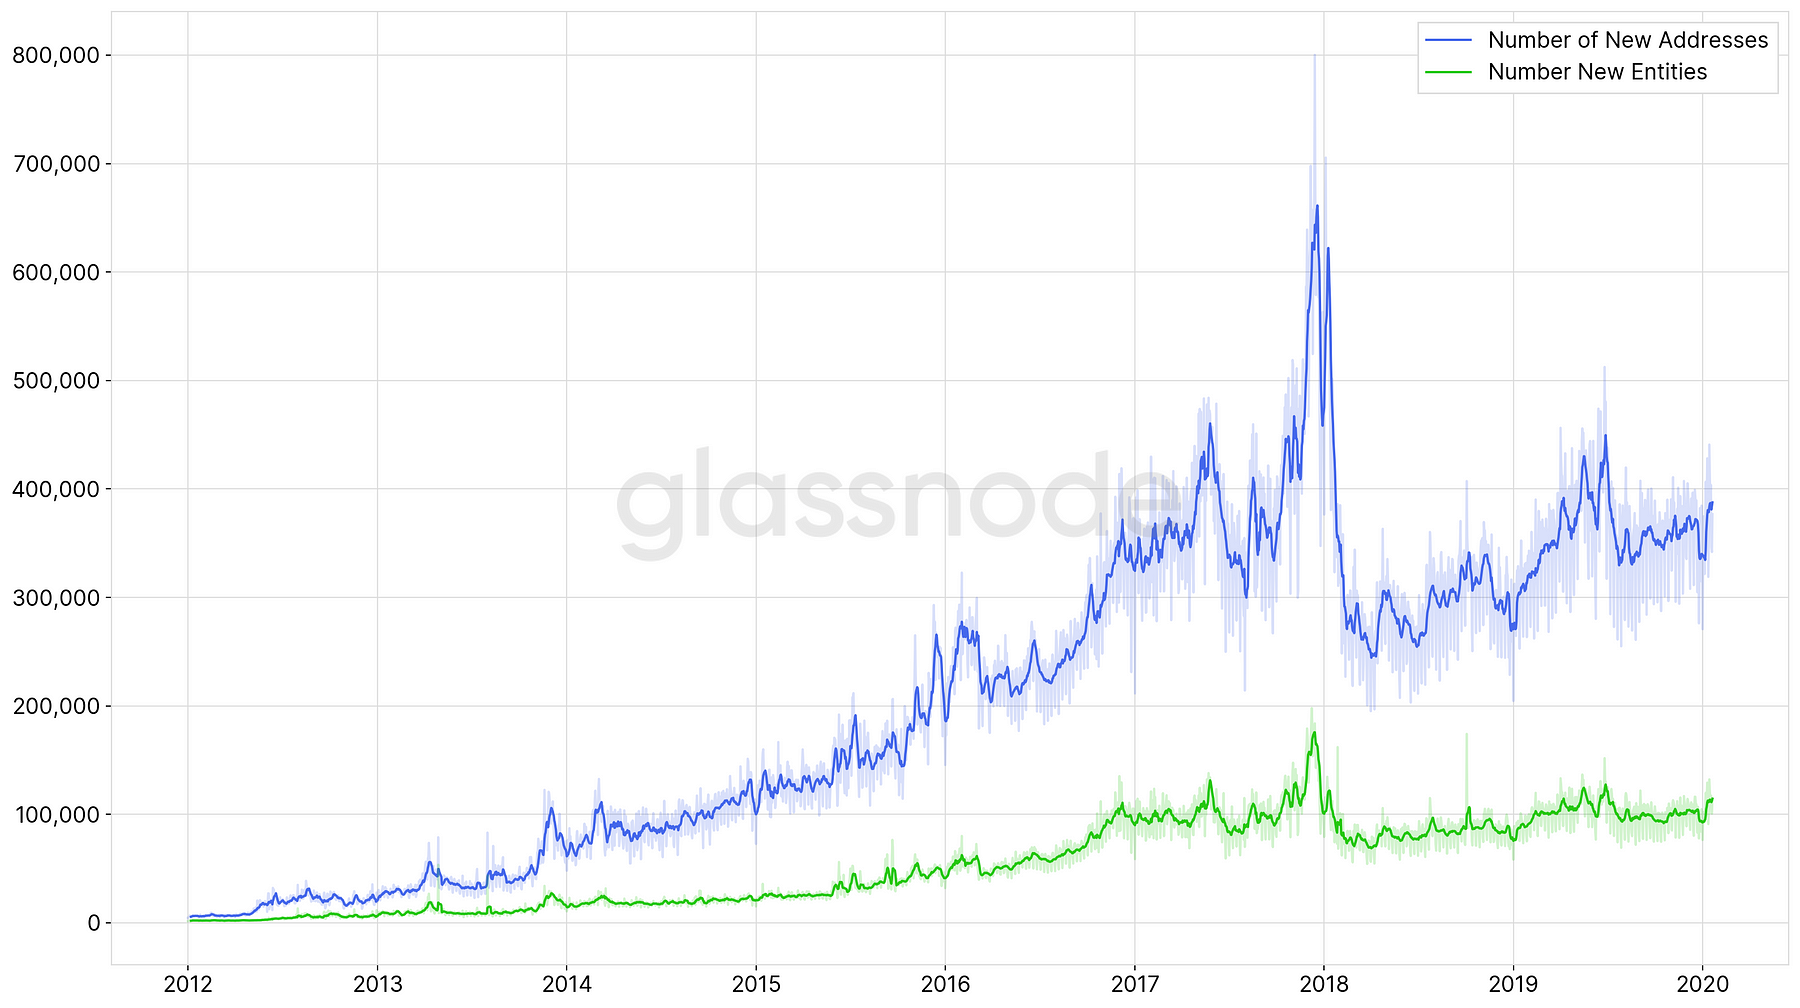
Because our methods involve clustering addresses into entities, the resulting number of new entities noticeably represents a fraction of the number of new addresses in the network. For instance, in 2019 the average number of new addresses added to the Bitcoin blockchain per day was over 355k. In comparison, the average number of new entities was only slightly above 100k, representing a ratio of ~28%.
Figure 2 shows this ratio of newly added addresses and entities over time.
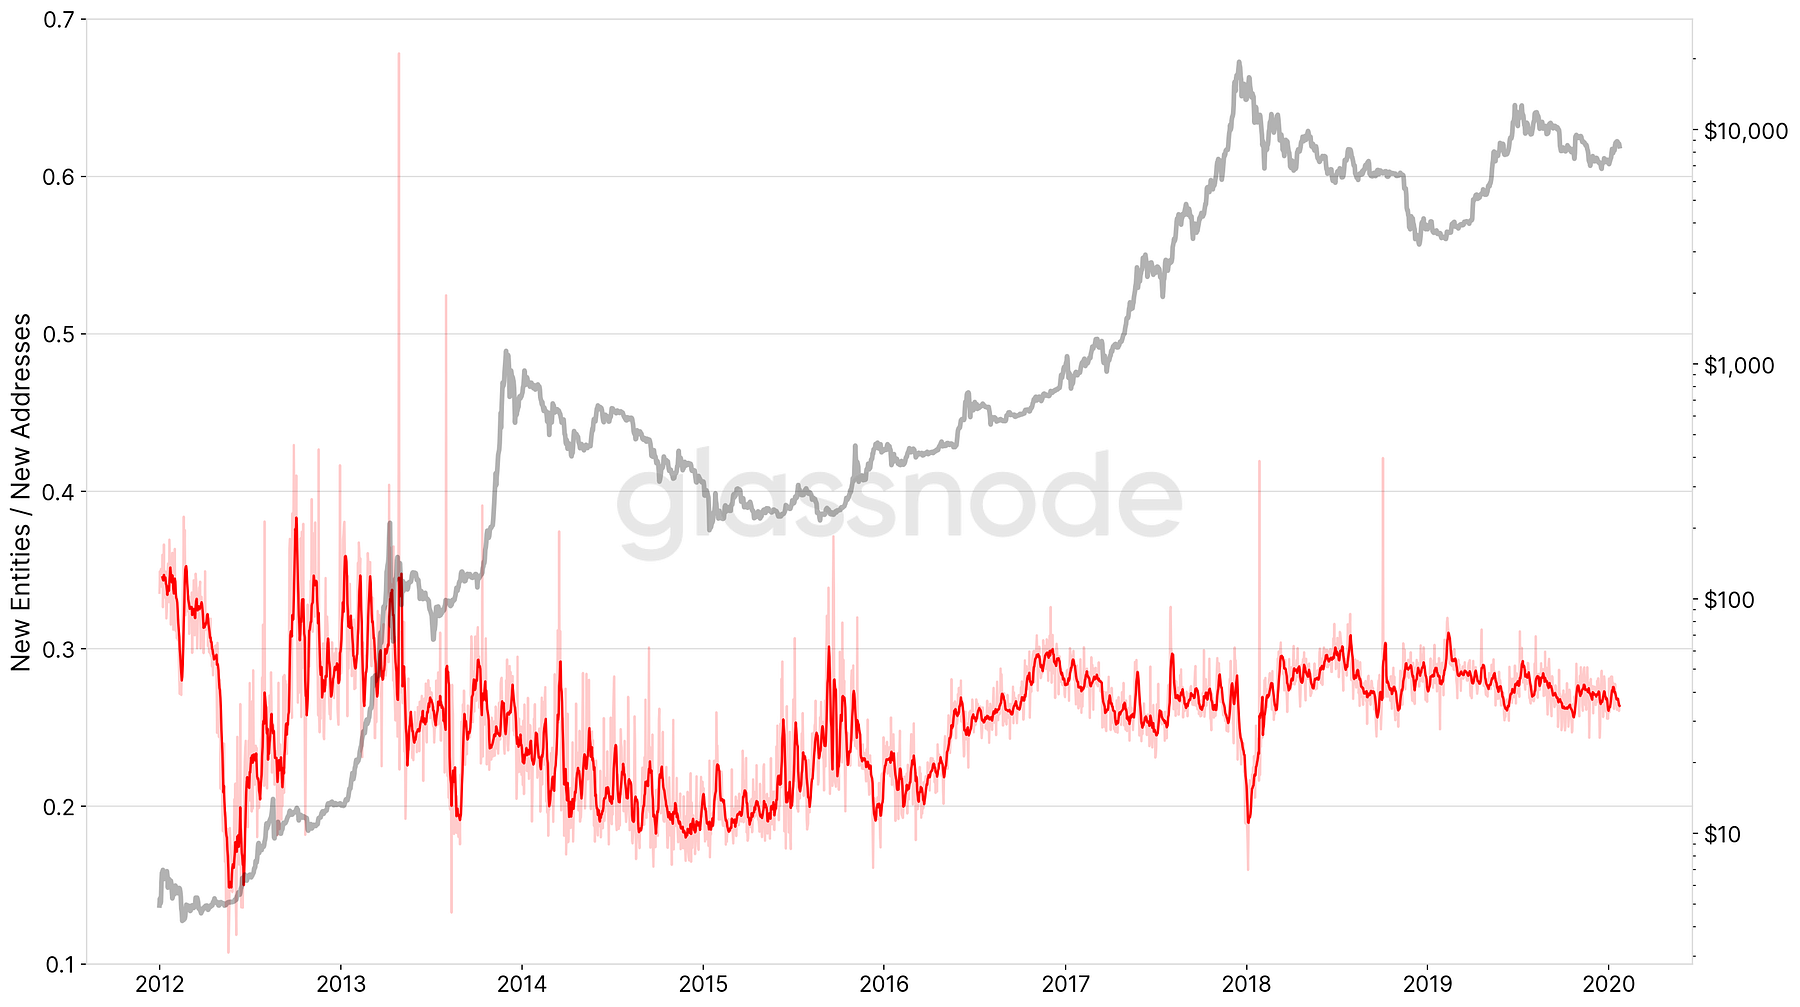
Note the potential signal that can be extracted from this ratio. For instance, a clearly visible downwards peak at the beginning of 2018 showing an increased discrepancy between new addresses and new entities can be observed, suggesting increased activity of existing users in the network (e.g. new addresses were actually change addresses), rather than new players coming into the space.
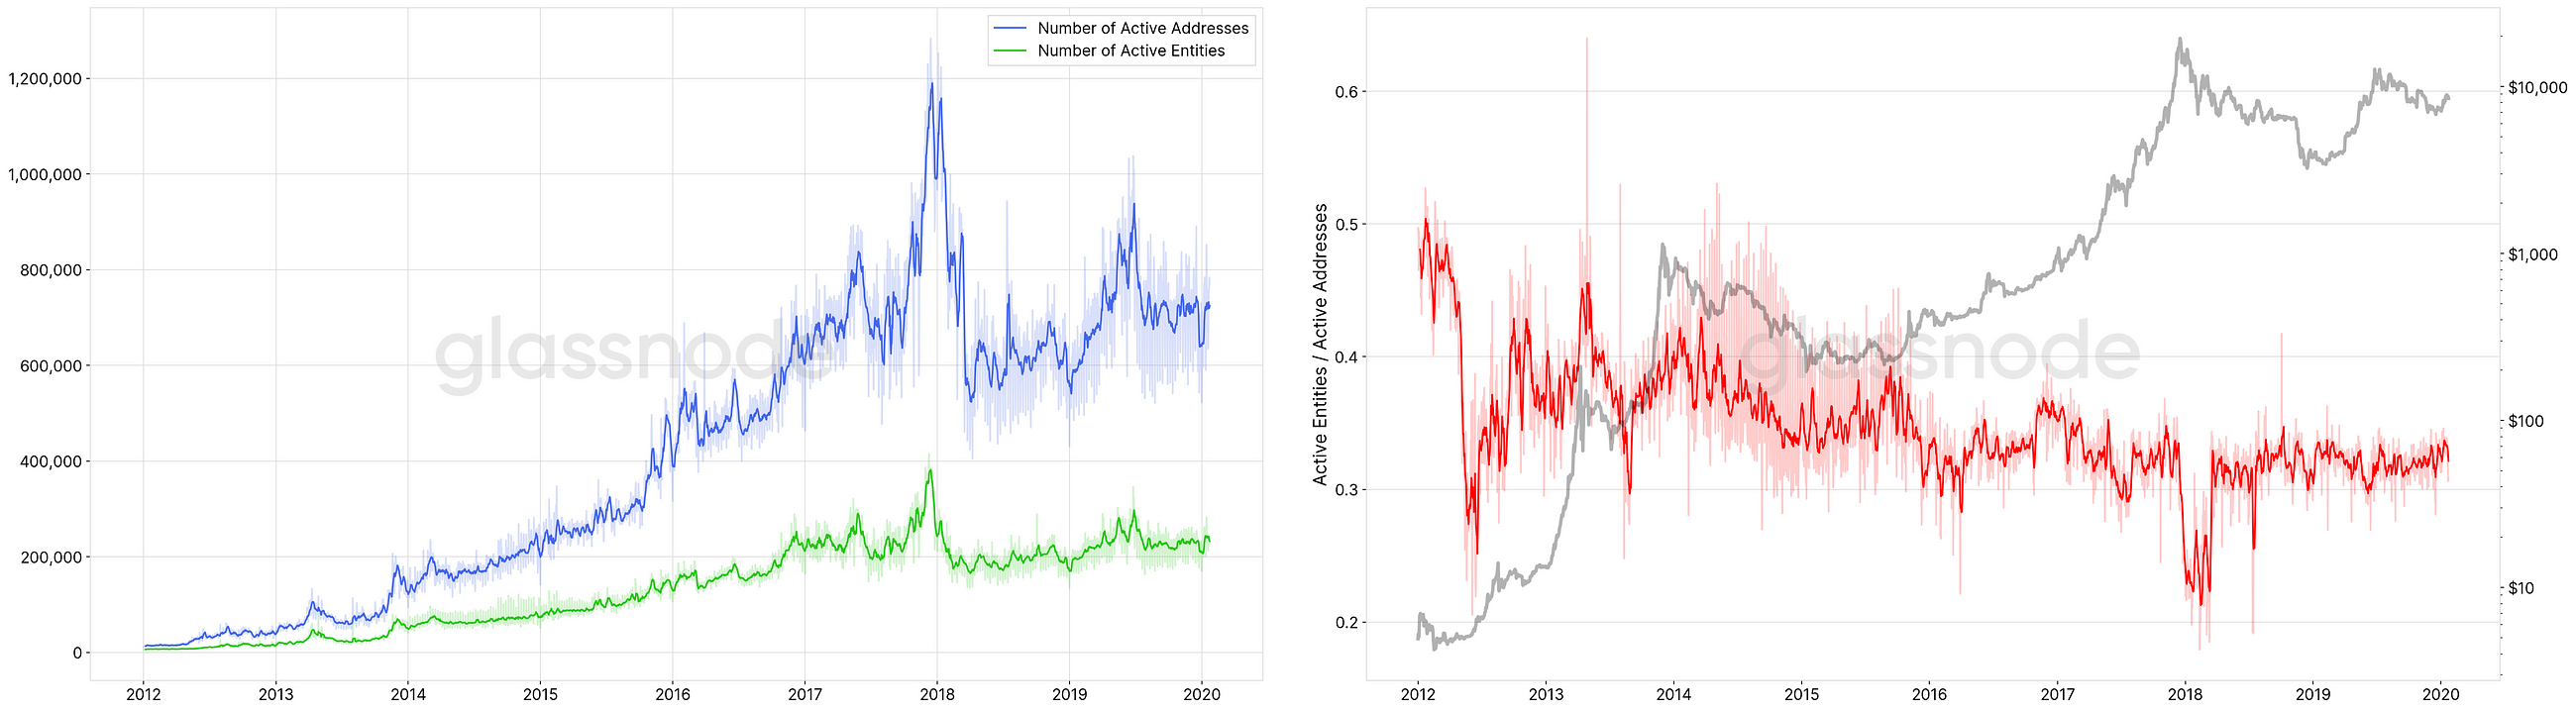
The comparison between the number of daily active addresses and active entities paints a very similar picture:
So, How Many Entities Hold Bitcoin?
Figure 4 depicts the daily net growth of entities in the network. As compared to new entities, this number accounts for “disappearing” entities as well: Entities with a zero BTC balance, which had a non–zero BTC balance at the previous timestamp.
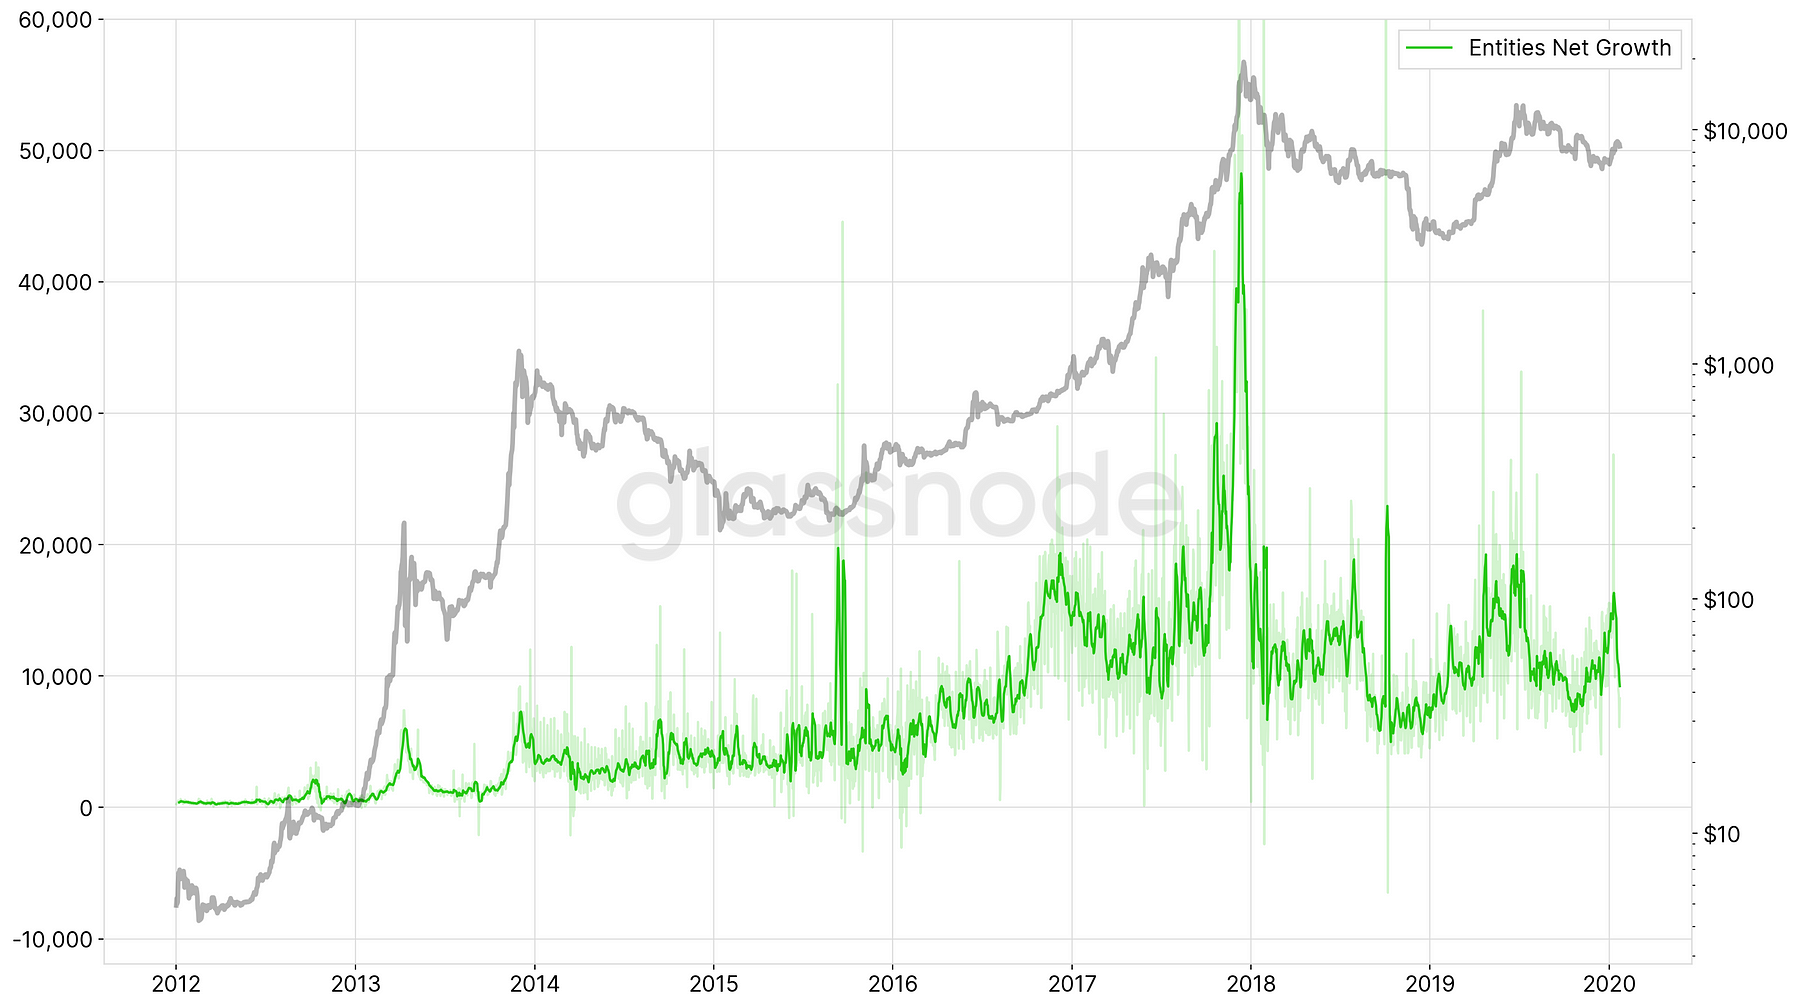
Using the cumulative sum on this time–series we obtain the estimated number of entities at each given point in time. Figure 5 shows the results along with the number of non–zero addresses as comparison.
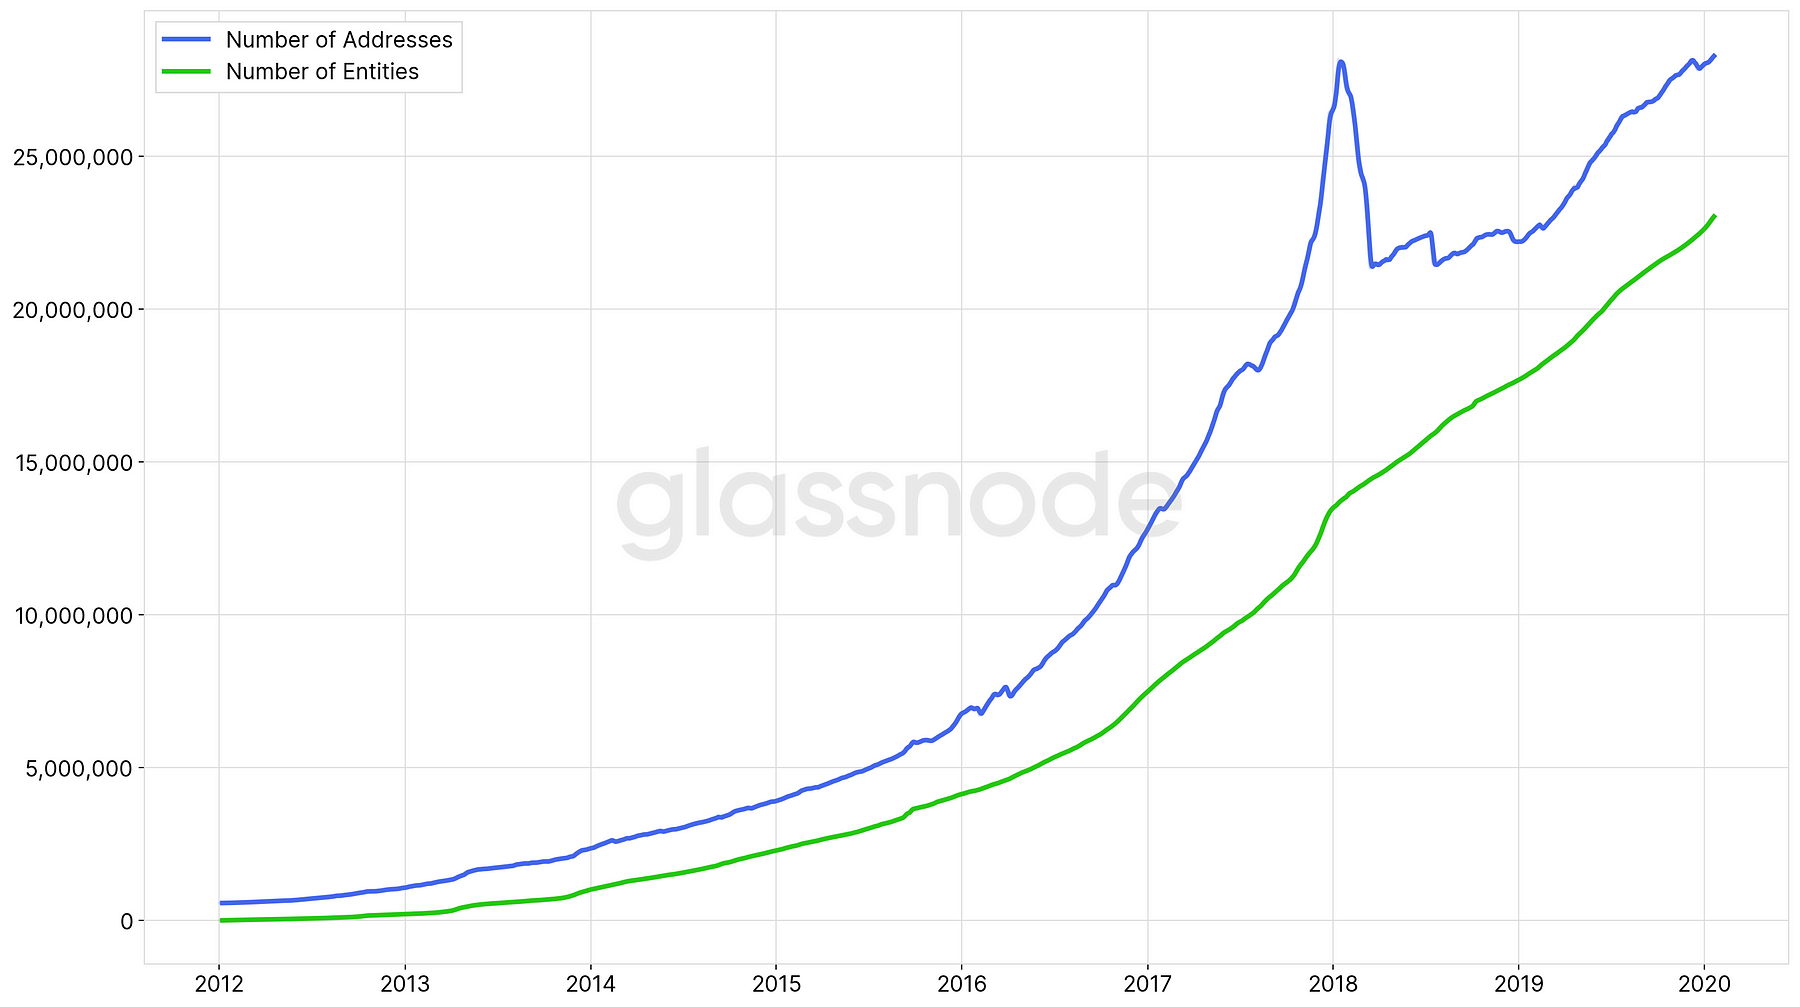
According to our analyses, as of January 2020 the number of entities holding Bitcoin is ~23.1 million. This is 18.5% less than the current number of non–zero addresses (~28.4 million).
Moreover, it is notable that the number of entities increases monotonously. Sharp downward spikes as observed in the number of addresses at the beginning of 2018 are not present when looking at entities.
According to our analyses, as of January 2020, the number of on–chain entities holding Bitcoin is about 23.1 million.
Healthy Bitcoin Growth
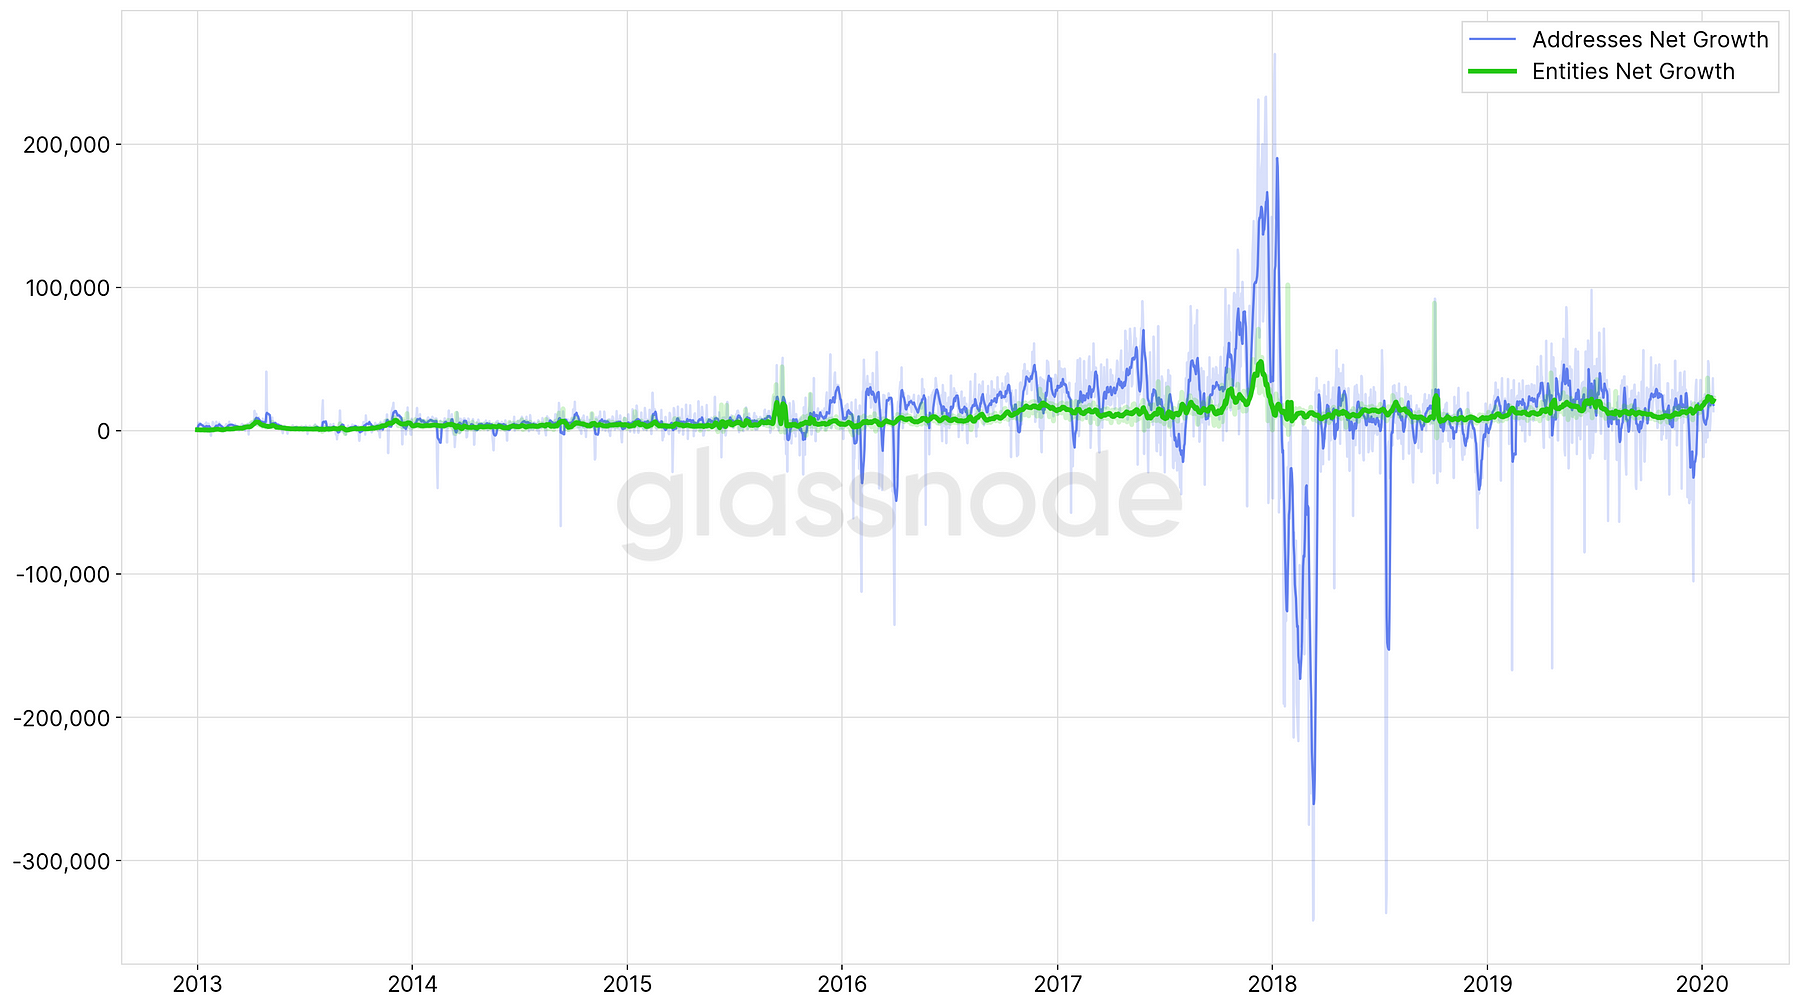
It is worthwhile comparing the daily net growth of entities and the net growth of addresses (Figure 6). For one, the volatility in address growth is significantly higher than that of entities, with considerable amplitude deflections — both positive and negative.
More importantly, the daily net growth of entities is consistently positive: In Bitcoin’s history there have been only 21 days so far in which the net entity growth was negative.
This is a clear indication of a healthy and consistent adoption of Bitcoin over the past 10 years.
Number of Whales
An additional entity–based metric we added to our list of on–chain metrics is the number of whales: We define whales as entities that hold ≥ 1,000 BTC. This metric gives a more precise estimation of the actual behaviour of whales that does not rely on single addresses. Note: Entities that we have labeled to be exchanges are excluded from these numbers.
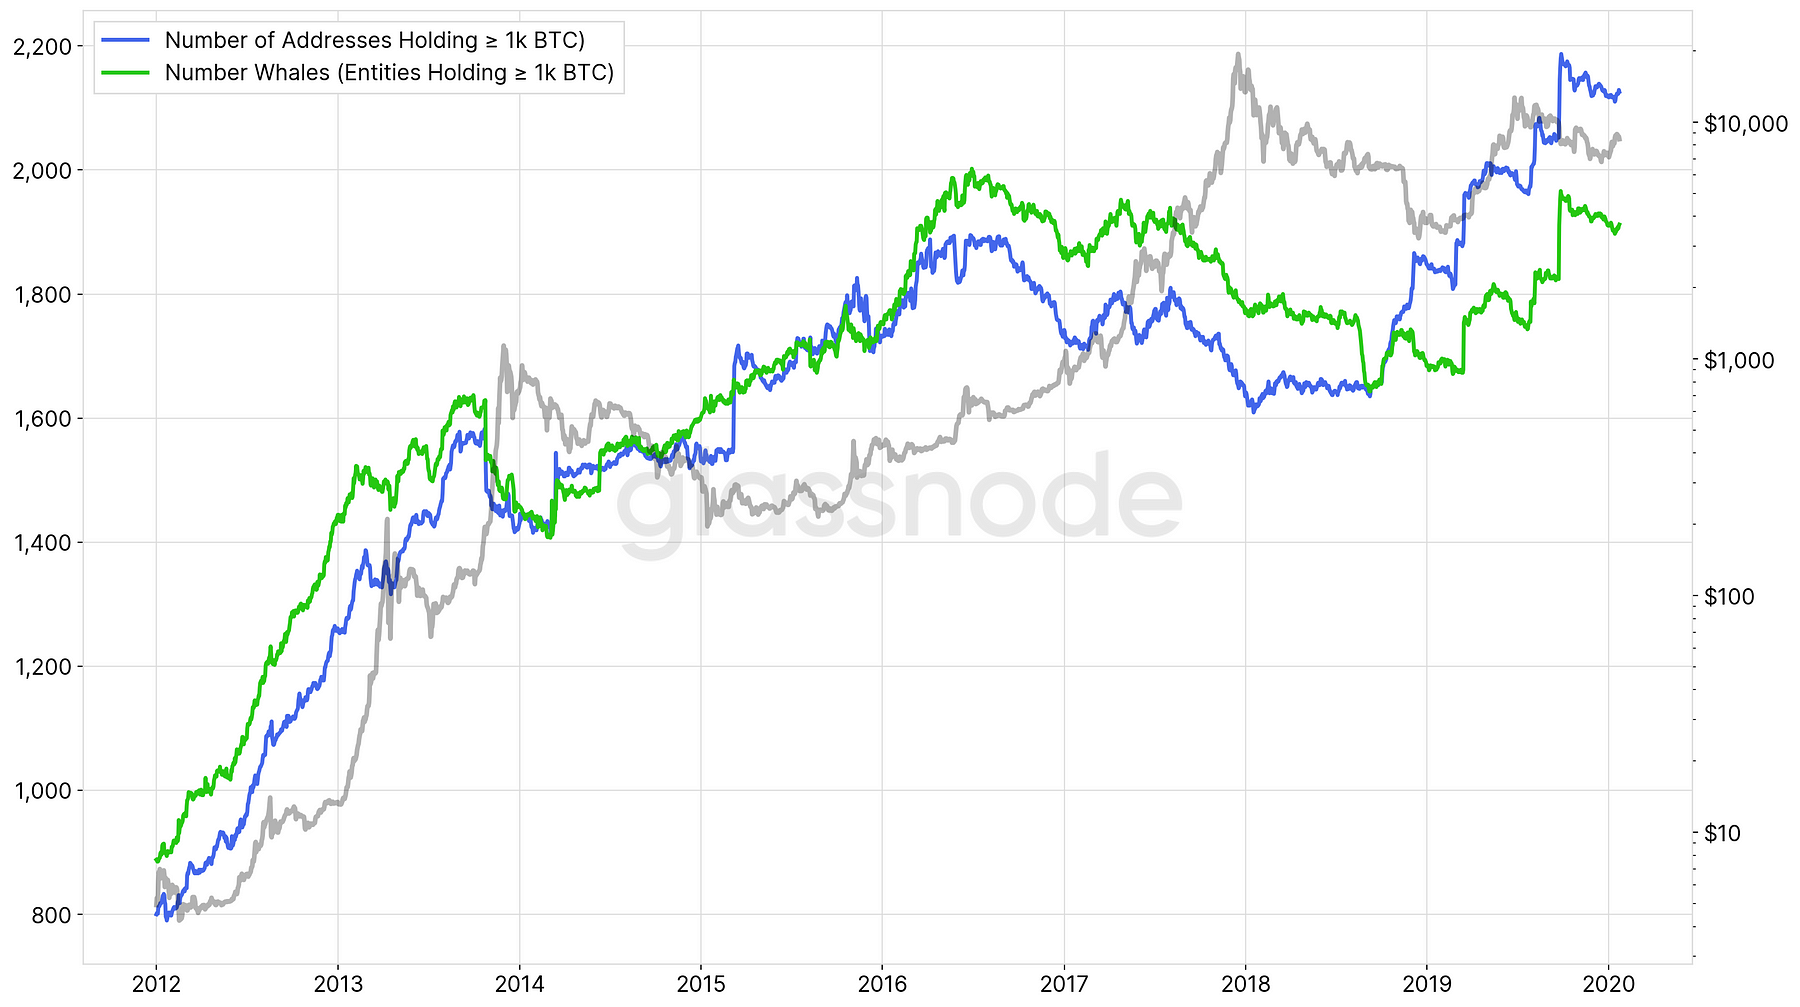
Even though both curves show similar trends, the counts of addresses and entities holding ≥ 1,000 BTC differ significantly providing a more exact estimate of whale behaviour at particular points in the market cycles.
Distribution Statistics
The following graph depicts the number of entities as a function of the entities’ size (number of addresses controlled by an entity).
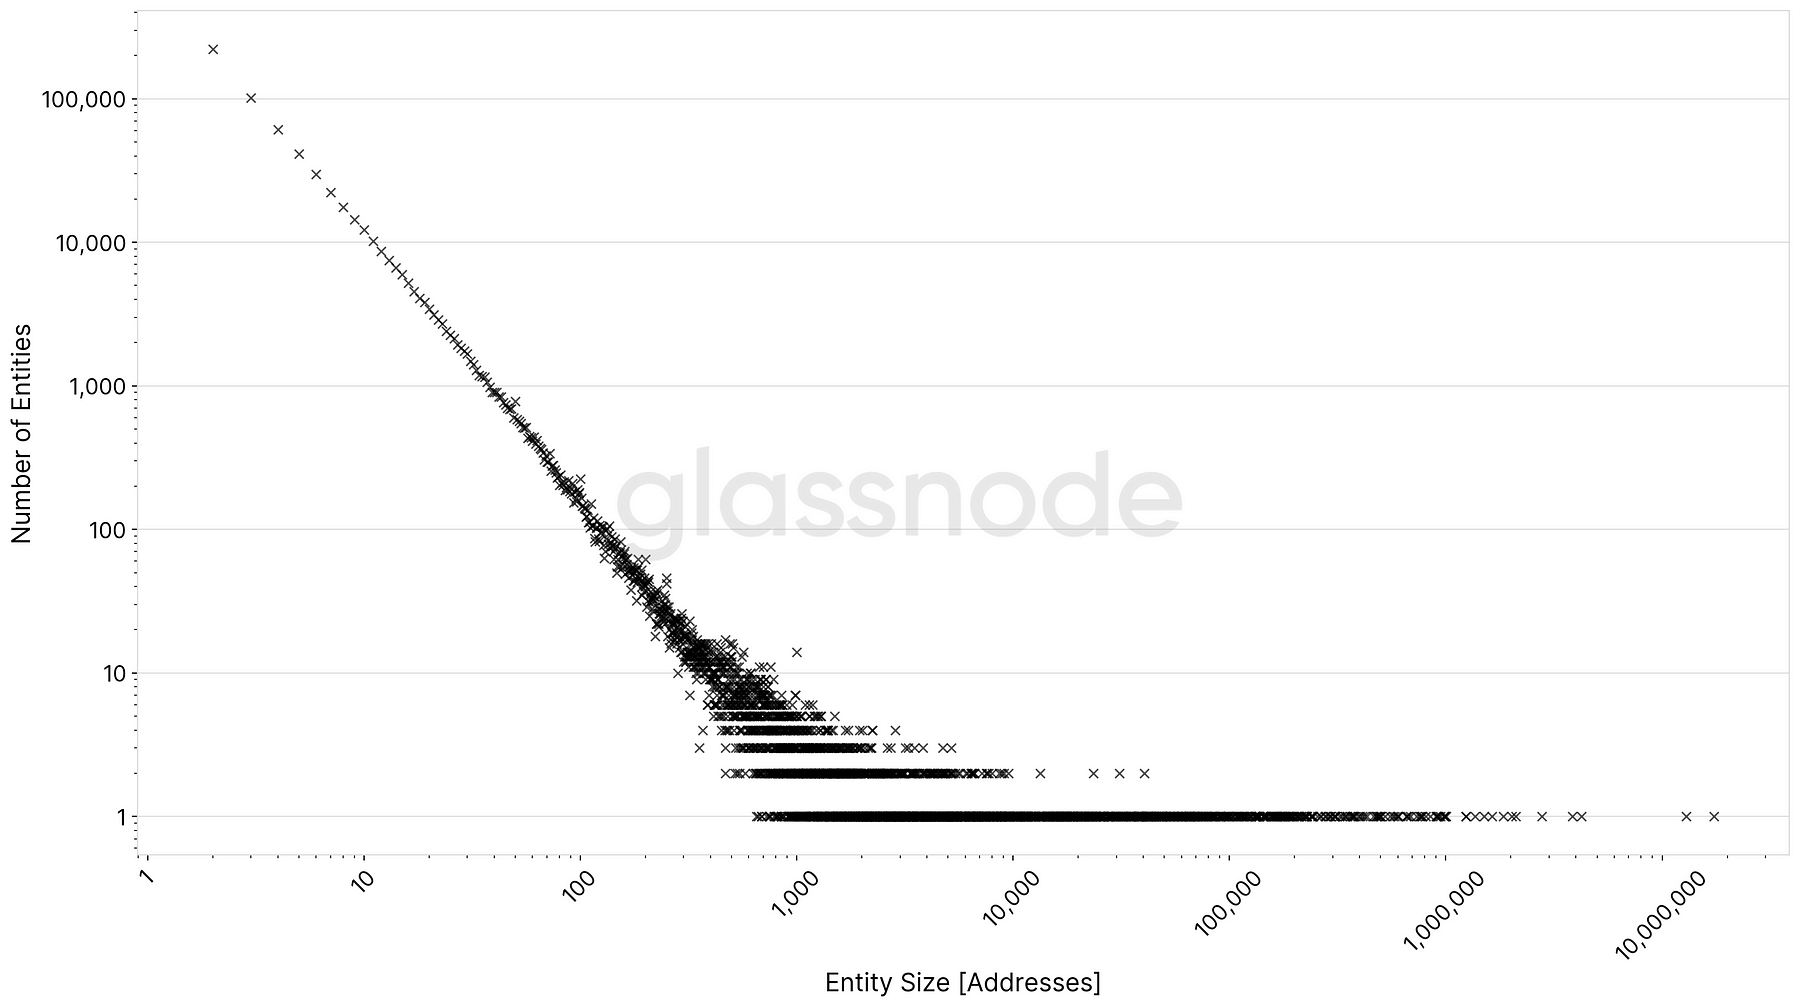
The chart shows a clear power–law relationship, with entities’ sizes raging from a single address up to entity clusters consisting of almost 22 million addresses (Coinbase).
Note: The bulk of our clustered entities (~96%) still consist of a single addresses. Therefore our numbers serve as a strict upper limit for the number of Bitcoin entities. Including potential missing links the actual number is possibly lower than our provided upper boundary.
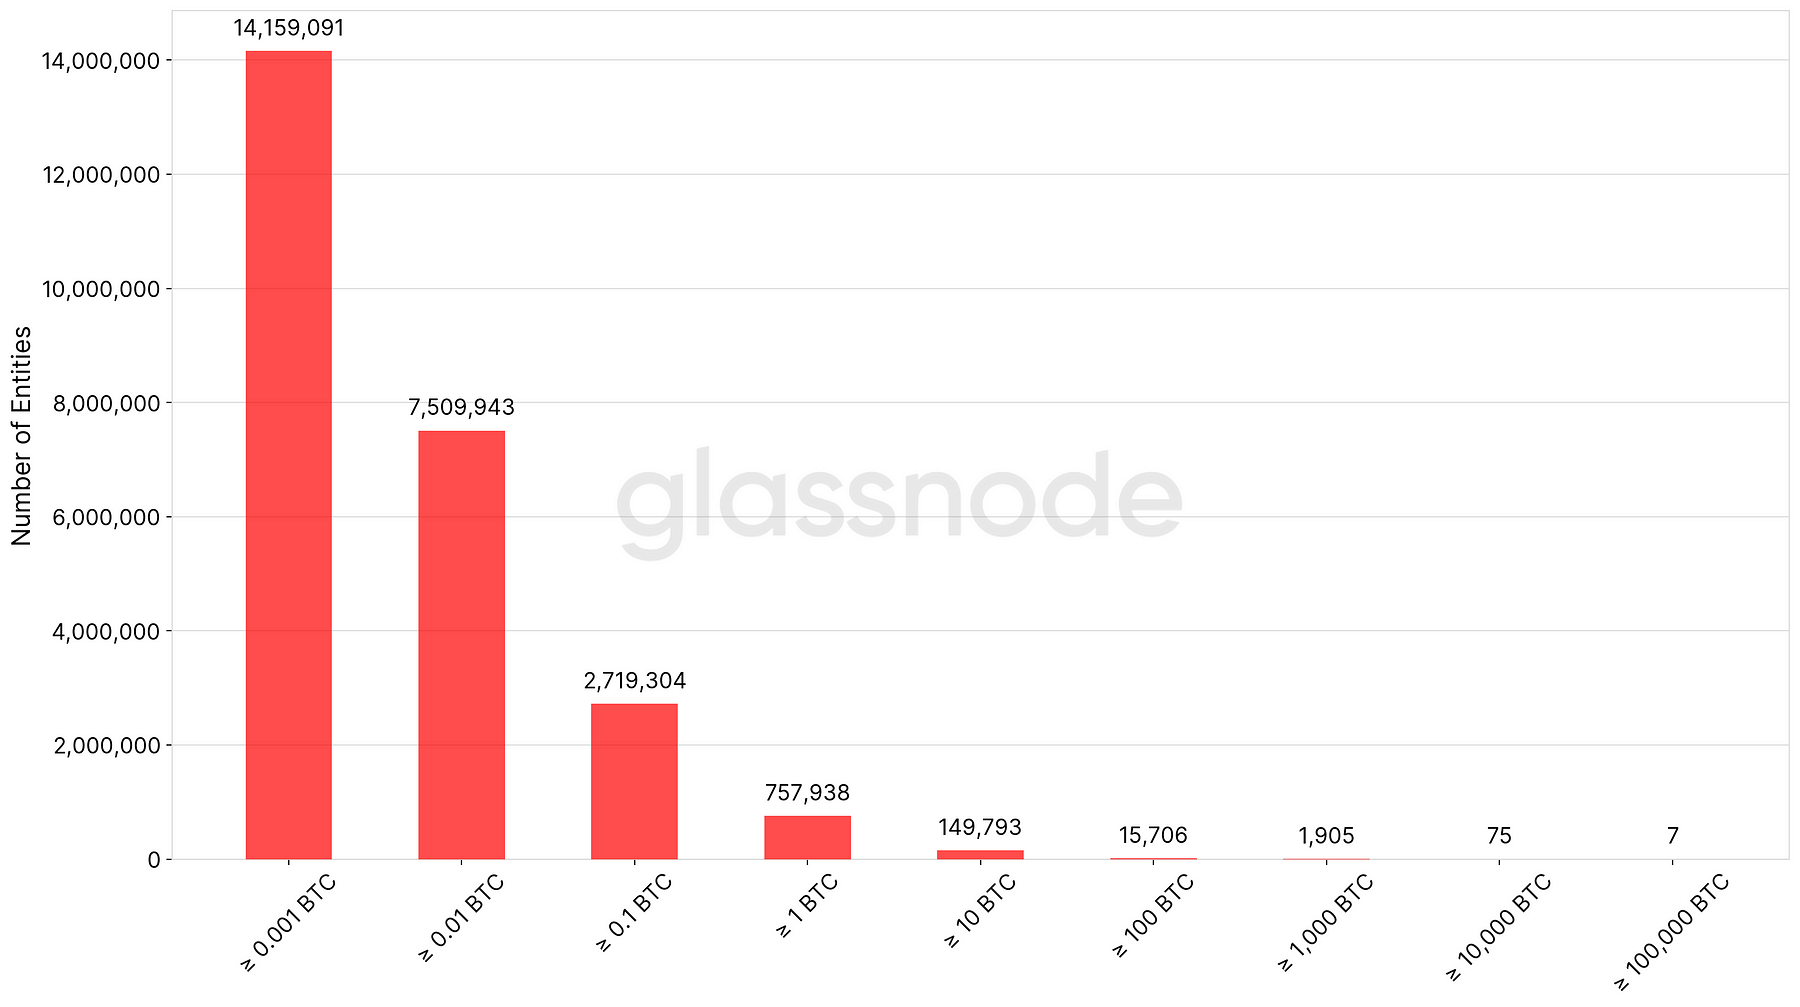
Similarly, the number of entities as a function of their balance reveals a power–law distribution with the bulk of entities (~22.3 million) holding less than one Bitcoin (omitted in the distribution graph below).
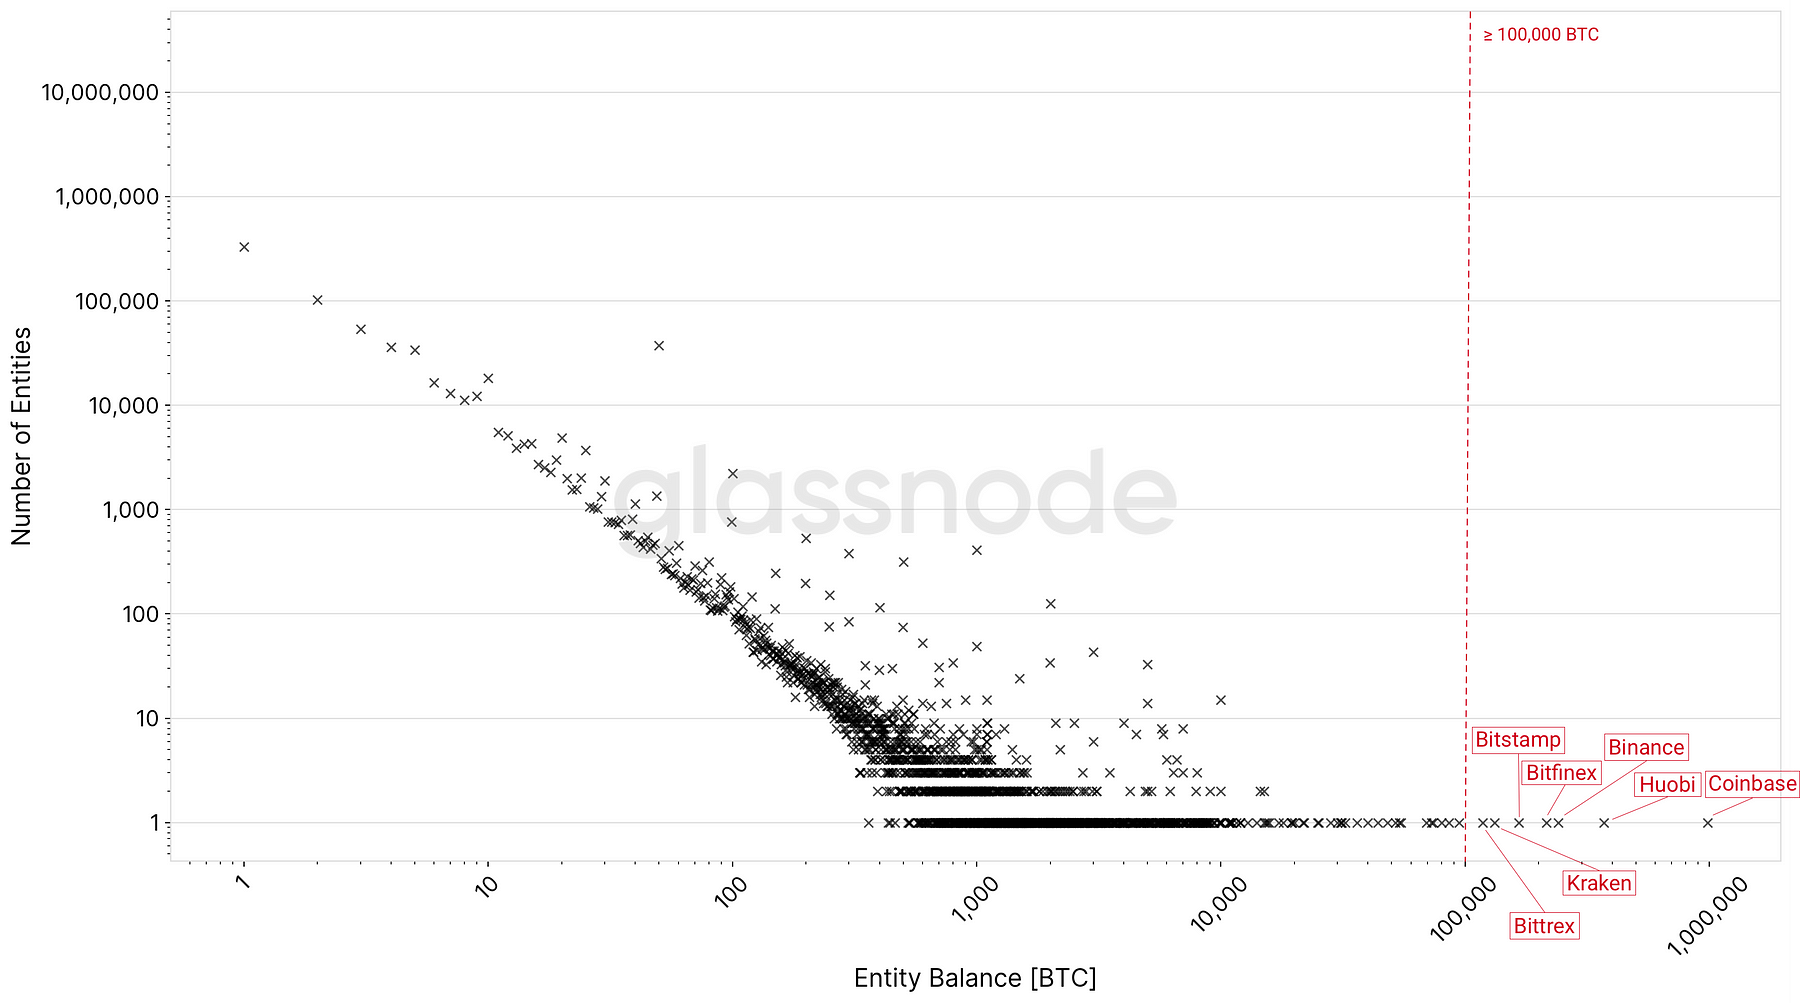
With respect to large entities, as of January 2020 there are 75 entities that hold 10,000 or more BTC, and 7 entities than hold 100,000 or more BTC — all of which are exchanges: Coinbase (983,800 BTC), Huobi (369,100 BTC), Binance (240,700 BTC), Bitfinex (214,600 BTC), Bitstamp (165,400 BTC), Kraken (132,100 BTC), and Bittrex (118,100 BTC).
These 7 richest entities (exchanges) control over 2,350,000 BTC.
That is ~13% of the circulating Bitcoin supply.
Live charts of Bitcoin balances on exchanges are available here.
Special thanks to Kilian Heeg for the research and development of the present work.
Live metrics on Glassnode Studio:
Number of New Entities
Entities Net Growth
Number of Whales
Number of Active Entities
Number of Sending Entities
Number of Receiving Entities

- Follow us and reach out on Twitter
- For on–chain metrics and activity graphs, visit Glassnode Studio
- For automated alerts on core on–chain metrics and activity on exchanges, visit our Glassnode Alerts Twitter
Disclaimer: This report does not provide any investment advice. All data is provided for information purposes only. No investment decision shall be based on the information provided here and you are solely responsible for your own investment decisions.