BTC Market Pulse: Week 16
While the recent rebound to $85K improved short-term sentiment, the market remains vulnerable. Liquidity is thin, profitability is subdued, and ETF flows are cautious. Read more in our weekly Market Pulse.


Overview
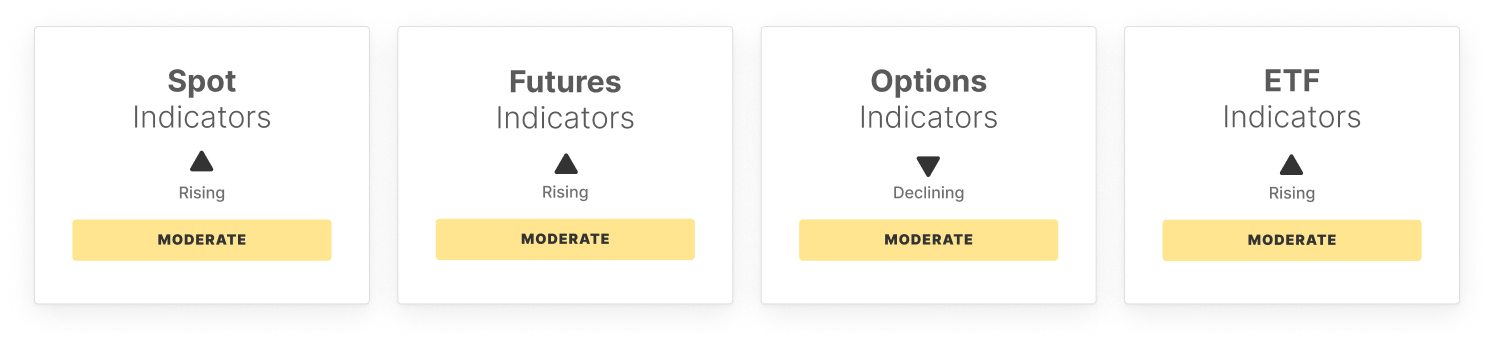
The Bitcoin market experienced a brief rebound to $85K, driven by positive momentum in spot markets and a notable flip in both Spot and Perpetual CVDs. However, this move occurred against a backdrop of persistent low liquidity and waning on-chain activity, with active addresses, fee volume, and transfer volume all trending near multi-quarter lows. ETF trade volume also declined sharply, suggesting reduced TradFi engagement.
Derivatives markets reflected cautious optimism, as perpetual funding flipped positive and CVD surged. Yet, futures open interest saw only marginal inflows, and volatility metrics cooled post-options expiry, indicating the bounce lacked deep conviction. Options traders showed mild accumulation, but skew retraced, signaling reduced hedging demand.
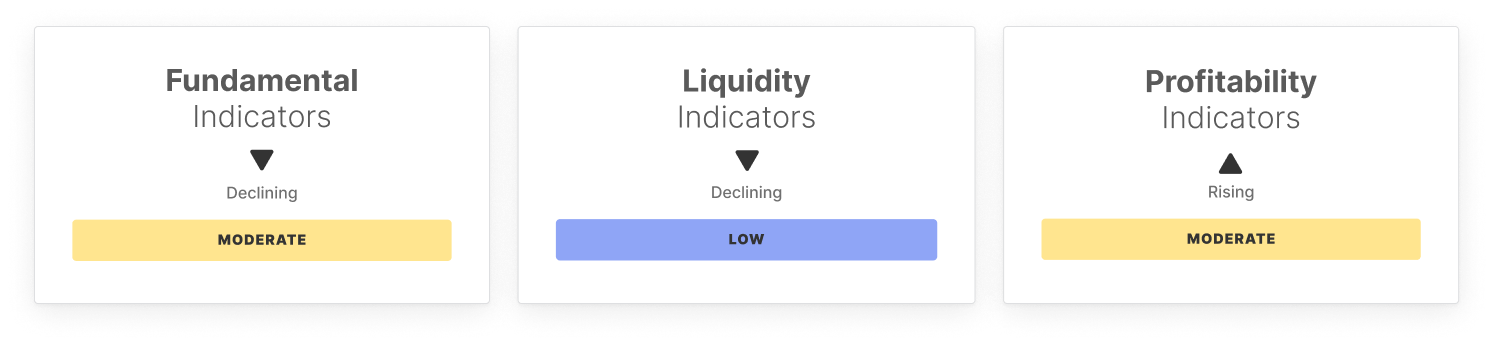
On-chain signals remain weak, with realized cap growth stagnant at 0.83% per month. The STH/LTH ratio and hot capital share have stabilized near cycle lows, pointing to limited speculative inflow. Profitability metrics nudged upward, with NUPL and percent supply in profit rising slightly, though still far below euphoric conditions. Realized profit/loss ratio remains below 1, underscoring dominant loss realization from top buyers.
Overall, while the recent rebound improved short-term sentiment, the market remains vulnerable. Liquidity is thin, profitability is subdued, and ETF flows are cautious. With Bitcoin highly sensitive to macro shocks in this environment, resilience around $80K reflects longer-term holder conviction, but sustained recovery still hinges on renewed capital inflows.
Off-Chain Indicators
On-Chain Indicators

- Follow us and reach out on Twitter
- Join our Telegram channel
- For on-chain metrics, dashboards, and alerts, visit Glassnode Studio
Disclaimer: This report does not provide any investment advice. All data is provided for information and educational purposes only. No investment decision shall be based on the information provided here and you are solely responsible for your own investment decisions.
Exchange balances presented are derived from Glassnode’s comprehensive database of address labels, which are amassed through both officially published exchange information and proprietary clustering algorithms. While we strive to ensure the utmost accuracy in representing exchange balances, it is important to note that these figures might not always encapsulate the entirety of an exchange’s reserves, particularly when exchanges refrain from disclosing their official addresses. We urge users to exercise caution and discretion when utilizing these metrics. Glassnode shall not be held responsible for any discrepancies or potential inaccuracies.
Please read our Transparency Notice when using exchange data.