BTC Market Pulse: Week 19
While macro sentiment remains constructive, fading speculative momentum and rising unrealized gains point to greater sensitivity to downside risk. Read more in our weekly Market Pulse.


Overview
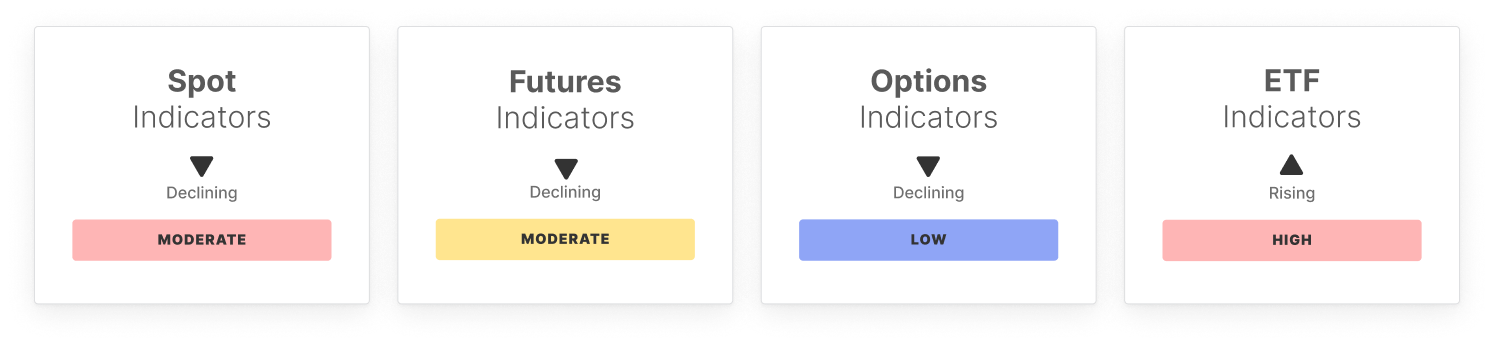
Following last week's rally toward $97K, market signals are beginning to show signs of cooling. Spot market momentum has softened, with Spot CVD turning sharply negative and daily volume dropping back to $6B, suggesting diminished buy-side conviction.
Similarly, perpetual futures experienced a dramatic unwind, with CVD and funding rates retreating from extremes, highlighting waning short-side aggression but little follow-through from long participants.
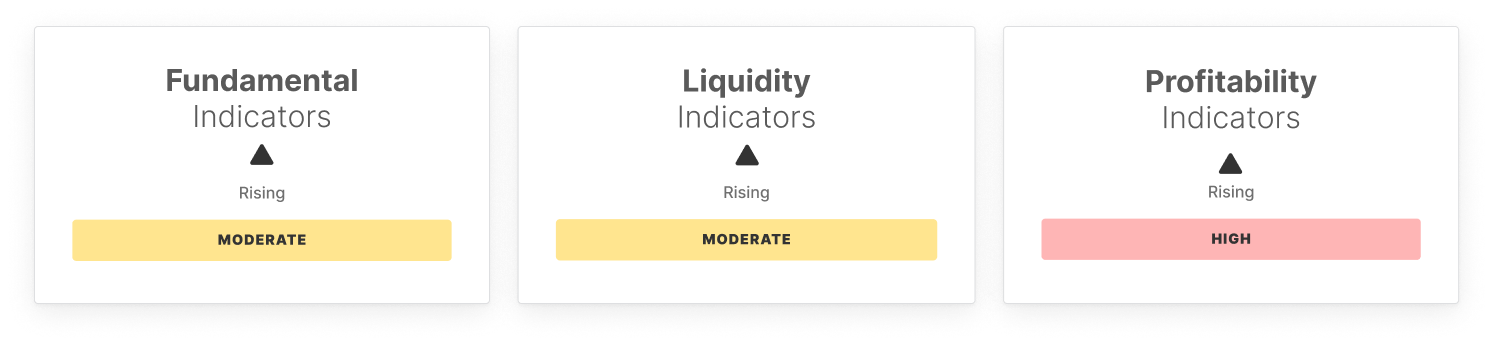
ETF flows, while still net positive, have eased from peak levels. Options markets reflect reduced speculative appetite, with falling open interest and deeply negative volatility spreads. Meanwhile, on-chain indicators point to elevated profitability: Percent Supply in
Profit is now at 88%, NUPL remains steady at 0.53, and the Realized Profit/Loss Ratio has spiked to 2.38. All signaling that a significant portion of the market is in the money and may be tempted to realize gains.
Overall, conditions point to a market at risk of near-term profit-taking. While macro sentiment remains constructive, the cooling of speculative momentum in spot and derivatives markets, combined with rising unrealized gains, suggests increased sensitivity to any downside catalysts.
Off-Chain Indicators
On-Chain Indicators

- Follow us and reach out on X
- Join our Telegram channel
- For on-chain metrics, dashboards, and alerts, visit Glassnode Studio
Disclaimer: This report does not provide any investment advice. All data is provided for information and educational purposes only. No investment decision shall be based on the information provided here and you are solely responsible for your own investment decisions.
Exchange balances presented are derived from Glassnode’s comprehensive database of address labels, which are amassed through both officially published exchange information and proprietary clustering algorithms. While we strive to ensure the utmost accuracy in representing exchange balances, it is important to note that these figures might not always encapsulate the entirety of an exchange’s reserves, particularly when exchanges refrain from disclosing their official addresses. We urge users to exercise caution and discretion when utilizing these metrics. Glassnode shall not be held responsible for any discrepancies or potential inaccuracies.
Please read our Transparency Notice when using exchange data.