BTC Market Pulse: Week 22
Latest BTC market developments reflect a maturing rally with emerging signs of a transition from moderation to a more heated structure, warranting close monitoring of investor behavior and market liquidity.


Overview
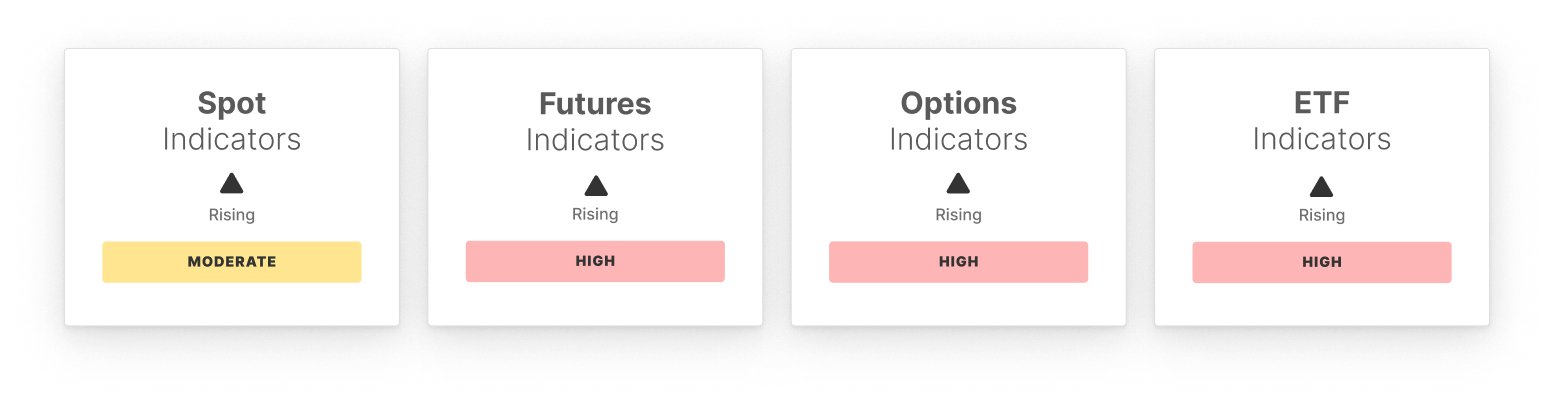
Bitcoin’s rally extended into another week, pushing to a new all-time high near $111K, largely driven by spot market strength. However, momentum shows signs of easing, as seen in a 25.1% drop in the 14-day RSI and a decline in net spot demand, pointing to possible short-term buyer fatigue.
In derivatives markets, open interest and funding rates rose, reflecting increased speculative positioning. Yet, the Perpetual CVD trending lower hints at stronger sell-side flows and a more cautious stance among traders. Options data presents a mixed signal: a stable 25-Delta Skew contrasts with a widening volatility spread and rising open interest, which may point to hedging or profit-taking behavior.
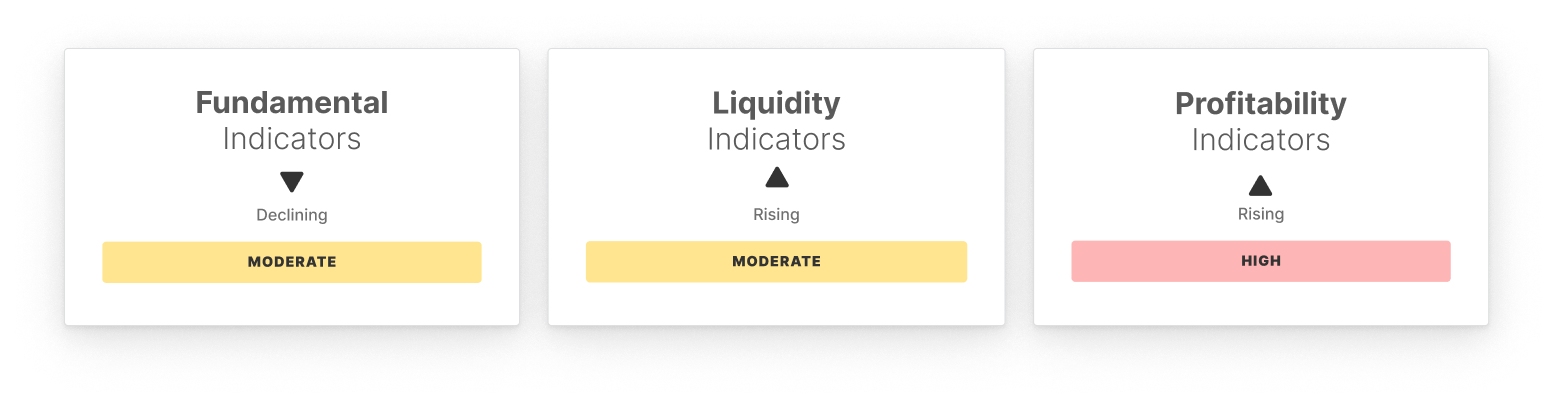
Liquidity conditions continue to improve, with elevated unrealized profits and persistent engagement from short-term holders. A modest increase in the STH/LTH supply ratio, alongside a small dip in the Realized Profit-to-Loss ratio, hints at tempered enthusiasm over the weekend. On the fundamentals side, a slight decline in active addresses suggests a cooling in user activity or transactional demand after the recent period of high activity.
Institutional demand remains firm as U.S. Spot ETF inflows and volumes continue to increase. However, elevated MVRV ratio and ETF trading volume signal an environment increasingly favorable for profit-taking. These developments collectively reflect a maturing rally with emerging signs of a transition from moderation to a more heated structure, warranting close monitoring of investor behavior and market liquidity.
Off-Chain Indicators
On-Chain Indicators

- Follow us and reach out on X
- Join our Telegram channel
- For on-chain metrics, dashboards, and alerts, visit Glassnode Studio
Disclaimer: This report does not provide any investment advice. All data is provided for information and educational purposes only. No investment decision shall be based on the information provided here and you are solely responsible for your own investment decisions.
Exchange balances presented are derived from Glassnode’s comprehensive database of address labels, which are amassed through both officially published exchange information and proprietary clustering algorithms. While we strive to ensure the utmost accuracy in representing exchange balances, it is important to note that these figures might not always encapsulate the entirety of an exchange’s reserves, particularly when exchanges refrain from disclosing their official addresses. We urge users to exercise caution and discretion when utilizing these metrics. Glassnode shall not be held responsible for any discrepancies or potential inaccuracies.
Please read our Transparency Notice when using exchange data.