An Introduction to Monitoring The Behaviour of Bitcoin Whales
To better understand Bitcoin's dynamics, and the impact of whales—Leverage Glassnode's data and insights to track Bitcoin whale activity effectively and make informed market decisions. Use the power of on-chain data to your advantage and stay ahead of the Bitcoin market trends.

Bitcoin whales - entities or individuals holding between 1000 to 5000 BTC - are a significant focus of interest for anyone interacting with the crypto market. Understanding of their aggregated behavior can prove invaluable for analysts, researchers, quant traders, and financial institutions.
Thanks to on-chain data, we can track the activities of these whales in near real-time. This unique characteristic of blockchain technology provides a fundamental advantage over traditional finance, illuminating our view of market dynamics in unparalleled ways. Dive into this article to understand how tracking Bitcoin whales can reveal key market trends.
The Role of Bitcoin Whales in Market Dynamics
Bitcoin whales have historically influenced market trends. Yet, comparing the market dynamics between the 2017/2018 and 2020/2021 periods shows a shift.
The 2017 bull market saw a net decrease in Bitcoin whale balances. This likely resulted from significant new demand inflows, extreme volatility, and the maturation of markets, which provided ample liquidity for distribution.
Utilizing the "Number of Entities With Balance ≥ 1k" metric allows us to quantify this phenomenon in a more nuanced way. This metric counts the number of unique entities holding a minimum of 1k Bitcoin, giving us a clearer picture of how the balance of power is distributed in the market. Entities are identified as clusters of addresses controlled by the same network entity, determined through sophisticated heuristics and Glassnode's proprietary clustering algorithms.
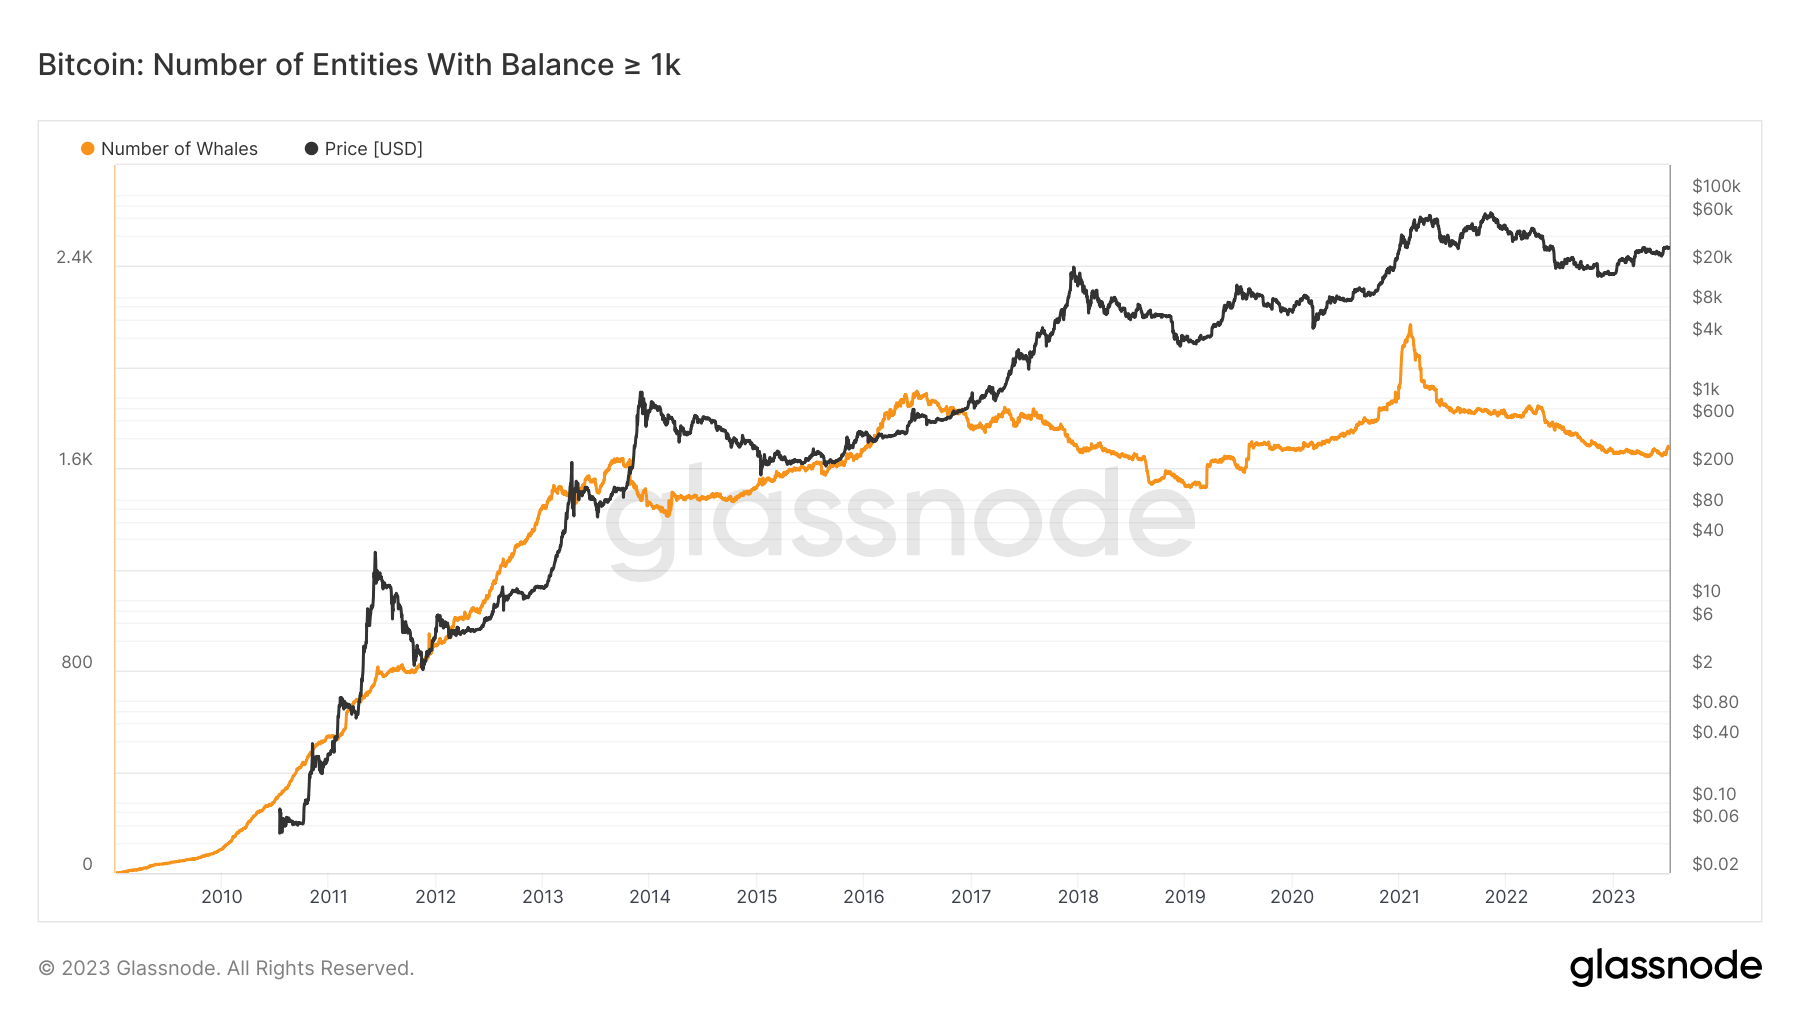
However, in 2020/2021, the Bitcoin market saw an influx of institutional capital. This meant that institutional investors' participation reduced Bitcoin whales' impact. Therefore, indicated a maturation of the Bitcoin market, showing signs like high liquidity, price stability, diverse market participation, and sophisticated financial infrastructure.
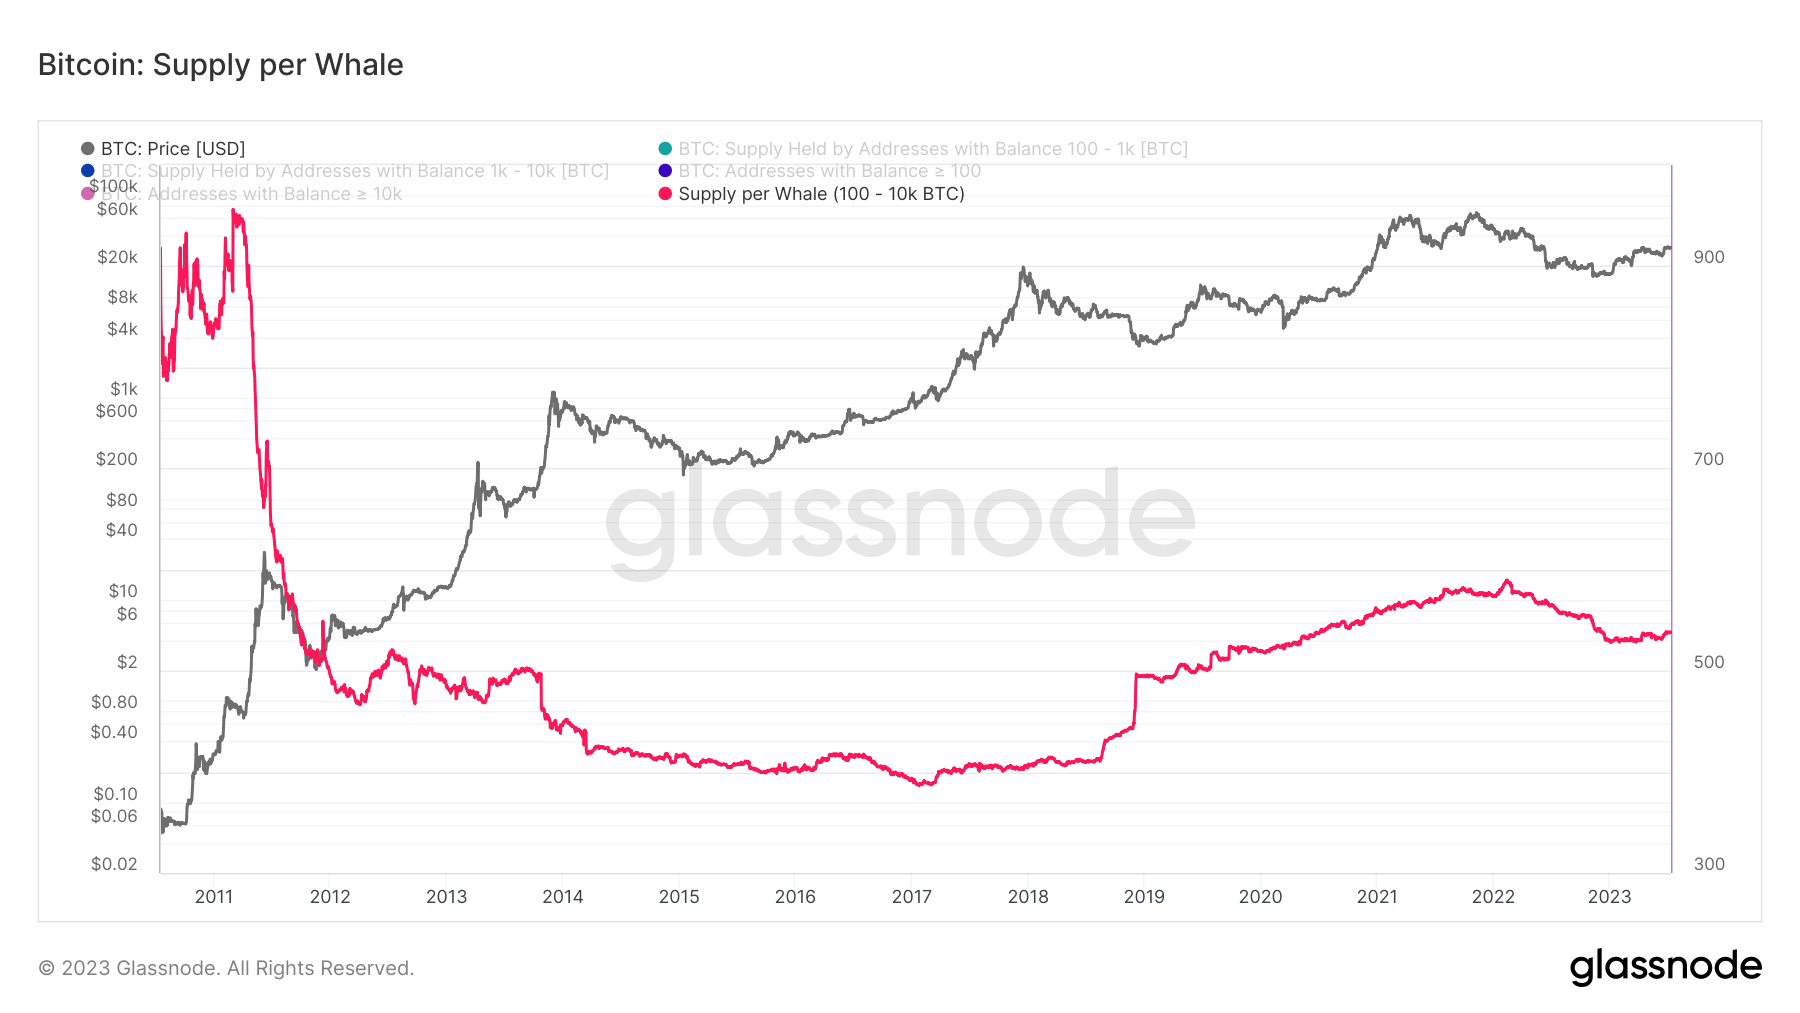
Building on the influx of institutional capital into the Bitcoin market in 2020/2021, the 'Supply Per Whale' metric becomes crucial in understanding these dynamics. It maps the distribution or consolidation of Bitcoin among addresses with 100 to 10k BTC. A rise in this metric signals Bitcoin whale accumulation, implying a reduced impact from institutional investors. Conversely, a fall indicates distribution, suggesting increased participation from these investors. This metric thus offers valuable insights into the evolving influences on the maturing Bitcoin market.
The increased institutional interest underscored Bitcoin's value as a hedge against inflation and store of value. This shift in market participation shaped Bitcoin's market dynamics in a few ways; diversity in market participants led to a more stable and resilient market. Higher liquidity levels associated with institutional trading reduced price manipulation and volatility. Sophisticated financial infrastructure development, e.g., regulated Bitcoin futures and options markets, allowed investors to manage risks more effectively.
Key Reasons to Monitor Bitcoin Whales
Monitoring Bitcoin whales holds several benefits for risk management, capturing volatility premium, model refinement, and liquidity assessment. Here are the key reasons:
Risk Management
- Bitcoin whale activity, though not a definitive risk metric, can provide signals for potential market shifts.
- The Transfer Volume from Whale Entities to Exchanges and Transfer Volume from Exchanges to Whale Entities charts along with the Whale Volume To/From Exchanges Net Position Change Workbench can help observe these trends.
- For a comprehensive understanding of crypto exchange risks, consider Glassnode's Exchange Risk Managementguide, which includes a case study on the FTX collapse and explains how to use key metrics and alerts effectively.
Capturing Volatility Premium
- Large whale transactions could suggest potential volatility. Understanding thresholds and historic correlations can aid in capturing this premium.
- Key charts: Same as those under 'Risk Management'.
Model Refinement
- Whale data, particularly Glassnode's point-in-time (PiT) metrics, can contribute to refining predictive models, but careful interpretation is crucial.
- Key charts include the point-in-time versions of the Transfer Volume from Whale Entities to Exchanges, Transfer Volume from Exchanges to Whale Entities, and Number of Transfers from Exchanges to Whale Entities.
Liquidity Assessment
- Whale activities can influence market liquidity, but deeper analysis is needed for precise assessments.
- Key charts: Absorption rate Workbench.
How to Monitor Bitcoin Whales: Tools and Techniques
For effective monitoring of Bitcoin whale behavior, sophisticated tools are essential, and Glassnode offers a suite of these.
With its unique Entity-Adjusted clustering algorithm, Glassnode provides an industry-leading, precise view of whale activities on the network. Its array of analytical tools aids in the interpretation of on-chain activities, focusing on:
- Trending accumulation patterns.
- Supply-held metrics.
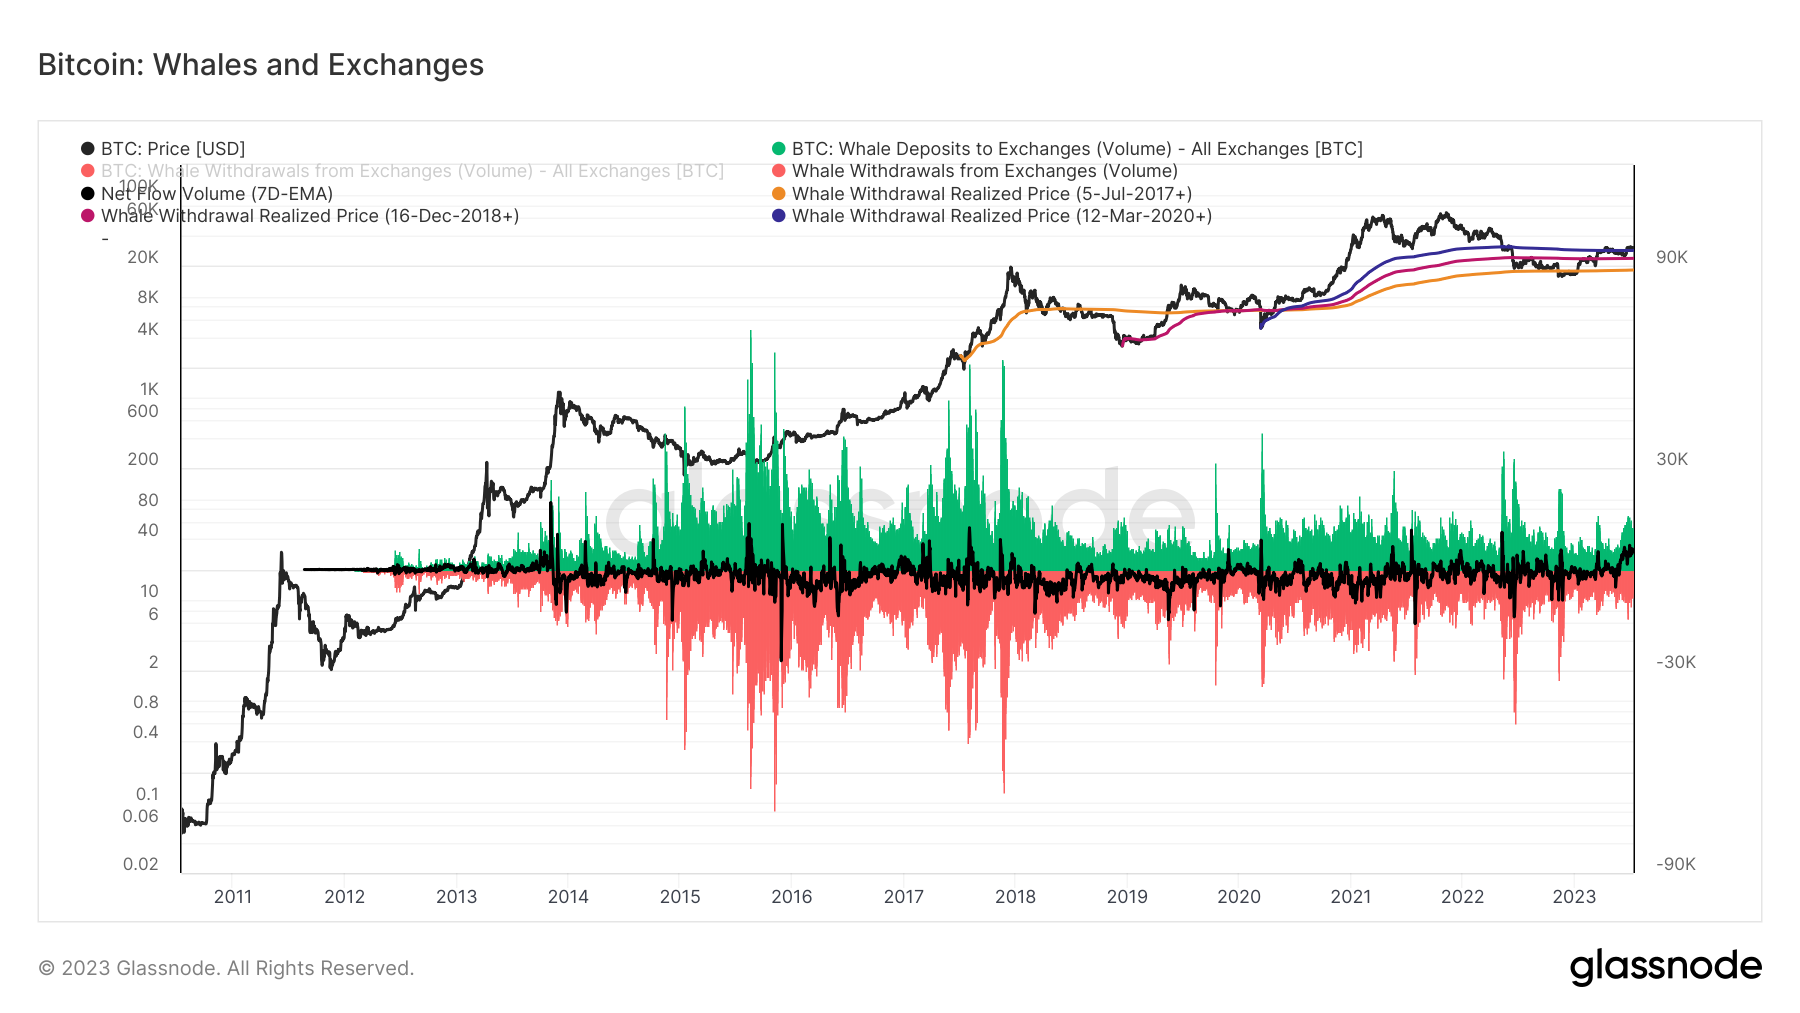
Key tools include the Bitcoin whale chart, showing BTC-denominated inflow and outflow volumes to exchanges linked with whale entities (those holding 1k+ BTC on-chain). This insight is invaluable in anticipating market movements and crafting investment strategies.
The whales and exchanges metric provides a measure of market centralization - high concentration may indicate potential volatility.
Another essential tool is the Whale Accumulation chart. It maps large Bitcoin holders' accumulation and distribution behavior by:
- Showcasing the total supply owned by addresses holding 100 to 10k BTC, divided by the address count.
- Capturing UTXO consolidation or splitting (dividing large holdings across multiple addresses) by larger coin holders.
- Revealing increase or decrease in whale aggregate holdings.
Leveraging Bitcoin Whale data with Glassnode Studio
Glassnode Studio's data analytics tools empower financial institutions and hedge fund analysts with precise insights into Bitcoin whale behavior. Here's how:
- Insightful Dashboards: Glassnode's platform transforms raw data into insightful dashboards, elucidating complex Bitcoin whale patterns.
- Customizable Workbenches: Customizable workbenches, like the Supply per Whale Entity-Adjusted, provide targeted insights.
- API Access: For seamless data integration into existing models and systems, Glassnode's API access enables a more granular understanding of whale-influenced market dynamics.
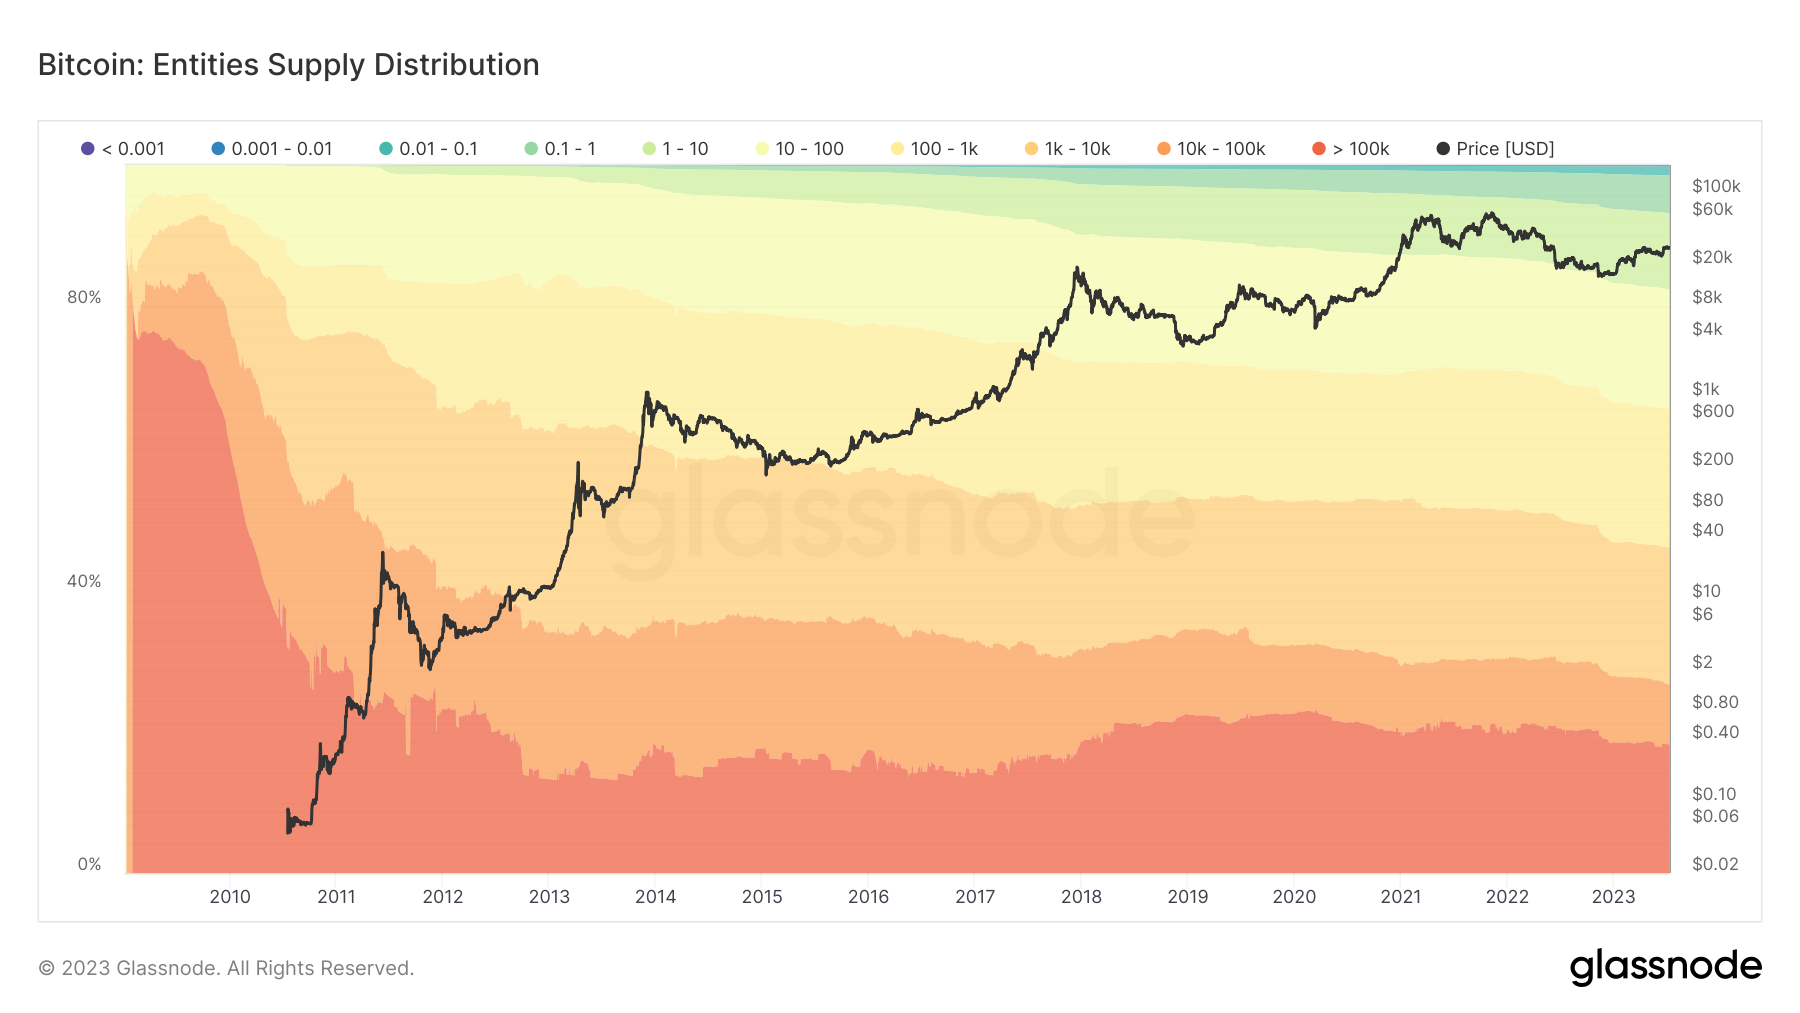
With these resources, monitoring bitcoin whales becomes less speculative and more of an exact, data-driven endeavour. The circulating supply distribution by specific balance bands is another key Glassnode tool, further highlighting the platform's capabilities.
Conclusion
Monitoring the behaviour of Bitcoin whales is paramount. The 'Supply Per Whale' and 'Entities With Balance ≥ 1k' charts provide key insights into the behaviour of major holders, shedding light on their accumulation and distribution trends. Glassnode, with its comprehensive suite of tools - including charts, Workbench, and API - is at the forefront of these monitoring efforts. Its detailed on-chain data delivers necessary insights for analysts and financial institutions. As the crypto ecosystem evolves, on-chain data remains a crucial guide for advanced market comprehension