The Shrimp Supply Sink: Revisiting the Distribution of Bitcoin Supply
The supply distribution of Bitcoin continues to be a topic of great interest, for analysis of capital flows, and also for observing behaviors of investor cohorts. In this piece, we break down the BTC supply by wallet size, and explore how coins disperse over time.


The supply distribution of Bitcoin continues to be a topic of great interest, both for the analysis of the flow of capital, but also for observing cohort behaviors of the holder base. The distribution of coins is also the subject line for many Bitcoin critics, often mis-quoting large wallets as evidence for a heavy supply concentration held by a small handful of whales.
In our original article, we analyzed the distribution of Bitcoin to show that BTC ownership can be demonstrated to disperse over time, and is much less concentrated than often reported. To achieve this, we implemented our entity-adjustment clustering algorithms, which collate and group multiple addresses deemed to have a single entity owner. These tools improve both our accuracy and precision for measuring economic activity on-chain, and isolates large entities such as exchanges or ETF products which represent large collective user-bases. Both of these in combination enhances our signal-to-noise ratio for using on-chain data to make decisions.
The aim of this article is to provide a follow-up update on the growth and contraction of supply held by these defined entity cohorts, and to provide remarks on the distribution of the circulating supply as it stands today.
Note on analysis nuance: For simplicity, this report, and the figures shown reflect aggregate values, and limits discussion of some of the underlying nuances. More detailed points relating to this nuance are presented at the end of the piece for further reference.
TL;DR Key Takeaways
- This refreshed analysis of supply changes between wallet size cohorts further supports the case that the BTC supply has indeed continued to distribute over time, with relentless distribution by miners being an indicative example.
- An increasingly large proportion of supply is held by smaller entities representative of retail holders, with Shrimps (< 1BTC) and Crabs (< 10 BTC) absorbing a remarkable 2.25x more coins than were mined in 2022.
- Institutional adoption post March 2020 is visible on-chain across several wallet cohorts, with balances showing signs of being increasingly market driven (i.e. swelling/contracting with price). Entities with a balance between 10 and 1k BTC are absorbing coin volumes equivalent to 100% of issued coins in 2022.
- Exchange reserves continue to deplete in aggregate, especially following the collapse of FTX. This is a combination of both renewed demand for self-custody, but also the expansion of institutional and collaborative custody solutions, and exchange traded products like GBTC.
🪟 Metrics covered in this report are available in our Entity Supply Distribution Dashboard.
Bitcoin Supply Distribution
To start, we will reintroduce our sea-creature cohorts, which divide network entities according to their Bitcoin holdings:
- Shrimps (<1 BTC)
- Crab (1-10 BTC)
- Octopus (10-50 BTC)
- Fish (50-100 BTC)
- Dolphin (100-500 BTC)
- Shark (500-1,000 BTC)
- Whale (1,000-5,000 BTC)
- Humpback (>5,000 BTC)
- Exchanges and Miners
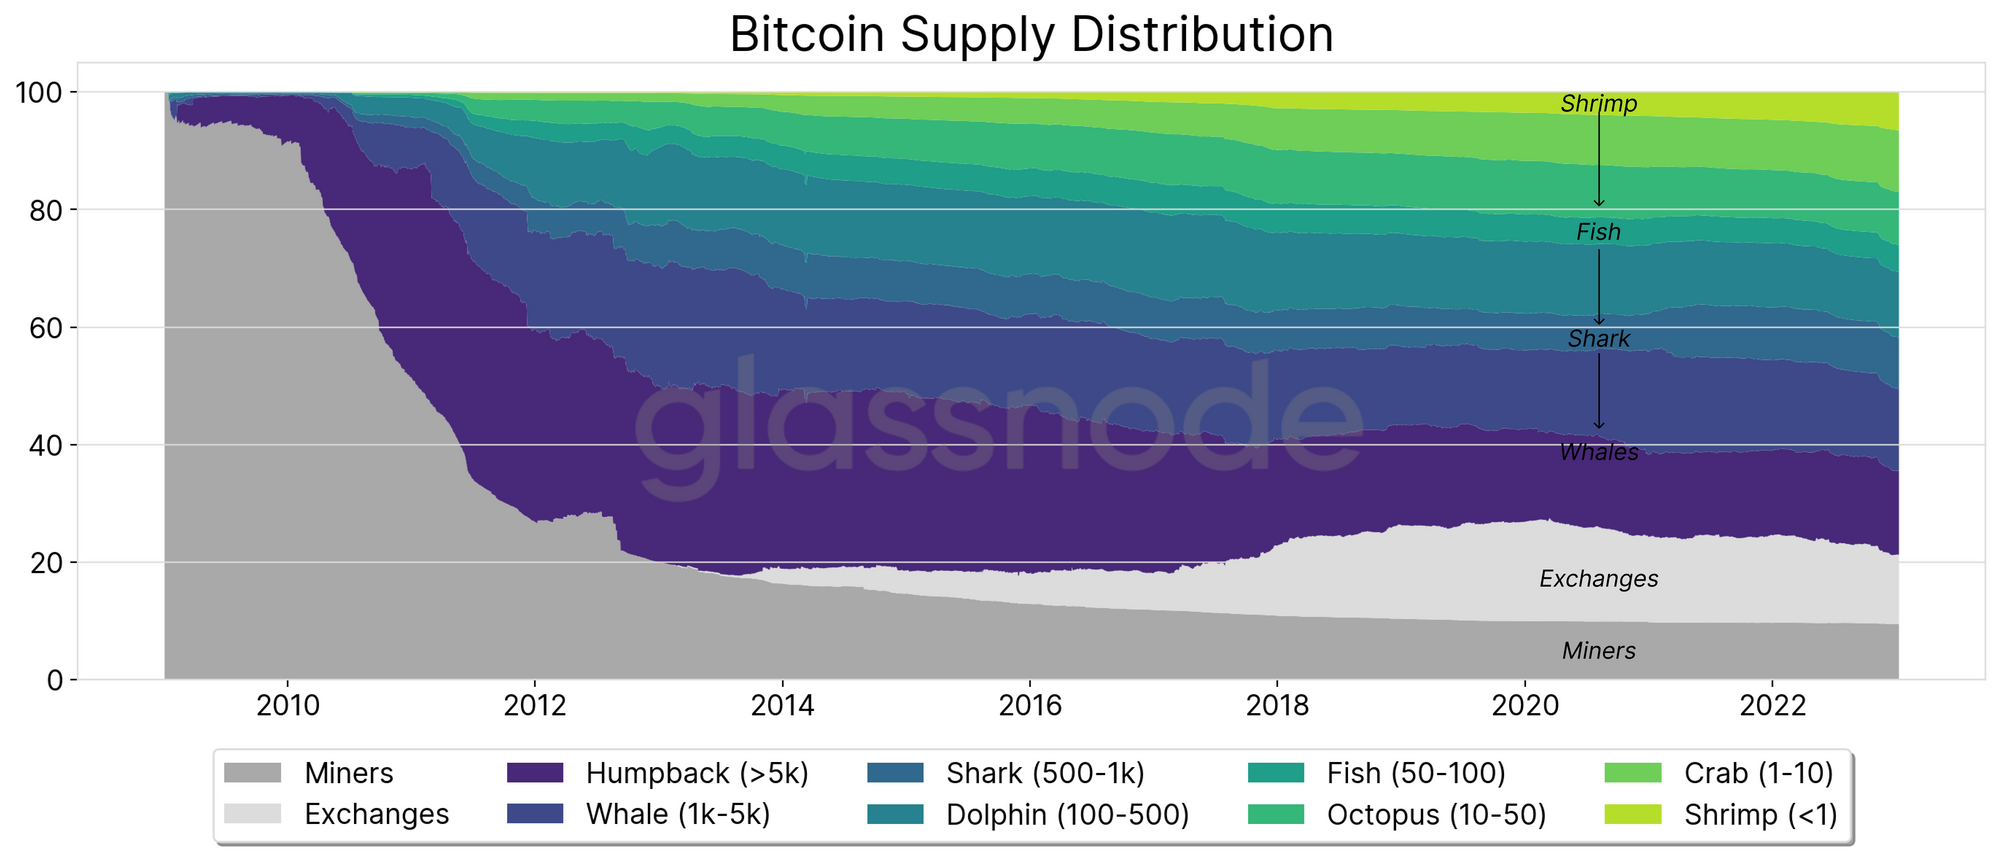
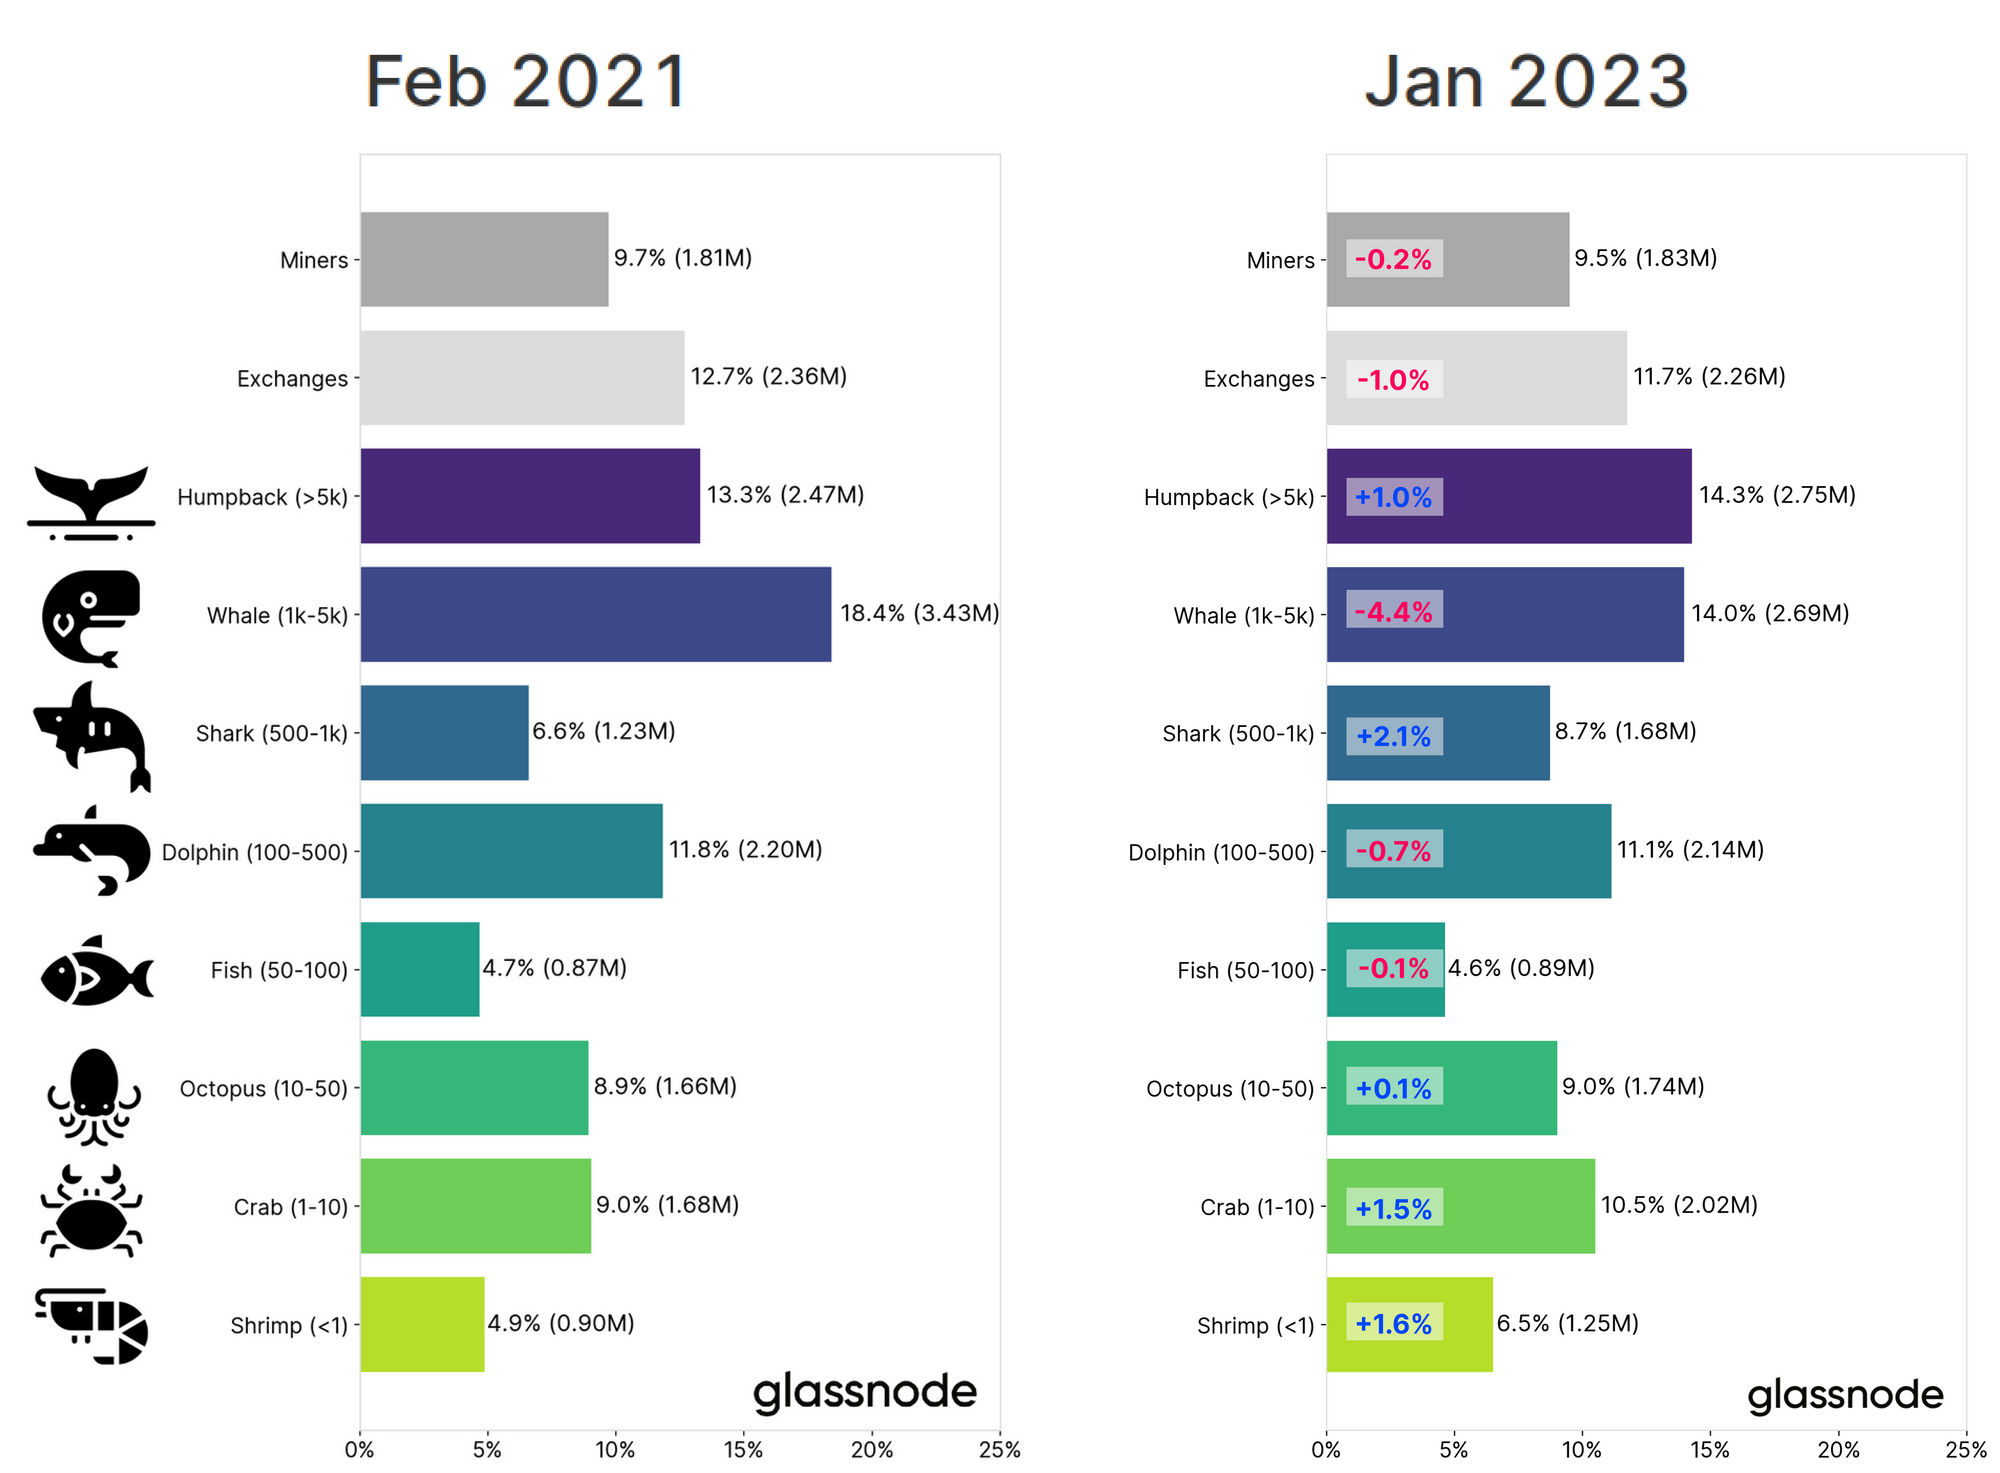
In our original article, we calculated both the percentage of the circulating supply held, as well as the raw volume of coins held per Entity cohort. The chart below provides a summary of the state of the relative ownership of the Bitcoin supply approximately 2-years later.
Assessing the change experienced by each cohort since Feb 2021, we can see that the smallest entities (Shrimps to Octopus) saw relative growth, whilst Whales, Miners and Exchanges experienced the largest contractions in supply share.
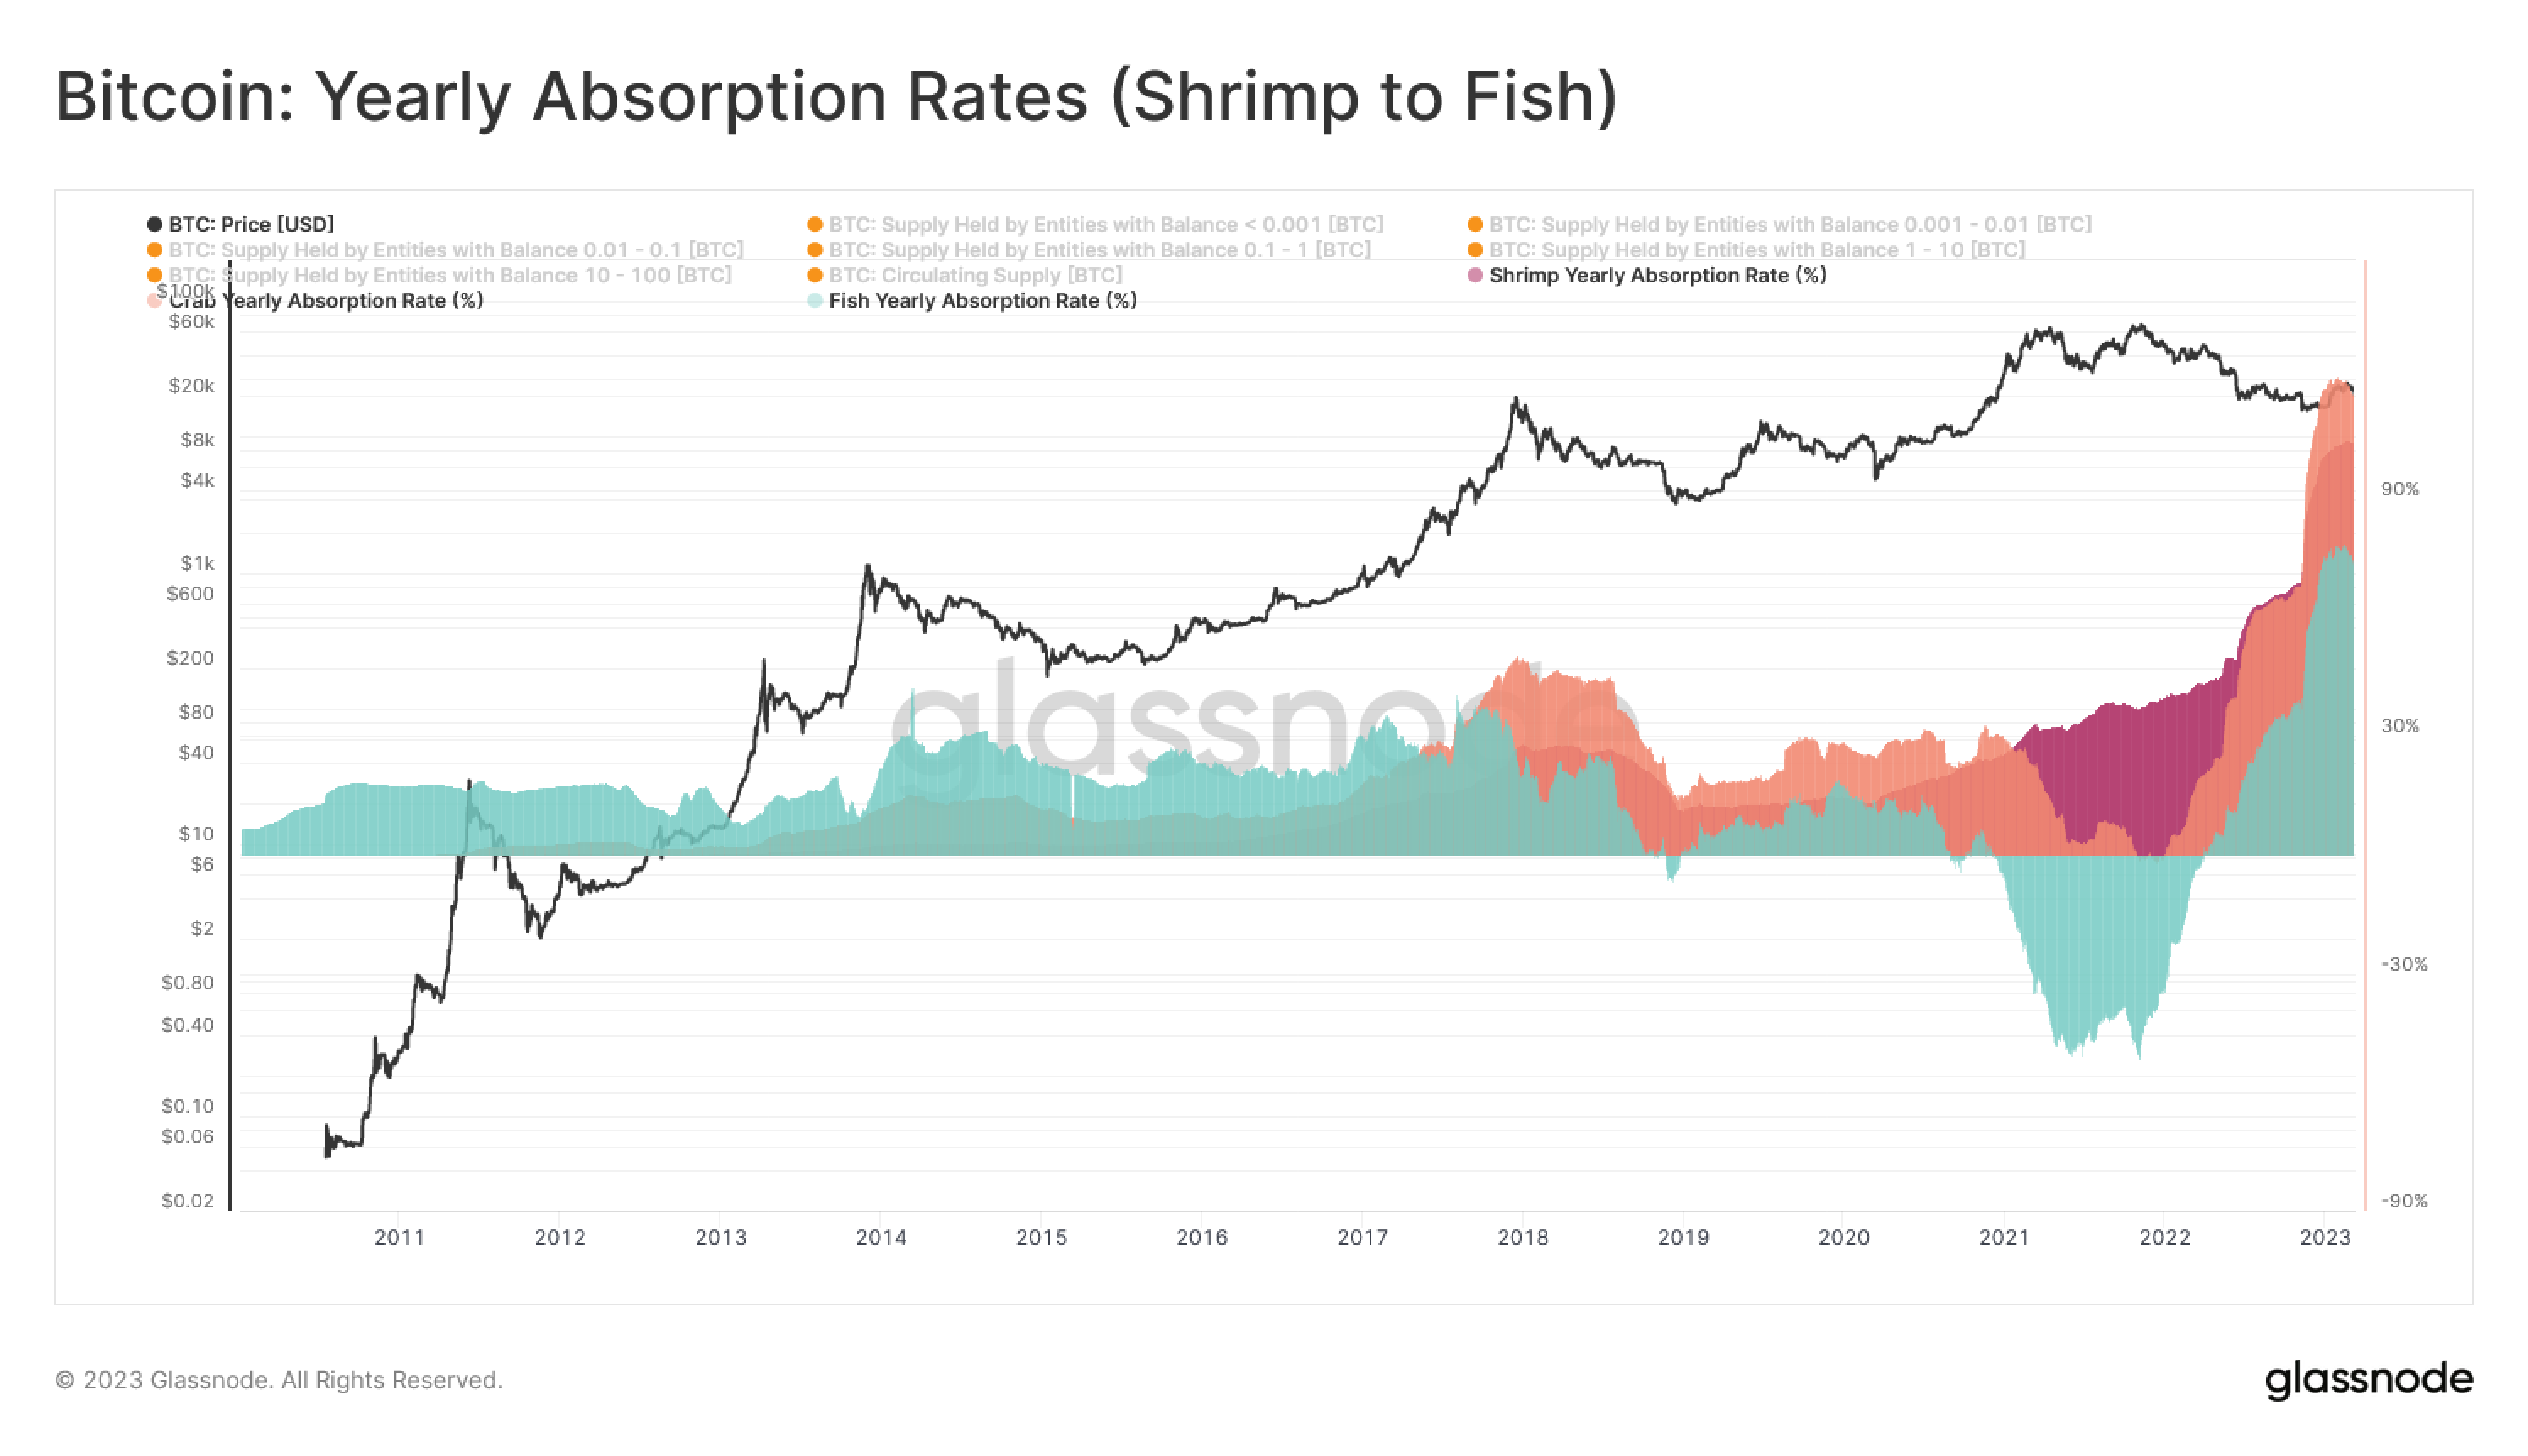
We can also explore changes in the relative distribution of supply by way of a new metric, the Yearly Absorption Rate. This tool provides a relative measure of balance change relative to the volume of newly minted coins over the last year. This provides insight into the level of expansion / contraction a cohort has experienced relative to new supply entering the market.
- Absorption Rate of 120% means a cohort balance grew by 1.2x new issuance.
- Absorption Rate of 0% means a cohort balance was flat over the past year.
- Absorption Rate of -80% means a cohort balance declined by 0.8x new issuance.

⛏️ Miners
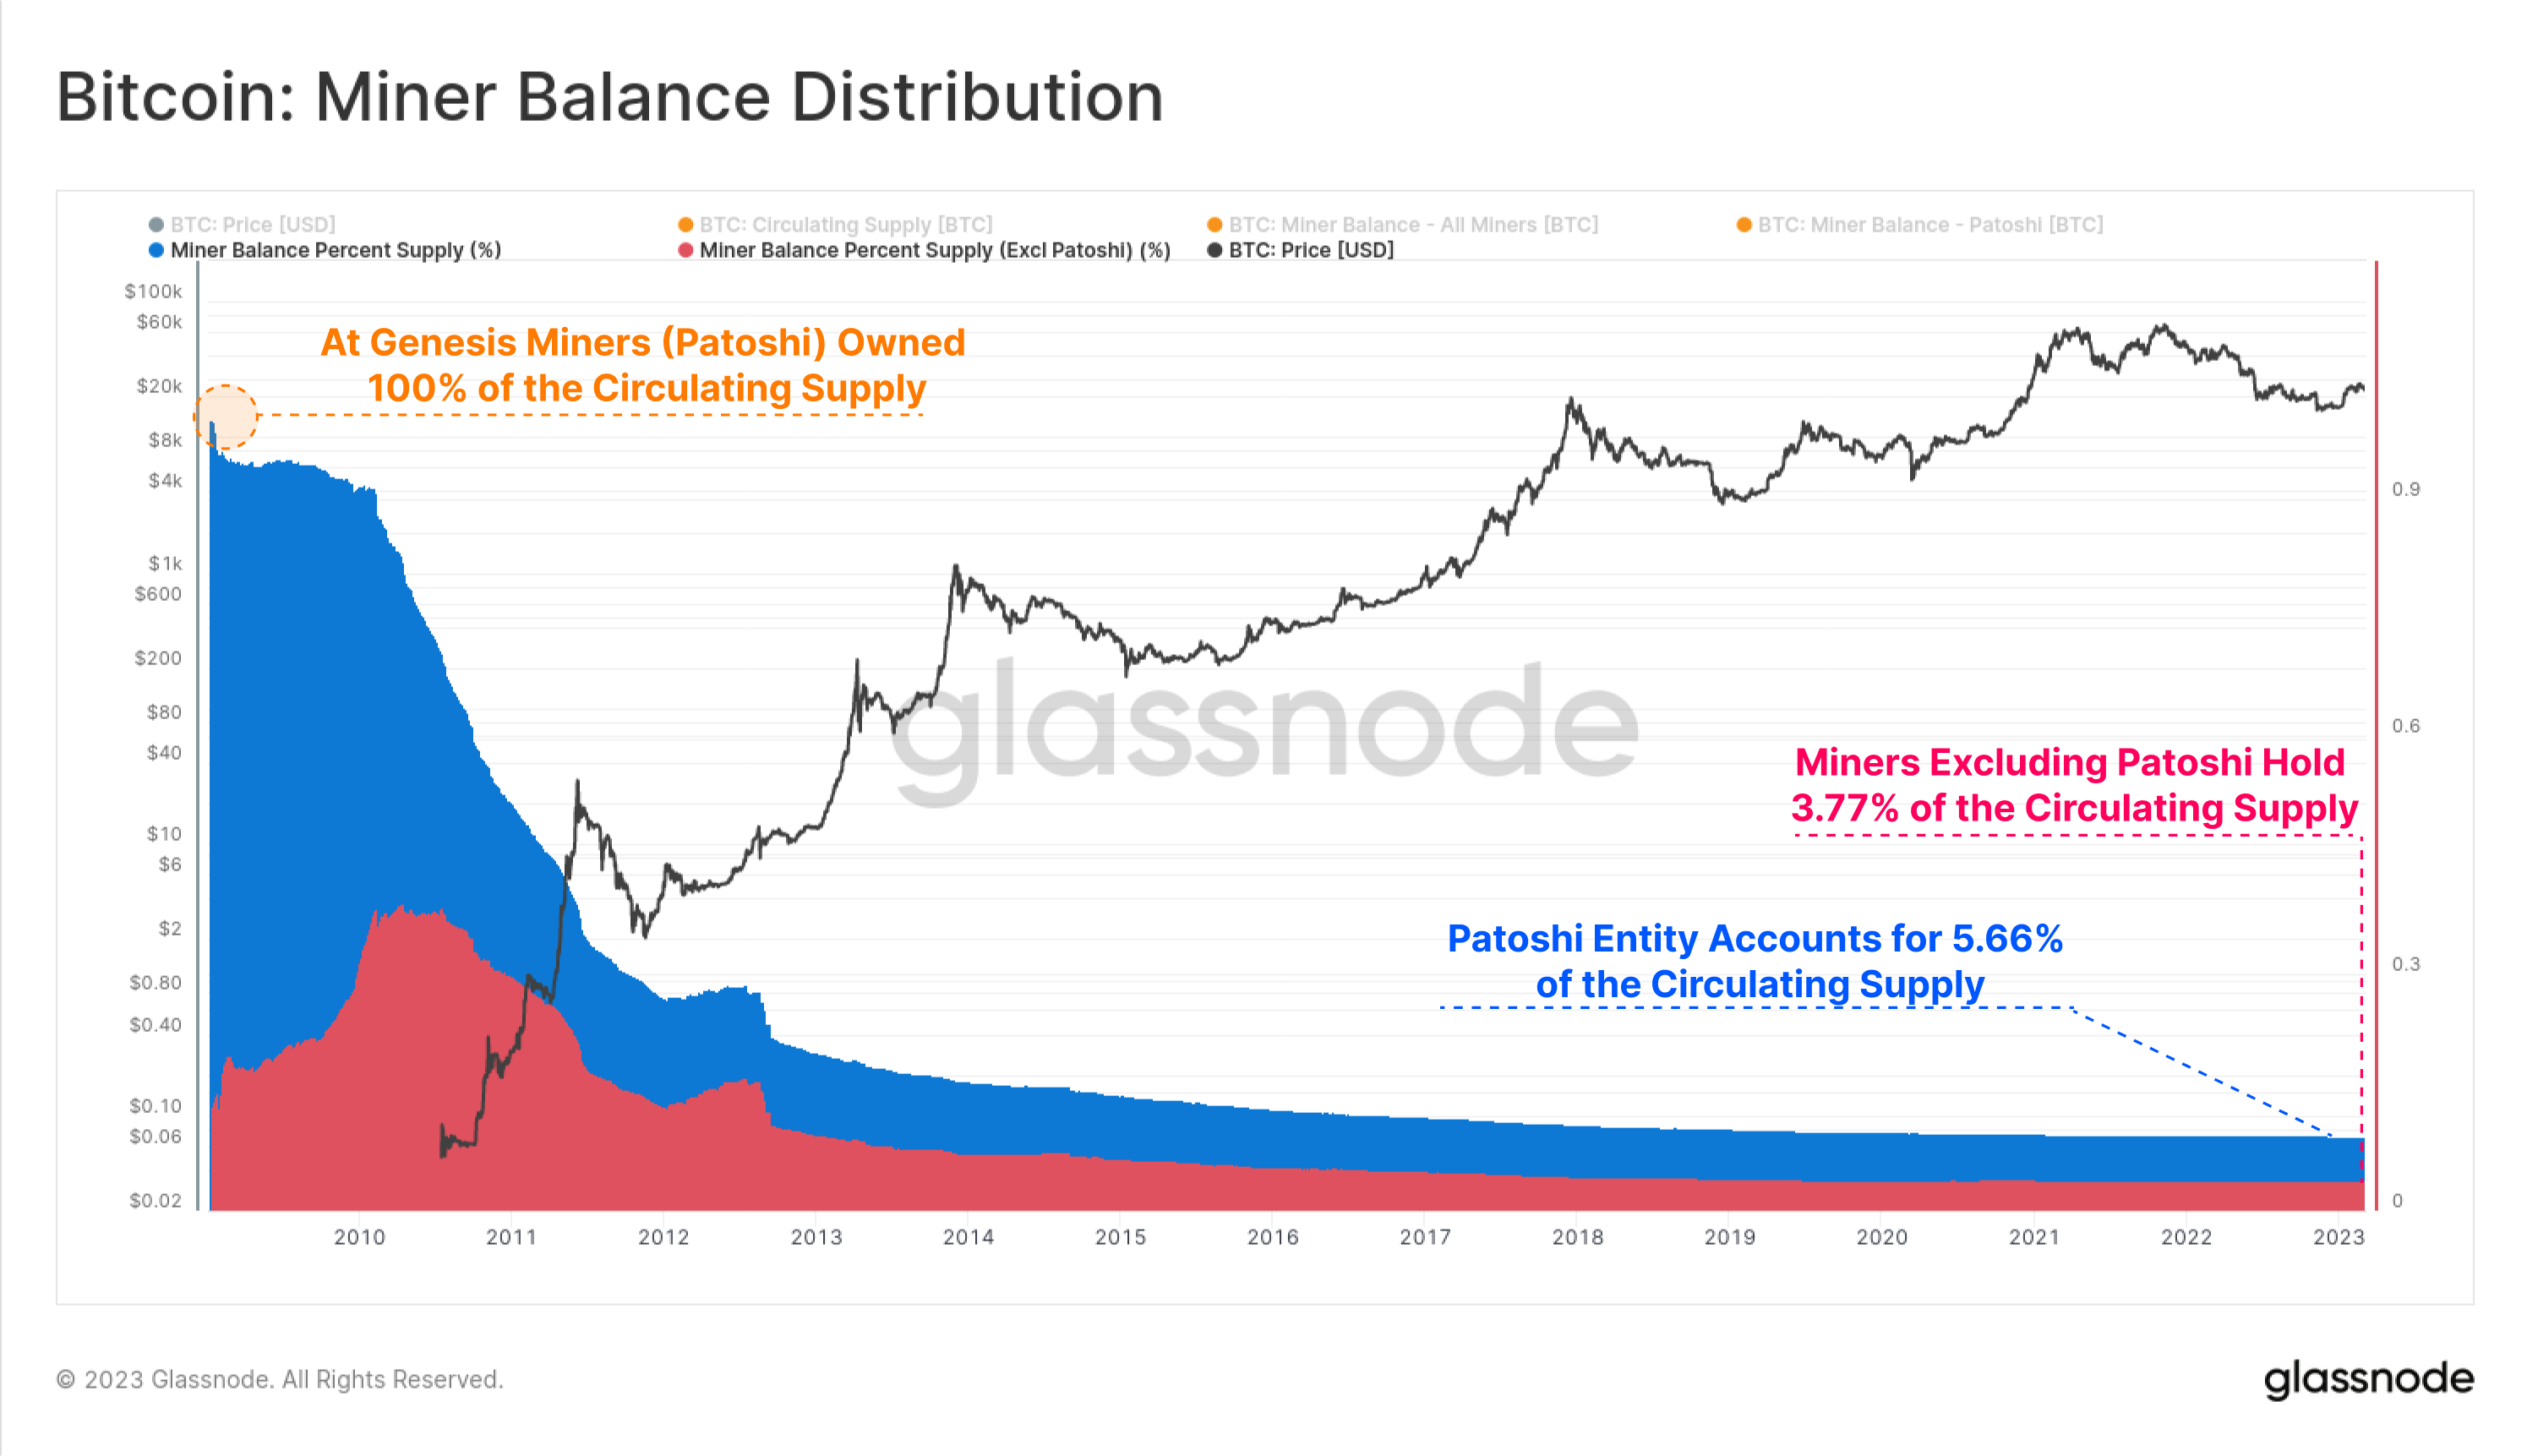
We will start with the Miner cohort, who are the production side of BTC, and the original custodian of every coin in circulation. A common mainstream critique of Bitcoin is that large and well capitalized industrial scale miners have an outsized ability to obtain and hoard coins, becoming a point of supply concentration (of course this ignores the tremendous input costs, and hyper-competitive market for BTC production).
Of all the critical claims levelled at Bitcoin, this one is likely the easiest to disprove. Considering the total balance held by Miners, we can see an aggregate decline from 100% ownership at genesis to just 9.5% at present date. This is actually an overestimation of the share of the circulating supply held by miners as it includes the Patoshi coins (which are increasingly likely to be lost as time passes). Removing these, we can see that non-Patoshi miners collectively own just 3.77% of the circulating supply today.
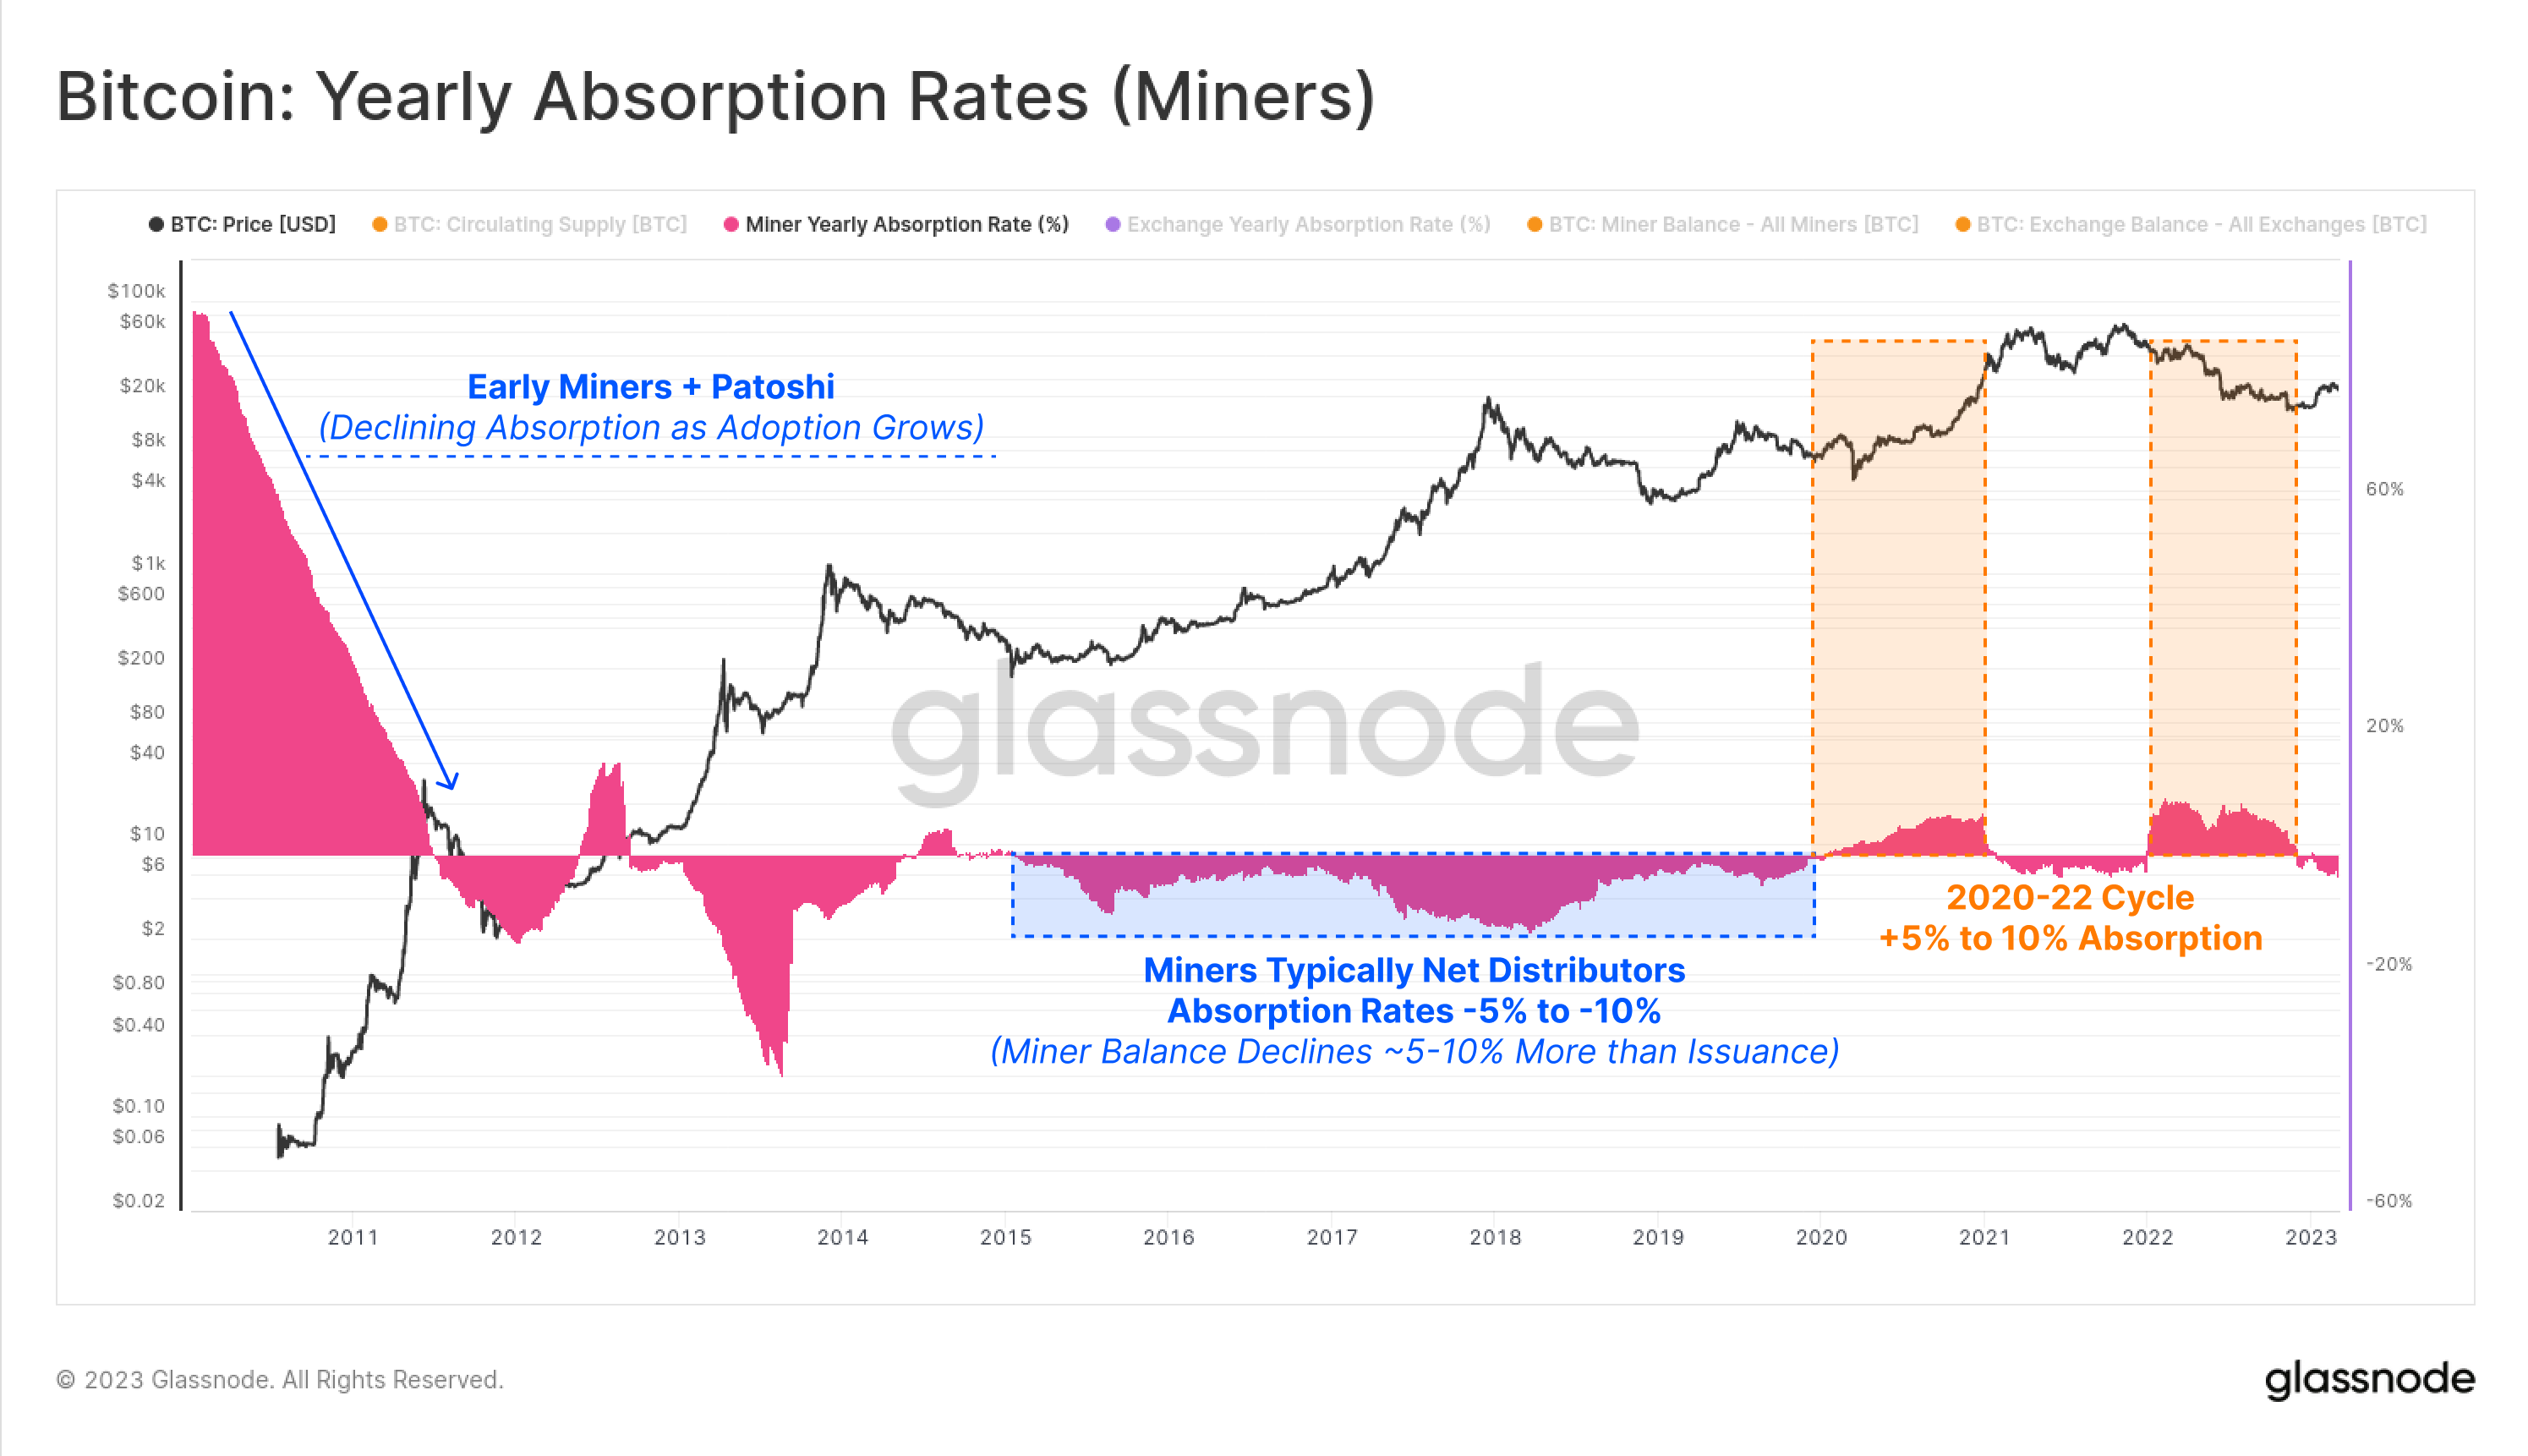
This net distributive force can also be seen in the Yearly Absorption Rates for miners, where in general, this cohort balance declines by 1.05 to 1.1 BTC for every 1.0 BTC that is mined. This represents a gradual expenditure of the accumulated balance across all miners throughout history.
Of note are periods in the 2020-22 cycle, where miners actually absorbed slightly more BTC than was mined. This coincides with the emergence of publicly traded mining companies, with greater access to capital markets to fund operations outside direct sales of produced coins.
🦐 Shrimps [< 1 BTC] to 🦀 Crabs [1-10 BTC]
For assessing retail participation, the Shrimp to Crab cohort is our first port of call, encompassing all entities holding less than 10 units of BTC. Despite the profile of this cohort mainly consisting of retail participants. Tenured HODLers with multi-year accumulation strategies will also appear within this distribution, especially if they use privacy best practices (such as avoiding address re-use or consolidating UTXOs).
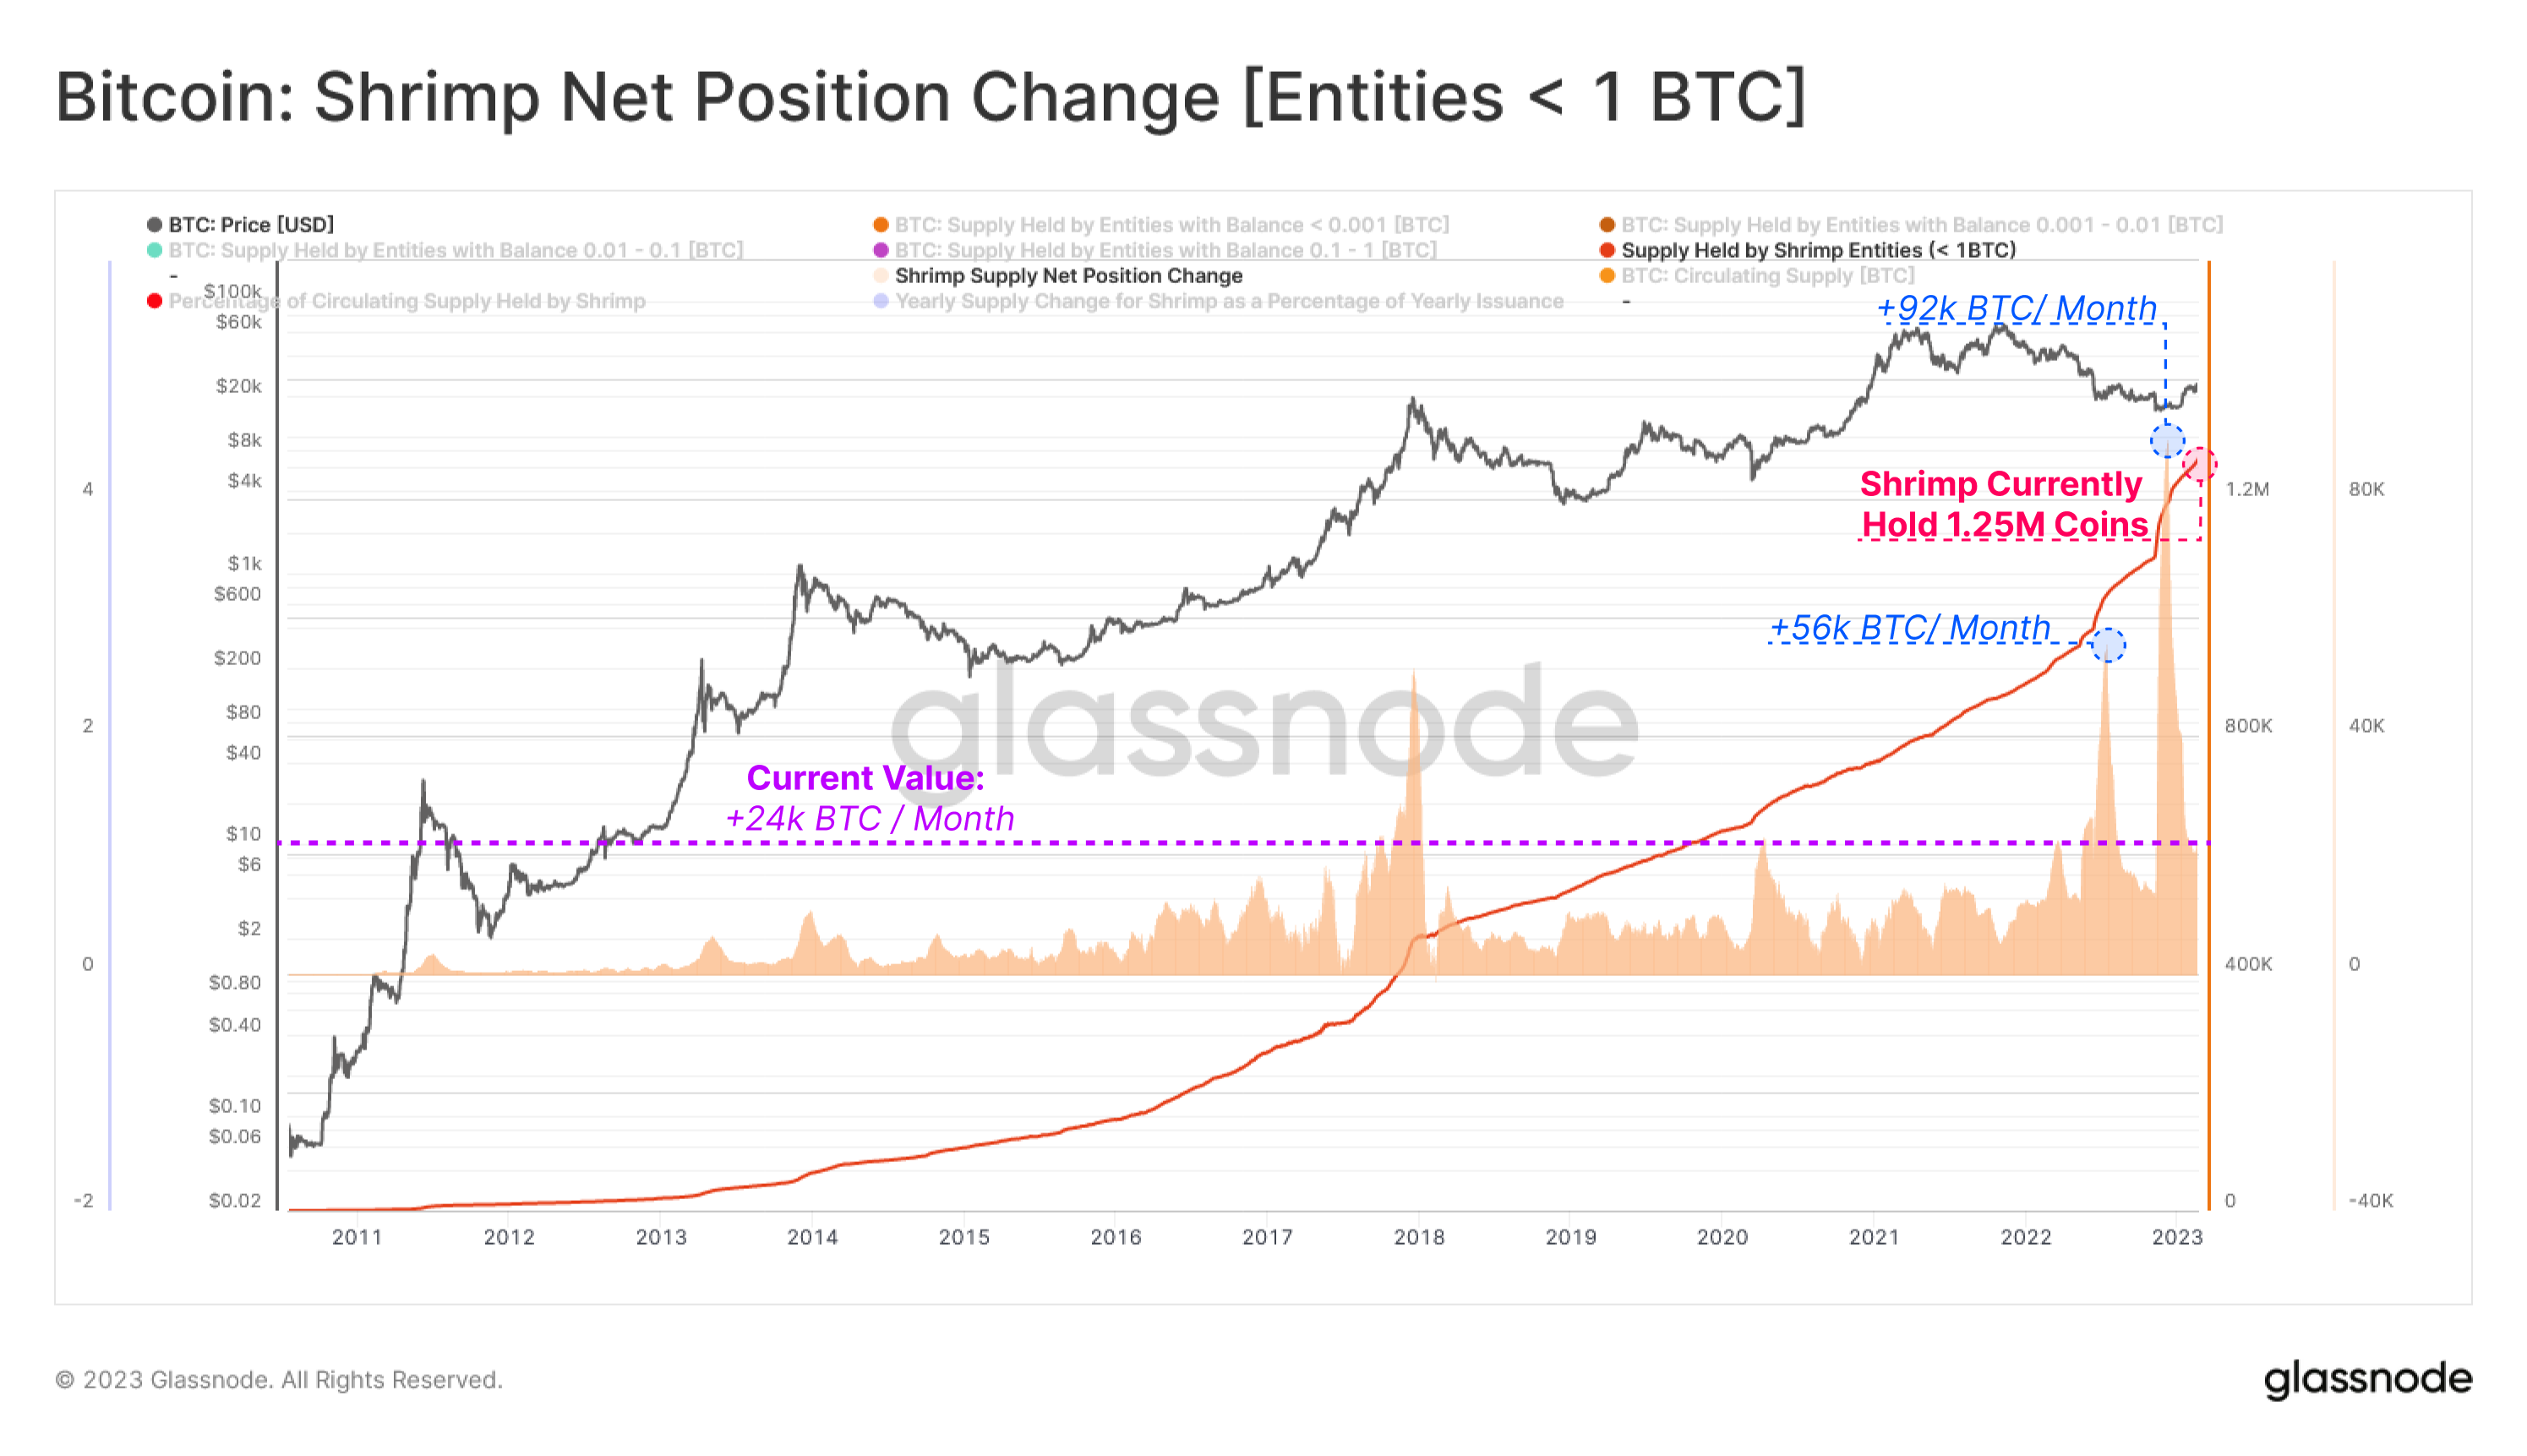
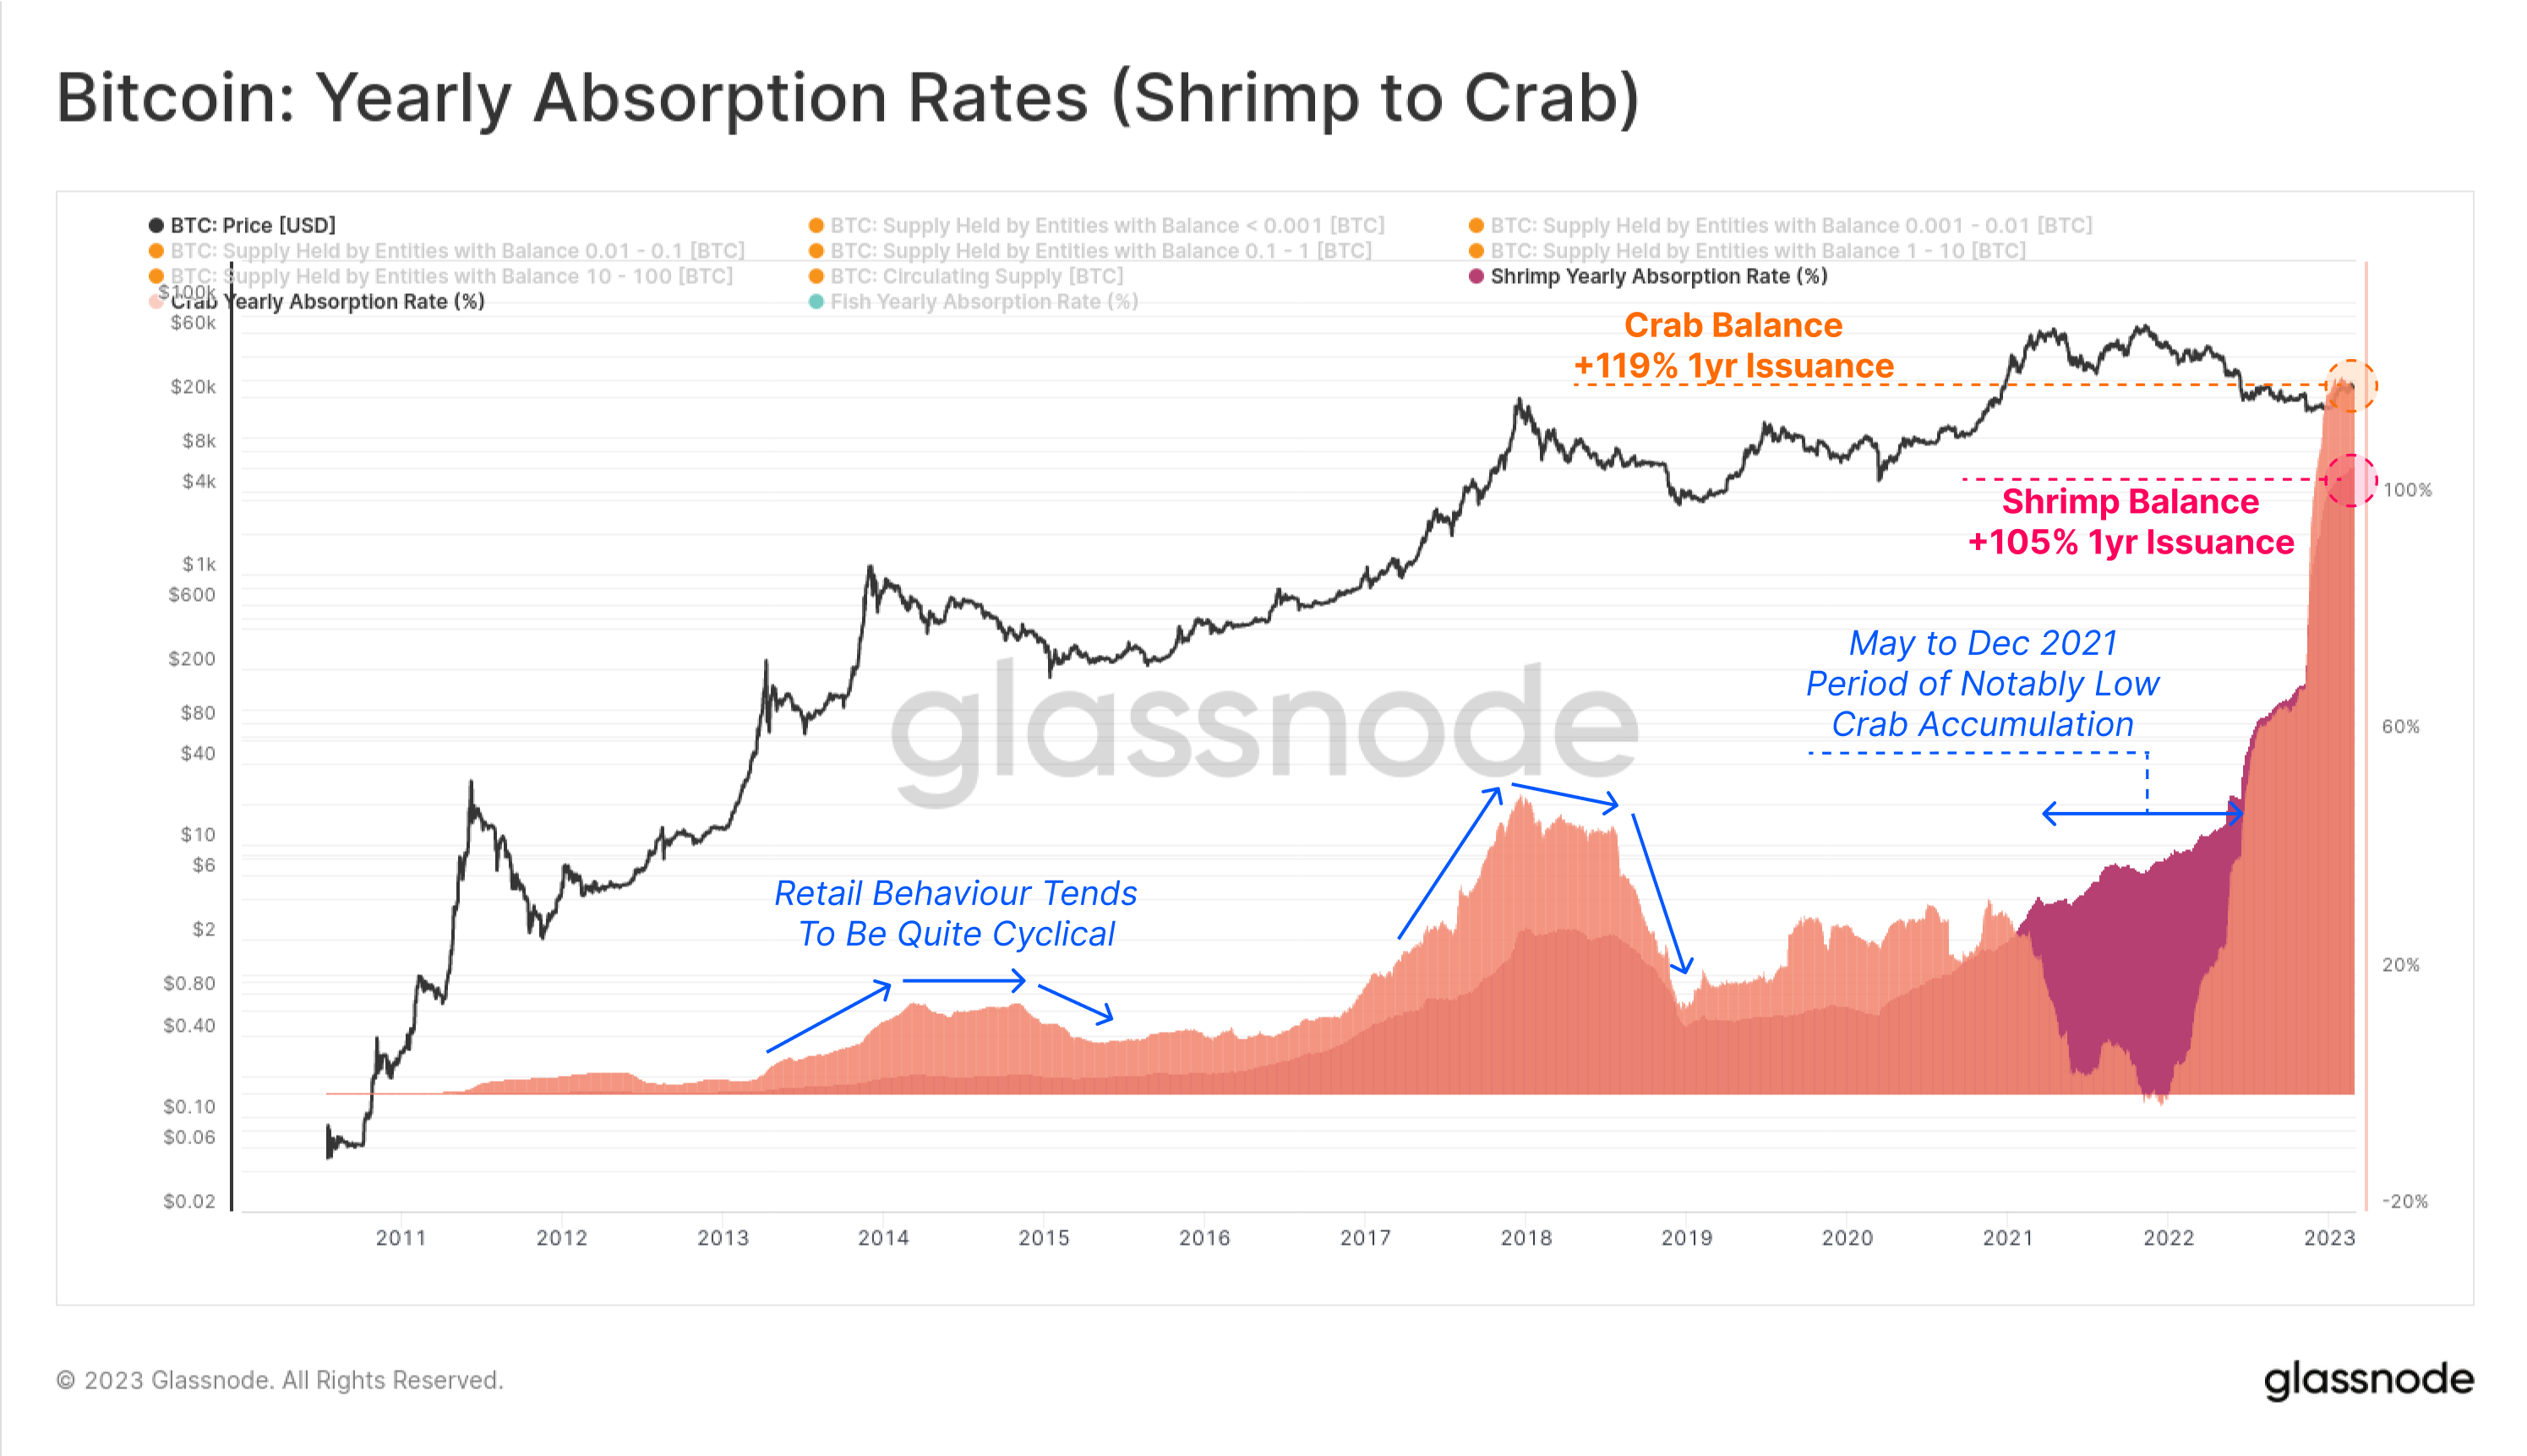
Analyzing the total supply held by Shrimp entities and the subsequent monthly change to the supply held, we note 2 major observations:
- The monthly position change has remained positive near indefinitely, with only 37 trading days recording a lower aggregate Shrimp balance than the prior month.
- Both the LUNA and FTX implosions inspired the largest monthly increase in supply on record, at +56k and +92k BTC per month, respectively.
The current monthly position change remains historically elevated at +24k BTC per month, and only 224 trading days have seen a larger monthly change.
The Crab cohort has experienced month-on-month balance growth for 94% of all trading days, with only 305 days of decline. Following the LUNA and FTX implosions, the Crab class also experienced its largest monthly inflow of +78.4k and +130k BTC, respectively.
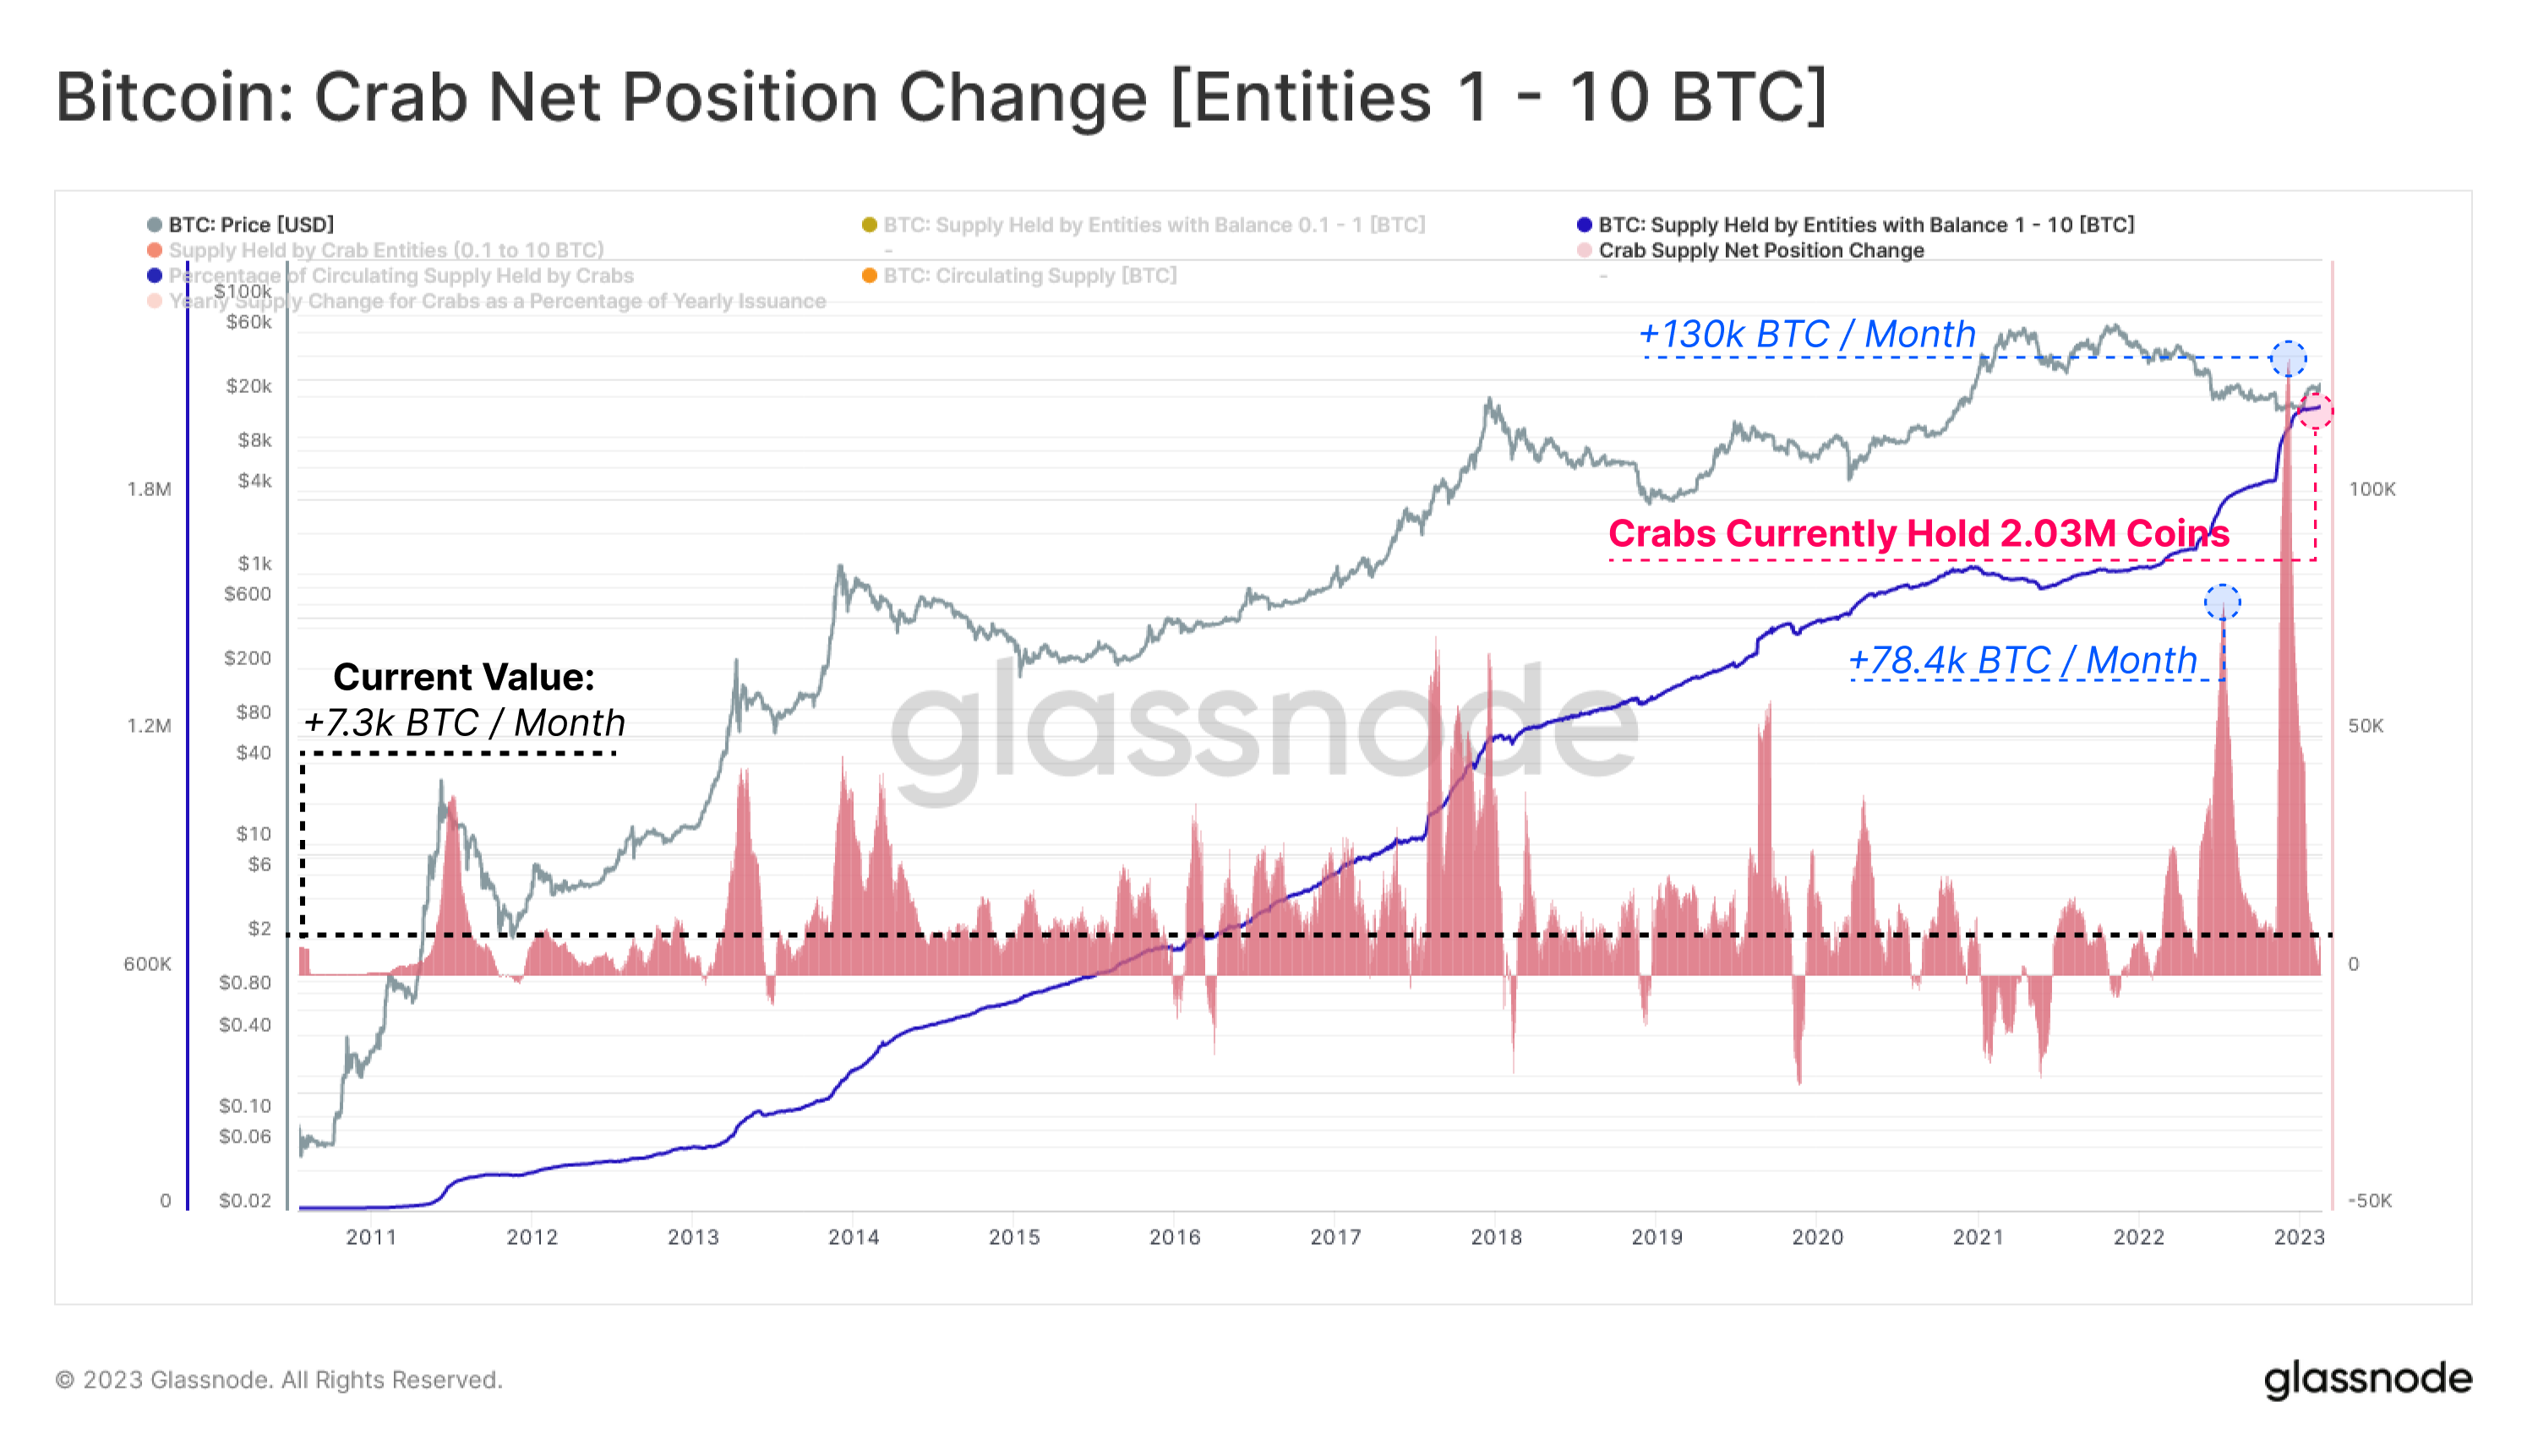
At present, Shrimp entities command a non-trivial 6.6% of the circulating supply (up from 4.86% 1yr ago), equivalent to 1.26M BTC, whilst Crabs hold 10.5% of supply (up from 8.7% 1yr ago), equivalent to 2.03M BTC.
The Yearly Absorption Rates for both cohorts have also been almost always positive since inception, with the only notable exception for Crabs being a lower to flat participation throughout H2-2022. These cohorts are currently experiencing an all-time-high in relative balance growth, recording an absorption rate equivalent to 105% of the yearly issuance for Shrimps, and an even larger 119% for Crabs.
🐟 Fish [10-100 BTC] to 🦈 Sharks [100-1k BTC]
This cohort accounts for higher-net worth individuals, trading desks, and institutional sized entities holding between 10 and 1k BTC. This particular cohort has a notably large balance range, a result of several nuances related to how these entities came to possess, and also manage their holdings. This cohort accounts for:
- Early Bitcoin adopters who acquired many coins at significantly cheaper prices.
- Wealthy individuals who allocated large positions to Bitcoin, including those who spread acquisitions over several tranches (and thus may hold unclustered UTXOs).
- Trading desks, high net worth individuals, and institutions that utilize a blend of self-custody, and institutional grade custody solutions.
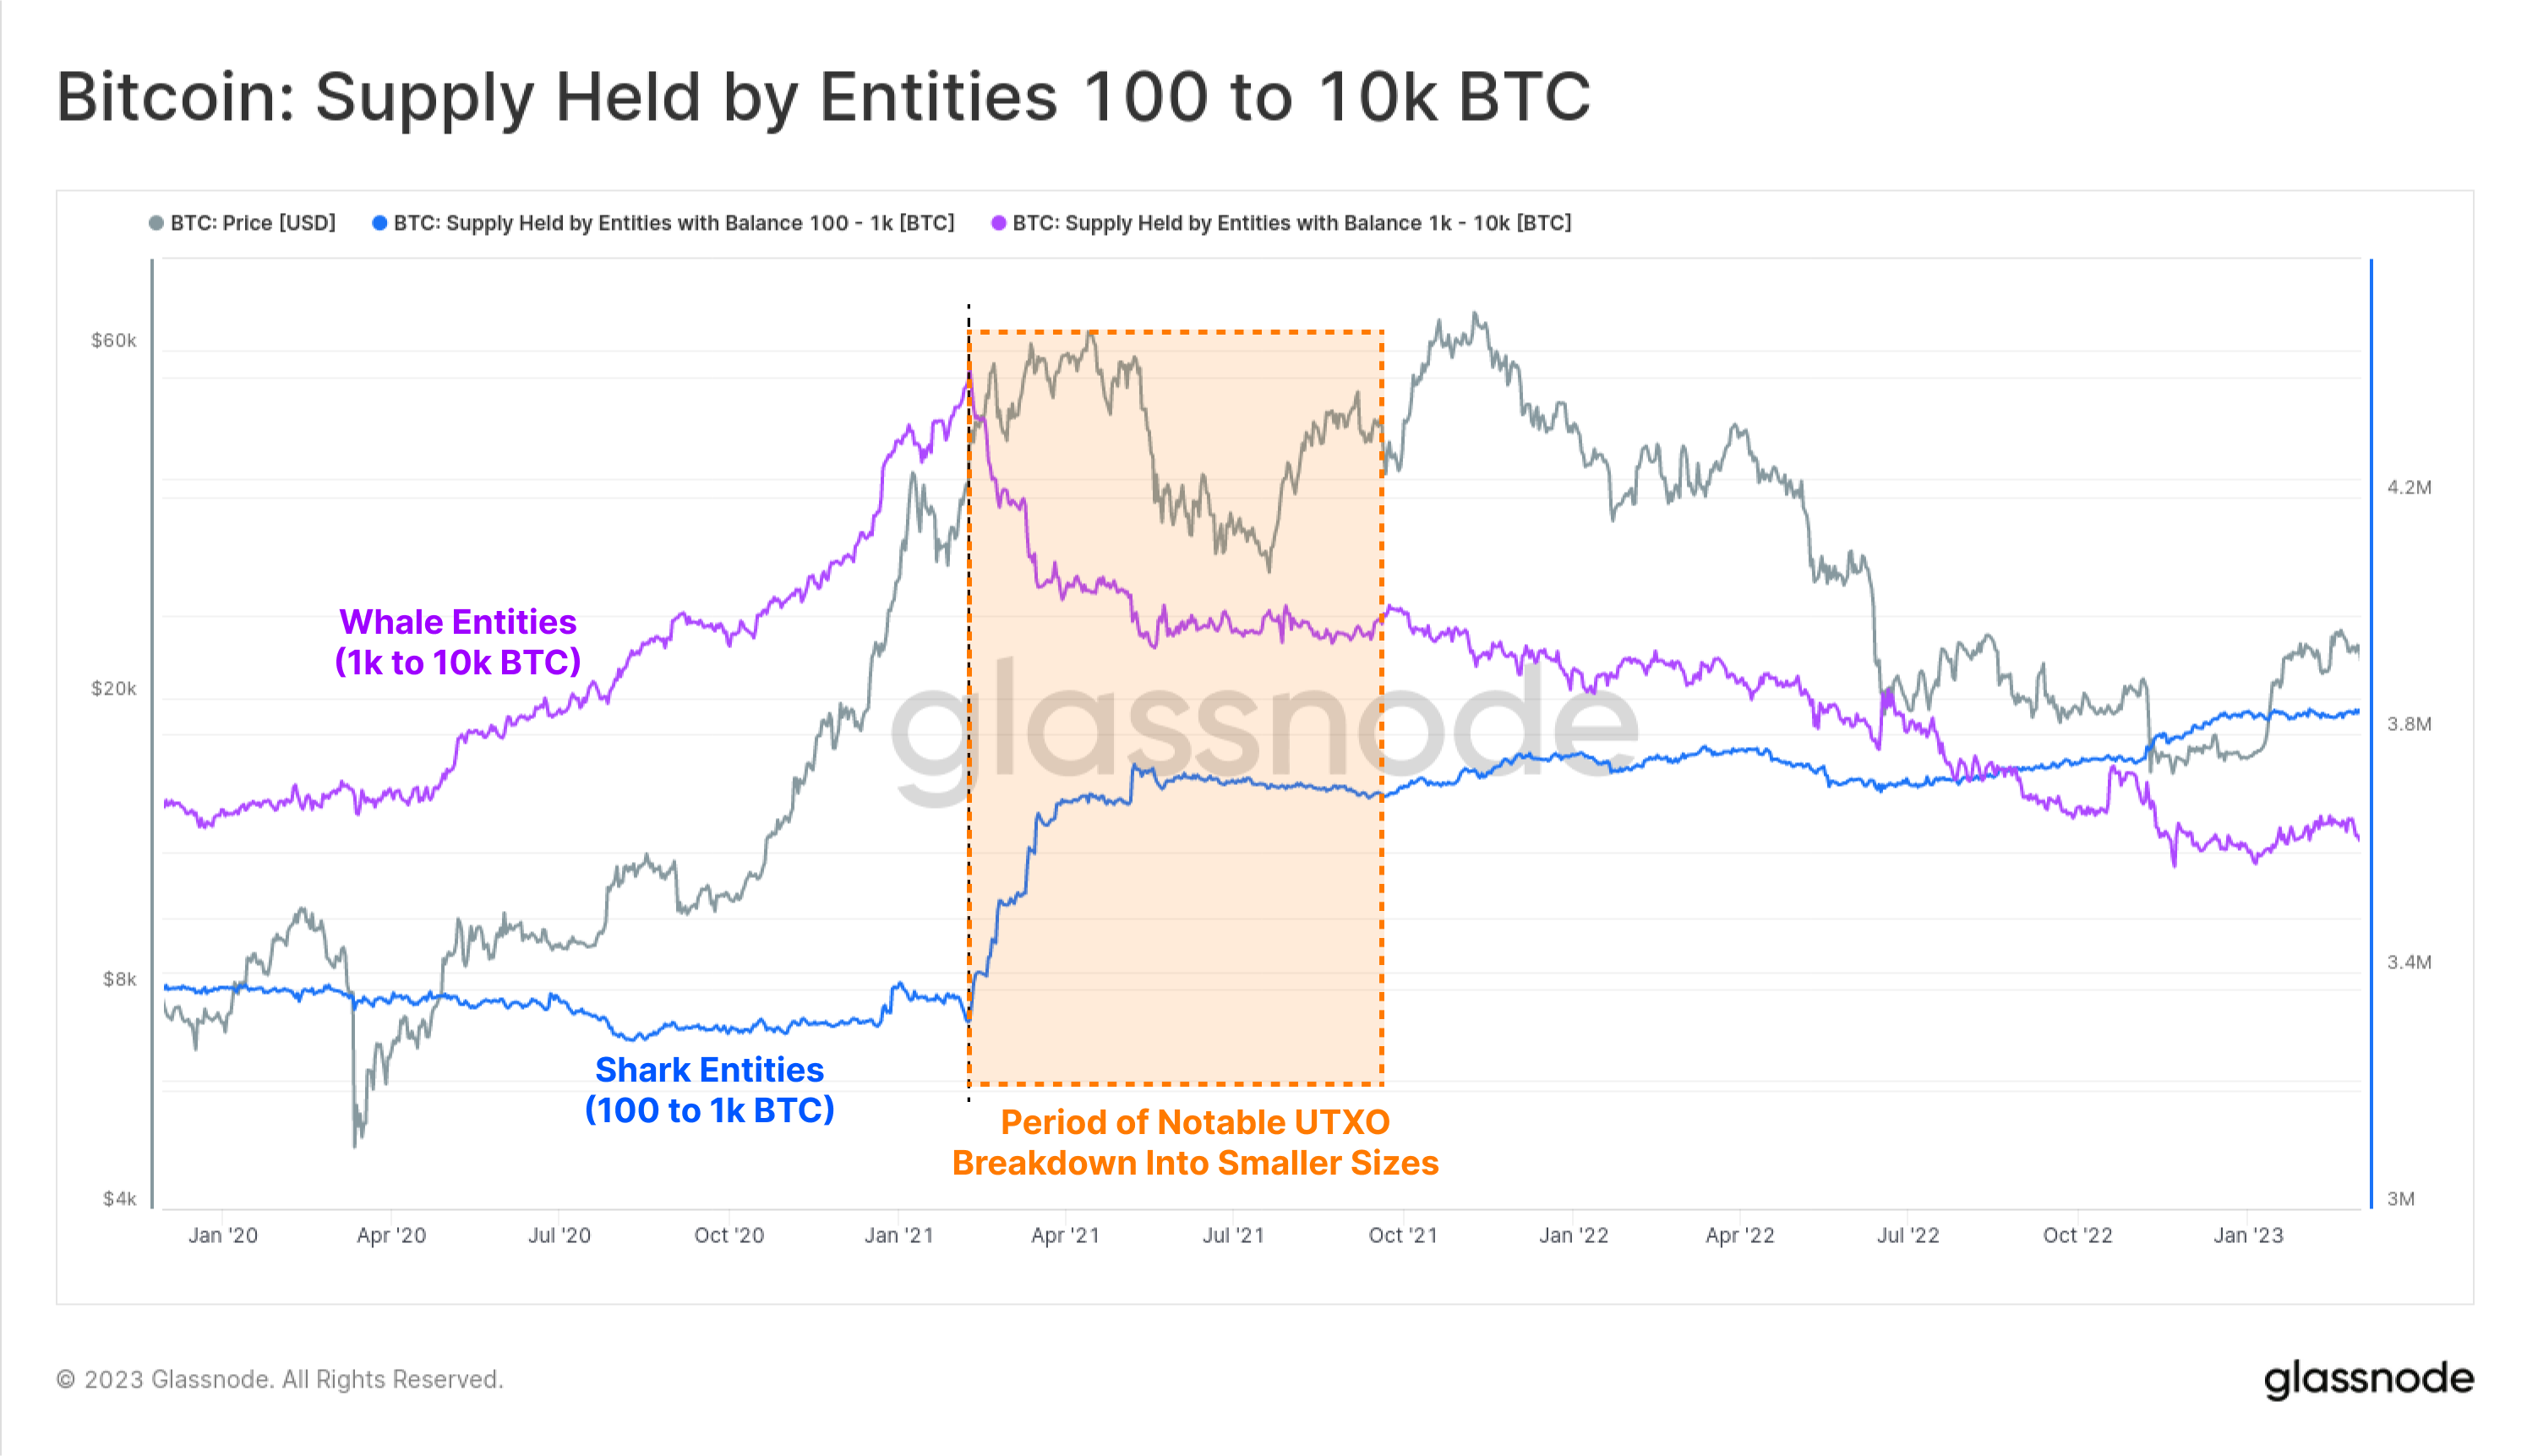
- Given the Bitcoin ledger is transparent, many larger holders, and custodians will break down larger holdings into sets of smaller UTXOs to avoid ‘whale watching’ detectors (e.g. 1k BTC could be reflected in 100x smaller 10 BTC UTXOs).
An example of this last point can be seen in the chart below, where large volumes of UTXOs were broken down from the ‘Whale cohort’, and transferred into the ‘Shark cohort’ in early 2021.
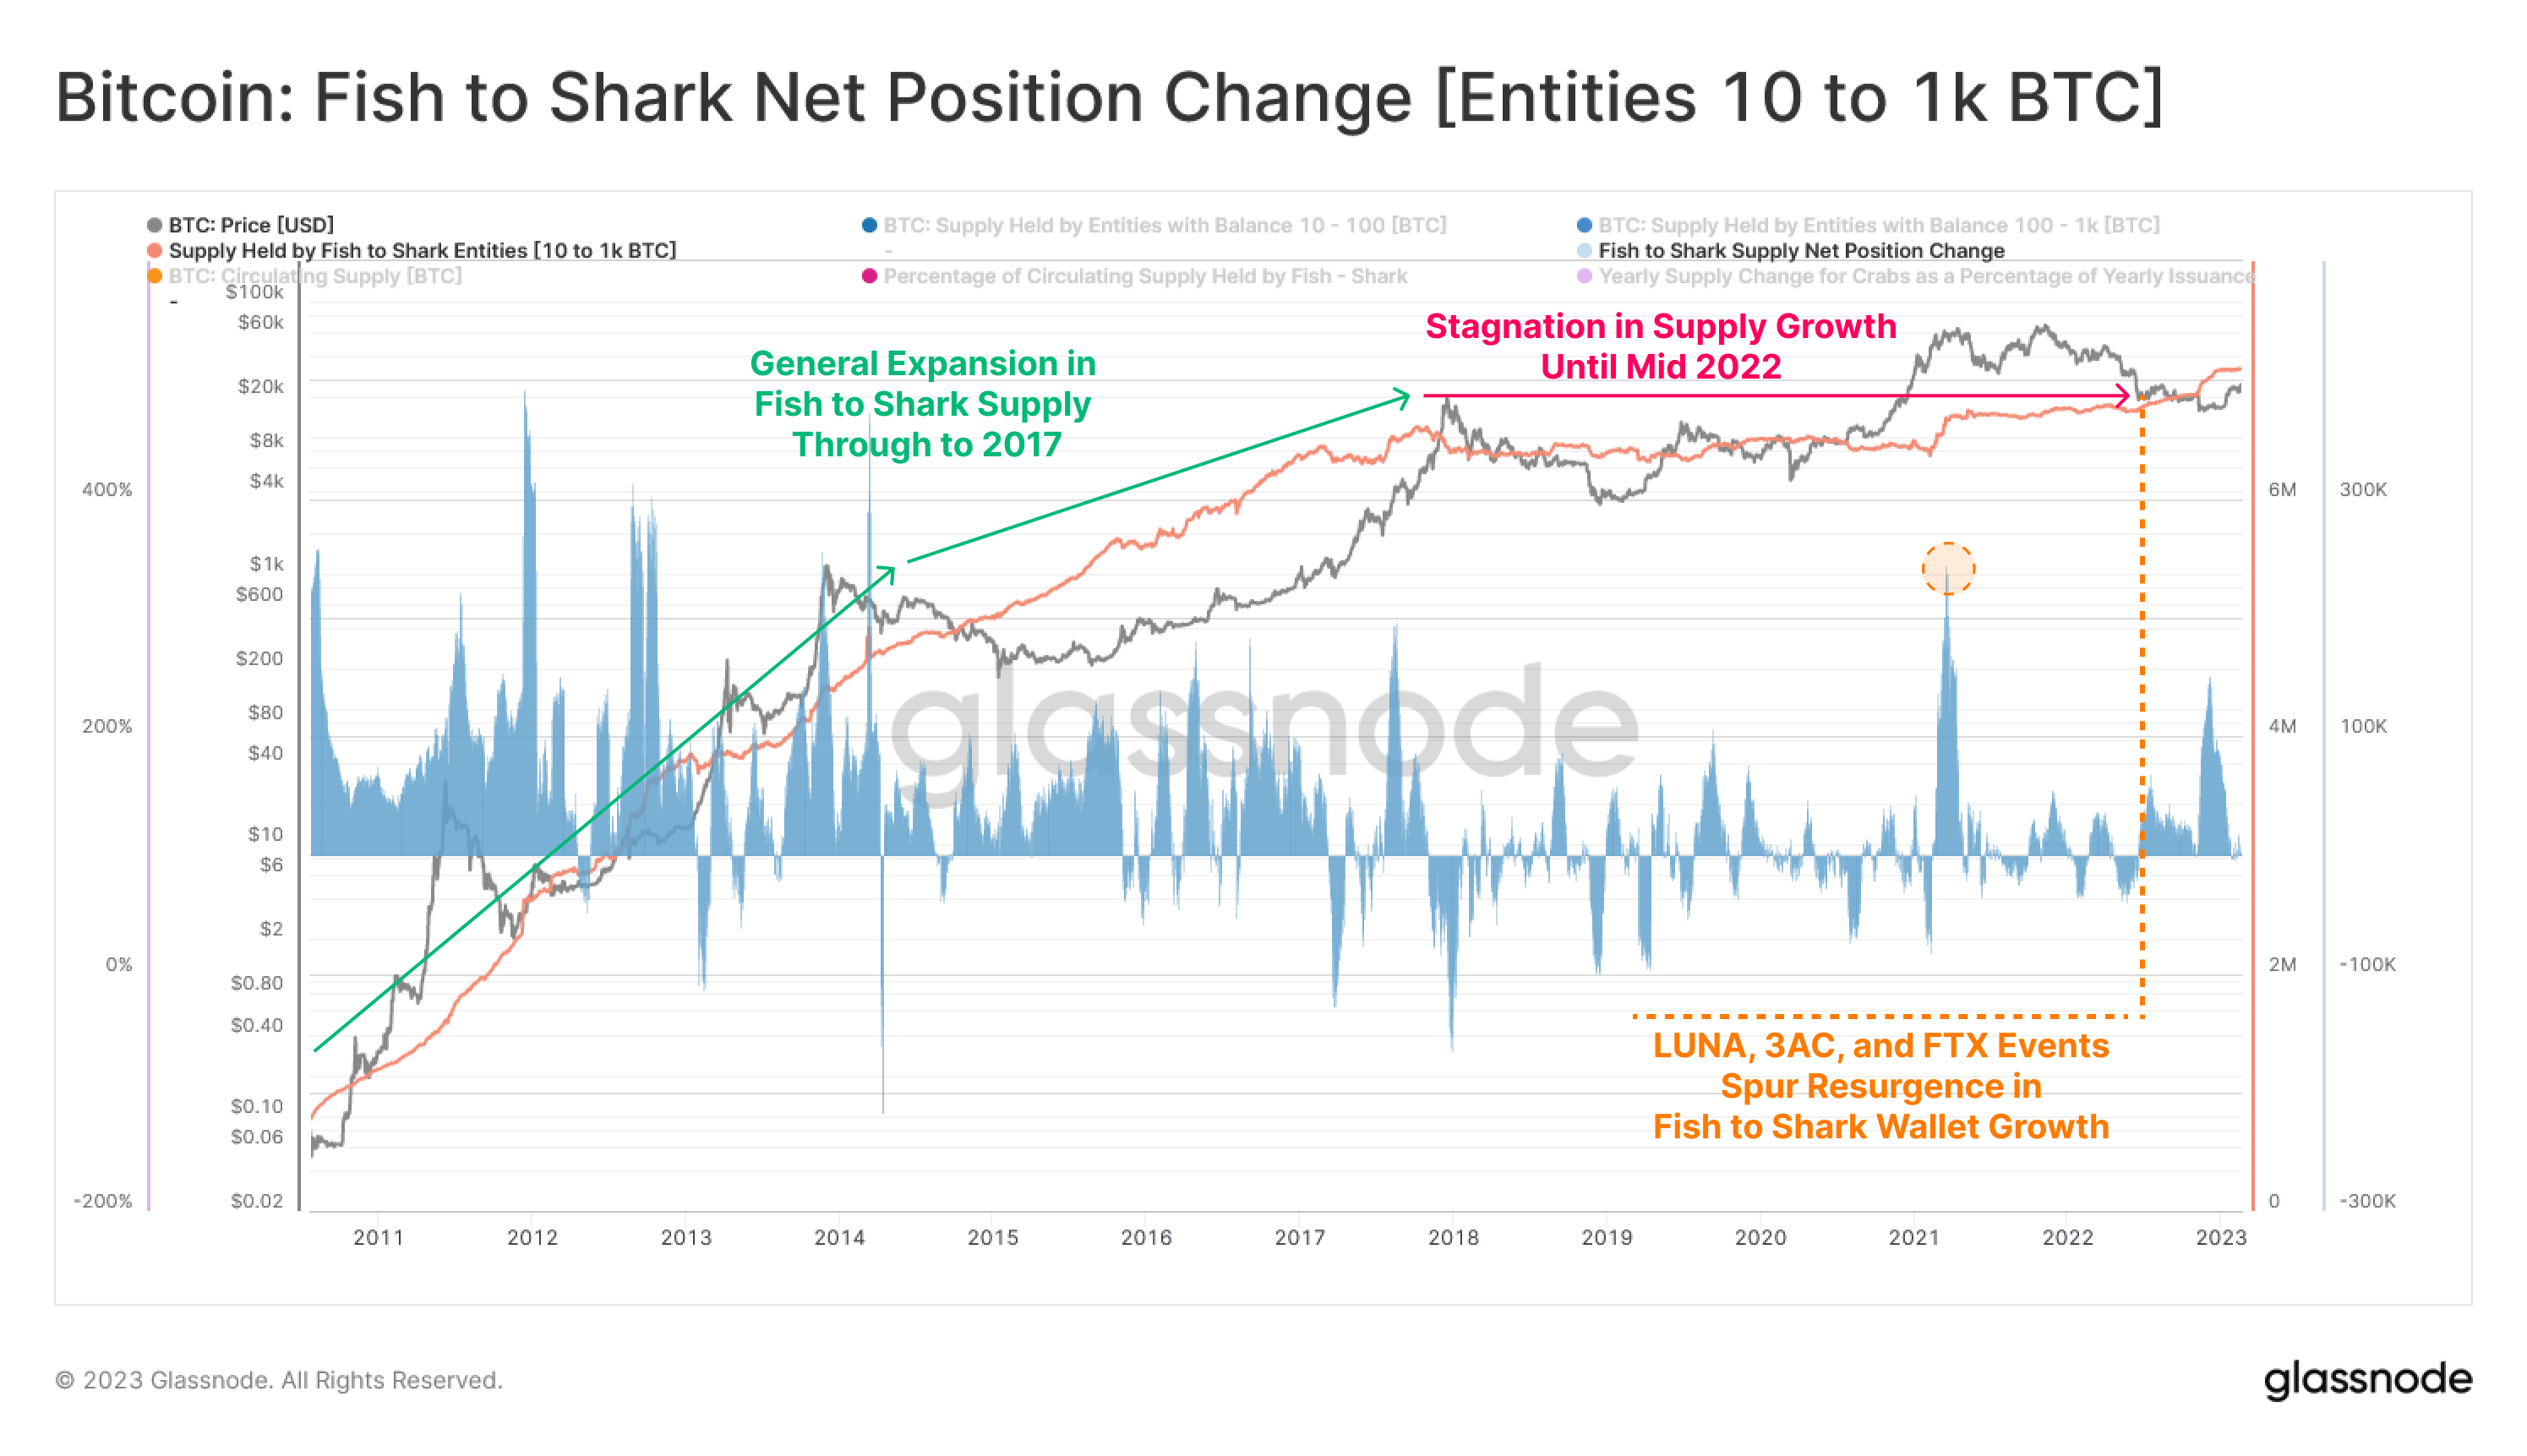
This aggregate cohort saw general balance growth from genesis until late 2017, at which point growth stagnated following the Dec-2017 parabolic top. After this, wallet behaviors appear to take on more market responsive, shorter-term trading pattern. The cohort balance has remained flat over the long term, but tends to oscillate in response to market price signals.
Notably, during and after the industry wide deleveraging event that took place in mid-2022 onwards, this cohort has seen a relatively organic resurgence of supply growth. This perhaps suggest a change in investor behavior by entities within this wealth class, responding both to heavily depressed prices, but also to renewed awareness of counterparty risk with custodians.
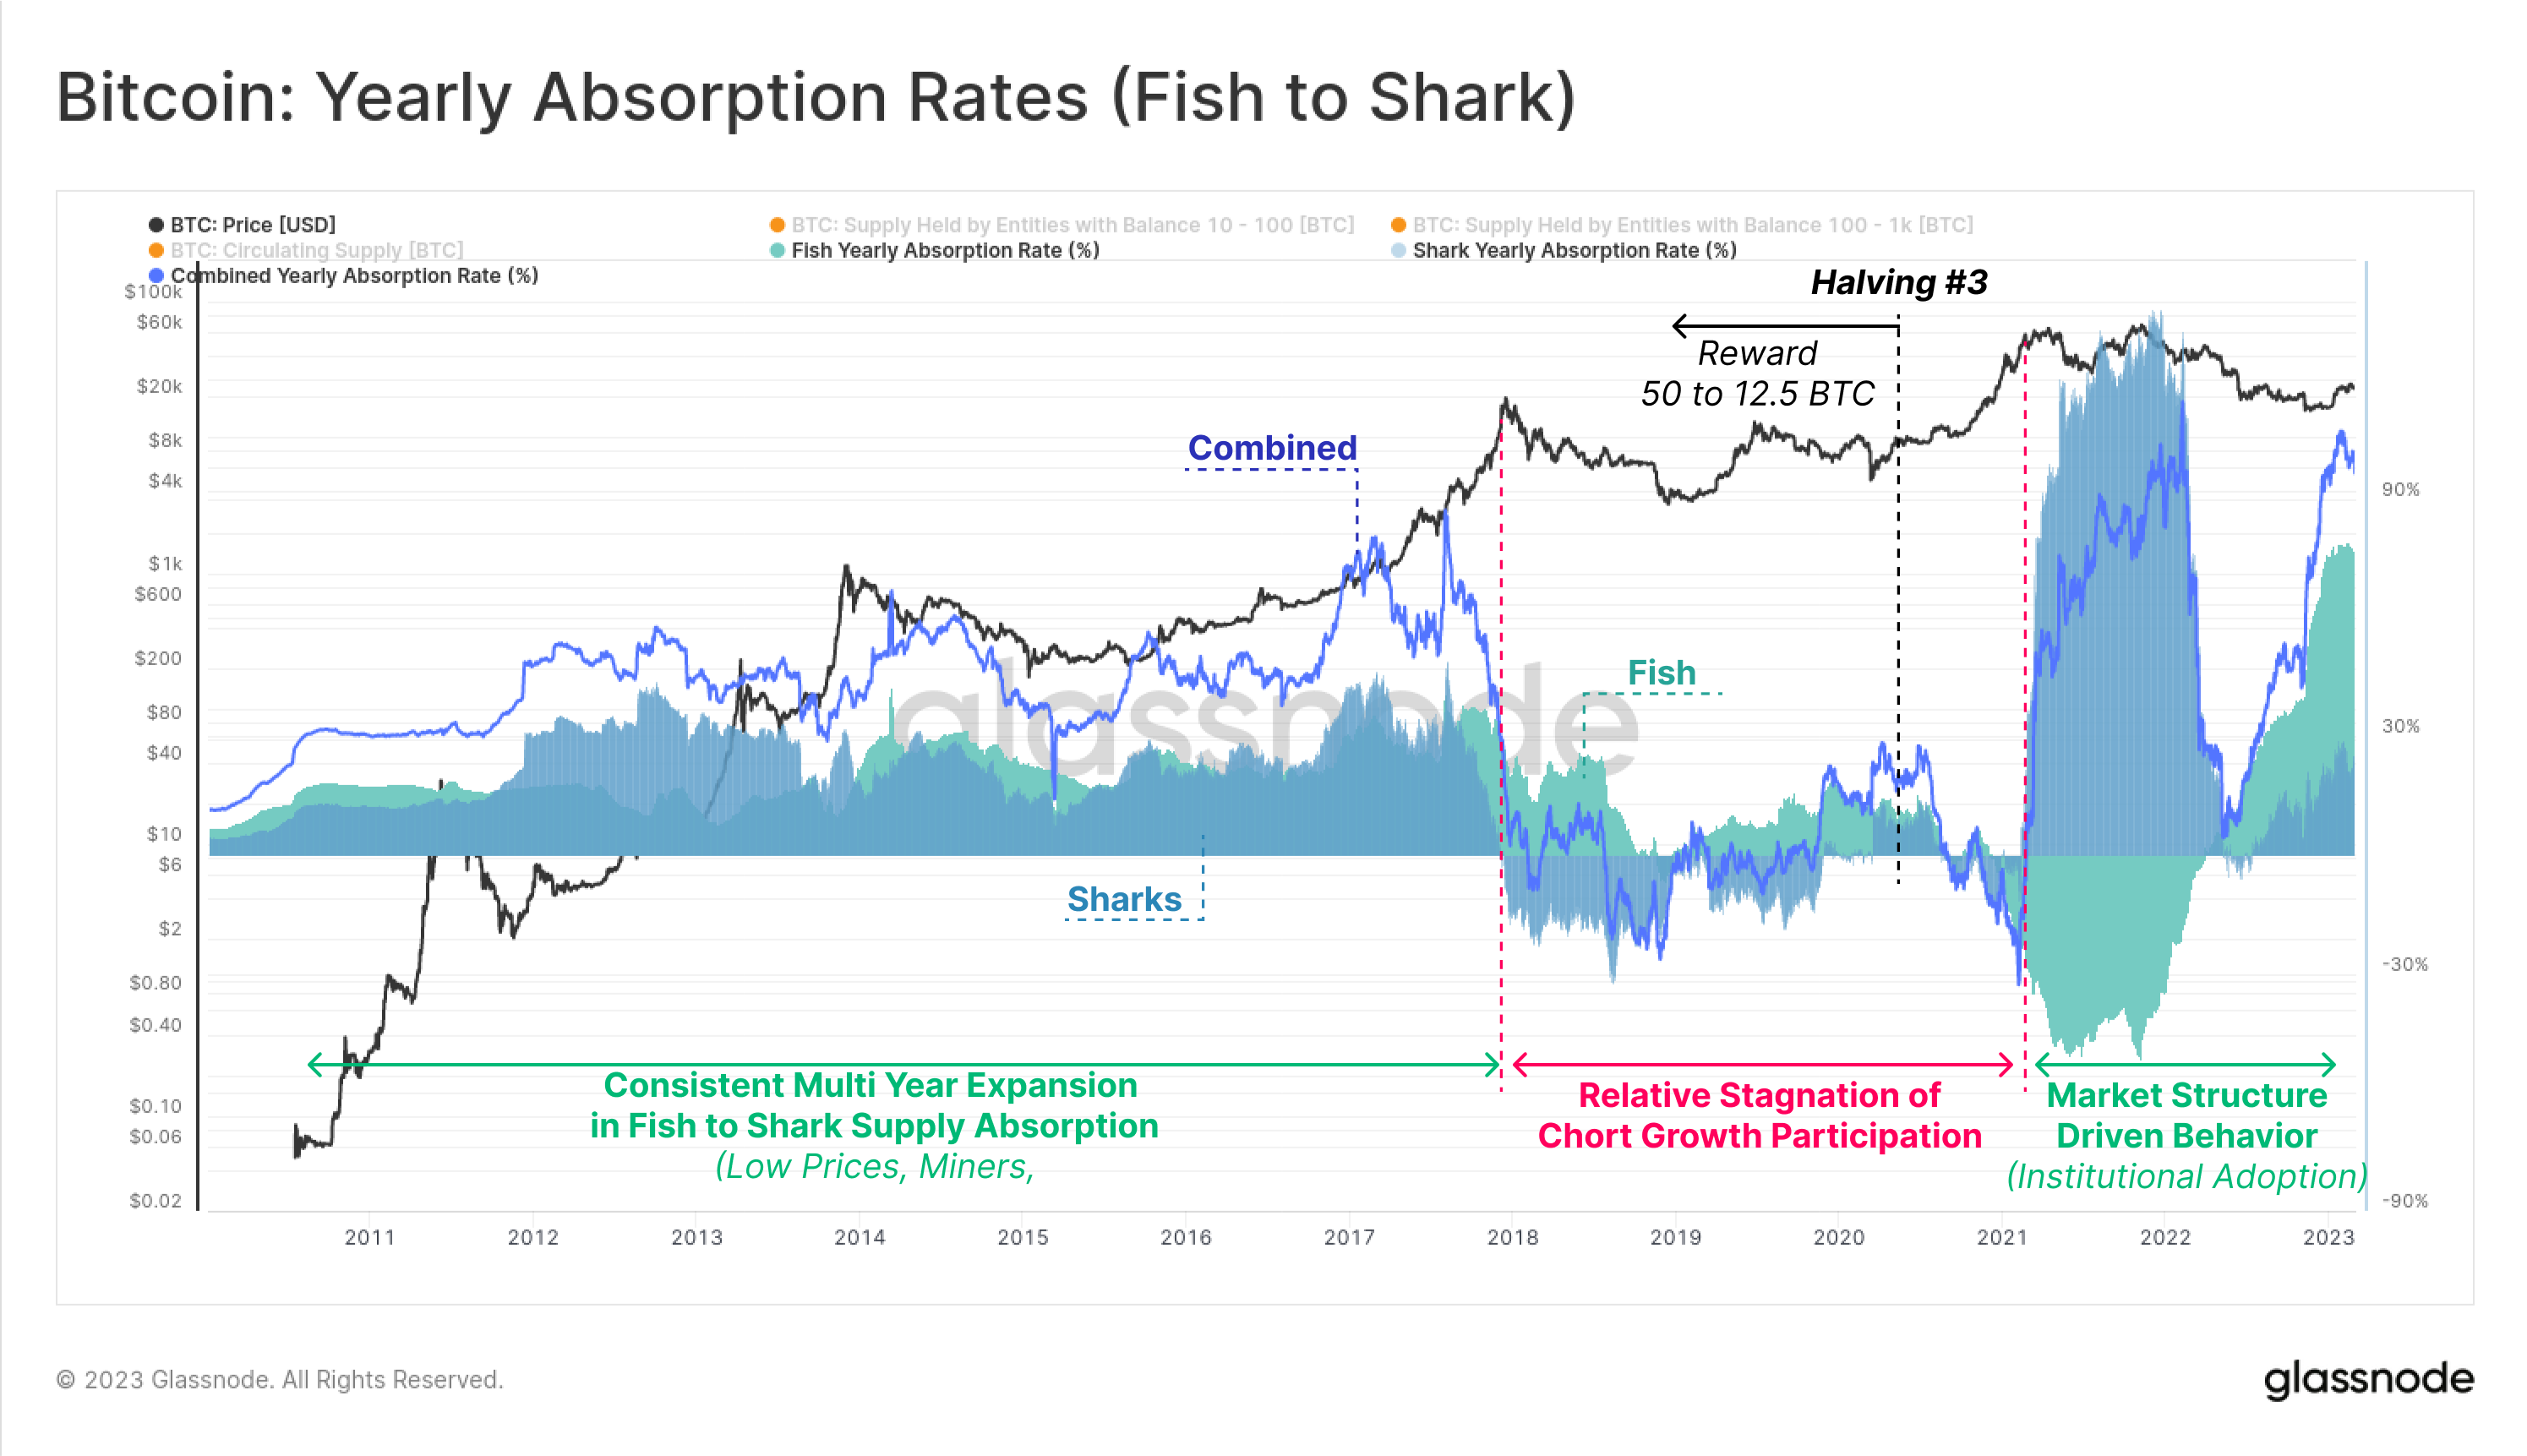
Through the lens of Yearly Absorption Rates, the Fish to Shark Cohort display three principal behavior phases:
- Genesis to Dec-2017: saw this cohort as a primary participant in net supply absorption, due in part to all block rewards being within this cohort range (50 to 25 BTC), but also due to relatively low prices, making such a position size relatively cheap to acquire in USD terms.
- Dec-2017 to Feb-2021: a change in the structure of the Yearly Issuance Absorption rate can be seen, transitioning from a regime of constant growth, to one of localized periods of expansion and contraction. Over this period, this cohort saw net balance change being in net equilibrium, and thus experiencing a relative loss of dominance of circulating supply held.
- Feb 2021 onwards: alongside a wave of institutional adoption, greater market liquidity, and general awareness, balance changes in cohort became increasingly volatile, and biased towards balance expansion. This cohort is currently experiencing a significant balance growth of +104% of issuance, with an approximate 75:25 split contribution from Fish and Sharks respectively.
🐳 Whales [1k+ BTC]
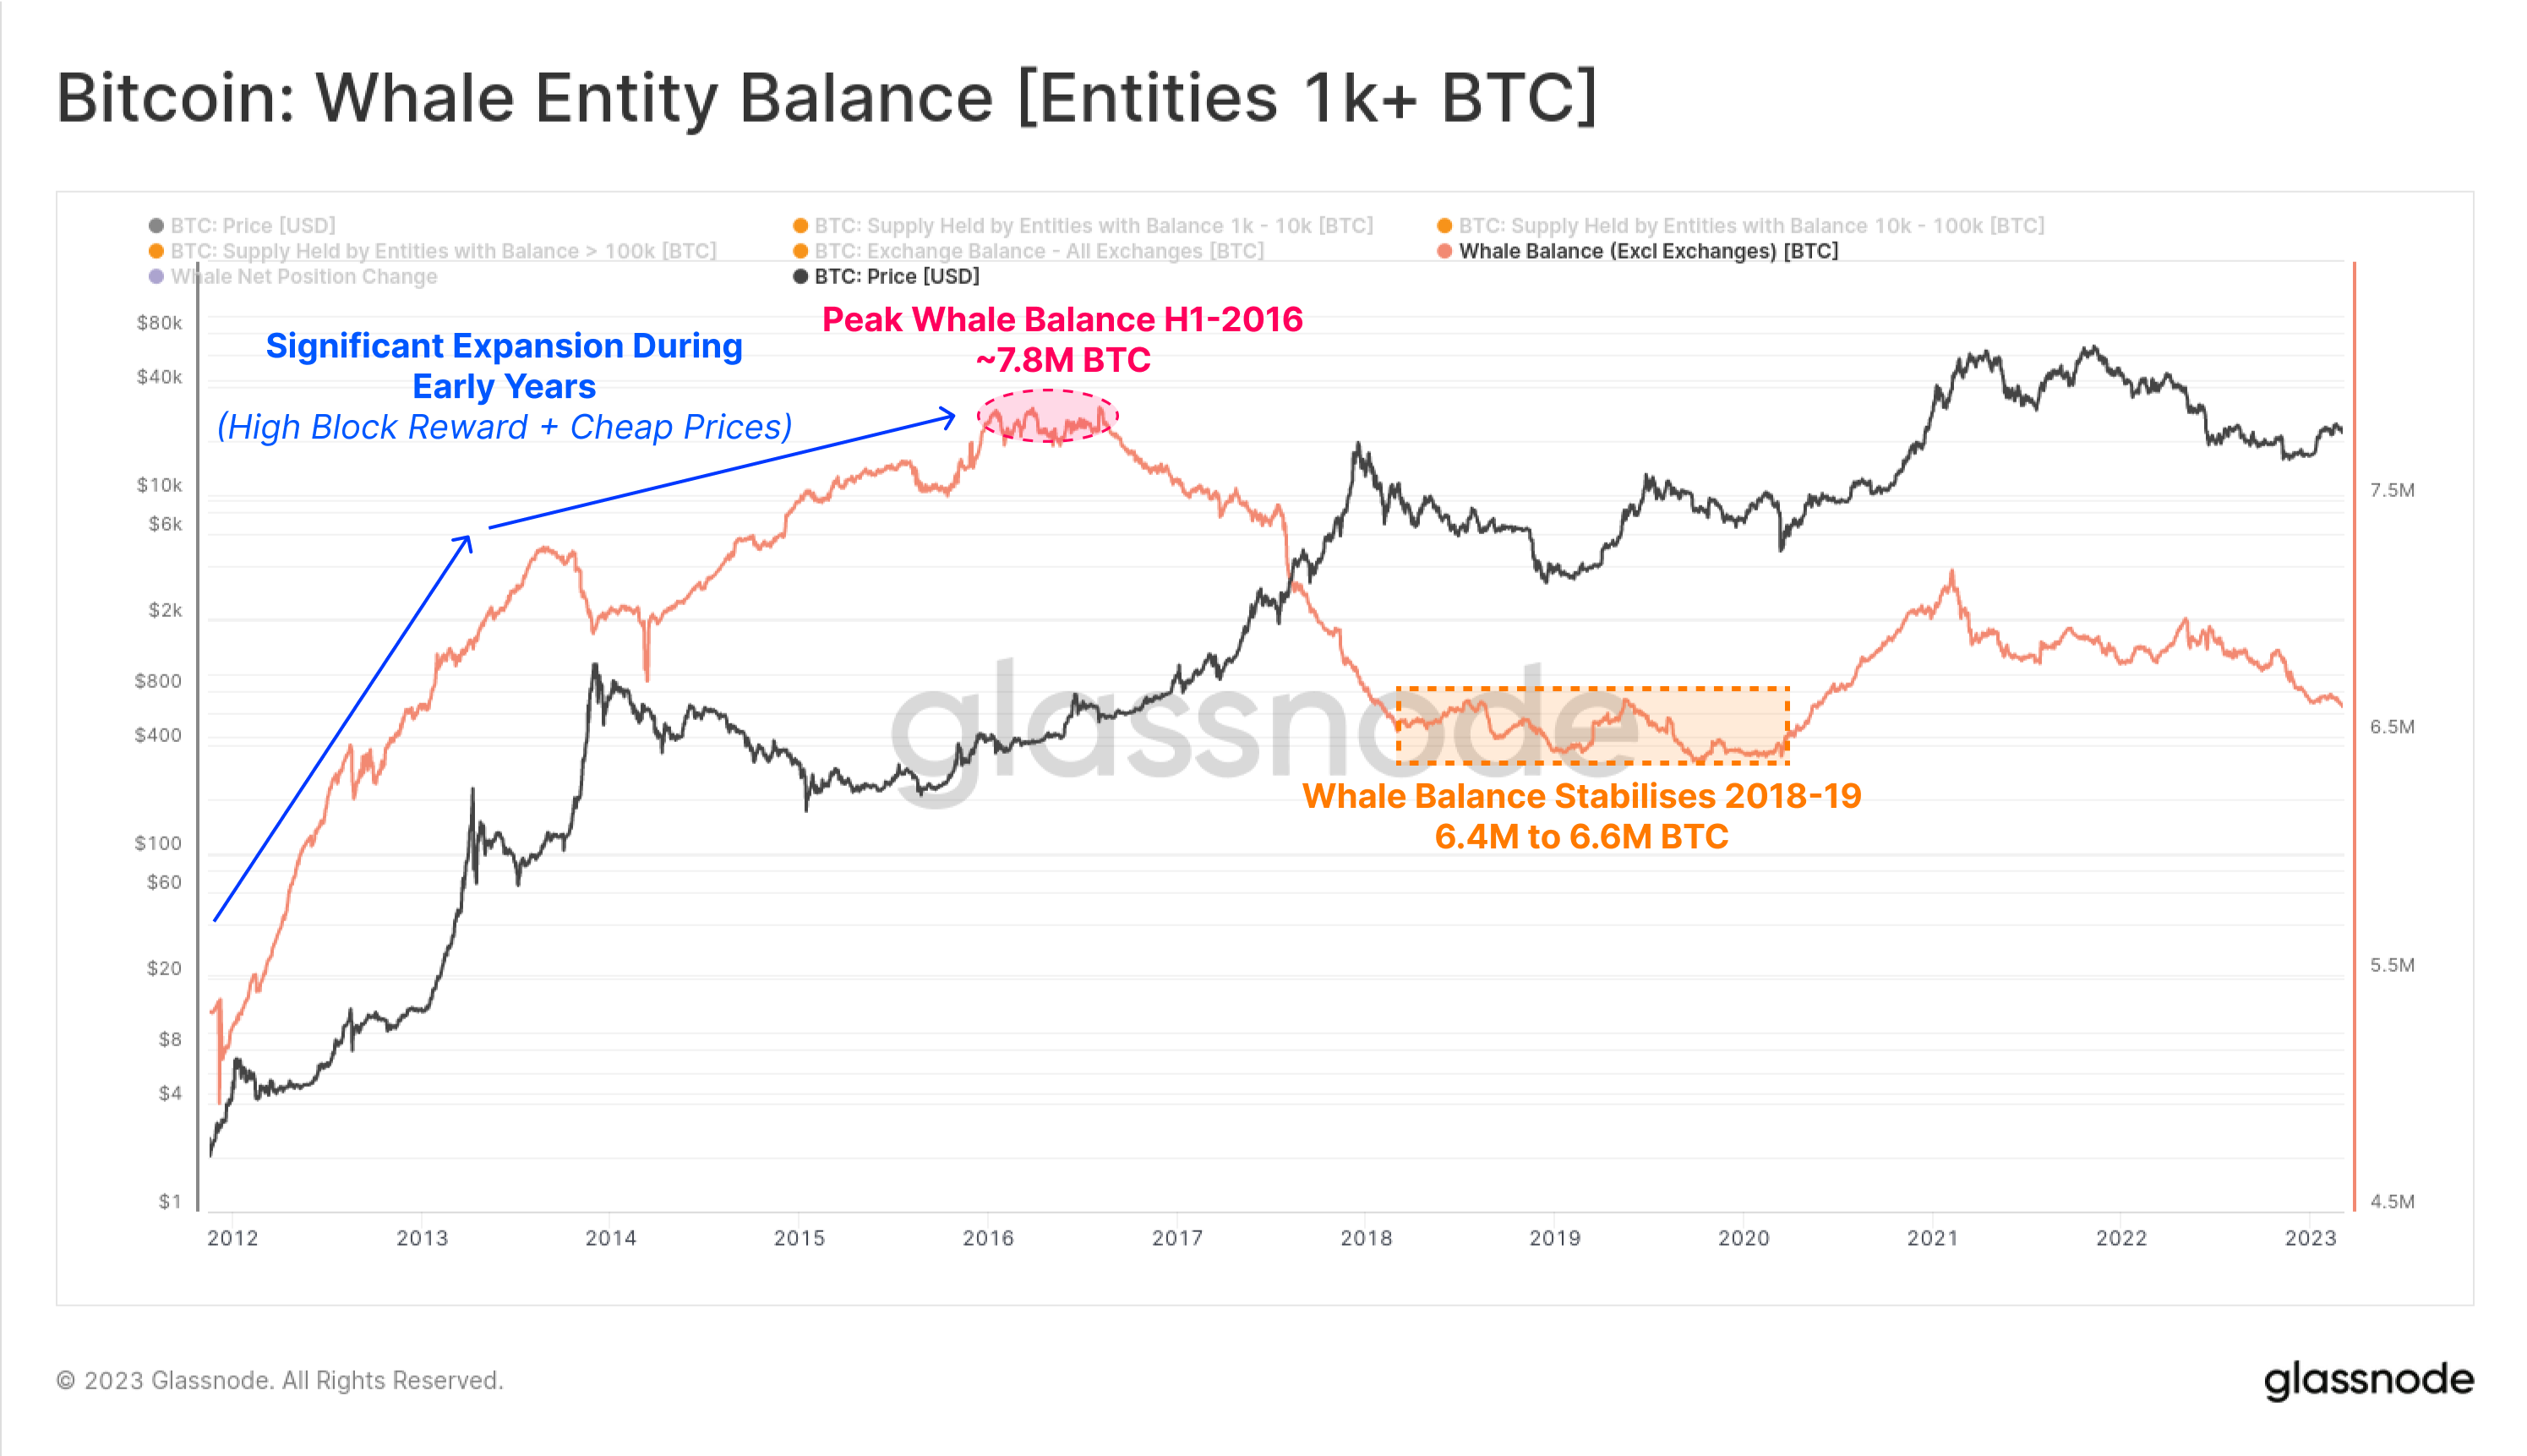
Finally, we examine the supply held by Entities with more than 1k+ BTC across their clustered addresses, whilst excluding coins held on exchanges. The Whale cohort saw the largest supply expansion take place up until the second halving event in mid 2016, at which point they held ~7.8M BTC (approx 50% of the supply). This was similarly possible due to the initial block reward issuing 25 to 50 BTC per block, alongside historically cheap prices, where 1k BTC was typically less than $1M in value.
Over time, the dominance of Whale entities in the total supply held has consistently declined, from 62.7% at the first halving in 2012, down to 34.4% today, a 45% dilution over seven years.
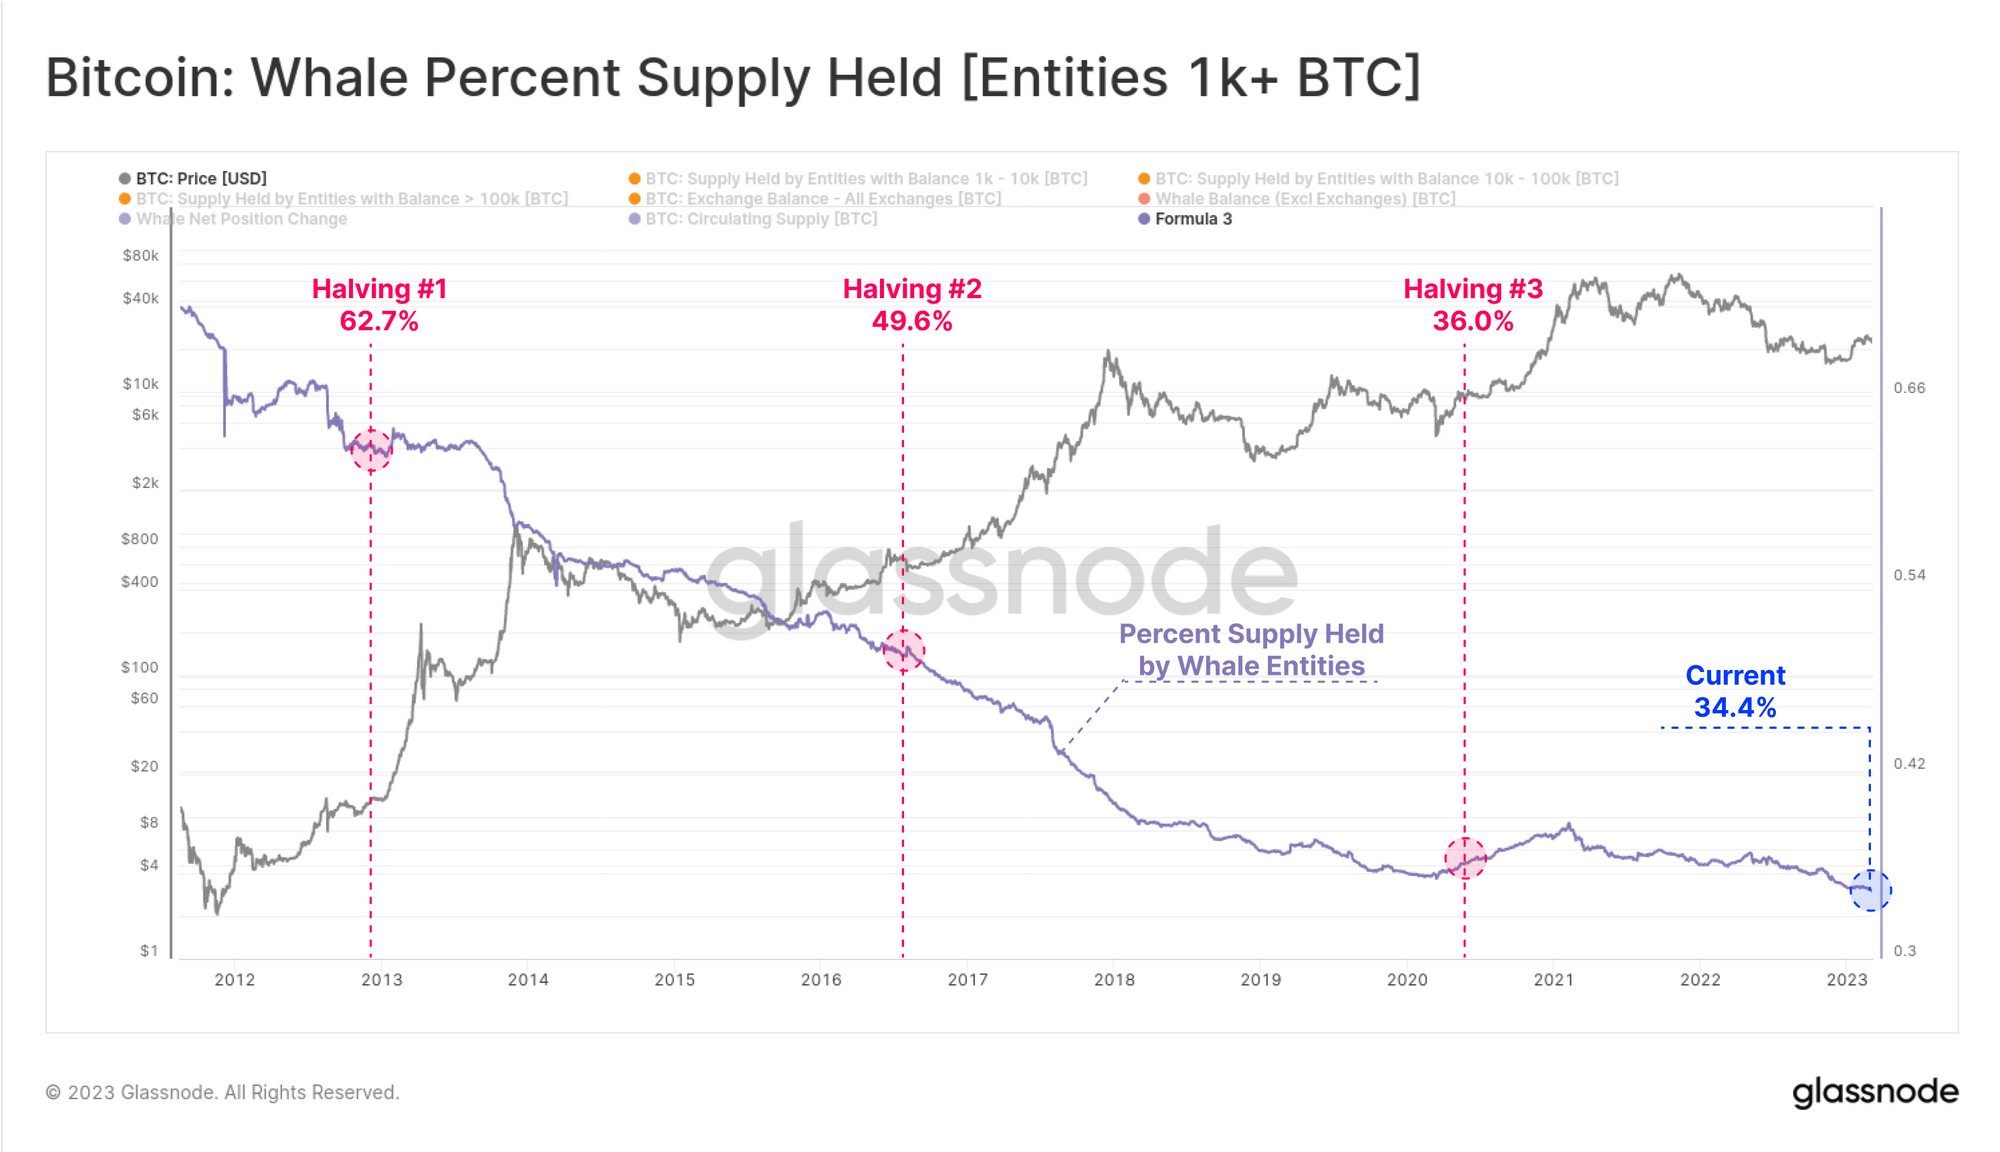
The 2017 bull market was a notable turning point for Whale behavior, as exchanges and mature markets developed, and Whale balances started to declined significantly. By the end of the 2018 bear market, Whale entities held between 6.4M and 6.6M BTC, a 16% decline since their peak holdings in H1-2016. Whale entities currently hold around 6.64M BTC,l equivalent to 34.4% of circulating supply.
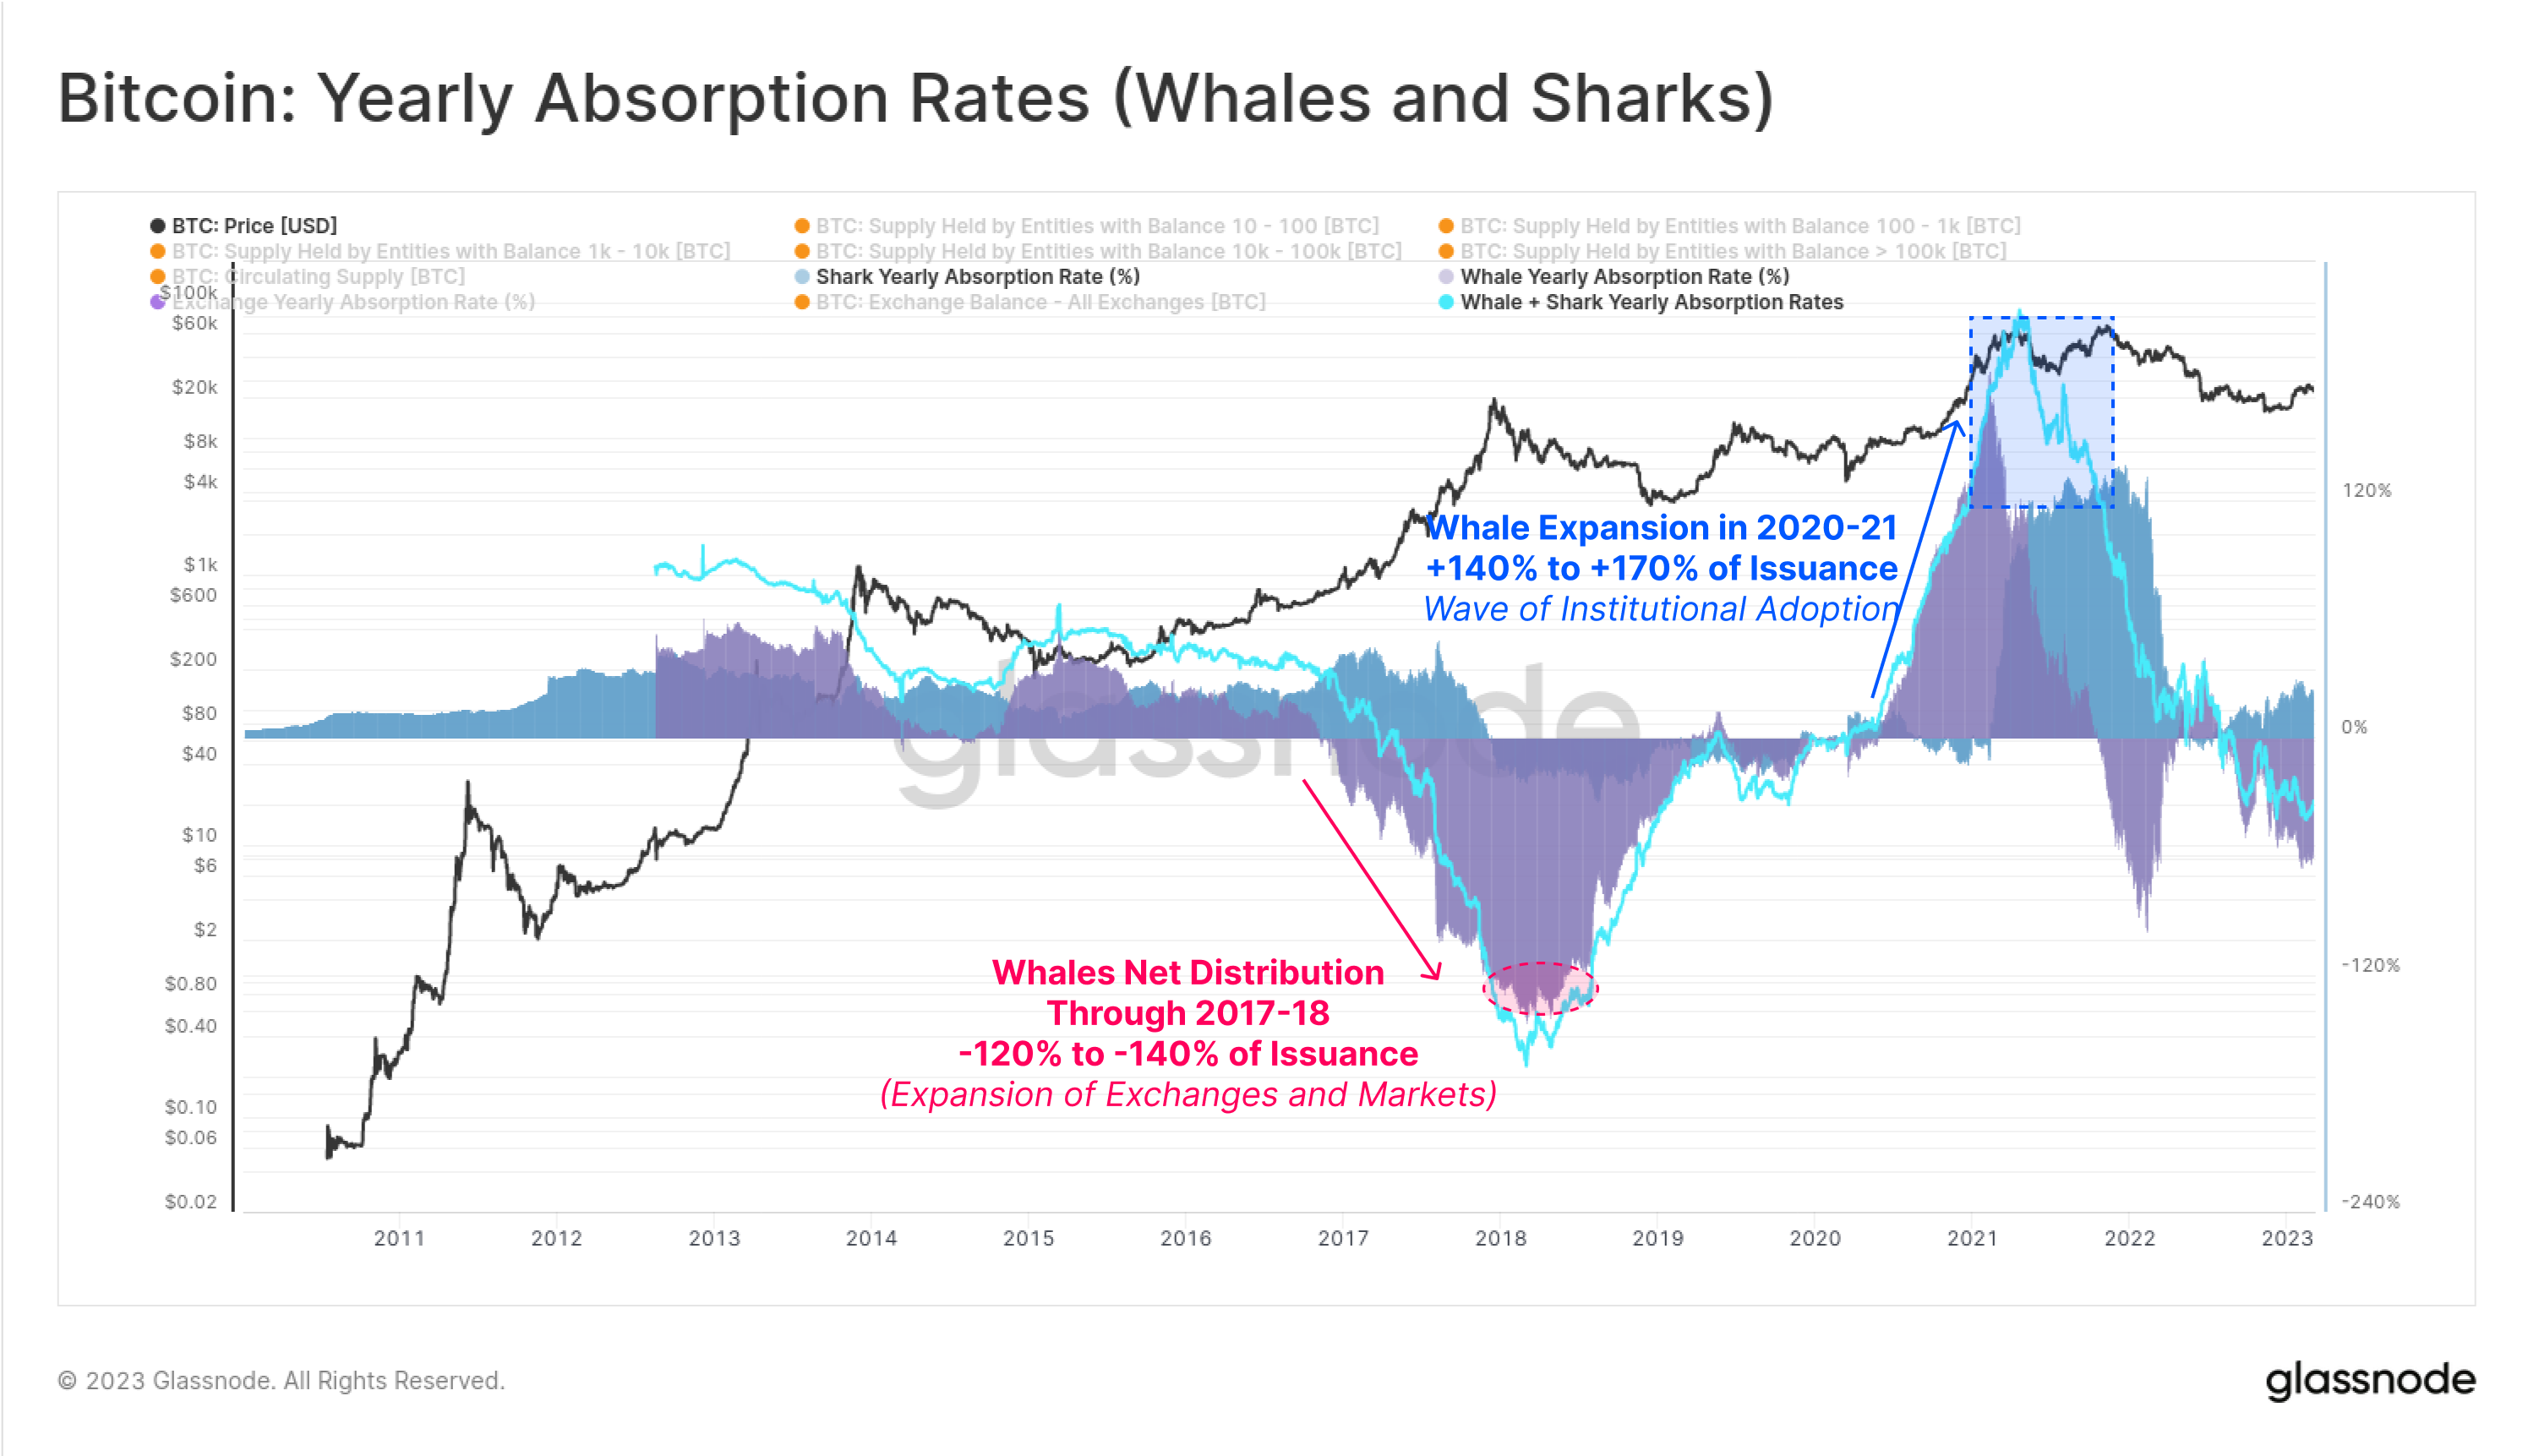
Through the lens of Yearly Absorption Rate, there are two primary periods that stand out for this cohort:
- The 2017 bull run which represented a net decline in Whale balances, likely in response to historically large inflows of new demand, high volatility as well as increasingly developed markets which were liquid enough to distribute into.
- The 2020-21 bull run which saw the first real wave of institutional and corporate capital enter the space, alongside an expansion of ETP products such as GBTC and other ETFs. This period reflected the first major expansion of balance held by Whale entities since 2016.
🏦 Exchanges
Within an on-chain analysis framework of supply and balances, Bitcoin exchanges can be reasonably considered to be the ‘middle-man’ through which a majority of coins that change hands pass. The expansion of one or another wallet cohort is usually balanced by either an opposing change in another wallet cohort, or via changes across the aggregate exchange reserves.
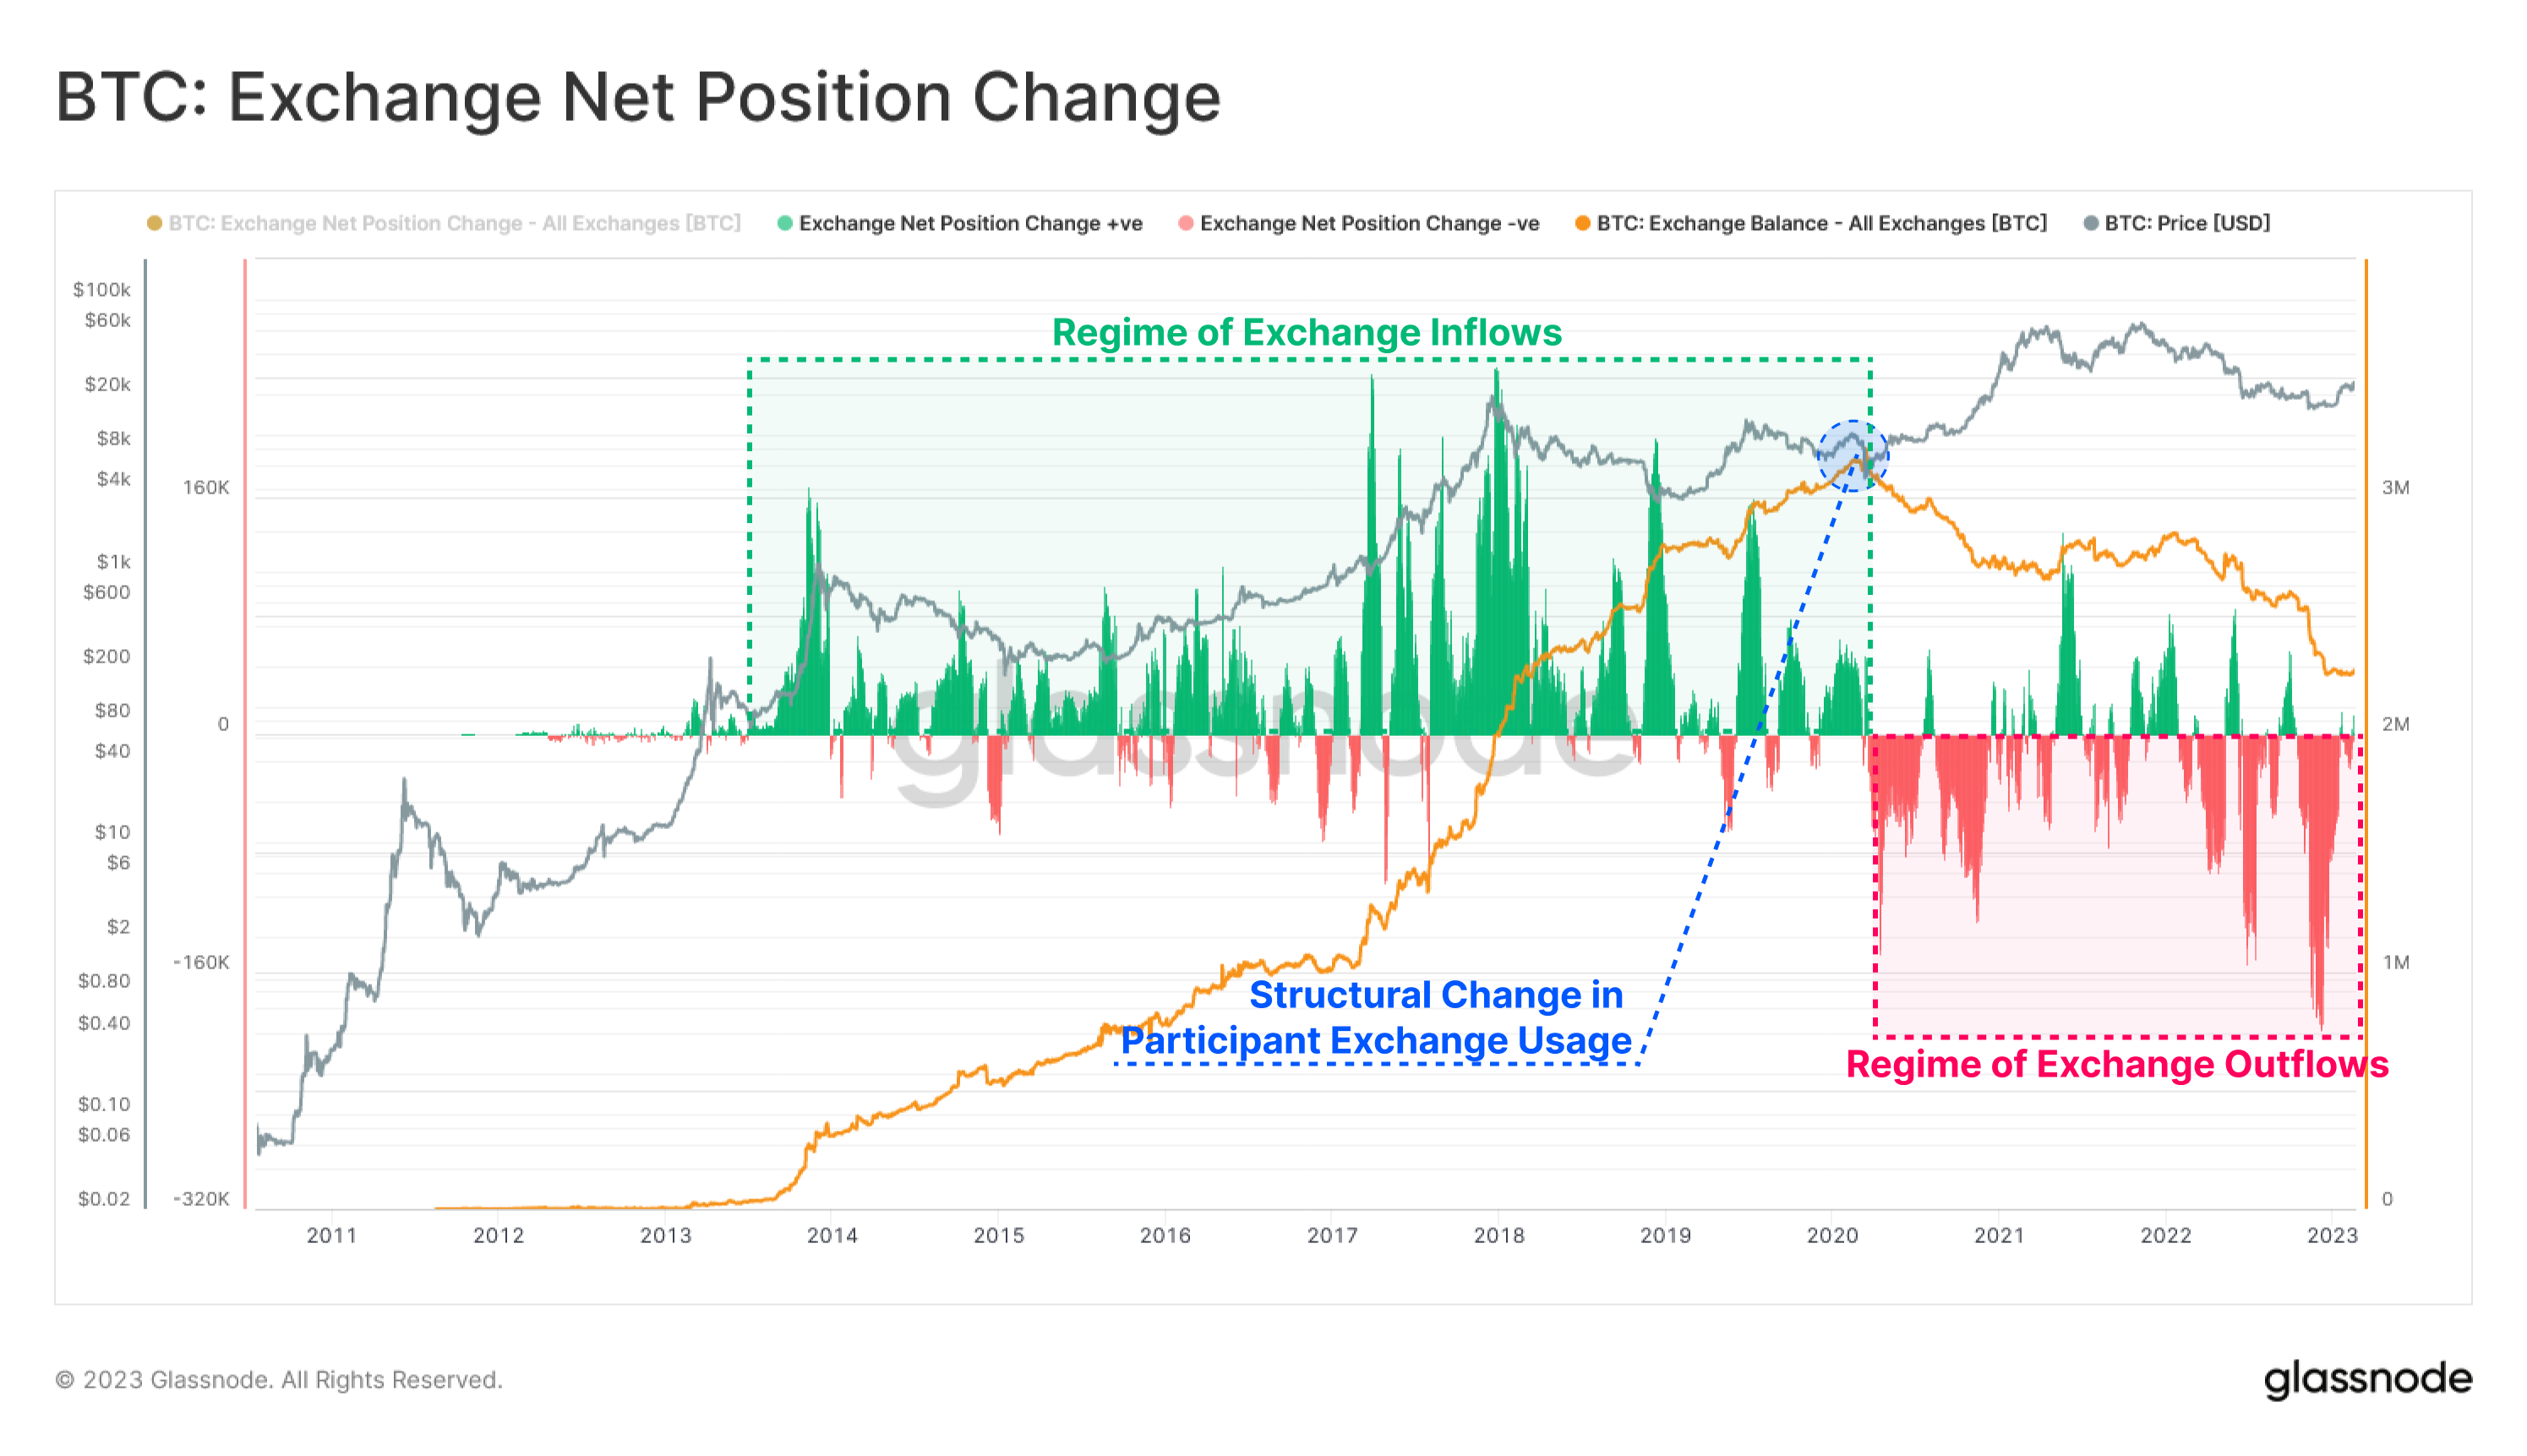
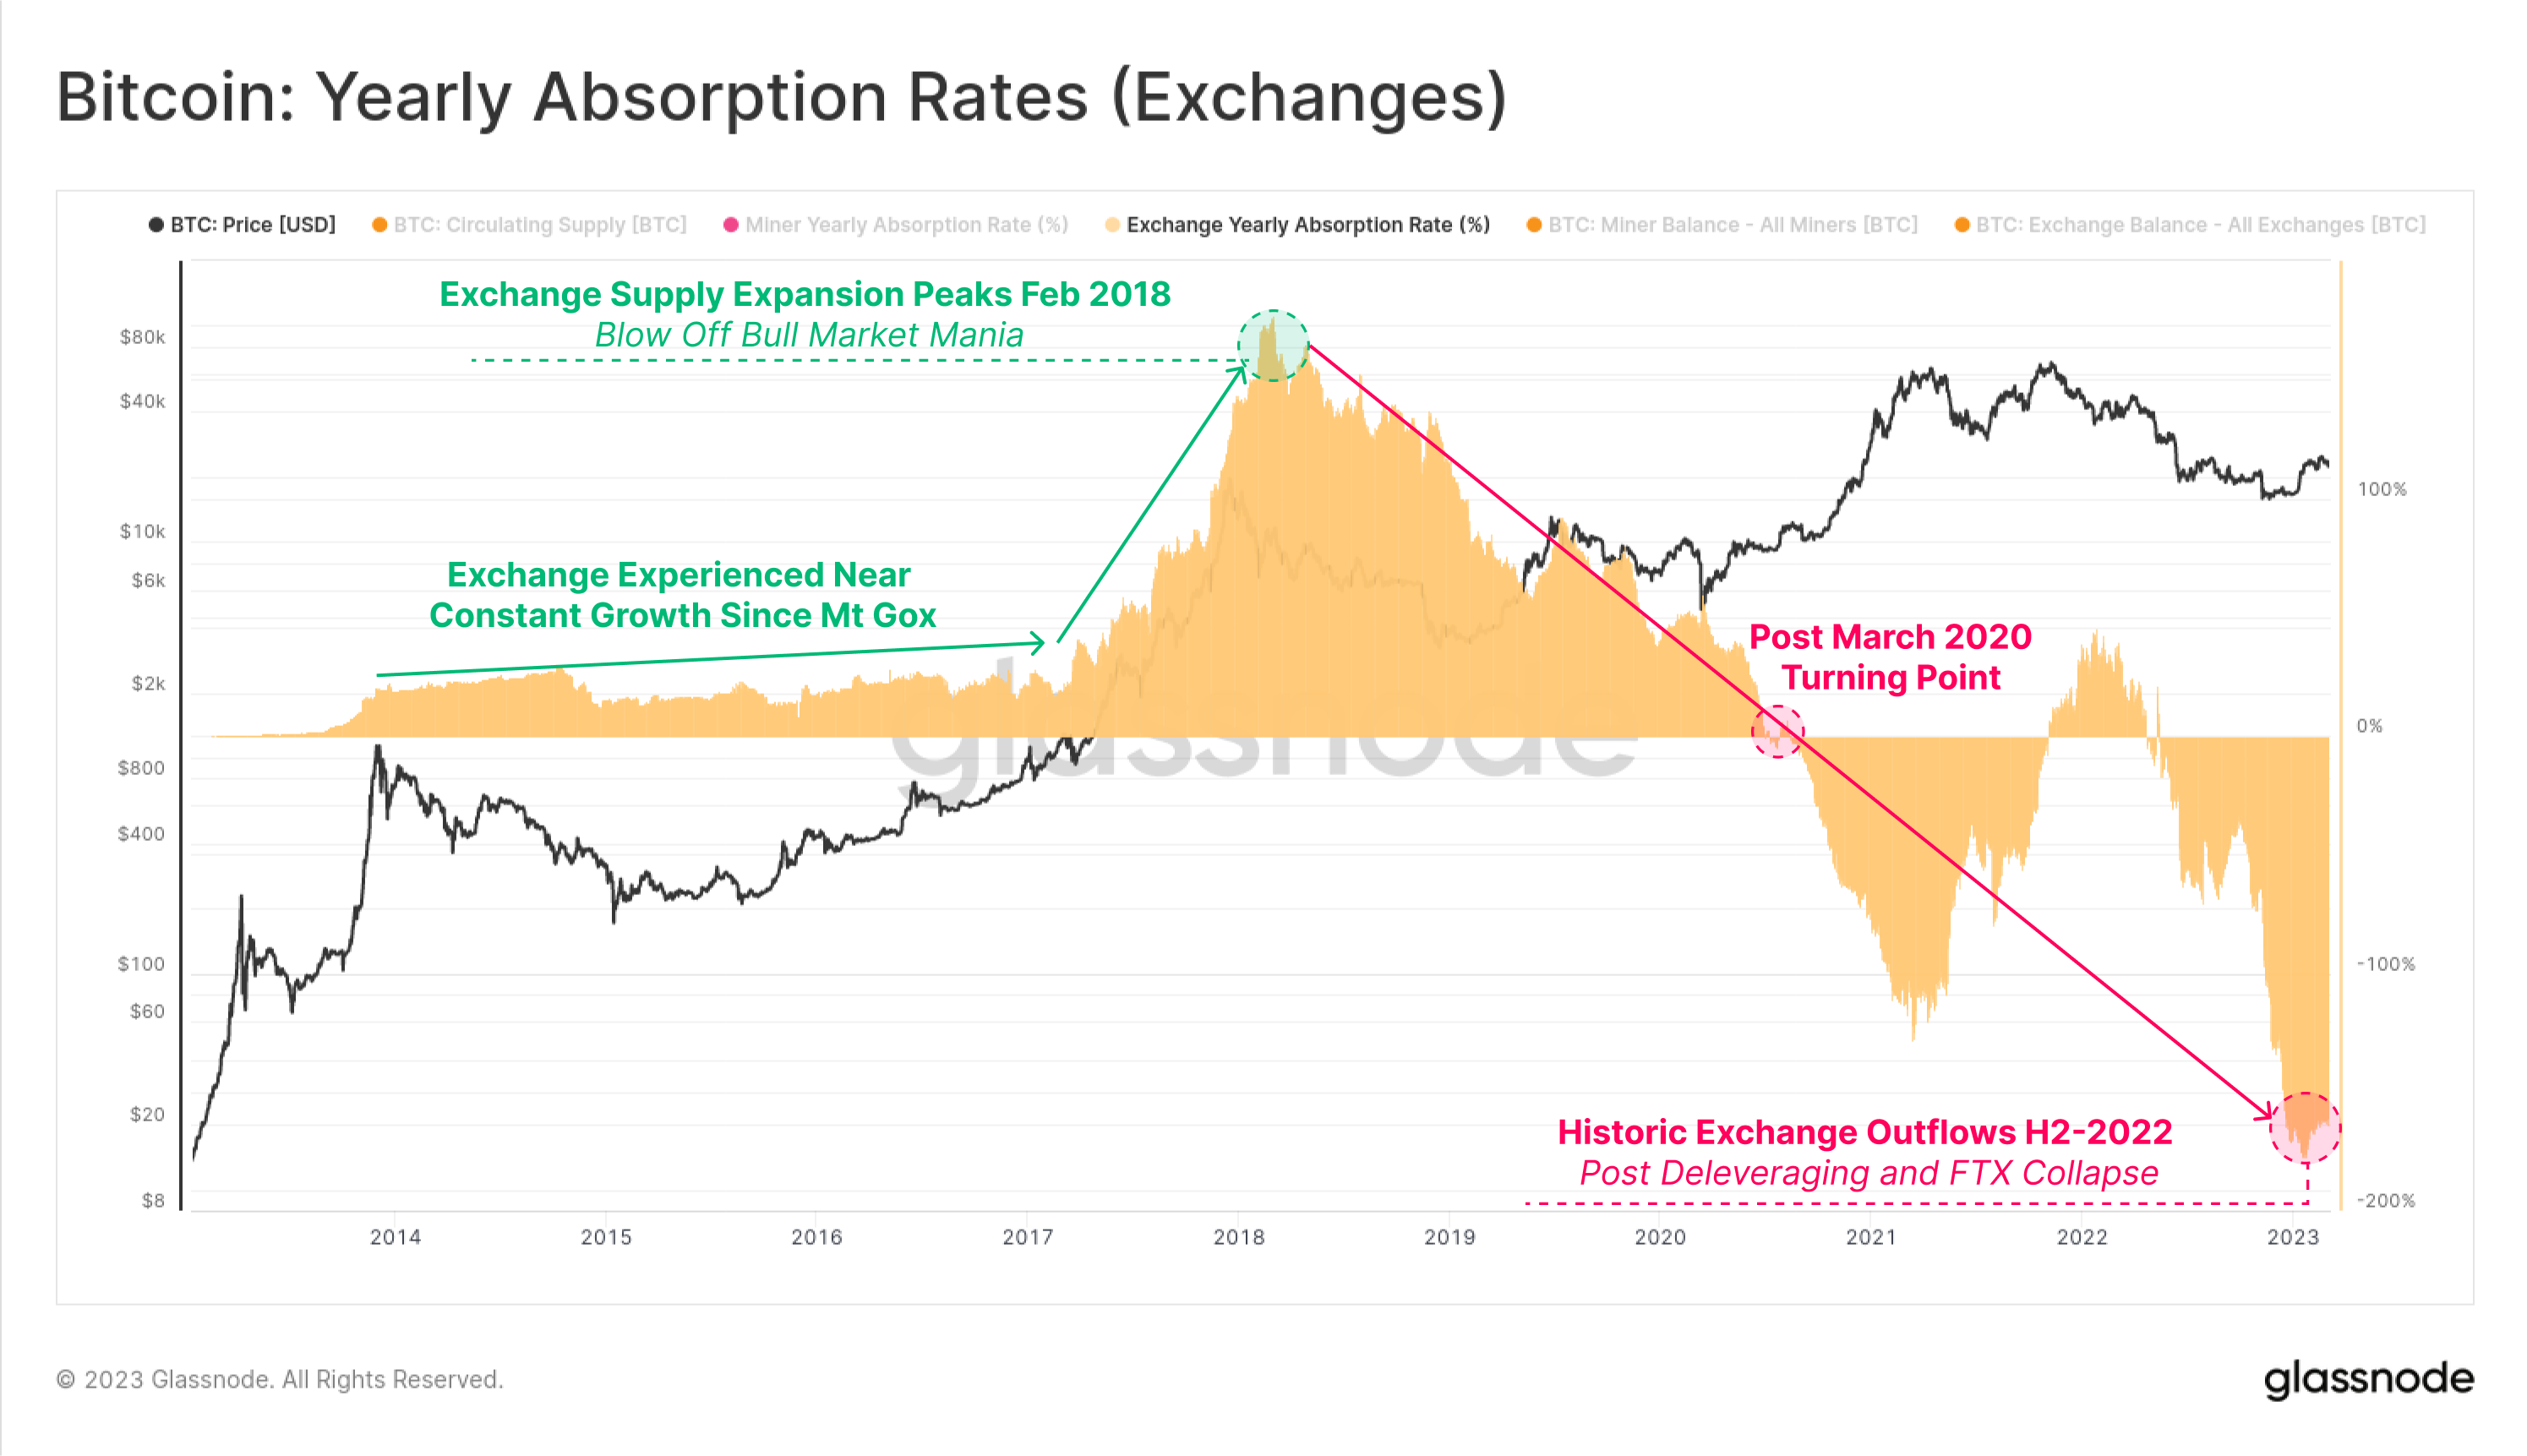
When analyzing the history of Exchange Balances, the March 2020 sell-off event remains a pivotal inflection point, as investor behavior and market structure changed dramatically.
- Since the collapse of Mt Gox in 2013, the dominant trend was for coins to continually flow towards exchanges, a trend that persisted until March 2020.
- Post March 2020, a structural change occurred, and coins started to flow out of exchanges at increasing rates. These outflows are directed towards both self-custody investor wallets, but also into institutional and collaborative custody services, and exchange traded products such as GBTC (which trade outside on-chain spot markets).
- This effect was supercharged after the collapse of FTX, as the market was once again, brutally reminded of the nature of counterparty risk. The Nov-Dec 2022 period remains the largest monthly outflow of -200k BTC/month.
From a Yearly Absorption Rate perspective, these phase shifts are apparent. The 2017 bull run can be seen to be the historical peak of relative exchange balance growth, growing by an equivalent of 177% of issued coins over that year. This growth trend reversed after the Feb 2018 mania peaked, and turned negative shortly after the 2020 COVID sell-off. It can be seen that Exchange balances are through many periods of history tend to trend in opposite directions to key investor cohorts detailed above.
Overall Distribution by Number of Entities
In the sections above, we have explored the relative balance and balance change of various wallet cohorts. In this final section, we will explore the relative number of entities, and compare that to the aggregate balance held. The chart below shows the estimated number of entities (x-axis in log scale), whilst the right shows the relative proportion of supply held (x-axis in linear scale).
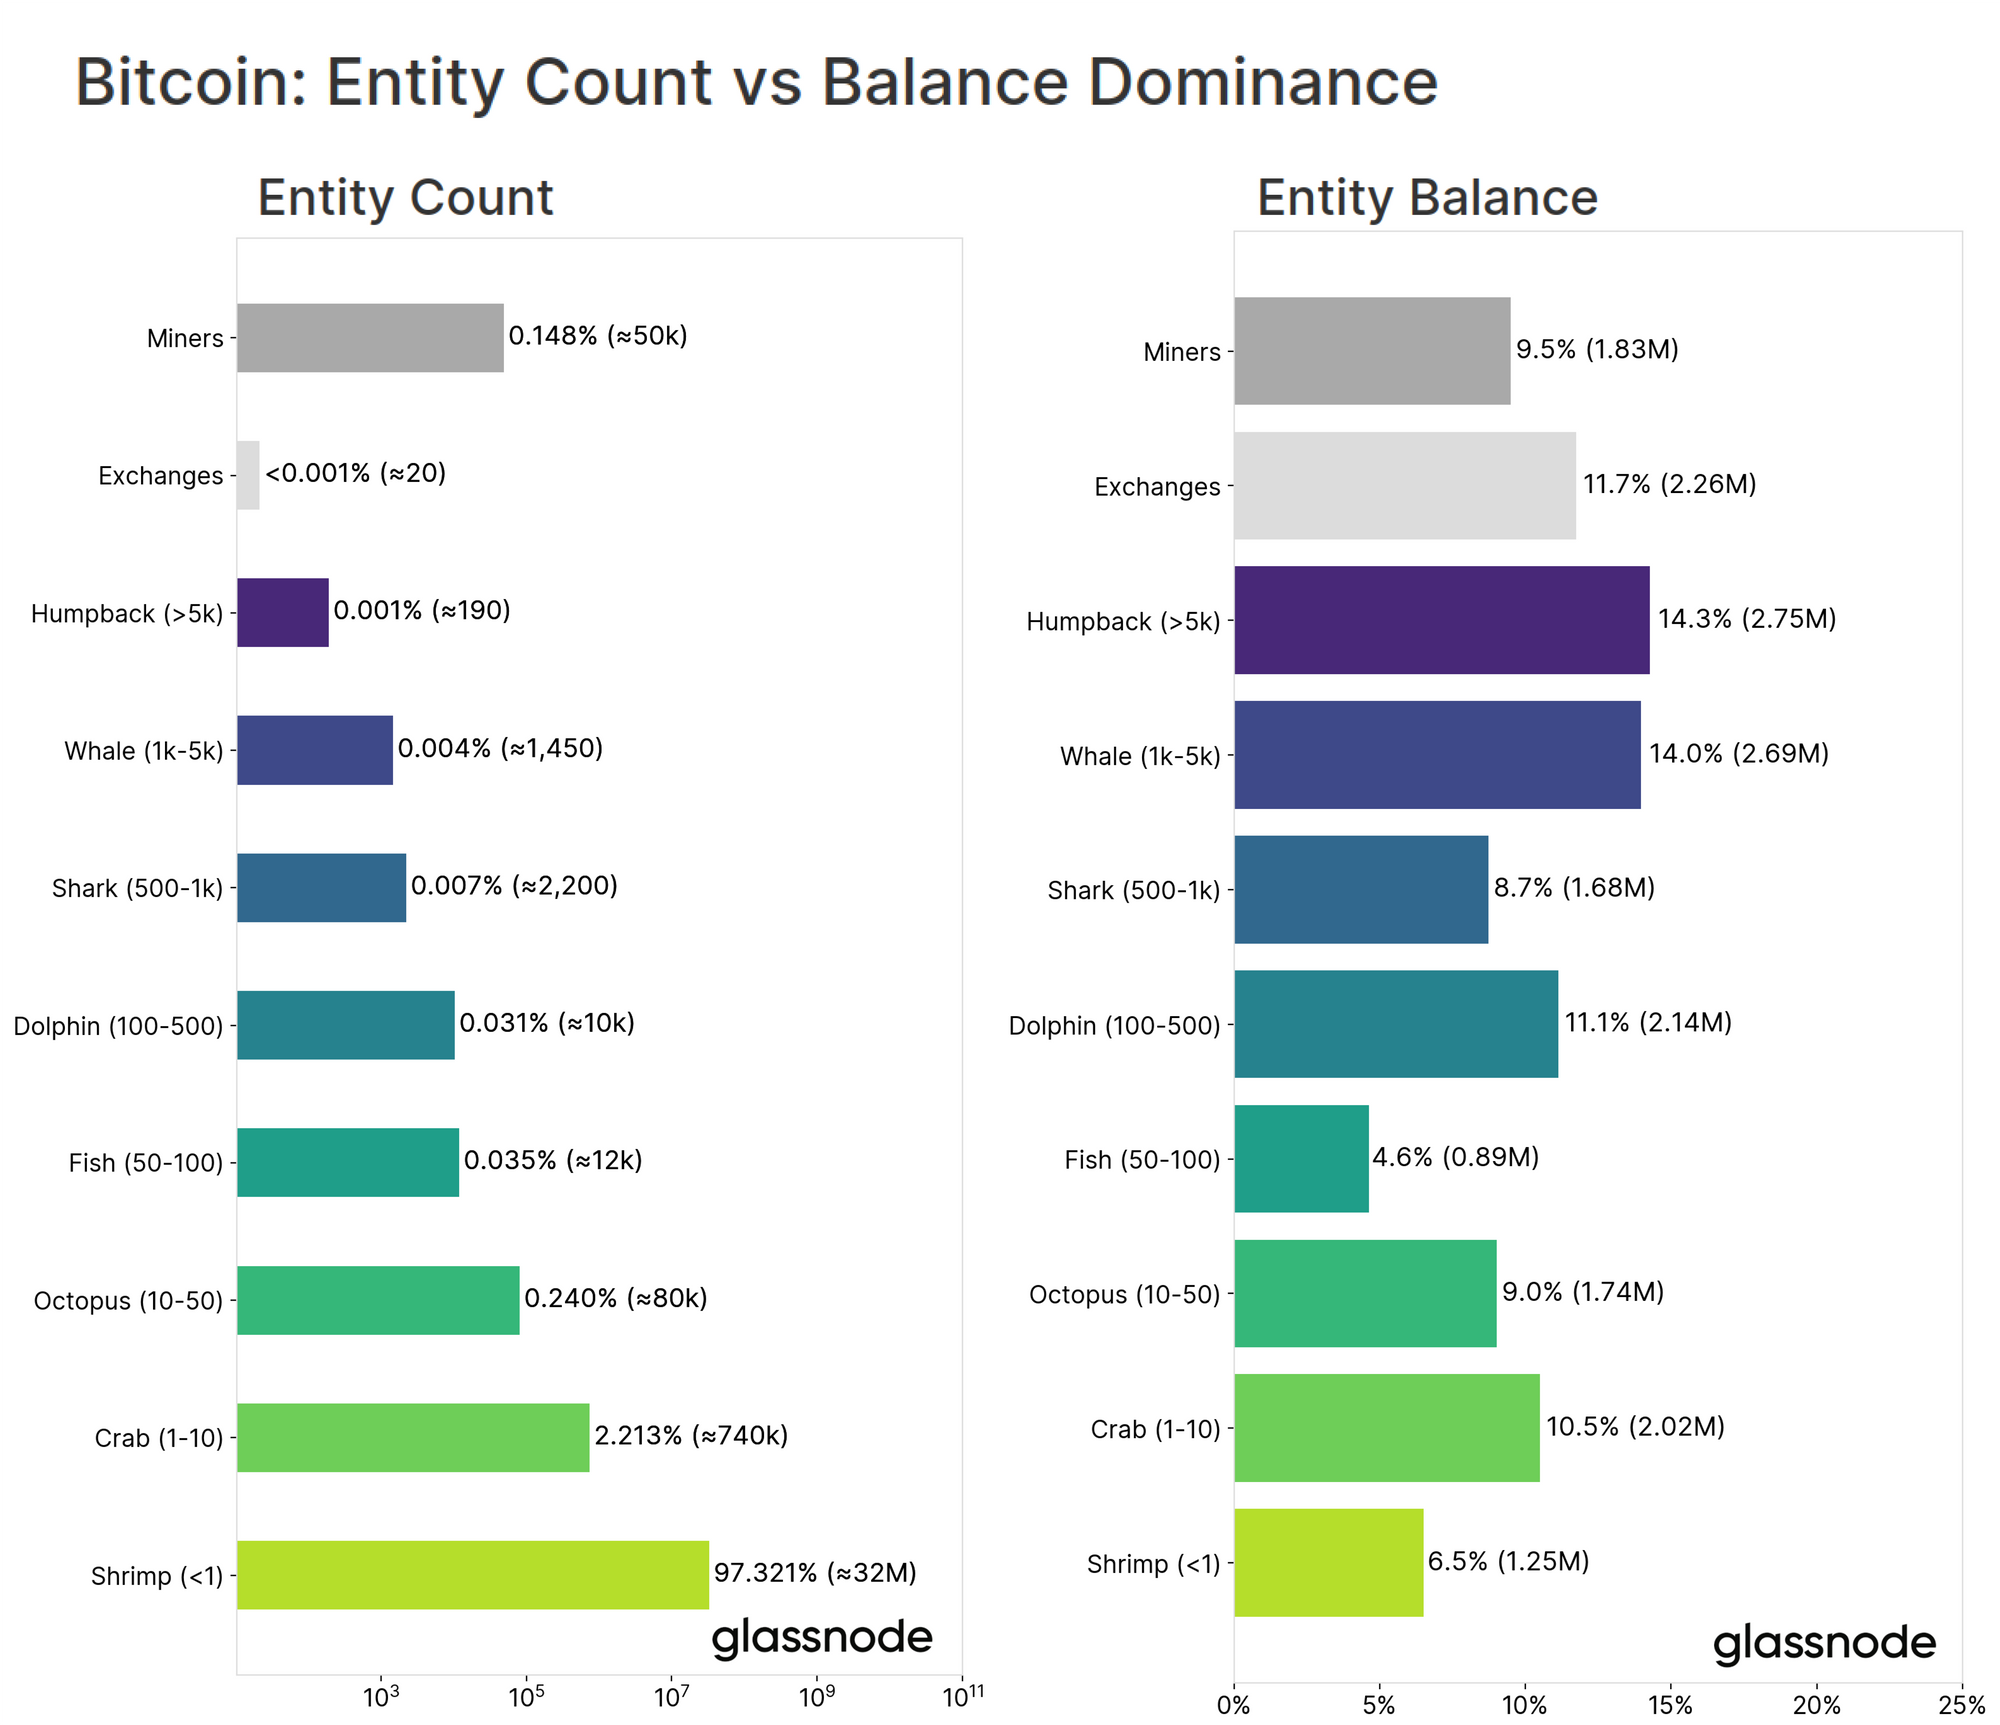
From this, we can see that entity counts follow a Pareto distribution, with over 32M Shrimp accounting for 6.5% of the circulating supply. This compares to around 1640 Whales holding approximately 28.3% of the supply. For each cohort, we can gauge an average balance per entity for a sense of scale (valued at a price of $22.4k):
- Shrimp = ~0.039 BTC ($873.6) with population of 32M
- Crab = ~2.73 BTC ($61.15k) with population of 740k
- Octopus = ~21.75 BTC ($487.2k) with population of 80k
- Fish = ~74.17 BTC ($1.66M) with population of 12k
- Dolphin = ~214 BTC ($4.79M) with population of 10k
- Shark = ~763.63 BTC ($17.1M) with population of 2.2k
- Whale = ~1855.17 BTC ($41.6M) with population of 1.45k
- Humpback = ~14,473 BTC ($324M) with population of 190
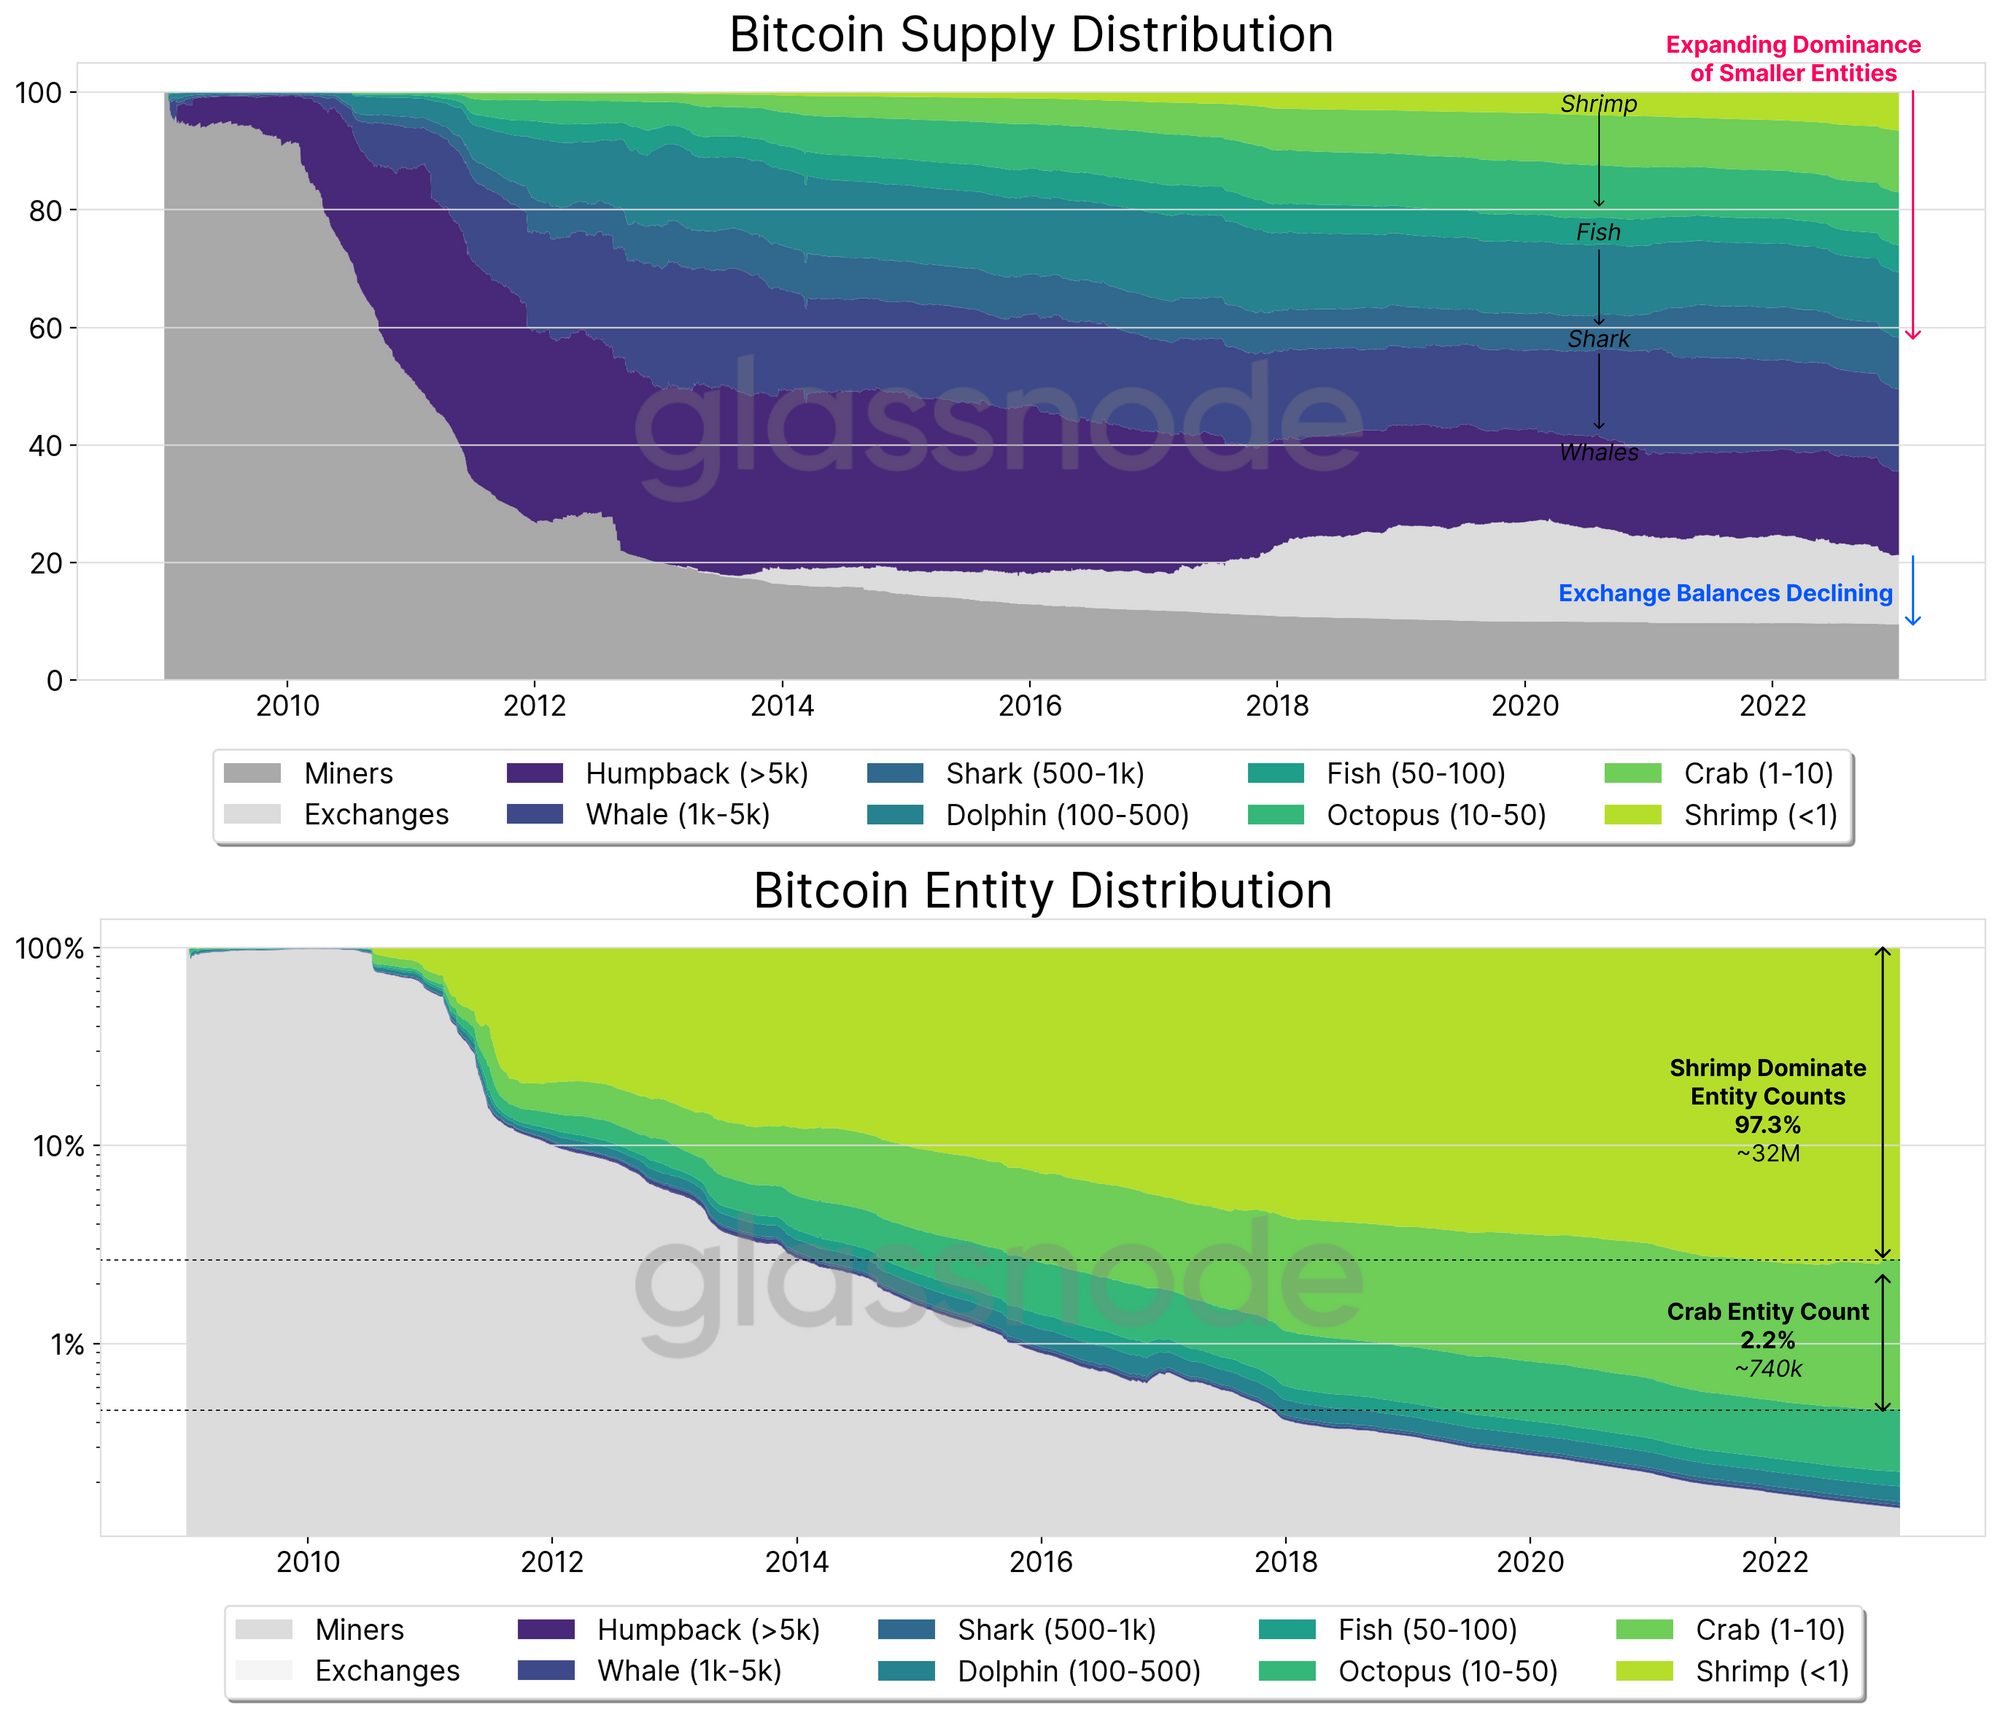
Viewed as a distribution over time, we can see that the smallest cohorts by balance (Shrimp and Crabs) have consistently grown in both population size (bottom chart), but also in terms of relative supply share held (top chart). Overall, this speaks to a structural dispersion of supply over any medium to long term timeframe as Bitcoin adoption and awareness grows.
Summary and Conclusions
In this review of the supply distribution for Bitcoin, we find that the observations made within the original piece are reinforced, and the BTC supply is continuing to distribute to more wallets, of a smaller average size over time. Of most interest is the extraordinary growth in dominance of the smallest cohorts by balance size (Shrimp and Crabs), especially through 2022. This reflects a degree of retail participation that is effectively at all-time-highs, and encouraging to see.
In recent history, there are two events which stand out as behavioral turning points across several cohorts:
- March 2020 sell-off, after which the entrance of institutional size capital becomes apparent, and reverses a trend of stagnant or even declining dominance by larger entities.
- Mid-2022 Deleveraging and FTX, which created the largest impulse of self-custody, and exchange withdrawals in history. This effect is visible across several wallet cohorts, cementing it as a widespread inflection point.
Overall, the Bitcoin supply can be shown to continually to disperse, driven both from the production side (miners), but also across market cycles (investors/holders). This is a healthy observation, and is no doubt an unbelievable reality to chew on for the cohort of professional Bitcoin critics.
🪟 Metrics covered in this report are available in our Entity Supply Distribution Dashboard.
Discussion of Nuances
On Bitcoin Entities: Bitcoin addresses are the basic public addresses recorded on the blockchain that send and receive BTC. Through the application of a variety of heuristics, and advanced clustering algorithms, one can identify clusters of addresses which we have a high confidence are controlled by the same participant, i.e. network entity. This creates an closer approximation for the number of network participants, allowing subsequent analyses to more closely model the underlying network realities. Please refer to our previous work for more information.
On Entity Balance change metrics: As discussed in this article, the figures presented are a best estimate of the true distribution of Bitcoin ownership. At an aggregate level, the trends and magnitude is instructive. For a more granular analysis, additional nuances, and even more refined data is required to properly account for a more individual market structure. Here are several points to take into consideration on this front:
- Supply on exchanges: Quantifying exchange users will have an impact on the above distributions. The estimated number of users on exchanges is in the ballpark of 130 million. It is reasonable to assume that a majority of those by count are retail sized investors, located in the smaller entity buckets. It would require more granular analysis of the distribution of holders on exchanges to distribute the 2.3M BTC held at these custodians. For simplicity, this analysis isolates these coins, but it could be argued that the on-exchange distribution could very well be similar to that of on-chain wallets (i.e. a subset of the total).
- Custodians: Grayscale and other institutional custody services are not explicitly accounted for in this aggregate analysis. However, the BTC held is disproportinately located within the whale+ cohorts. For GBTC in particular (holding ~650k BTC at the time of writing), these coins are held within Coinbase Custody (no longer within our Coinbase exchange entity cluster), and are owned by multiple participants on secondary markets. One could thus argue that the GBTC ‘Whale Balance’ is in fact representative of a supply distributed amongst its own holder base.
- Wrapped BTC: Similarly, there are around 180,000 BTC wrapped in the WBTC ERC20 token, however this aggregate analysis will consider them as a single Whale sized entity. Again, given that these wrapped coins belong to many investors, the ownership of BTC would in reality disperse further across entities.
- Lost coins: Many coins are from the early days are most likely, and are generally considered to be lost. In addition, given the low price of Bitcoin early on, large amounts of BTC were often held within single addresses/wallets, especially prior to BIP32 introducing HD wallets to generate a new address each transaction. Common heuristics to determine which coins are lost may be those that have never transacted since markets started trading (~1.457M BTC), or long dormant 7yr+ old coins (4.45M BTC). Factoring in lost coins which are disproportionately skewed towards higher balance cohort groups would act to indicate an even more widespread supply distribution.
- The estimated number of small network entities: The total number of network entities is most likely much lower than indicated. Our methodology is very conservative, meaning that we optimize to avoid false-positives. However, many addresses owned by the same real-world entity are unlikely to be clustered into a single entity. Consider that a monthly DCA strategy HODLer who never combines UTXOs, and never re-uses addresses will see each monthly acquisition appear as a discrete entity. This effect is most pronounced for small entities due to their relative population size, however the effects will also be prevalent amongst larger entities. This means that the actual number of network entities is likely to be lower than the ranges shown.
Disclaimer: This report does not provide any investment advice. All data is provided for information and educational purposes only. No investment decision shall be based on the information provided here and you are solely responsible for your own investment decisions.
- Join our Telegram channel
- Visit Glassnode Forum for long-form discussions and analysis.
- For on-chain metrics, dashboards, and alerts, visit Glassnode Studio
- For automated alerts on core on-chain metrics and activity on exchanges, visit our Glassnode Alerts Twitter
