What Do Bitcoin Whale Addresses Tell Us About Market Trends?
Discover Bitcoin whale activity and its effects on market dynamics. Understand the shifts in accumulation and distribution patterns. Uncover more by reading the article.

Bitcoin whale addresses, which hold more than 1000 BTC, have become an essential area of focus for market analysts and researchers. As the Bitcoin network grows and matures, understanding the movement of these whale addresses is becoming increasingly critical to navigating market trends. This article will examine what we can learn about market trends from Bitcoin whale addresses.
Why Monitor Bitcoin Whale Addresses?
The influence of Bitcoin whale addresses, although still significant, is transforming. In comparison to the 2017 bull market, where the lack of substantial institutional interest led to minimal counterbalance against whale influence, the current market dynamics are different. Today, increased institutional interest serves to offset the impact of whale movements, leading to a more balanced market environment. However, the 2020/2021 cycle saw an inflow of institutional capital, reducing the whales' market dominance.
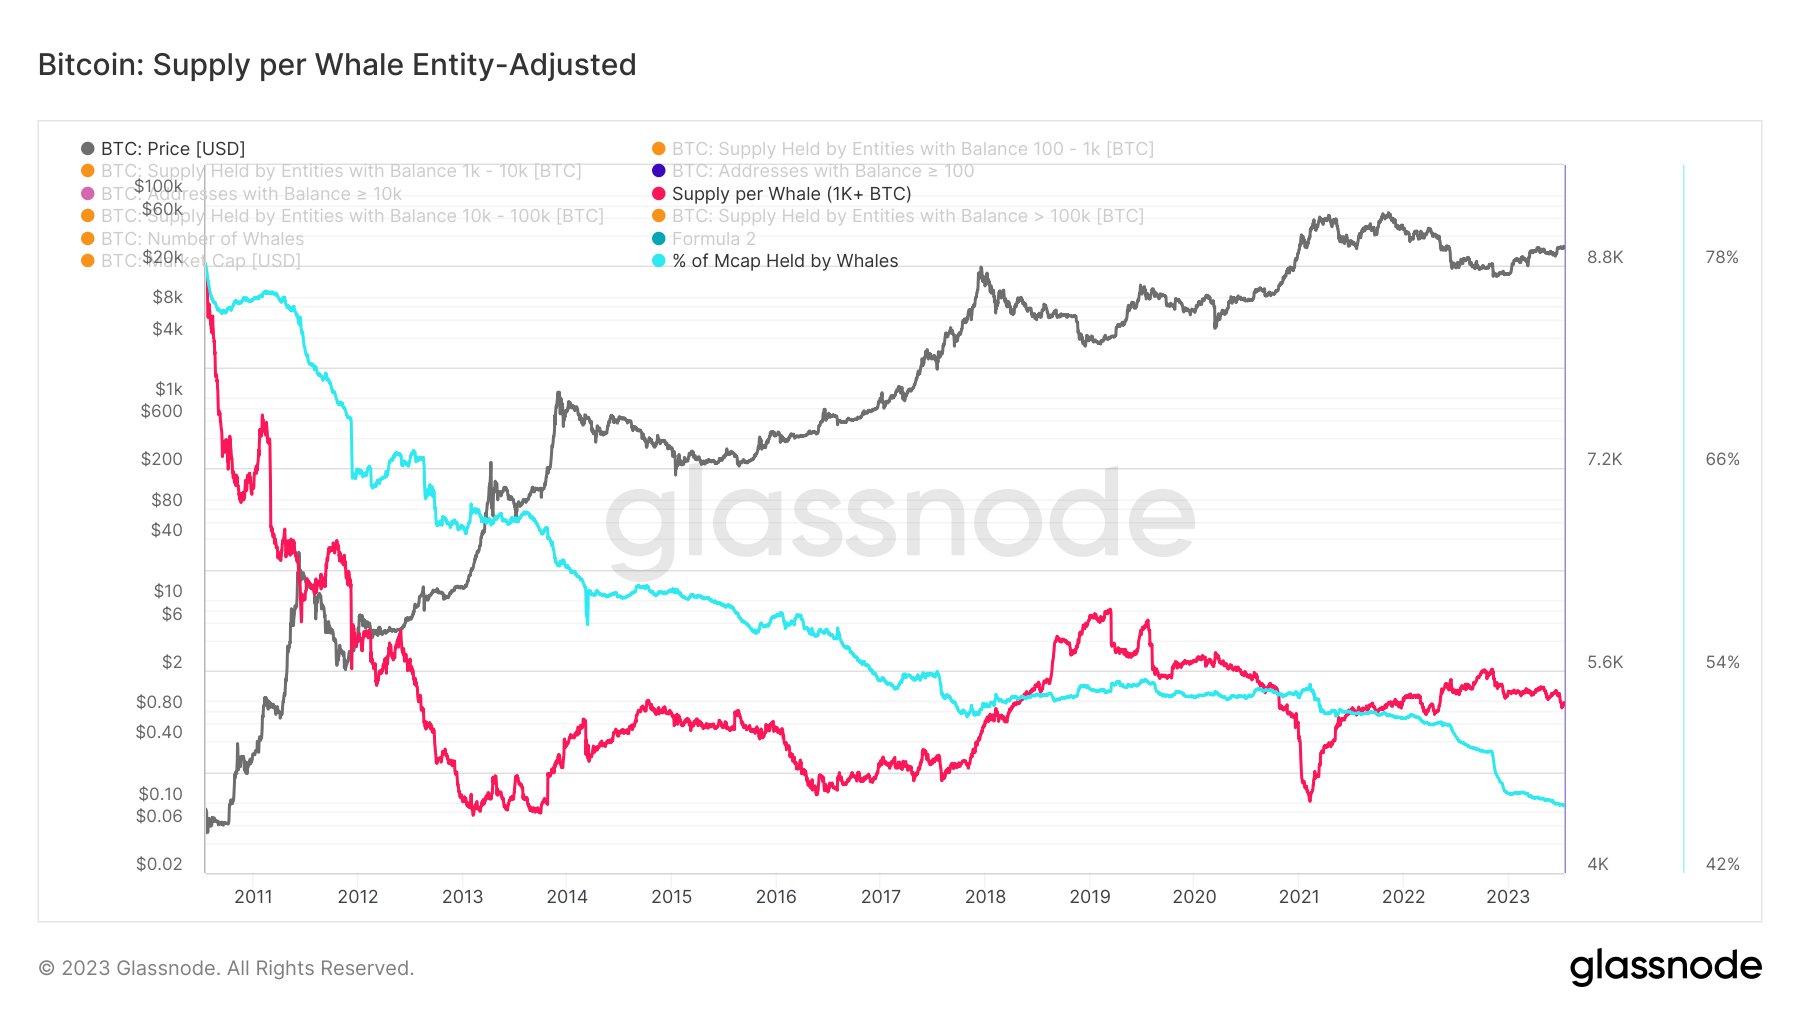
By mid-2023, whale addresses held approximately 40.4% of the circulating Bitcoin supply, a slight decrease from the 41.3% held at the start of the year, signifying a more dispersed distribution of Bitcoin.
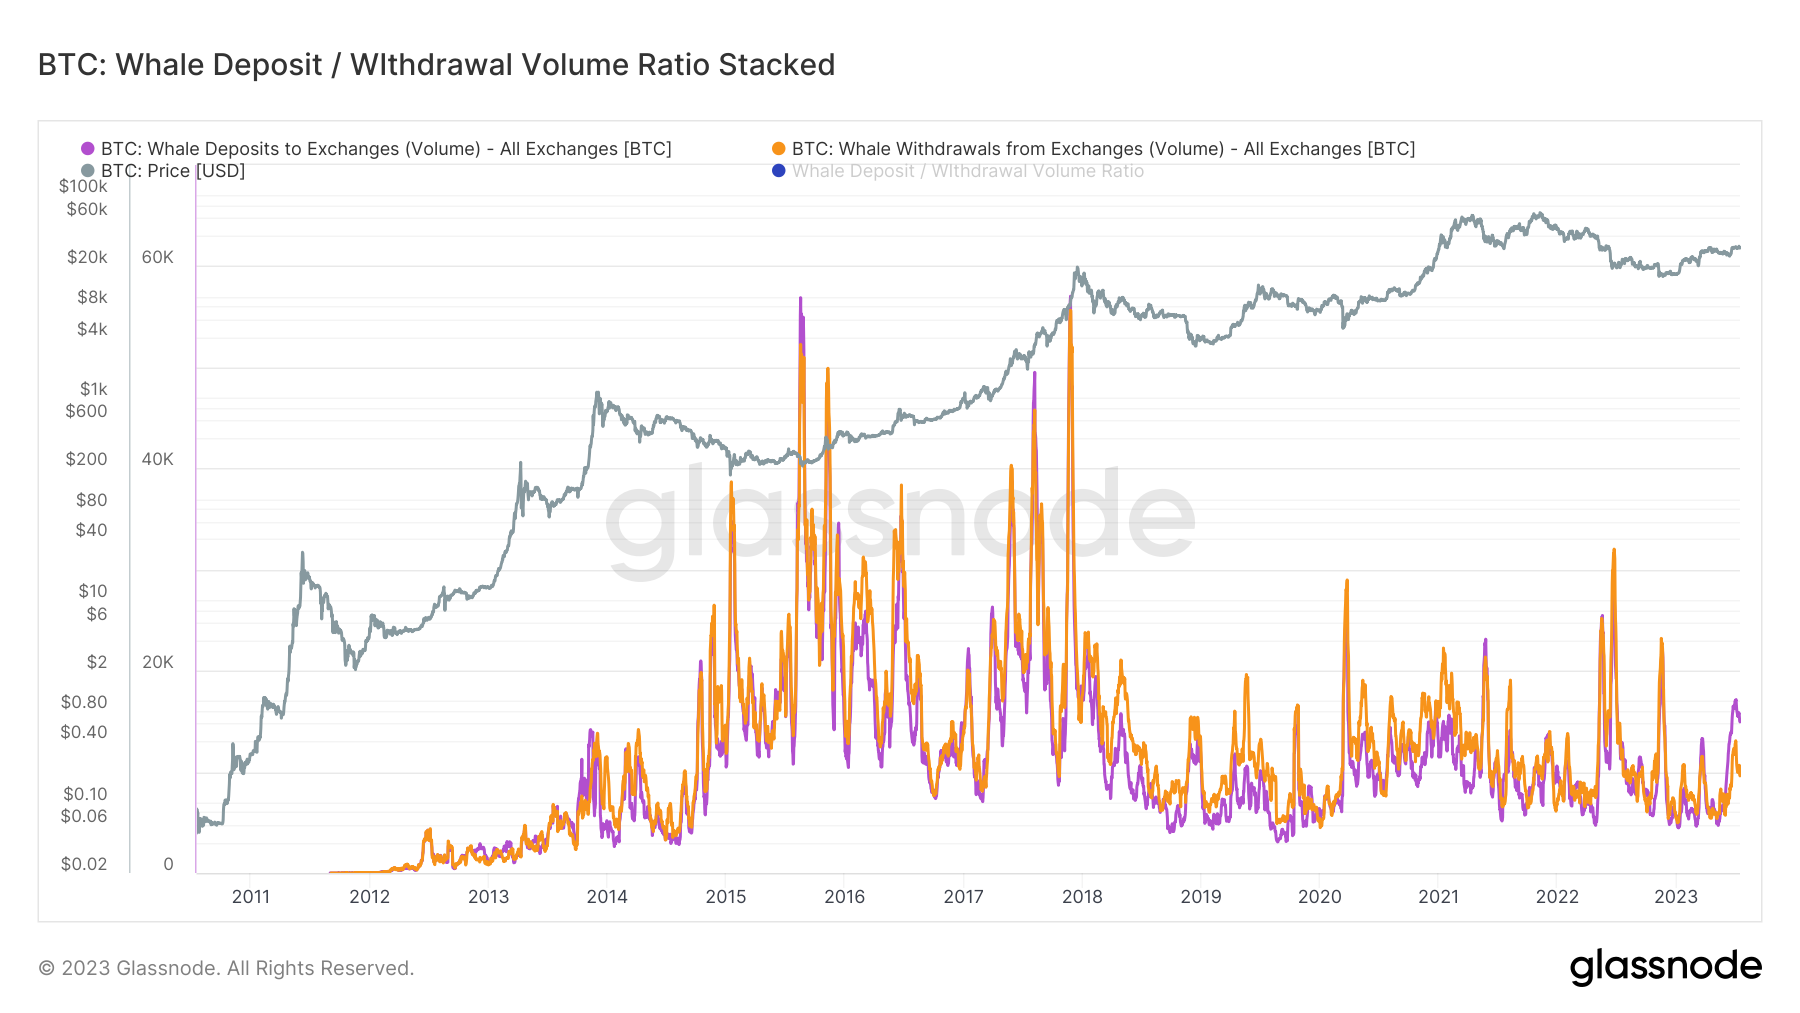
The Whale Deposit/Withdrawal Volume Ratio chart below helps us decode whale transaction behavior. It shows Bitcoin deposit-to-withdrawal volume ratios, offering signals of potential market shifts such as increased selling pressure. As we can see, there has been a significant increase in deposits to exchanges from whales since January 2023.
This maturation of the Bitcoin market is characterized by increased liquidity, less volatility, and diverse distribution. A persistent decline in the distribution and balance of Bitcoin whale addresses is evident - from controlling 62.7% of total supply during the first Bitcoin halving in 2012, their share has declined by 45% to 34.4% today. This shift underscores a broader dispersion of Bitcoin supply across an expanding network of entities, demonstrating the evolving landscape of Bitcoin ownership.
Understanding Bitcoin Whale Addresses: Tools and Techniques
Glassnode provides several unique metrics to offer insights into whale address activity. These include:
Accumulation Trends
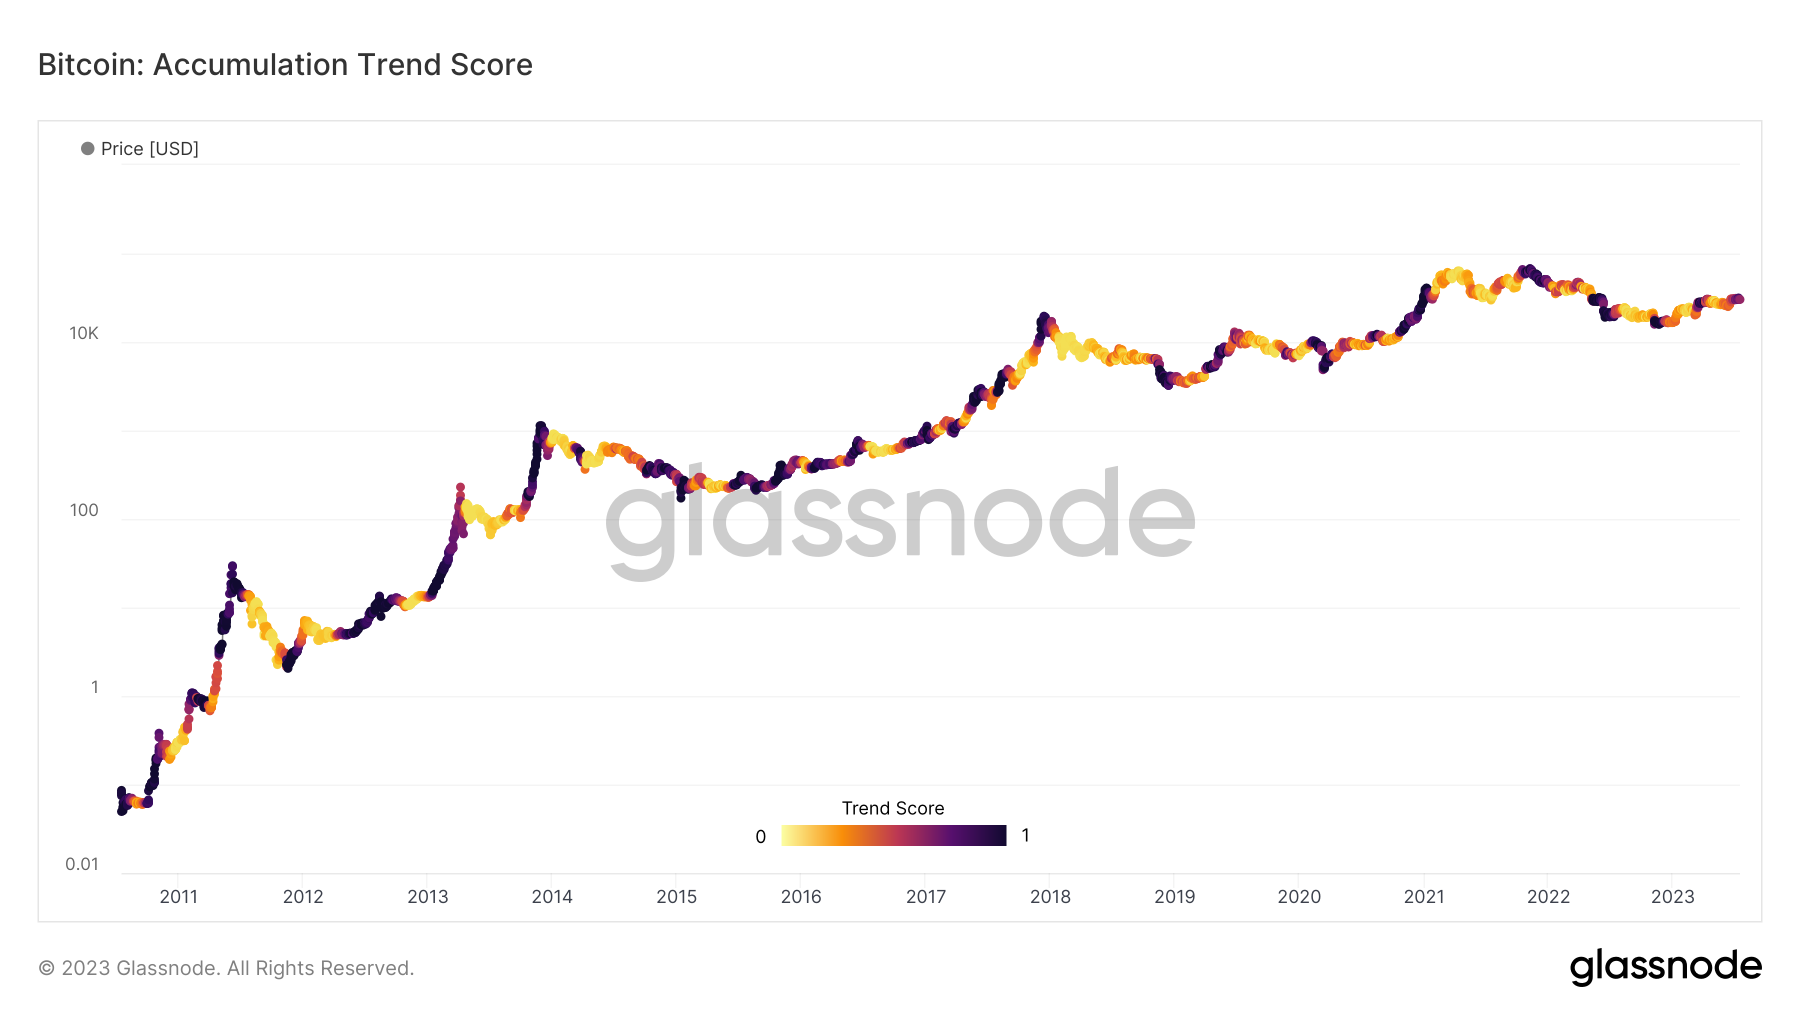
The Accumulation Trend Score is considered key indicator for monitoring Bitcoin whale address behavior. This score functions as a benchmark for gauging the extent of active Bitcoin collection by addresses transacting large volumes on the blockchain, particularly with respect to their Bitcoin possessions.
It employs a dual-parameter scale - the size of the whale's current balance (their participation score) and the fluctuation of new coins they have either procured or liquidated in the recent month (their balance change score).
Essentially, this chart depicts the strategies of Bitcoin's largest players, offering valuable indicators about future market trends. An Accumulation Trend Score closer to 1 signals that large-scale entities, predominantly Bitcoin whale addresses, are accumulating coins, whereas a score verging towards 0 suggests that they are either distributing coins or refraining from further accumulation. In the current year of 2023, the trend score is edging closer to 1, signifying that the entities, particularly the crypto whales, are in an accumulation phase.
Supply-Held Metrics
The term 'Supply-Held' in this context refers to the amount of Bitcoin that is currently held or controlled by different entities or cohorts. This dashboard provides a comprehensive snapshot for monitoring the 'whale' cohort. It offers a dashboard to scrutinize the macro trends of Bitcoin whale address growth or contraction throughout various market cycles. The displayed metrics account for the number of Bitcoin addresses, however, it's essential to clarify that this doesn't automatically equate to the amount of Bitcoin these addresses hold
Understanding that these Bitcoin whale addresses include those managed by large-scale players like exchanges, custodians, and ETF products is essential.
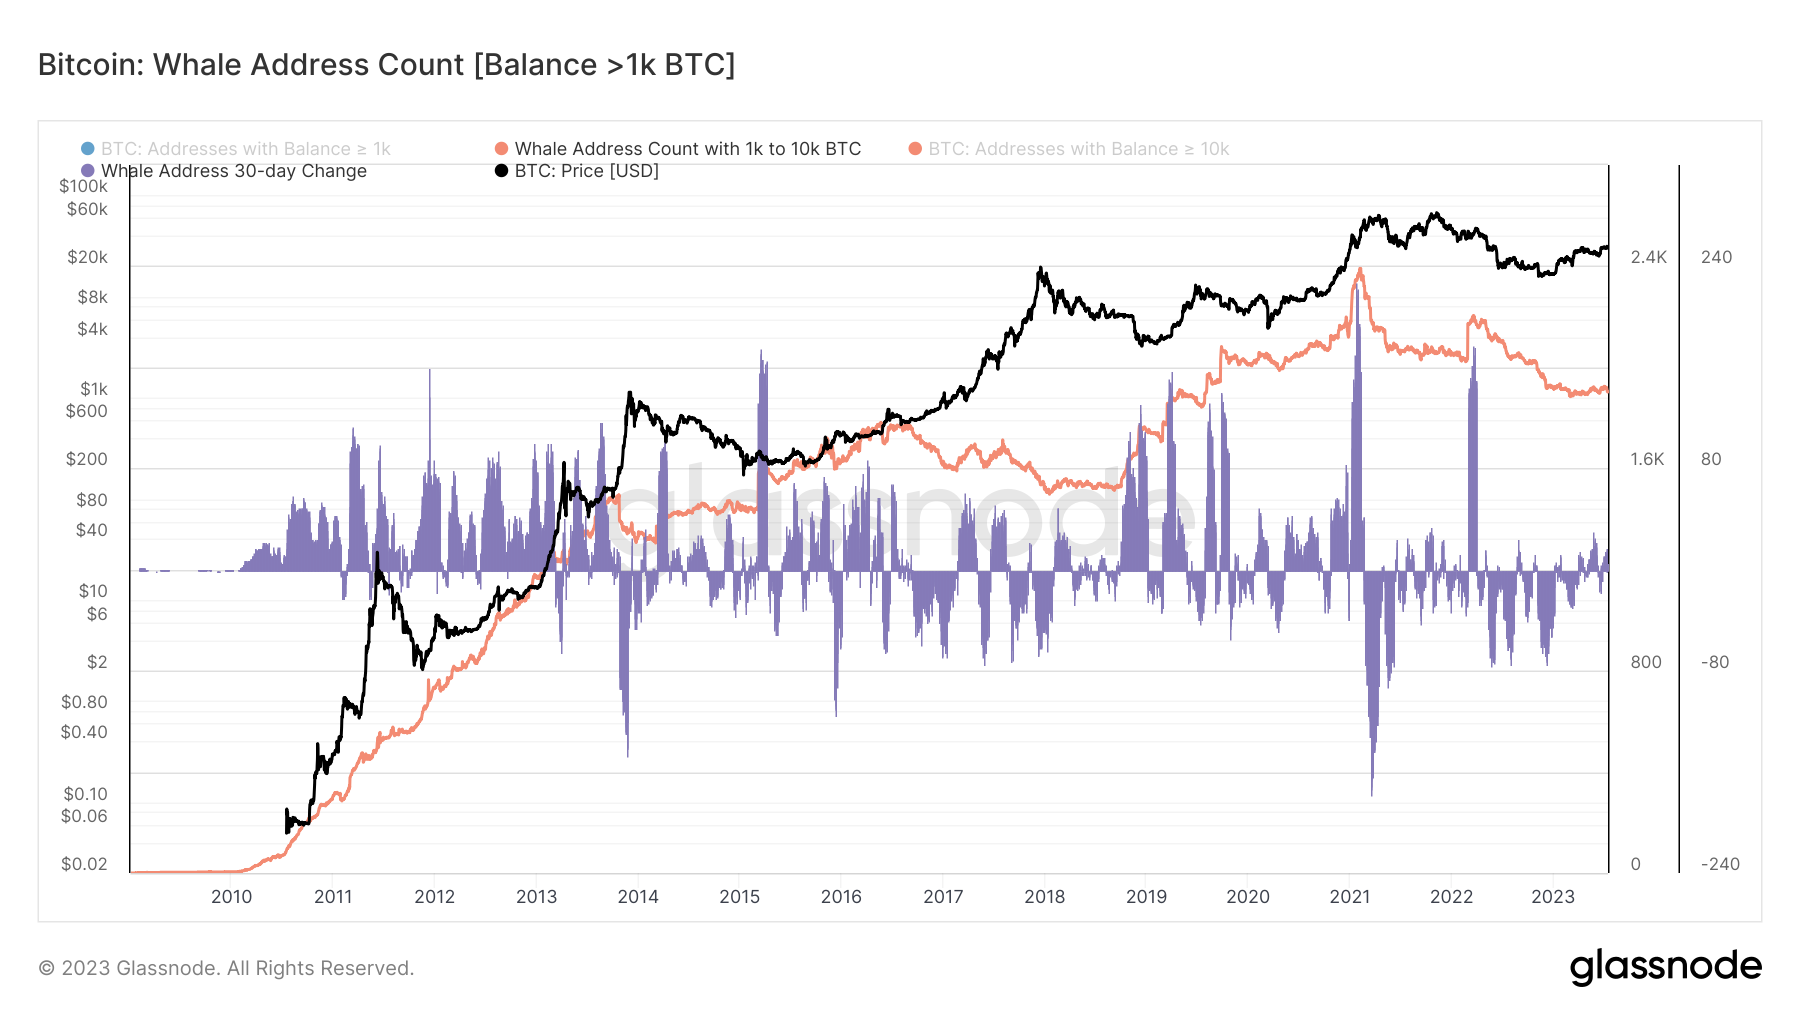
The Whale Address Count dashboard's orange line shows the count of 'Whale' addresses (>1k BTC), while the purple line indicates the 30-day changes in this count. Together, they provide quick insights into whale accumulation and distribution, helping decipher Bitcoin market trends. As we can see there has been significant decline in the cumulative whale balance since May.
Yearly Absorption Rate
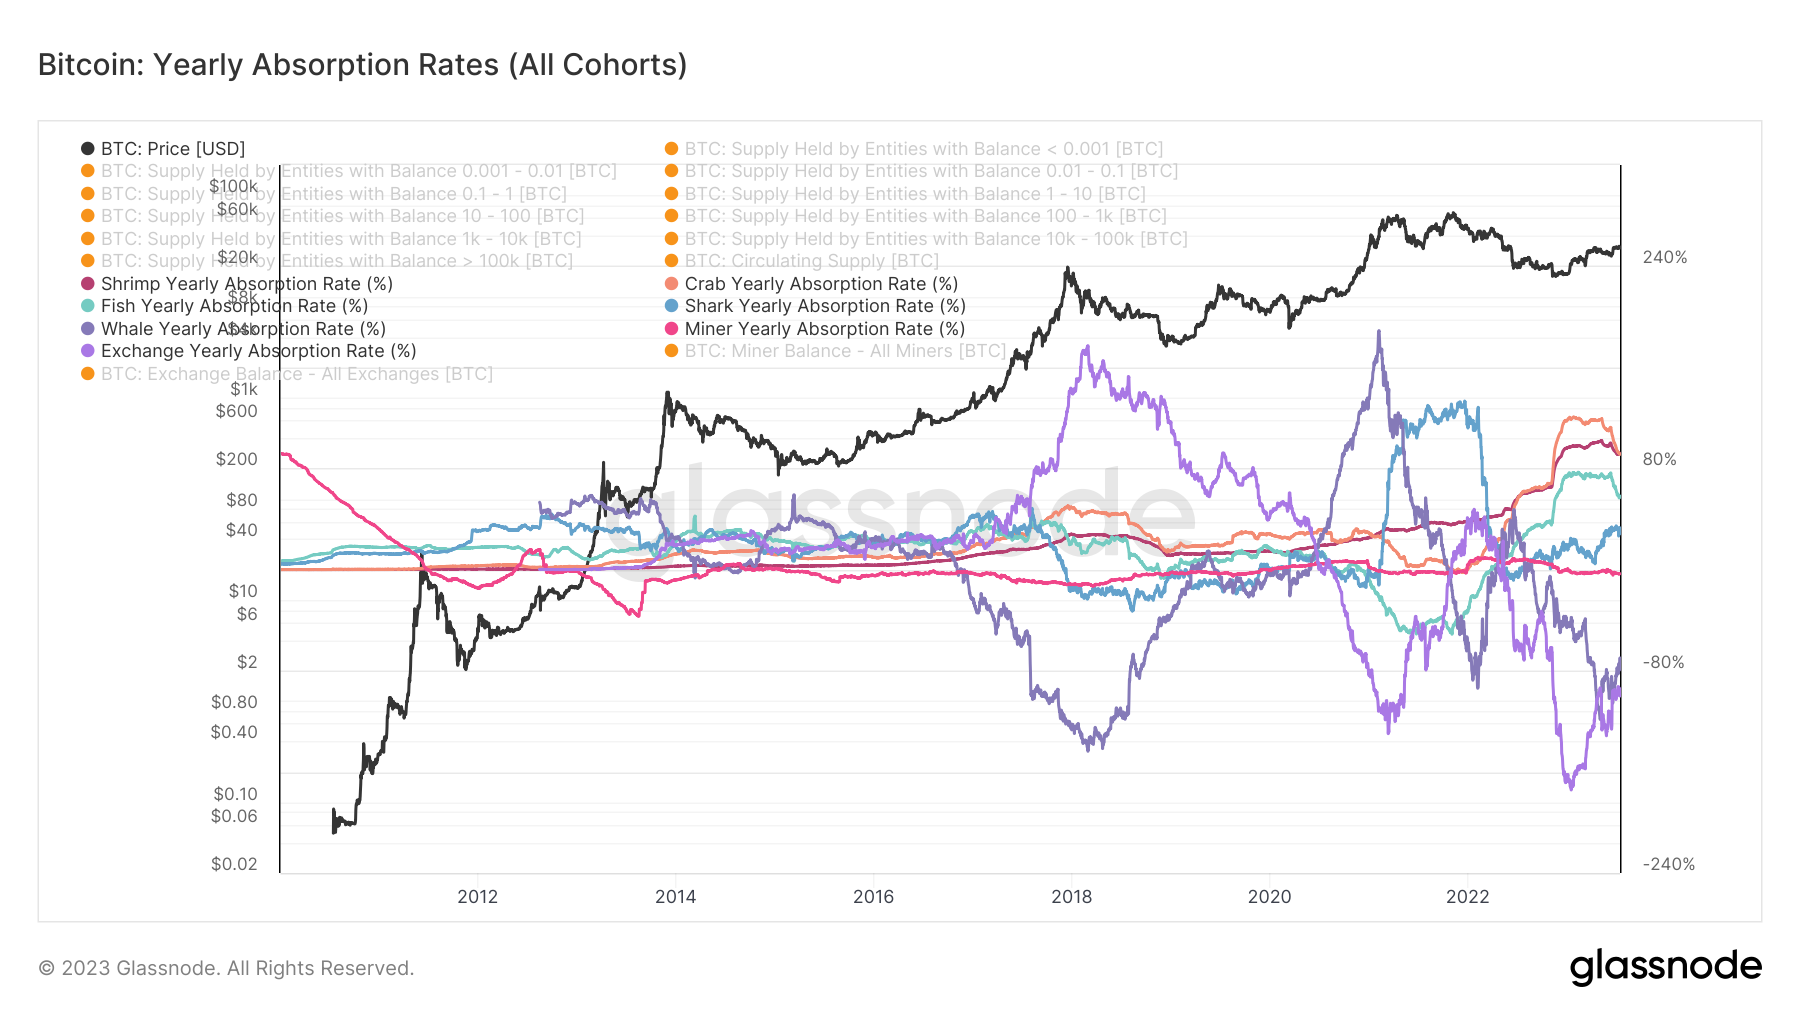
The Yearly Absorption Rate is a measure that demonstrates the annual percentage change in Bitcoin holdings by large-scale entities, often referred to as "whale addresses".
For example, during the bull run of 2020-2021, the Yearly Absorption Rate provided a noteworthy insight. It registered a remarkable 14% surge in the quantity of Bitcoin held by these whale entities, marking the first upward shift since 2016. This information strongly suggests a considerable influx of institutional and corporate capital into the Bitcoin market. Such an influx would likely have a profound effect on the behaviors and holdings of these Bitcoin whale addresses. Observing the data, it becomes clear that since the beginning of 2023, the yearly absorption rate of crypto whales has experienced a significant decline, approximately around 67%.
Reading and Interpreting Bitcoin Whale Address Activity
Analysis with Glassnode's tools provides an extensive view of relevant parameters. By the end of 2022, there was an upward trend in the number of whale addresses, increasing by 8.9% compared to the previous year, which may indicate the growing interest of high-capital investors in Bitcoin.
The wealth concentration within these whale addresses also showed a significant shift. As highlighted earlier in the article, as of mid-2023, whale addresses are in control of about 40.4% of the circulating Bitcoin supply. This demonstrates a slight decrease from the beginning of the year's 41.3%, indicating a wider distribution of Bitcoin ownership. As you can see, there has been a decrease in % of Mcap Held by whales in 2023.
The value of understanding accumulation trends across various investor cohorts - Shrimp, Crab, Octopus, Fish, Dolphin, Shark, Whale, and Humpback - cannot be overstated. For example, over 2023, the 'Crab' cohort (addresses holding between 10 and 100 BTC) increased their aggregate Bitcoin holdings by a remarkable 5.2%, indicating the growing engagement of smaller-scale yet significant investors.
This insight underscores the shifting dynamics of Bitcoin investment and distribution. It appears to indicate that while the Bitcoin market was once dominated by the 'big fish', it's now seeing increased involvement from smaller players. This shift could potentially signal greater market stability, as risk is distributed more evenly across a larger number of investors, which can lead to a more sustainable growth trajectory.
Finally, noteworthy shifts in these entities' behavior are observed during specific market events. For example, the deleveraging in the DeFi market and the FTX collapse late-2022 triggered an unprecedented surge in self-custody and exchange withdrawals. During this period, there was a notable surge of 23% in the volume of Bitcoin transferring from exchanges to private wallets. This shift reflects a decisive move towards risk-management as investors viewed exchanges as a risk, particularly in the aftermath of events like the FTX collapse. Rather than indicating bullish market sentiment, this action illustrates a strategic approach to managing perceived risk during uncertain market conditions.
Conclusion
Bitcoin 'whales' represent individuals or entities holding a substantial amount of Bitcoin, often contributing significantly to market trends. Understanding their behavior is valuable as their transactions can have an impact on the market, either triggering or signaling potential price movements.
Employing tools like Glassnode's 'Whale Deposit/Withdrawal Volume Ratio Stacked' dashboard, the 'Accumulation Trend Score' indicator, or the 'Yearly Absorption Rate' tool (found in this Glassnode workbench) can provide actionable insights into these whales' behavior. These analytics allow investors to gauge the whales' participation score (their current balance) and their balance change score (their recent accumulation or distribution).
By tracking these metrics, readers can better comprehend market trends and refine their investment strategies. Notably, the increased dispersion of Bitcoin's supply hints at a more diverse holder base, a trend signalling the maturation and broadening acceptance of Bitcoin. In a nutshell, monitoring whale behavior is instrumental in navigating the dynamic Bitcoin market.