DeFi Uncovered: Navigating the Crash
DeFi has shown strength amidst increased market volatility. We explore the impact of broad selling on the health of DeFi and token valuations.


DeFi showed its resilience at a protocol level amidst heightened price volatility and extreme gas prices. Liquidation and arbitrage mechanisms worked as intended, maintaining stability while stablecoins held their peg, seeing massive transfer volume and use across the ecosystem. DEXs reached all-time high volume, derivatives platforms saw increased use, and token valuations reached record low levels as protocol revenues increased and token prices deflated.
In this report we cover:
- DeFi's reaction to declining token prices
- Token valuations post crash
- Gas price and usage exploration
DeFi's Activity Amidst Declining Token Prices
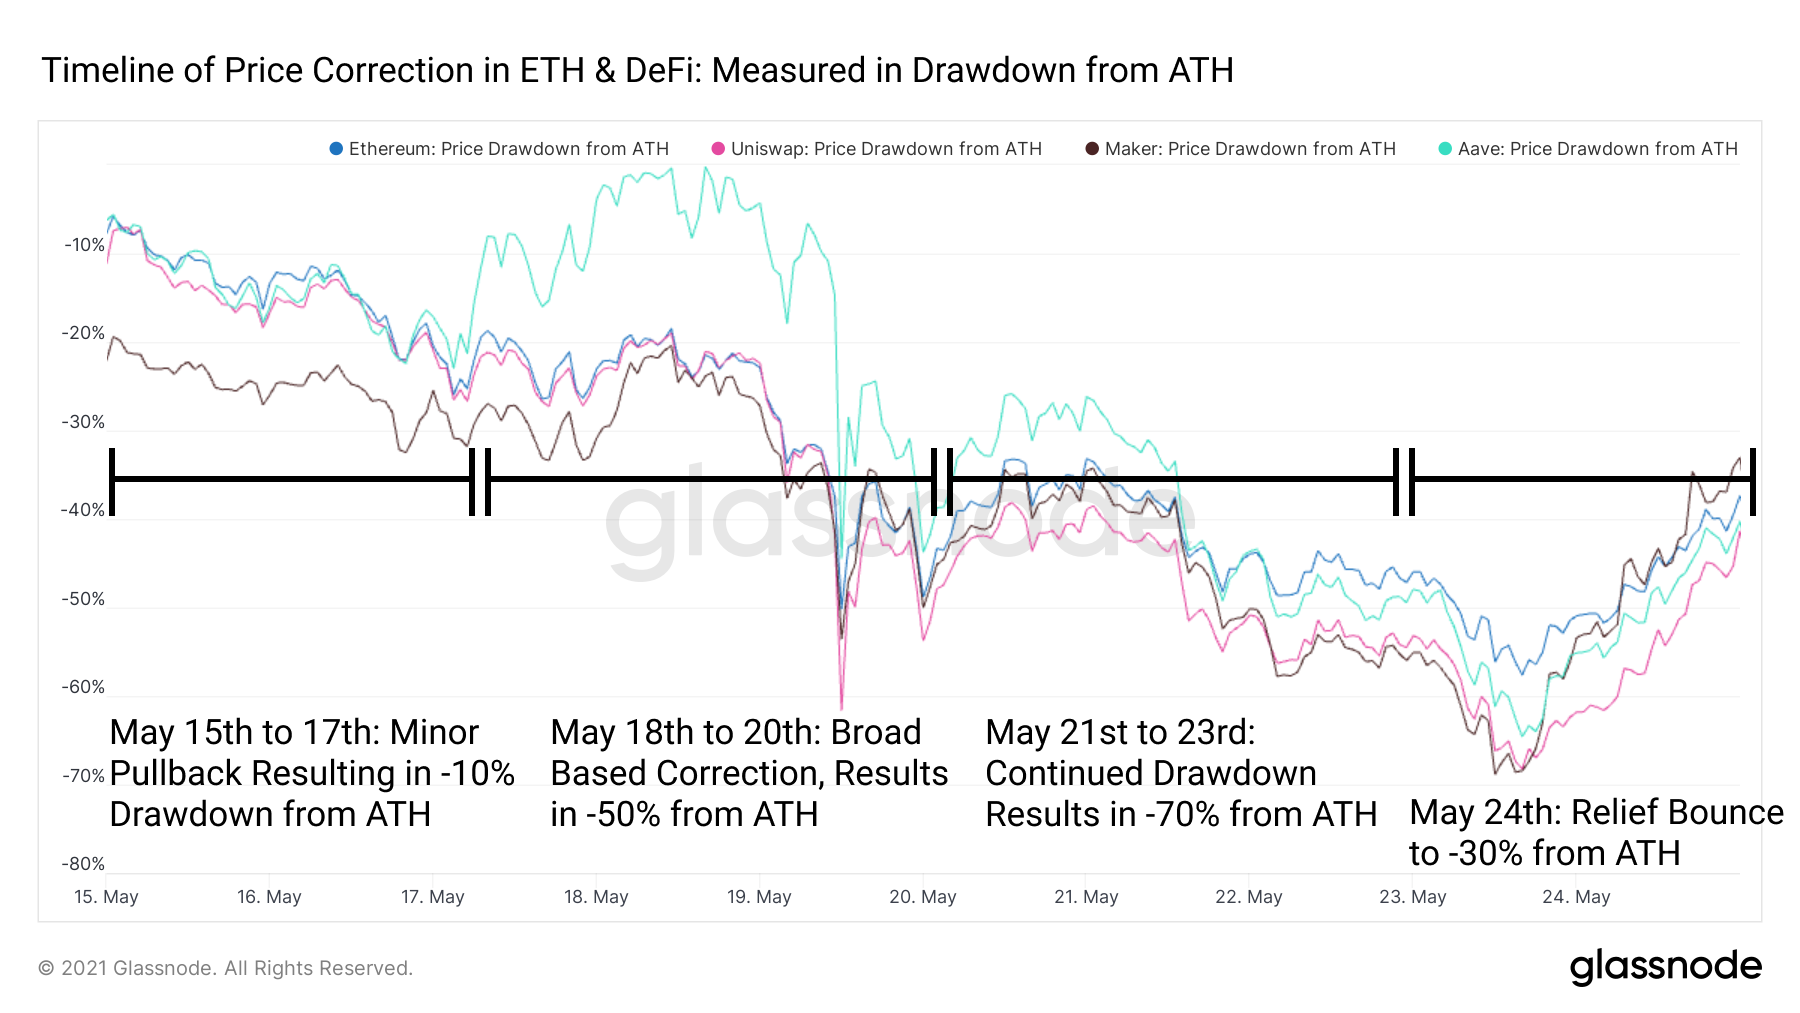
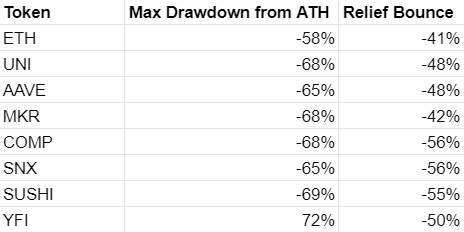
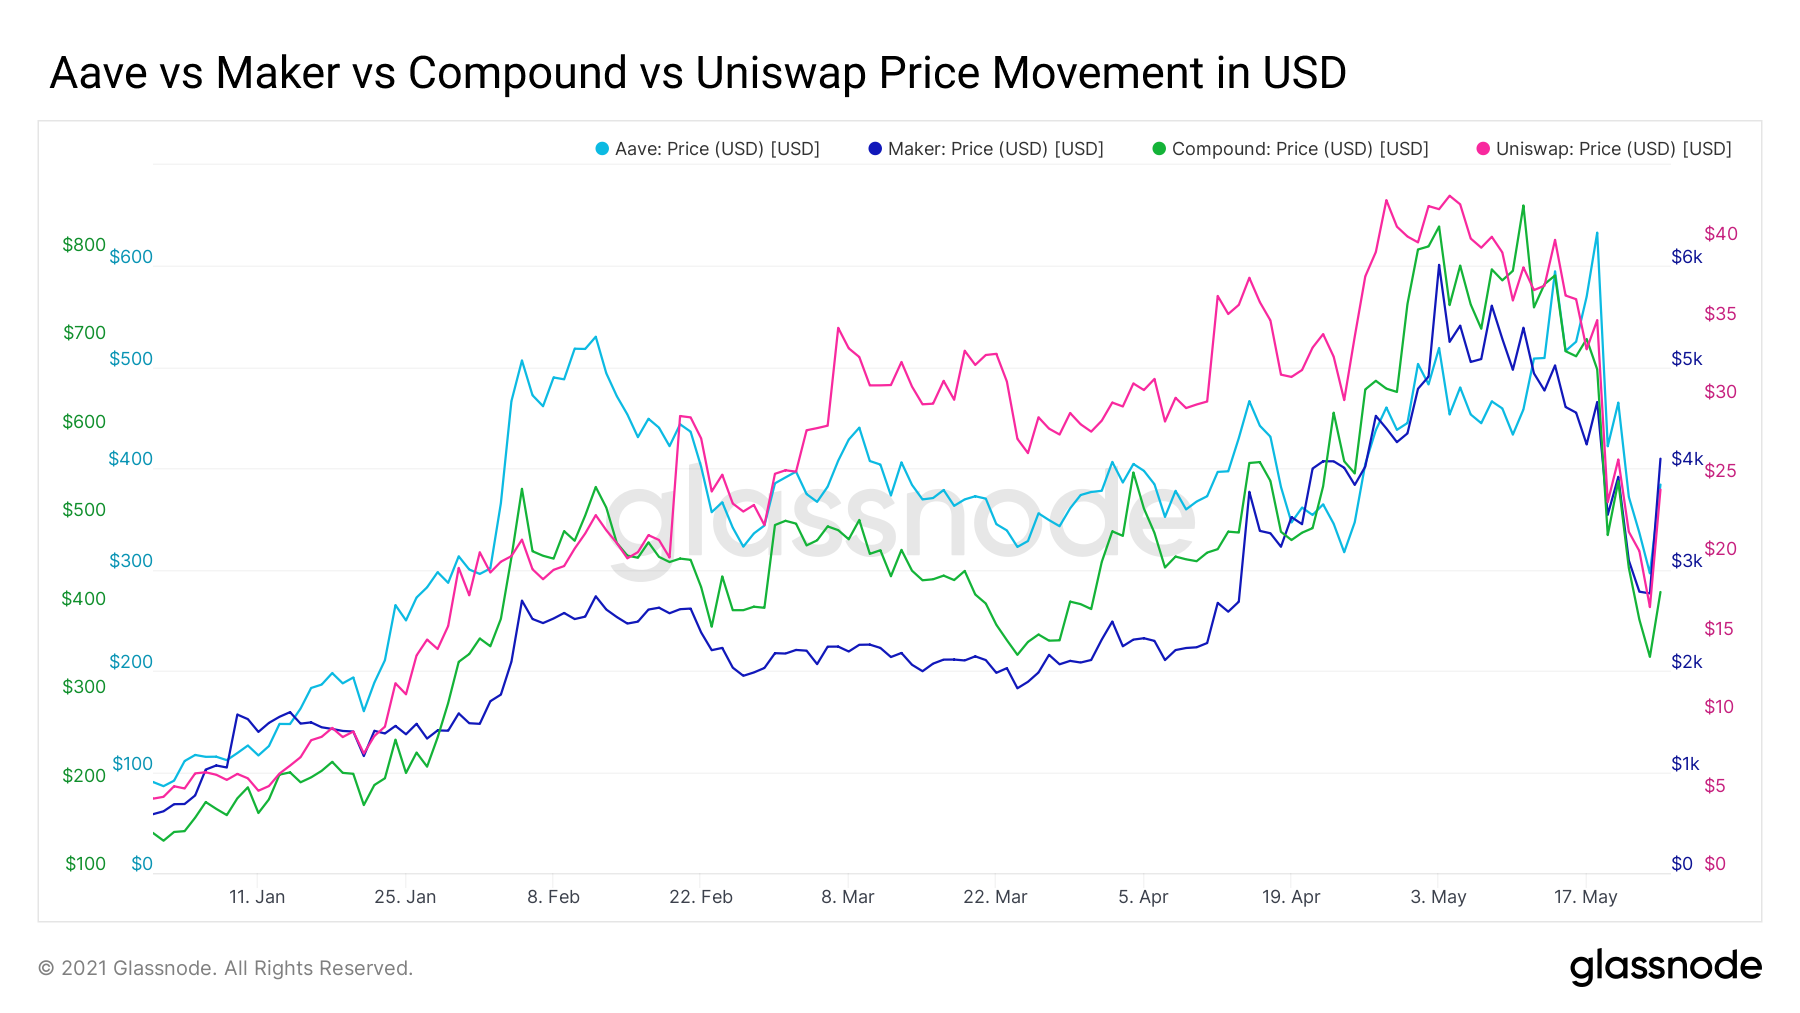
The reaction of DeFi to a broad based decline from ATH has been mixed. Token prices in blue chip DeFi have largely followed the decline of ETH, showing relatively high beta to ETH but not exceeding the decline from ATH by more than 15% from the decline of ETH among UNI, MKR, AAVE, COMP, SUSHI, and SNX.
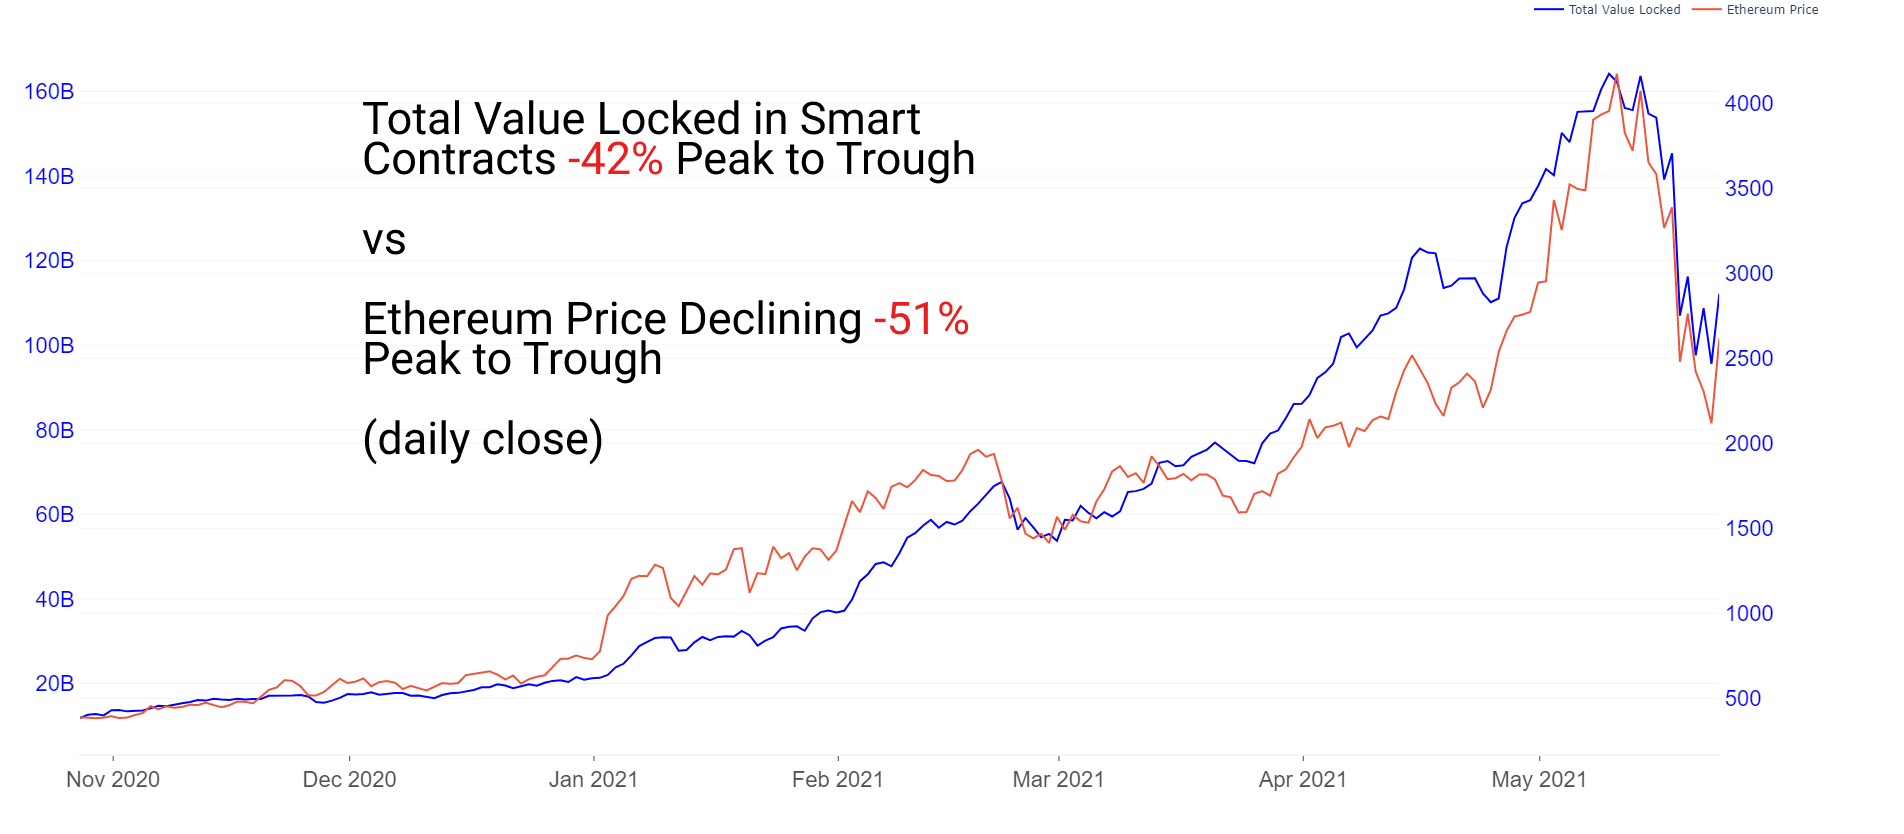
Total value locked in smart contracts has fallen 42% peak to trough, moving generally in line with the price of Ethereum, which fell 51% peak to trough.
DEX Activity
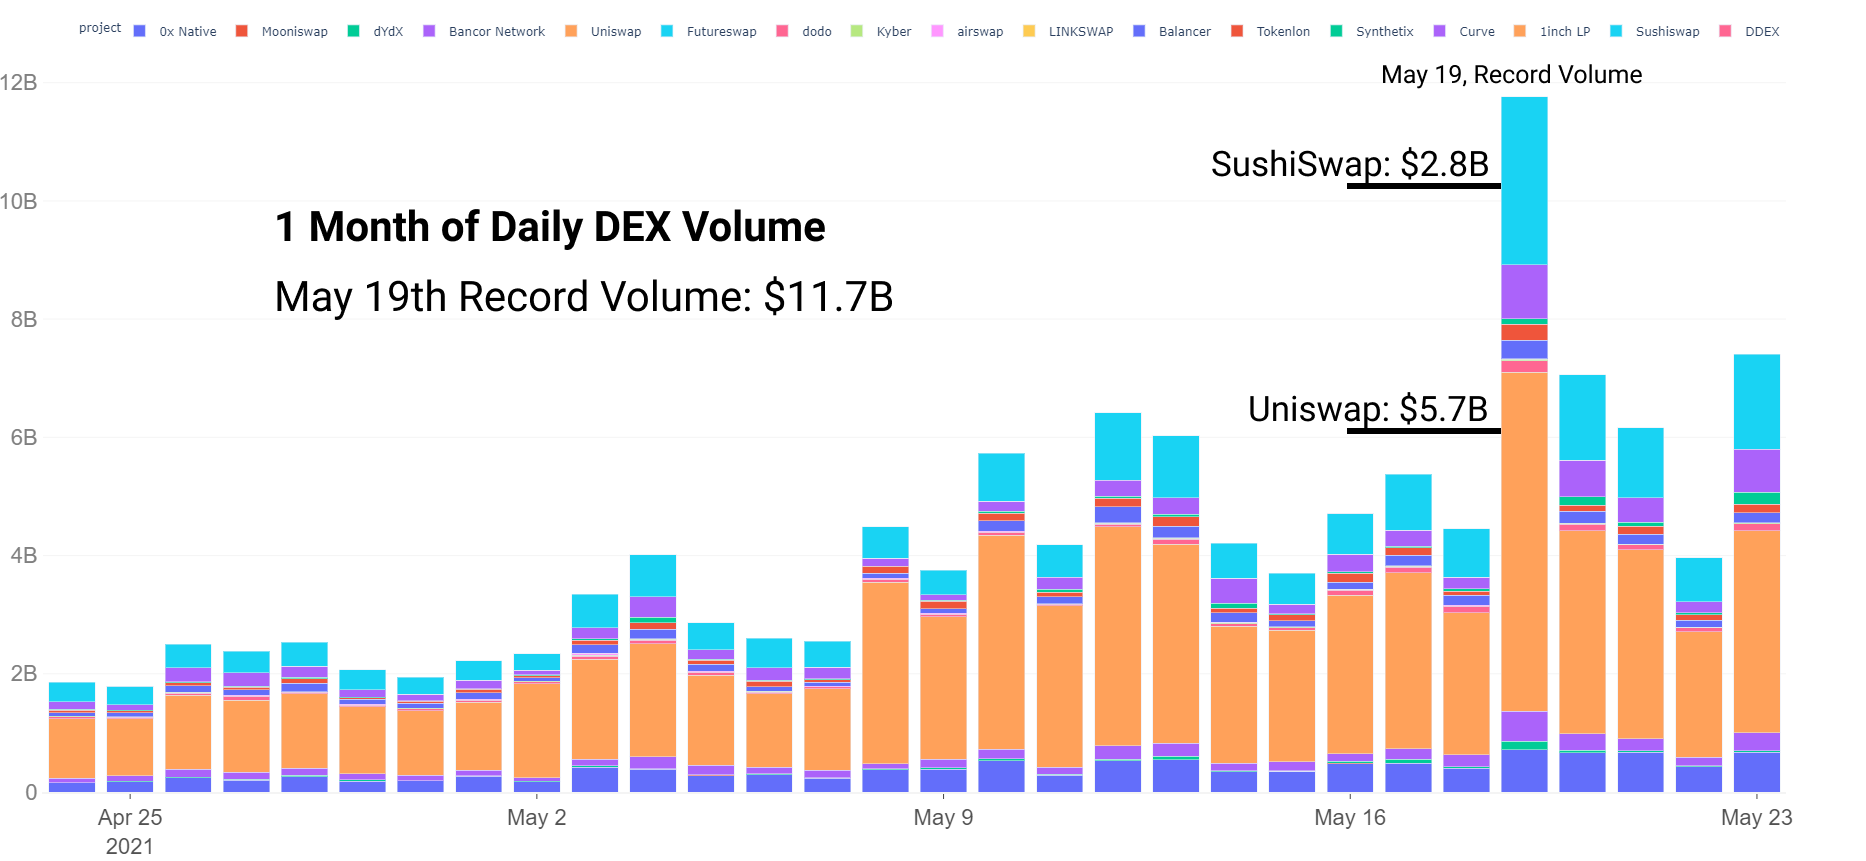
With heightened volatility, DEX volume rocketed to all-time highs. Record volume of $11.7B was set on May 19th amid selloff. Uniswap dominated with $5.7B in volume on $5.8B of liquidity, while Sushiswap was in a dominating second position at $2.8B on $3.5B of total liquidity.
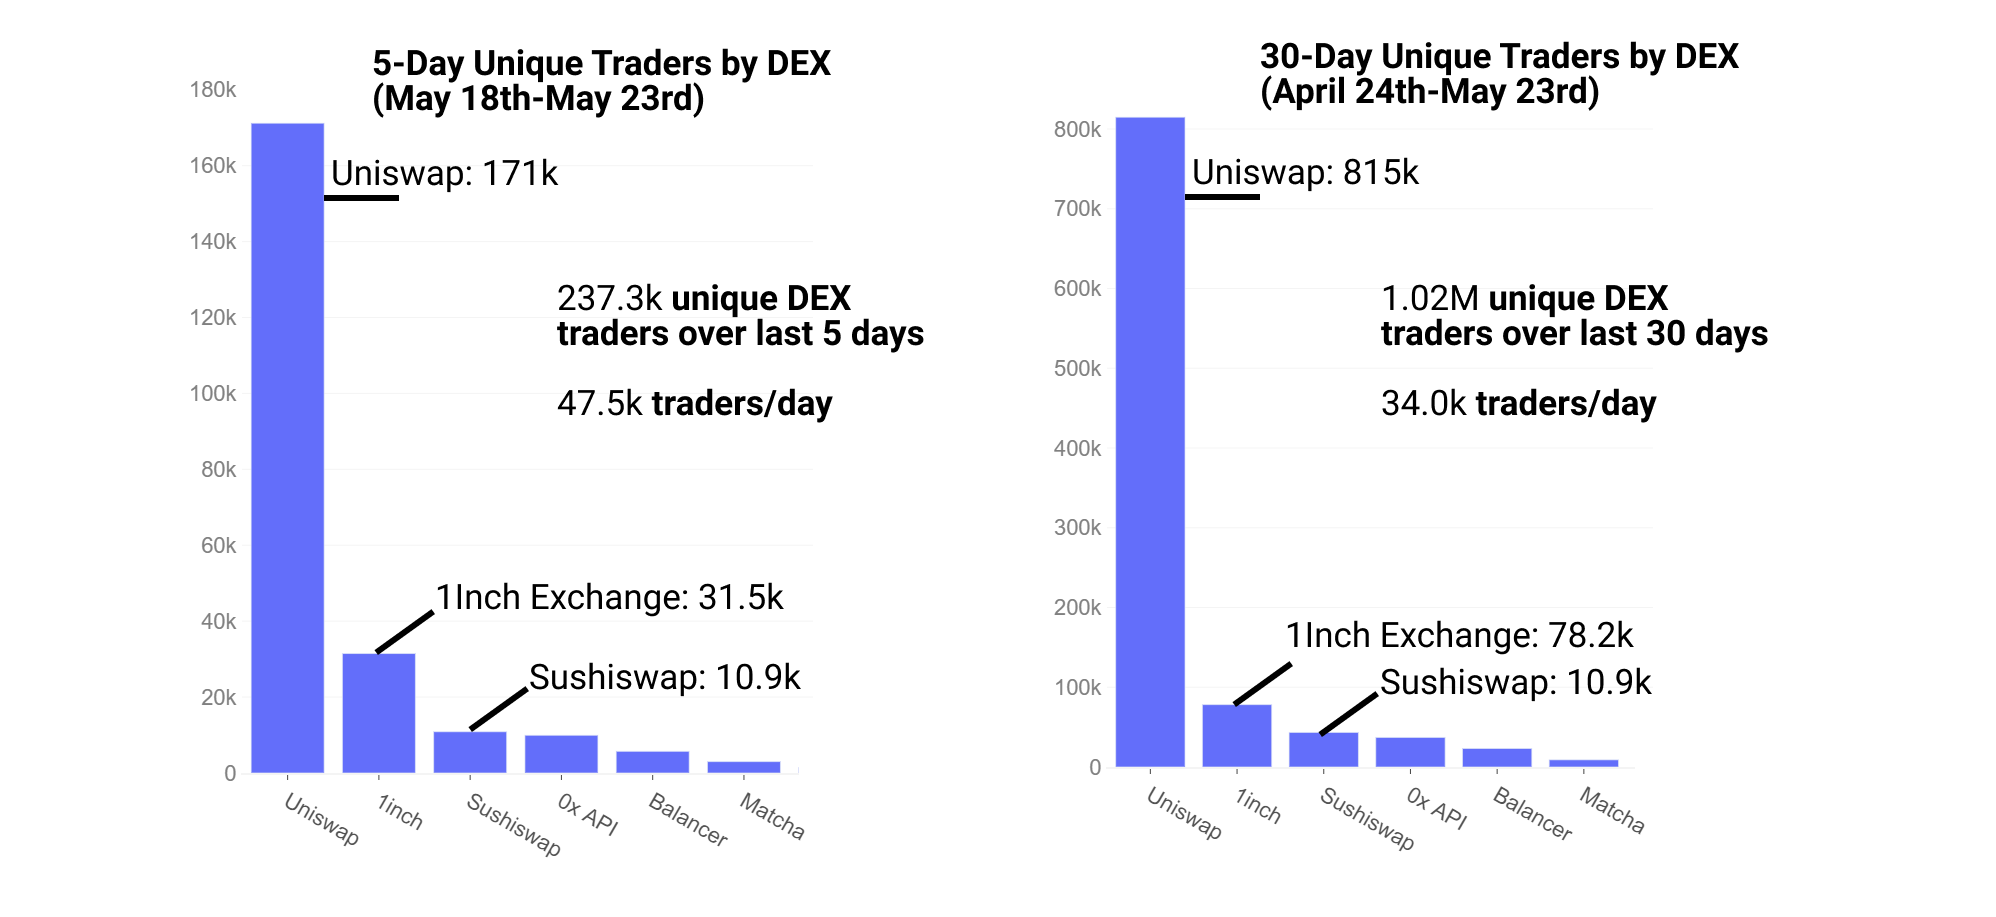
The number of daily traders has also seen massive growth. 30 day number of unique daily traders in DEXs is at an all-time high, as is 5 day number of traders. Volume/trader is higher on SushiSwap than any other exchange, with SushiSwap commanding high volume but a tiny number of traders compared to Uniswap. Total number of unique 30 day traders surpassed 1M traders for the first time. While it is nice to see this increased number of traders during this volatile period, the true test of product market fit will come if/when DeFi enters an extended bear market.
Lending Activity
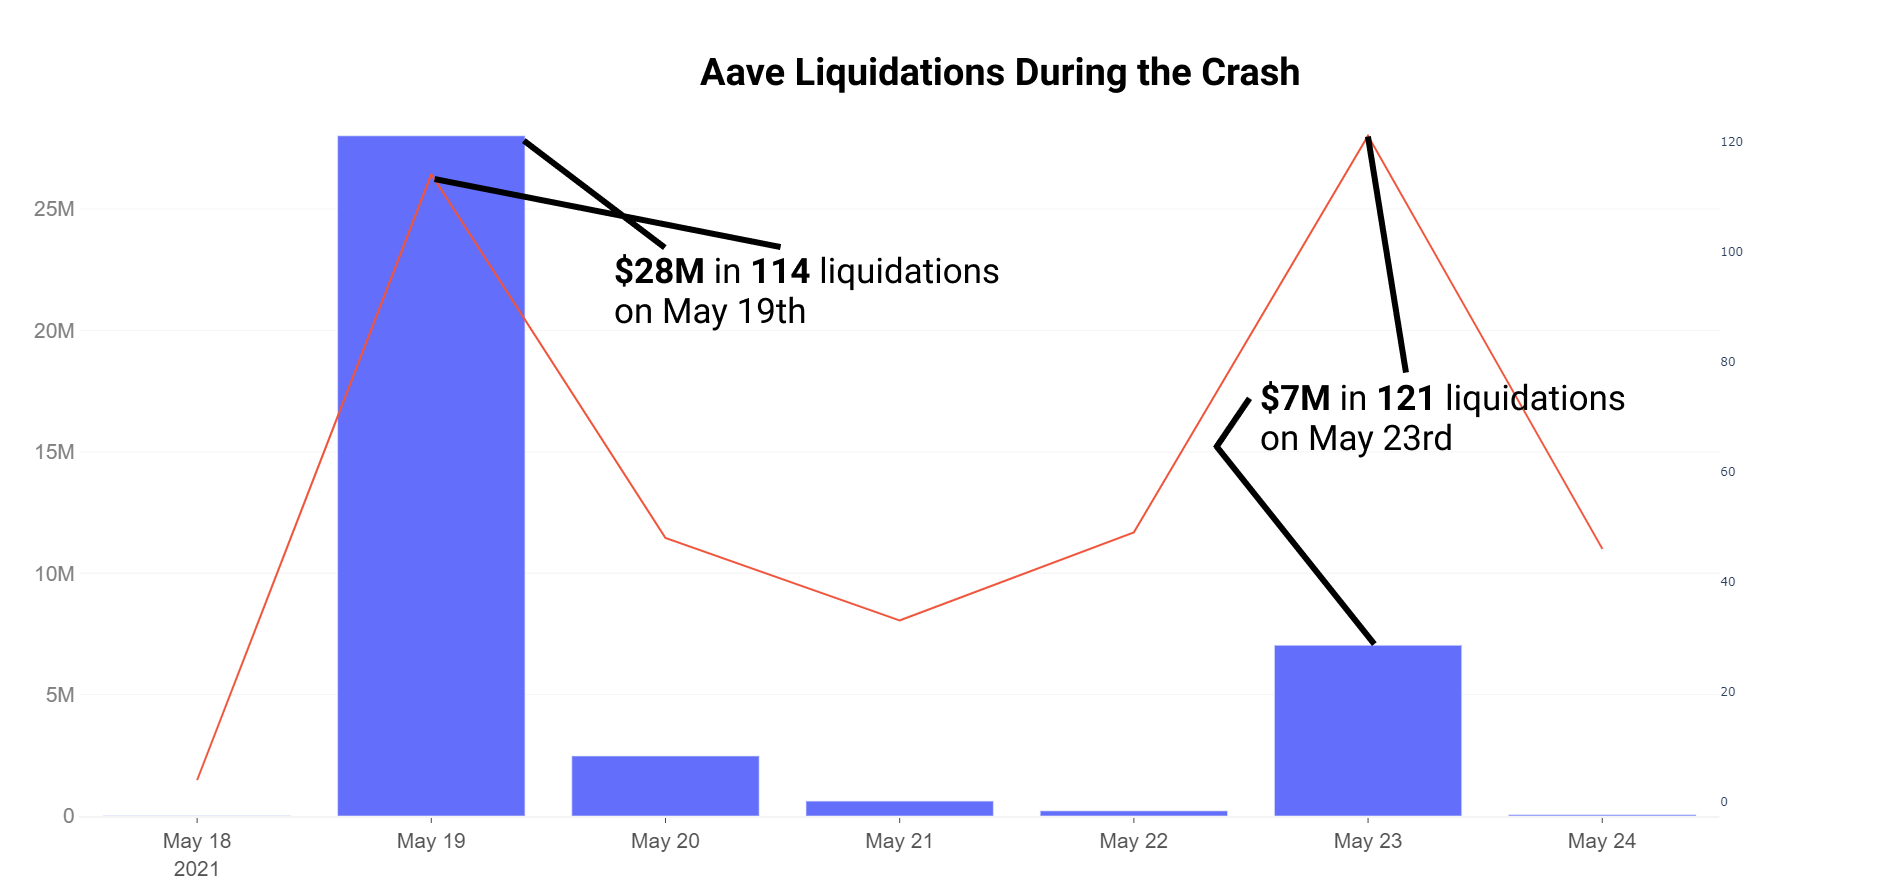
Lending protocols have shown strength, with value locked staying strong and liquidations staying at a minimum. Loss of stablecoin peg is a key risk for borrowers during a market crash. Collateral requirements are more difficult to meet as prices become more volatile. Additionally, volatile collateral, liquidations, and varying levels of utilization can create volatile interest rates. Volatile rates can lead to further withdrawals from borrowers. Fortunately, stablecoins stayed healthy, utilization stayed healthy, and lending markets overall behaved as intended during periods of high volatility. Over the course of the crash, >$350M was liquidated across Compound and Aave. (Note: following chart reflects out-of-date liquidation amounts, scale by about a factor of 10 for accurate figures)
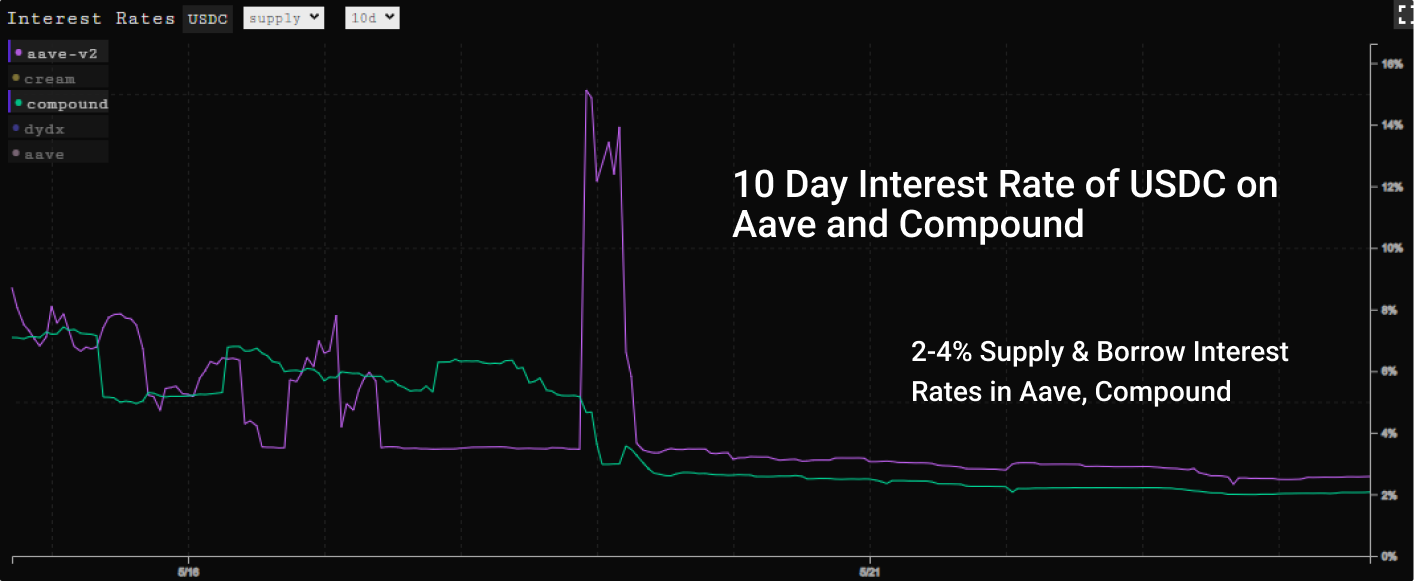
Rates stayed healthy throughout. As lend and borrow roughly stayed correlated the utilization rates stayed similarly healthy. The timeline for most lending markets played out as follows:
- Correction starting on the 16th caused temporary volatility in rates as borrow had brief periods of exceeding optimal utilization rate.
- For a short period on the 19th, utilization (borrow/collateral) pushed past 80% on Aave as price volatility sent health factors lower and interest rates up to >14%.
- Liquidations, collateral posting, and yield chasers brought utilization back to healthy levels, returning interest rates back to their ~3% level for suppliers.
Stablecoin Stability
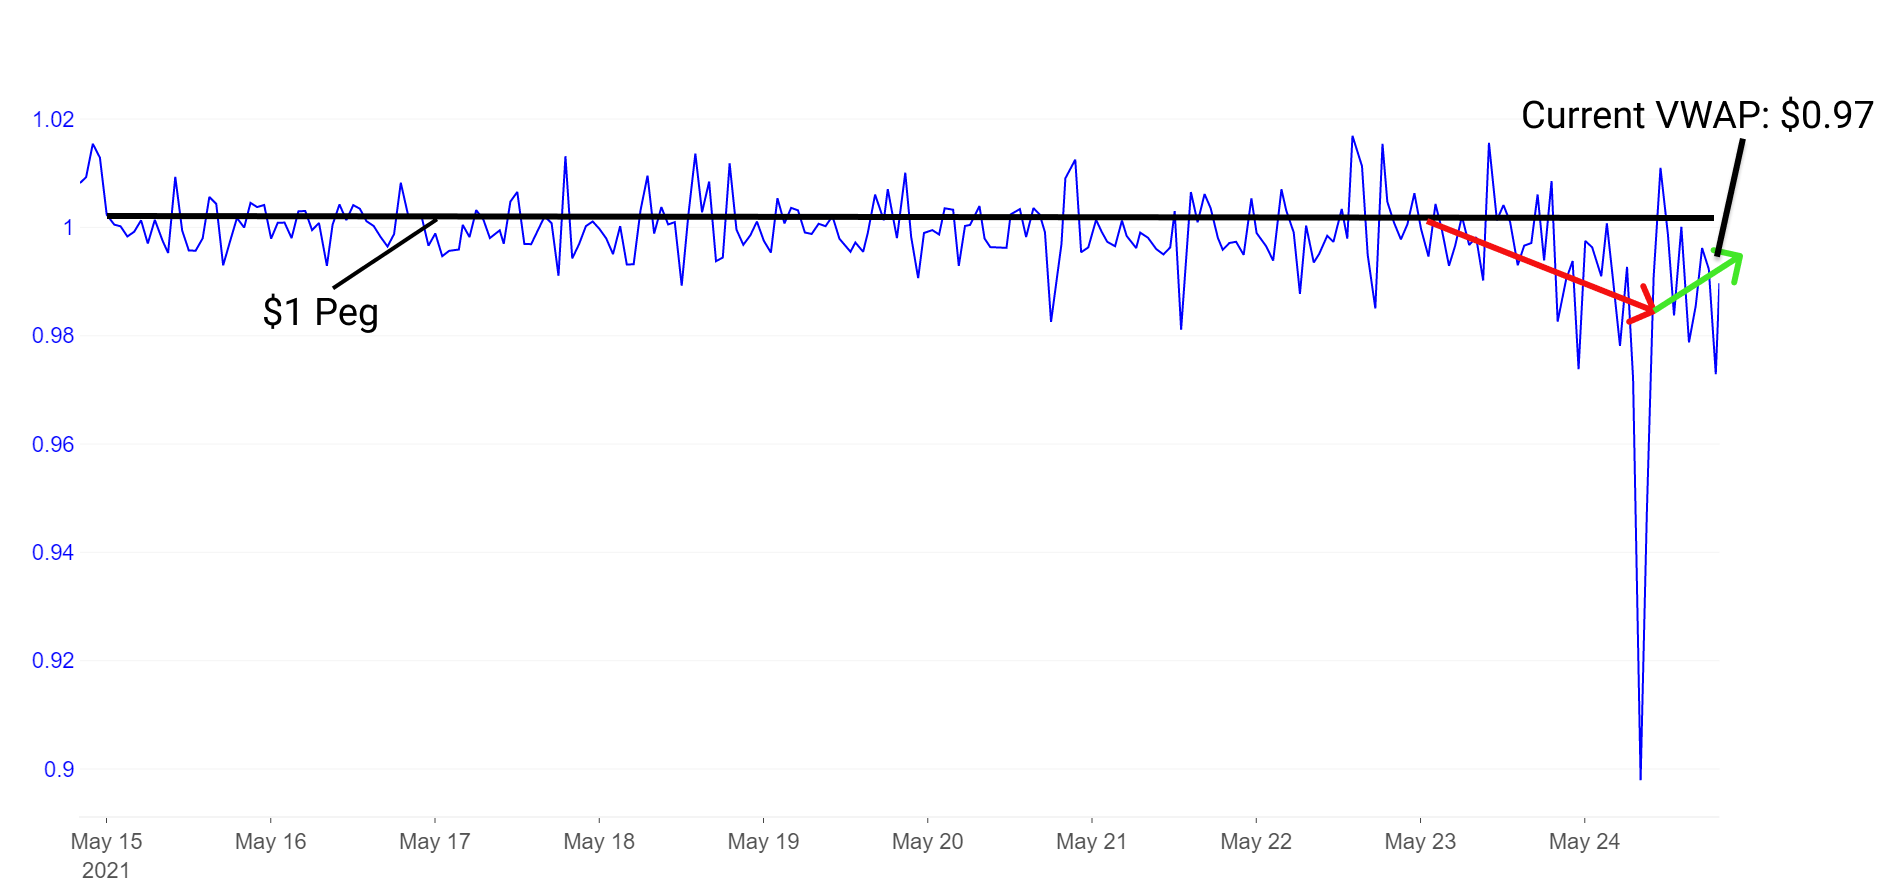
Major stablecoins have healthily maintained their peg throughout the crash. None of the top 3 stablecoins used on Ethereum drastically deviated from their peg for an extended period of time, letting sellers confidently exit as they saw fit to stablecoins. The most drastic USDT/USD spreads on major exchanges were peaks around $1.02 and troughs around $0.99. These wicks only lasted a few seconds to minutes in most cases. Otherwise, stablecoins held their peg for the majority of the crash with volume weighted average prices (VWAP) staying at $1.00 the majority of the time. Contrary to the March 2020 crash, DAI held its peg impressively strong.
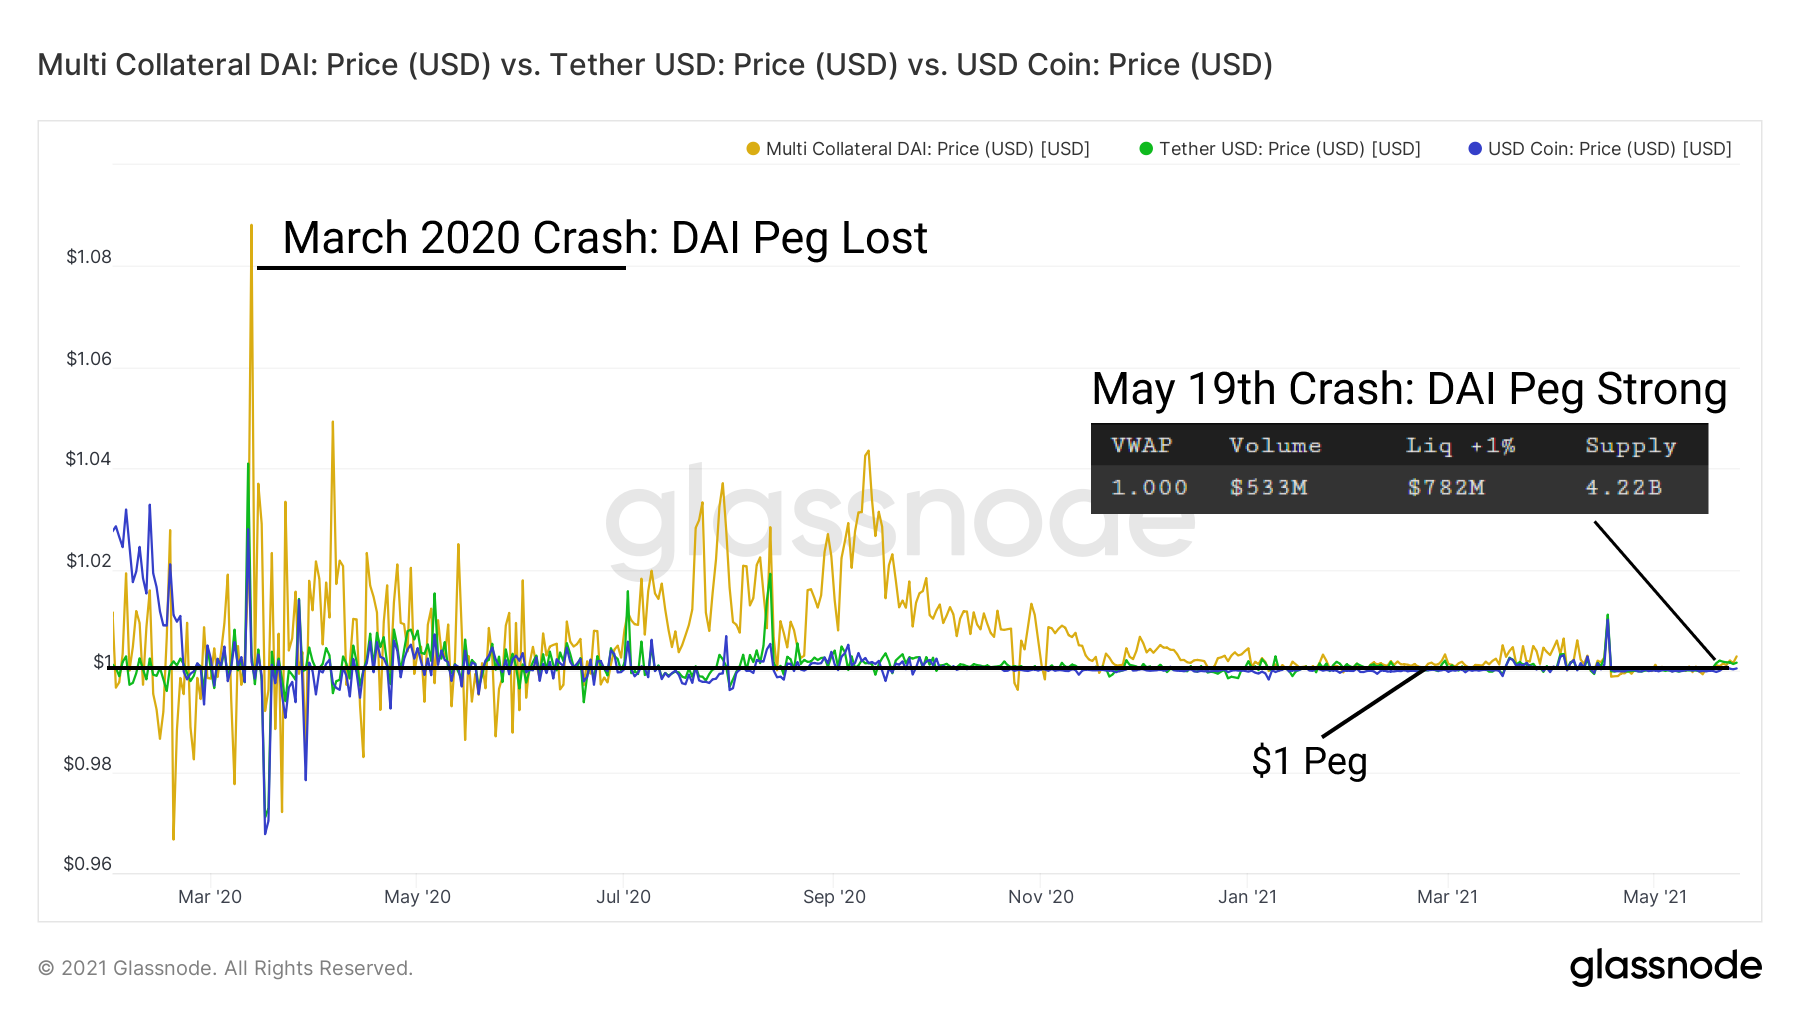
This was especially positive for DeFi because of the performance of DAI during the crash. DAI held its peg well, circulating supply adjusting accordingly in response to collateral requirements and protocol stability. As redemptions were claimed by collateral holders, collateral was reclaimed and DAI removed from supply. This behavior allows collateral to stay healthy, liquidations remain at a healthy level, and DAI maintain its peg.
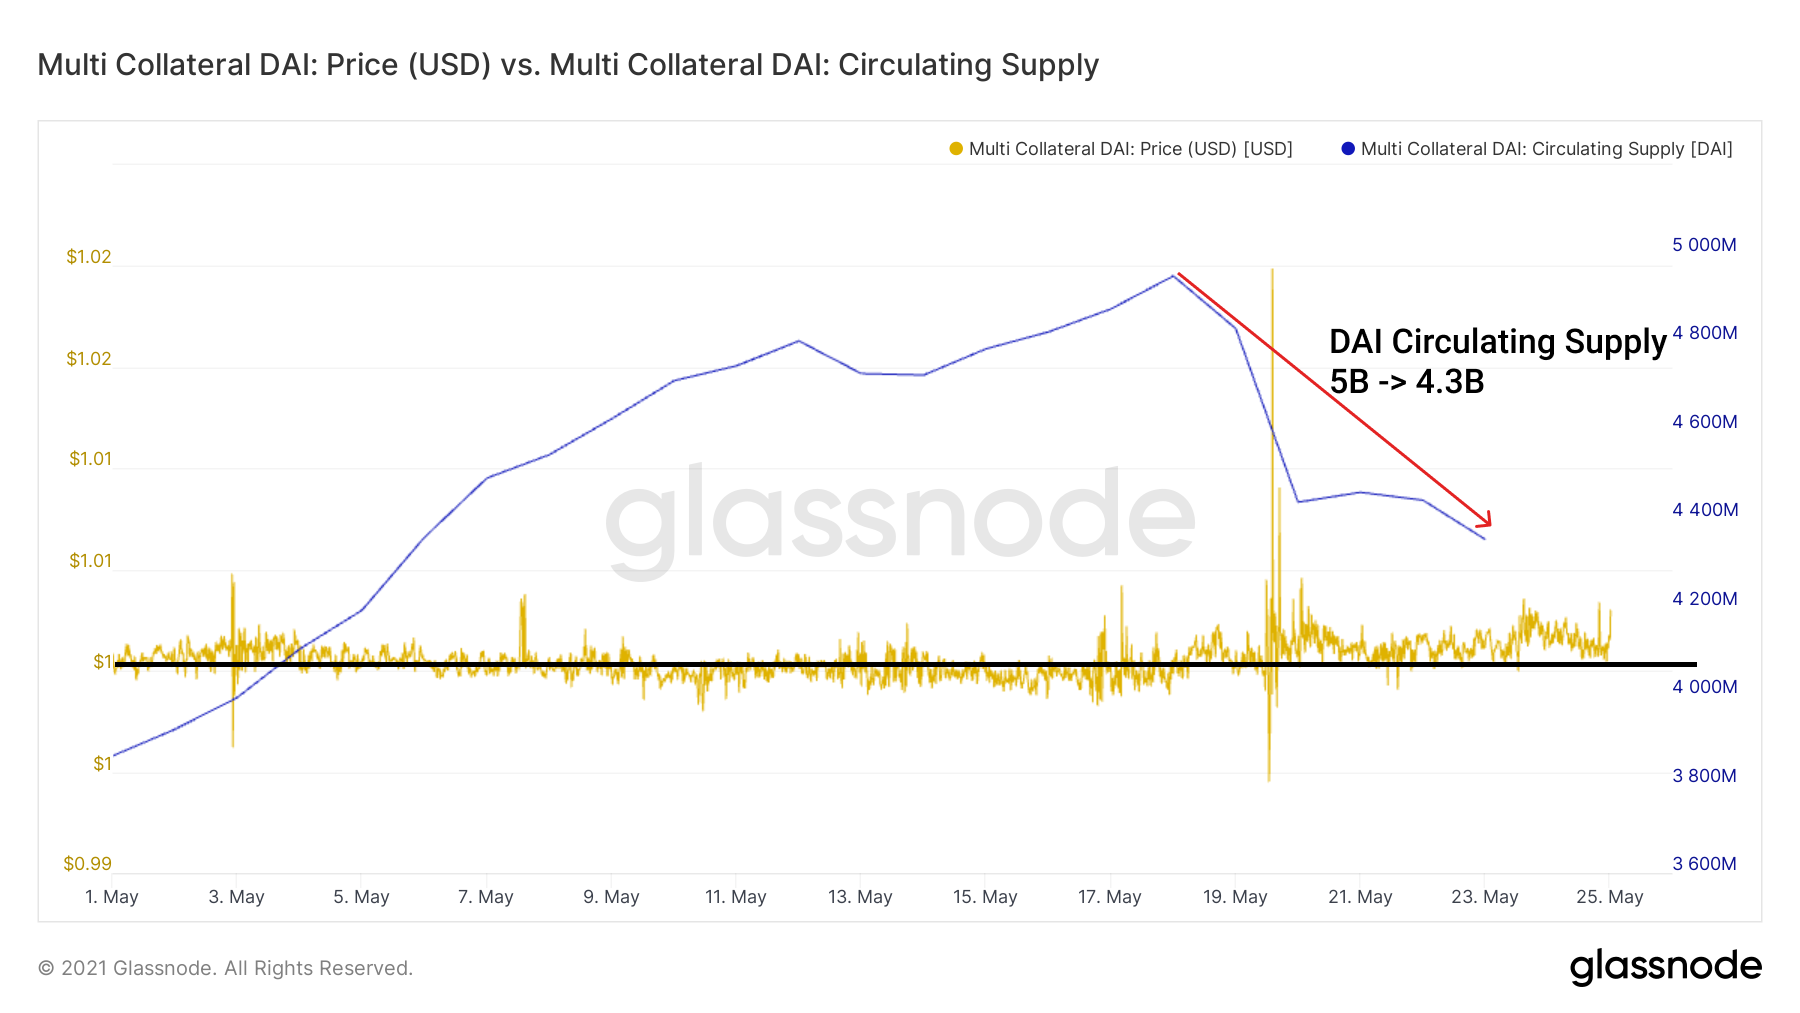
Unfortunately, one stable of relatively strong adoption (~2B circulating supply) failed to maintain its peg. TerraUSD (UST) lost its peg on the 18th as the value of its collateral from LUNA fell below that of the stablecoin it collateralizes. The LUNA/UST ecosystem currently suffers additional risk, partially due its market size. Whereas the DAI/MakerDAO ecosystem commands greater than $8B in ETH collateral for a $5B DAI supply, UST's $2B supply skated close and at times below its roughly $2B in LUNA collateral. Fortunately, loss of peg was not too severe for the duration of the crash.
Loss of peg in UST simultaneously caused unhealthy behavior in its lending market Anchor, positions were more prone to liquidation in the protocol's native lending platform where UST sees large demand. Its peg has largely rebounded since the crash as LUNA's value has pushed back above UST.
All in all, stablecoins performed as intended and pegs were held across the space. Stablecoin transfer volume on-chain reached $52B, record volume of stablecoin transfers.
ETH Performance and Valuation
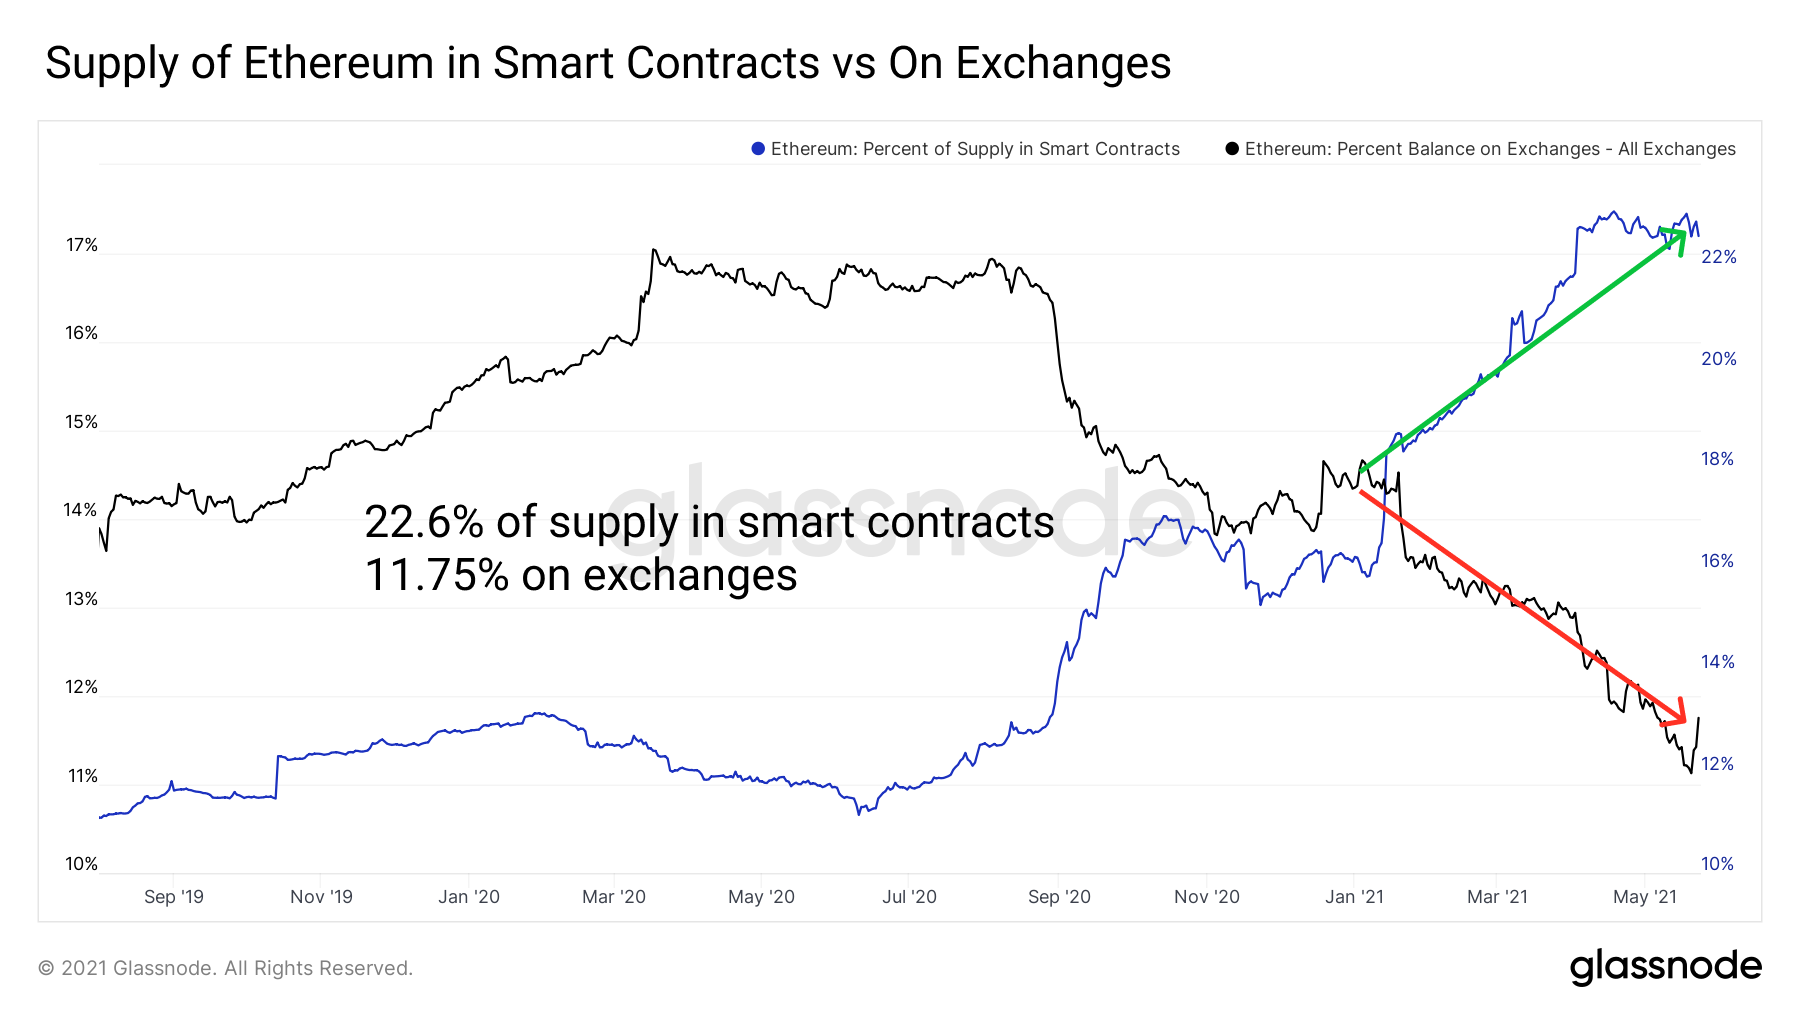
Percentage of Ethereum supply locked in smart contracts has remained very healthy, with 23%+ of the supply remaining in contracts throughout the duration of the selloff. Supply on exchanges jumped from 11.13% to 11.75%.
While we've seen a narrative shift this year in valuing DeFi against the dollar, ETH remains the reserve currency and benchmark of choice. DeFi/ETH has largely underperformed in 2021, with no exception during the crash as some view ETH as a flight to safety. This has expressed itself in ETH's strength against DeFi during the crash. However, this decline expresses itself less sharply among the highest market cap blue chips like UNI, AAVE, and MKR, who post crash have only seen ~6.5% excess market cap weighted dips against ETH.
It is possible that we see a potential decoupling from ETH/DeFi among those blue chips who show increased usage, revenue, and strong incentives amidst token prices in either direction. However, these softened declines among blue chips do not match that of mid-cap DeFi where relative declines are more than 15% larger. And during bearish sentiment correlation almost always creeps higher.
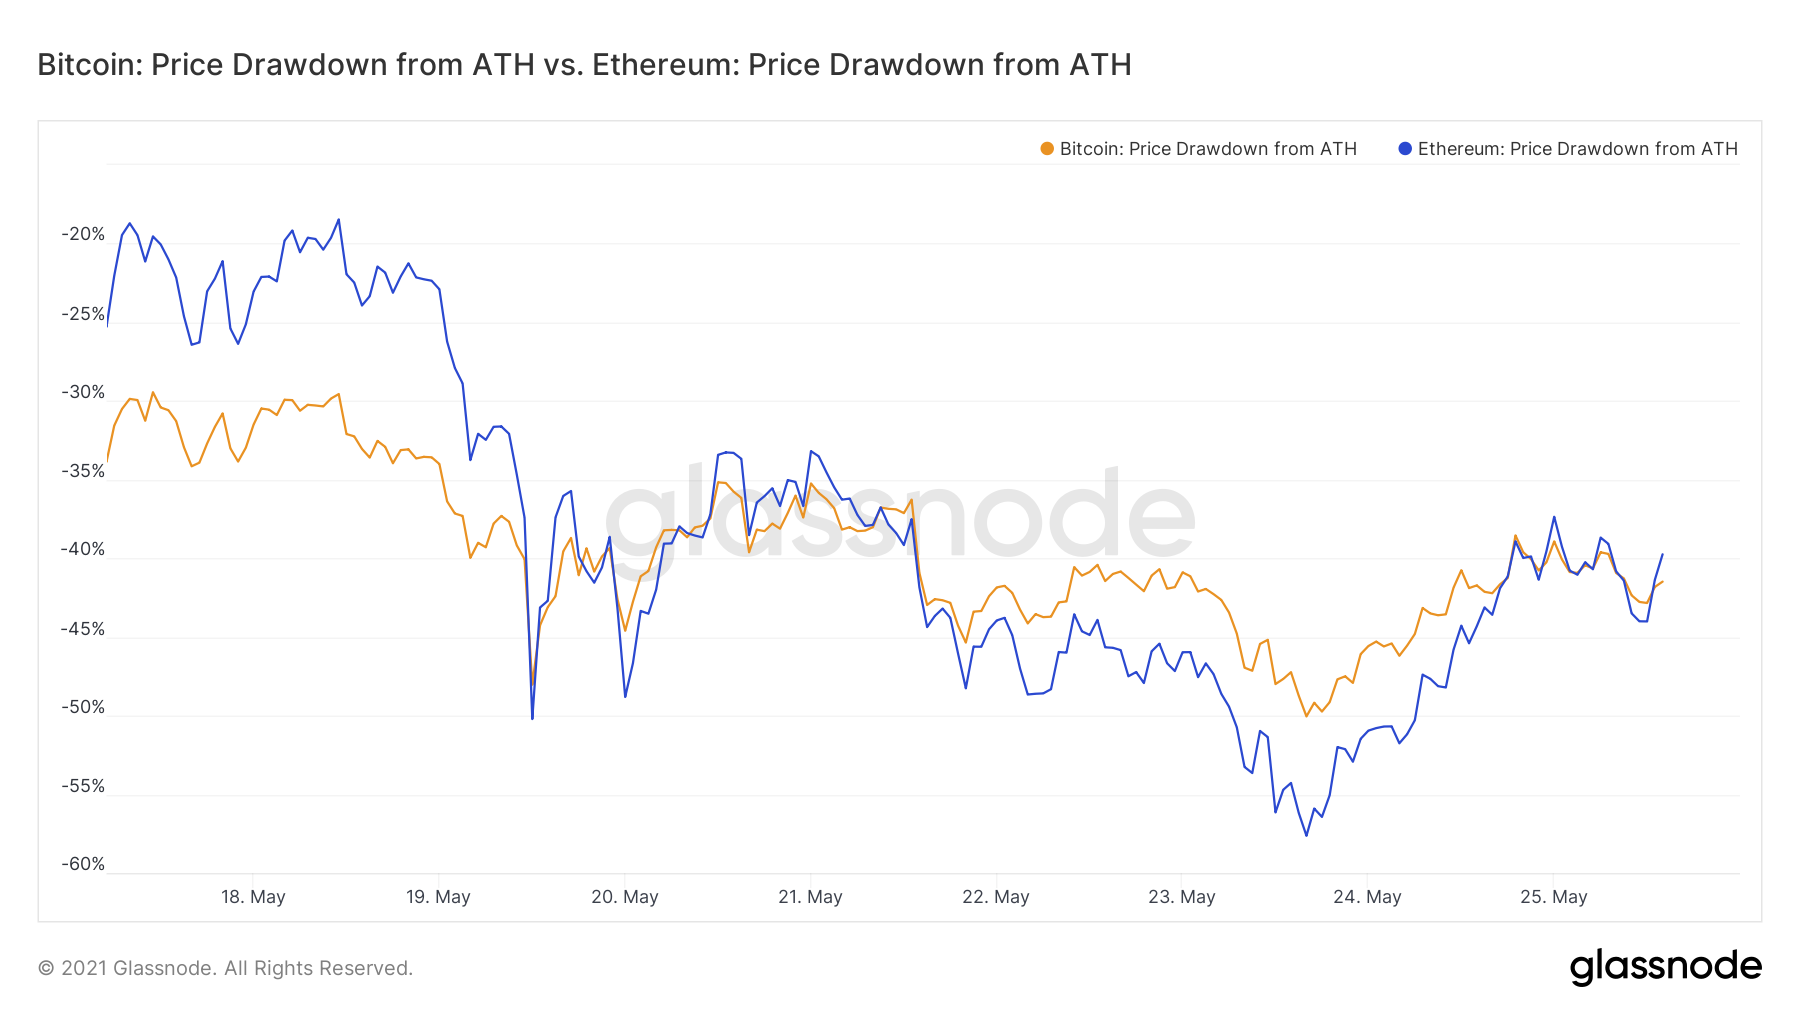
Zooming out, ETH/BTC showed resilience during the dip. In previous crashes risk has traditionally fled out of ETH to BTC, with ETH experiencing significantly larger drawdowns. This time around, the tune changed, with ETH remaining higher beta to BTC, but not by much. As ETH shows resilience to market declines over time vs BTC, it is possible DeFi participants flee to ETH as strength instead of BTC and stablecoins.
Token Performance and Valuations
Blue chip DeFi governance tokens have unsurprisingly sold off, with max drawdowns of 75%+. These are nascent tokens with high Ethereum beta, limited liquidity, and a small numbers of holders. It should be no surprise that broad-based market volatility sends these tokens downward. In recent history an interest in pricing these assets against USD instead of ETH has taken hold.
More and more investors in DeFi are approaching with traditional valuation metrics to understand these assets. Assets owned by the treasury, cash flows returned to holders, and other popular valuation metrics are becoming attractive in recent history, especially when benchmarked against other growth assets.
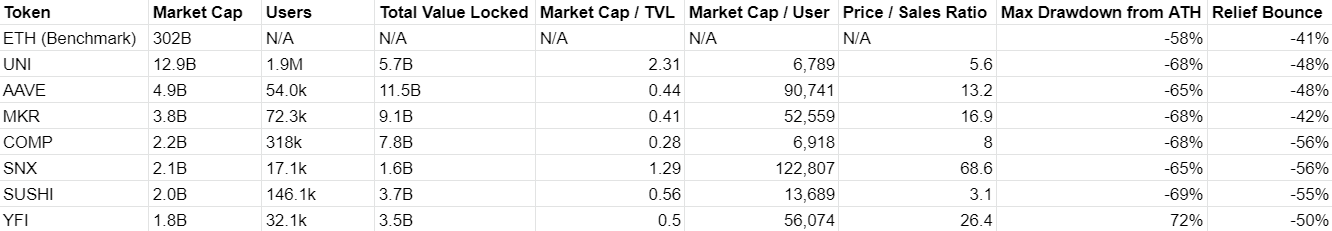
Here we introduce Price / Sales Ratio (P/S Ratio), the measure of token market cap divided by revenue generated by the protocol. It is unclear thus far whether revenues are a driver of token prices this early in DeFi's adoption curve. Willingness to bet on future revenues and narratives is just as strong as existing adoption in many cases. However, projects with the highest usage are quickly trickling to the top and bouncing strong off lows.
We've seen TVL continue to act as a strong driver of price, with the two highest TVL protocols experiencing the softest drawdown from ATH. They also saw the strongest bounce off lows, alongside Uniswap and its dominant user base. Unsurprisingly, these TVLs are mostly correlated with market cap. The larger cap DeFi projects have led during the dip with stronger liquidity lessening the blow.
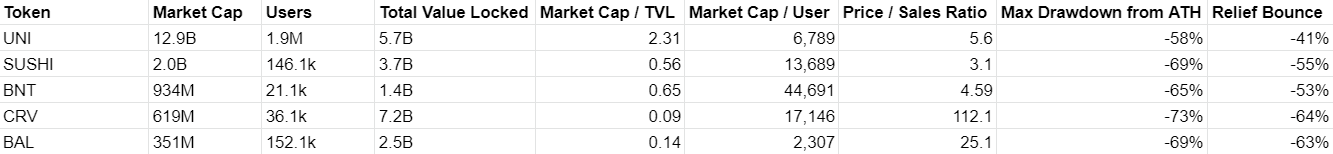
When grouping these tokens by protocol type, we see interesting trends occur as we compare relevant metrics. In the following chart we dig deeper into smaller cap assets in DeFi against our blue chips by protocol. We see how dominant Uniswap remains despite its persistent limited incentives and use for the governance token. As Uniswap v3 flips v2, the trend only grows stronger. UNI and SUSHI's clear dominance has lent to softer drawdowns and stronger relief. Bancor has additionally shown strength among heightened revenue and a healthier price to sales. While Curve's market cap appears small, it's FDV exceeds $5.5B.
In lending we get an interesting story when viewing baseline valuation metrics. Compound's valuation appears low, especially relative to Aave. We see TVL continuing to inflate on Aave above its competitors, largely due to new incentives and acting as a popular hub for alternate forms of collateral. Especially during crashes, diversification of collateral can be healthy for preventing liquidation. For example, Aave keeps about $200M in xSushi locked, $500M in LINK, and more than a dozen other non-standard assets boast >$5M locked as collateral. That said, Compound boasts a healthy lending market with steady rates and strong reward incentives.

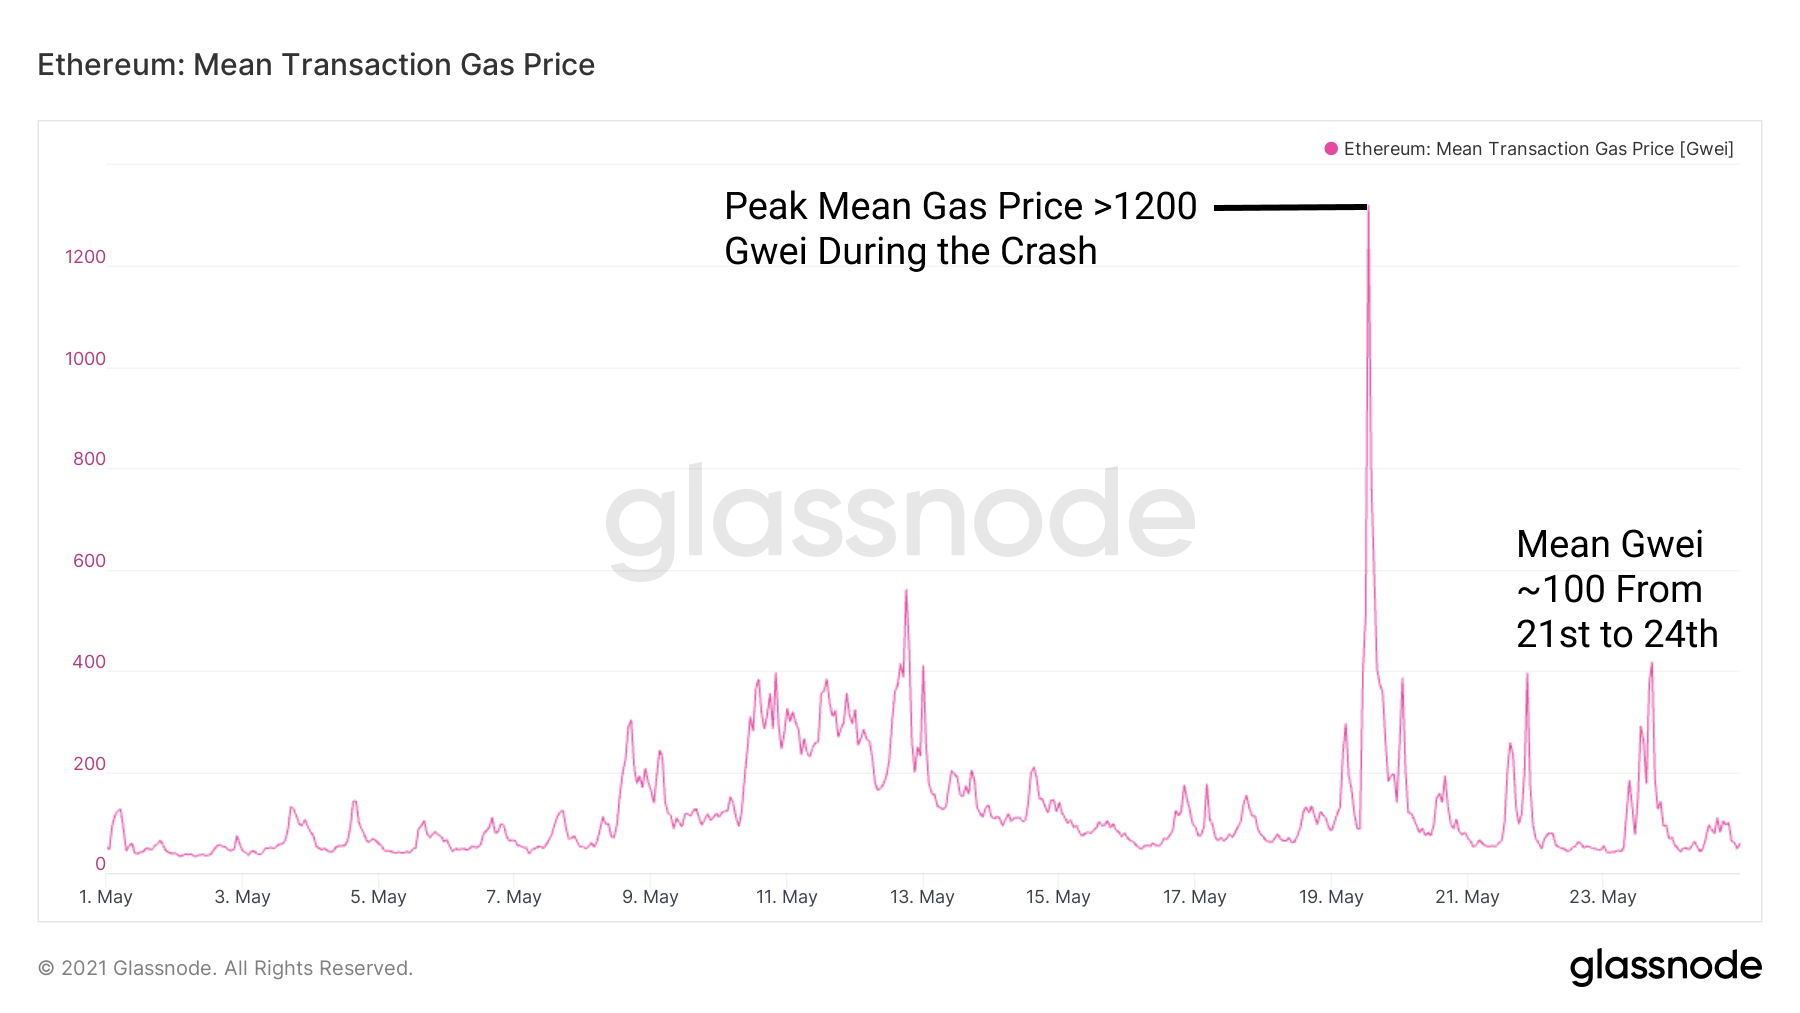
Gas Pricing Out Retail
Retail traders have been largely priced out during the hours of steepest dips. Gas prices skyrocketed during peak volatility to 1000+ hourly mean Gwei as high volume traders, stablecoin transfers, and arbitrage bots dominated gas consumption.
Interestingly, the pricing out of retail was seen through a steep drop in total number of trades but dramatic increase in total volume. Many were forced to sit on their hands, for better or for worse. If a trader wants to offload $3,000 in risk but gas prices are >$700/swap, it's unsurprising they choose against making the trade. For larger traders, $700/swap is relatively easy to stomach if the position sizes are 100x or greater the size of fees. As the crash ensued, volumes went way up as larger holders moved risk. Total transactions fell as smaller traders were priced out of taking any actions on-chain.
So while transaction volume on Uniswap was high, cumulative transaction volume on Uniswap over the course of the crash was not above the 30 day mean transaction volume. Instead, activity from USDT transfers, USDC transfers, arbitrage bots, and other urgent activities during massive price swings dominated block space.
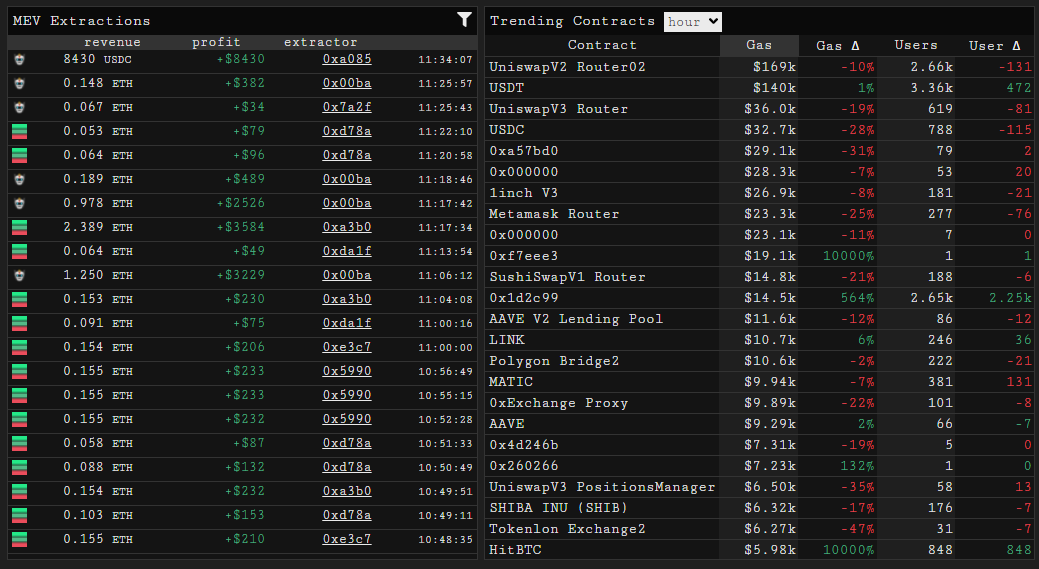
In the chart on the left below we see an hour of activities from MEV bots extracting value from the network through various means. In the chart on the right below we see the smart contracts which were contributing the most to gas consumption during an hour long period during the crash.
- Uniswap V2 remained the clear leader in gas consumption.
- Stablecoin transfers came within striking distance of passing Uniswap for gas consumption. USDT and USDC were urgently being sent exchange to wallet to exchange to allocate funds.
- Anonymous accounts with large volumes were busy performing arbitrage activities like liquidations.
A few days after the crash, gas prices have since fallen considerably. Gas consumption from stable transfers has fallen by >60%, Uniswap gas consumption has fallen about 50% from the peak, and opportunities for arbitrage have mostly returned to normal levels since the crash. Peak mean Gwei of 1200 put cost to transact in excess of $500/swap throughout the crash. At <75 mean Gwei, smaller traders can now rebalance as they see fit.
Concluding Remarks
DeFi was hit with one its first major price and liquidity tests since growing TVL and users to $100B+ and 2m+ respectively. Positive indicators of continued growth of DeFi include:
- Strong revenue from trading fees and peak volume on DEXs
- Healthy lending markets with high collateral, relatively low volatility interest rates, and high utilization among stablecoins
- Stablecoins maintaining their peg and continuing to grow in usage
- Blue chip resilience vs ETH and ETH's resilience vs BTC
The biggest warning sign going forward would be a decrease in usage and a corresponding dip in revenue from protocol fees. We've seen no such event thus far as heightened liquidity has increased usage and fees. Dips in usage could cause liquidity to dry up as TVL/revenue increases and returns are purely driven by token inflation. Loss of liquidity worsens the user experience, creating a reflexive effect of even lower users, lower revenue, and more exit of liquidity. For now, growth remains strong and usage of DeFi propels to new heights.

- Follow us and reach out on Twitter
- Join our Telegram channel
- For on–chain metrics and activity graphs, visit Glassnode Studio
- For automated alerts on core on–chain metrics and activity on exchanges, visit our Glassnode Alerts Twitter