Finance Bridge: Edition #1
Finance Bridge aids institutional investors in understanding the dynamics of the cryptocurrency market and empowers them to make informed decisions that drive alpha. This issue explores Bitcoin's Market Momentum, unveils key Risk Vectors, and demystifies the concept of 'Payload' in onchain analysis.


Your gateway to successful crypto investing guided by data and research
Overview
- Market Momentum: Indicators highlight the market has likely moved beyond a bottom formation phase and that recovery is well underway in spite of occasional price fluctuations. Notably, the shifting dynamics among Bitcoin holders after a major market event late last year suggest new entrants might find potential opportunities ahead.
- Risk Vectors: The upcoming Mt. Gox Bitcoin distributions and the movements of US Government-held Bitcoin could emerge as significant catalysts for market volatility. Glassnode's dedicated charts - Mt. Gox Trustee BTC Balance and US Government BTC Balance - offer real-time tracking for risk mitigation and strategic positioning.
- On-Chain Basics: Payload refers to the actual value of transactions being moved on the Bitcoin network. Tracking this metric allows investors to gauge the true adoption and usage of Bitcoin. Glassnode's Dashboards such as Spending Dynamics, Realized Profit and Loss, and On-Chain Activity can help understand and utilise payload for informed investment decisions.
At Glassnode, we believe that every data point on the blockchain tells a story of individual human choices. Decoding the complex narrative of these choices is crucial for driving alpha in a market as dynamic as the cryptocurrency ecosystem.
Glassnode's diverse analytics suite helps transform raw data into actionable insights for trading, investing, risk management, and more. In this inaugural edition of the Finance Bridge newsletter, we dissect three timely crypto topics, providing our institutional readers with a clear, data-driven perspective that can inform their market strategies in the weeks to come.
Each of the newsletter's three sections focuses on one distinct aspect of the crypto landscape, allowing our readers to explore specific areas of interest. Let's delve into these topics and see how Glassnode can offer a clear lens for understanding complex market scenarios.
Market Momentum
Since the beginning of the year, Bitcoin has proven its resilience amidst economic uncertainties, gaining an impressive 65% year-to-date. This significant uptrend has reignited widespread interest in the cryptocurrency market.
However, since the beginning of the second quarter, we have observed a more complex pattern. A clear uptrend has given way to a sideways, more indecisive price action. This shift prompts us to investigate deeper: Are Bitcoin's gains sustainable? Are we in the midst of a fleeting bear market rally, or are these the early stages of a more robust recovery and potentially a new bull market?
To find answers to these critical questions, we need to consider the underlying factors contributing to the market dynamics. Our investigation will focus on three main areas:
- spotting signals that indicate a market bottom,
- the shifting landscape of Bitcoin holder profiles, and
- key takeaways from Glassnode's recovery indicators.
Signs of a Bottom
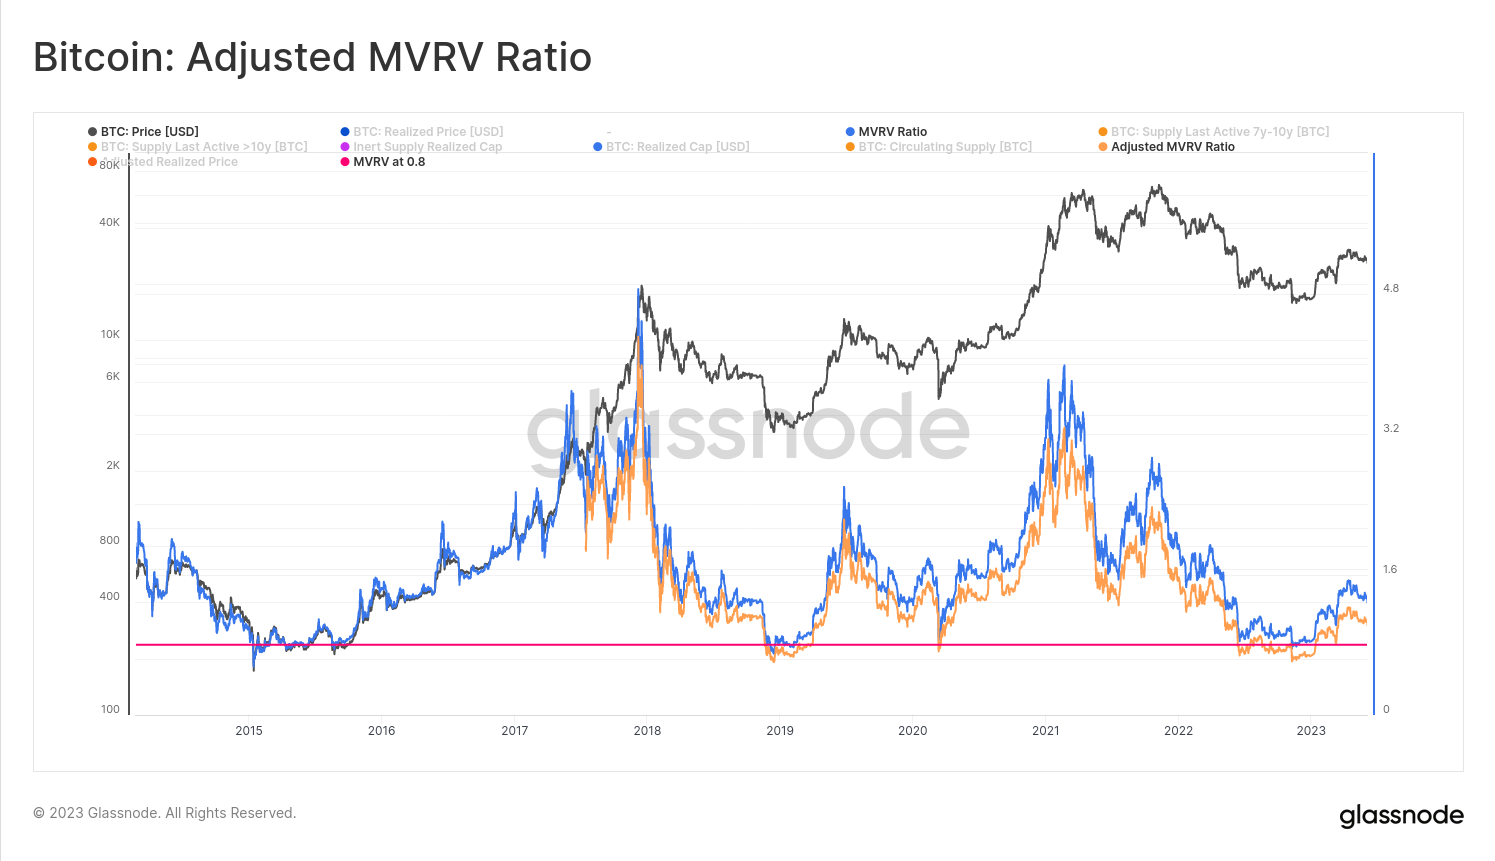
The final months of last year witnessed significant shifts in Bitcoin's on-chain data landscape, especially following the FTX market crash in November. This period saw a dramatic realization of losses, suggestive of a widespread capitulation event. The Adjusted MVRV Ratio, a measure of the active market's unrealised loss, plunged to a historic low, only comparable to previous market bottoms in December 2018 and January 2015.
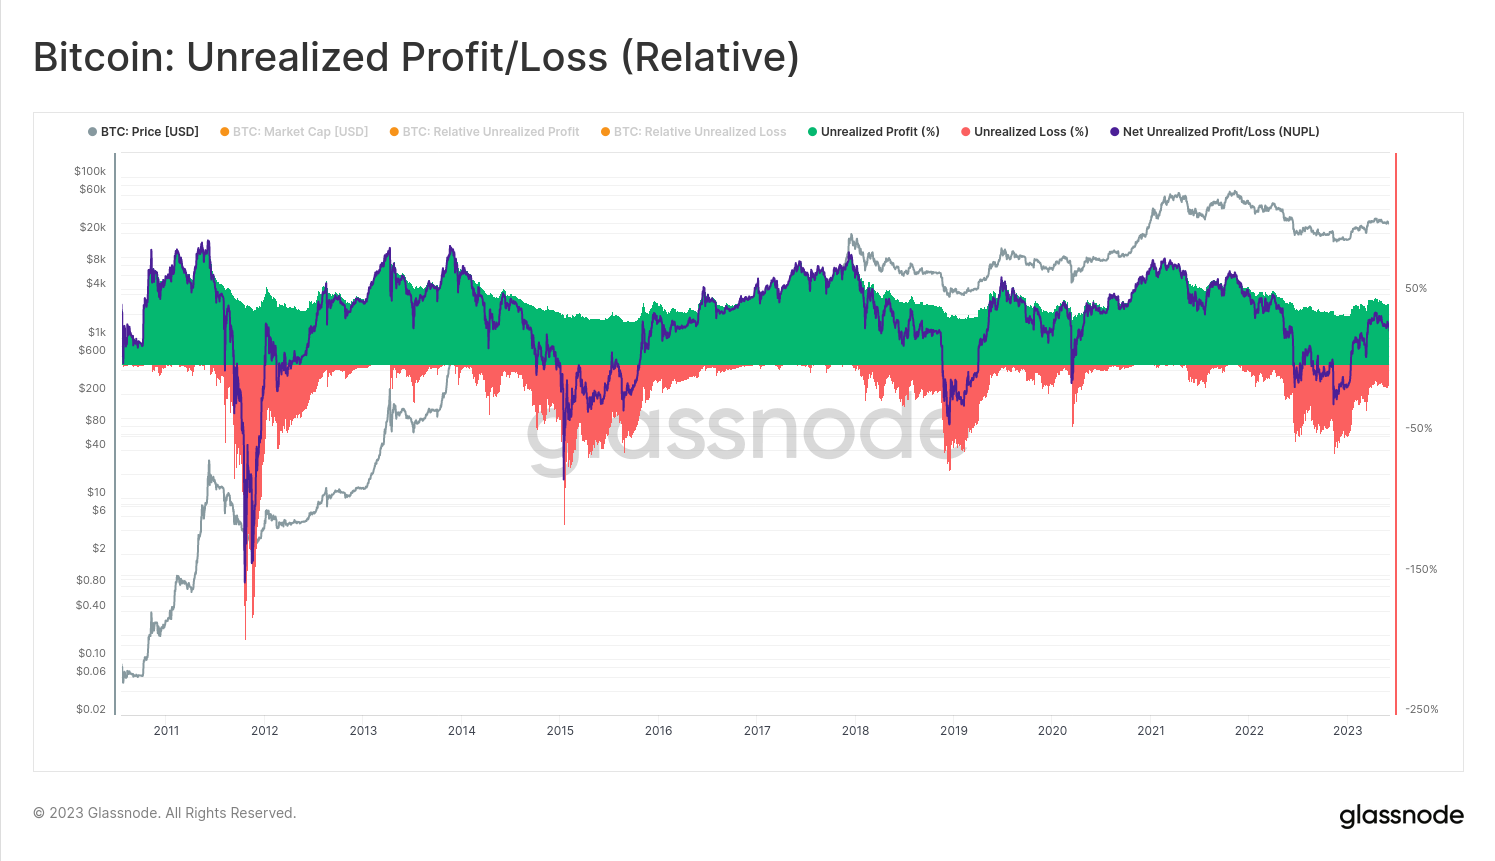
In addition, the Relative Unrealised Loss, which assesses the aggregate loss compared to total market capitalization, peaked at 56%. This value is akin to those observed at previous bear market lows. All these on-chain indicators together suggest that the FTX crash last November likely marked the market bottom.
Shifting Holder Profiles
Such a conclusion can also be reached by looking at the shifting profiles of different holder cohorts. The dynamics of long-term and short-term Bitcoin holders reflect the phases of the market cycle and reveal significant shifts in investor sentiment. While long-term holders, defined as those holding their coins for over 155 days, are often seen as high-conviction investors during bull markets, this cohort takes on a different profile during bear cycles. During bull phases, these "smart money" investors are likely to realise profits as the value of their assets increases. On the other hand, short-term holders typically represent traders and speculators, tracking Bitcoin's price closely.
As the market approaches its peak, we witness a changing of hands, with long-term holders distributing their coins to a new wave of investors. If the market falls post-peak, these new investors often hold onto their coins, becoming the new long-term holders, not out of conviction but in hopes of a price rebound.
However, there is only so much financial stress that these underwater investors can handle. At one point, these new long-term holders reach a “pain threshold”. This is the point at which market losses become unbearable, pushing them to sell their holdings. When this threshold is reached, a large part of the market capitulates and starts rapidly selling off their assets.
This is the moment when the 'smart money' - experienced investors or traders - step in. They seize the opportunity to acquire assets at attractive, reduced prices, thus becoming the new short-term holders. This large-scale transfer of assets typically marks a market-wide capitulation event, which has historically indicated the bottom of the market.
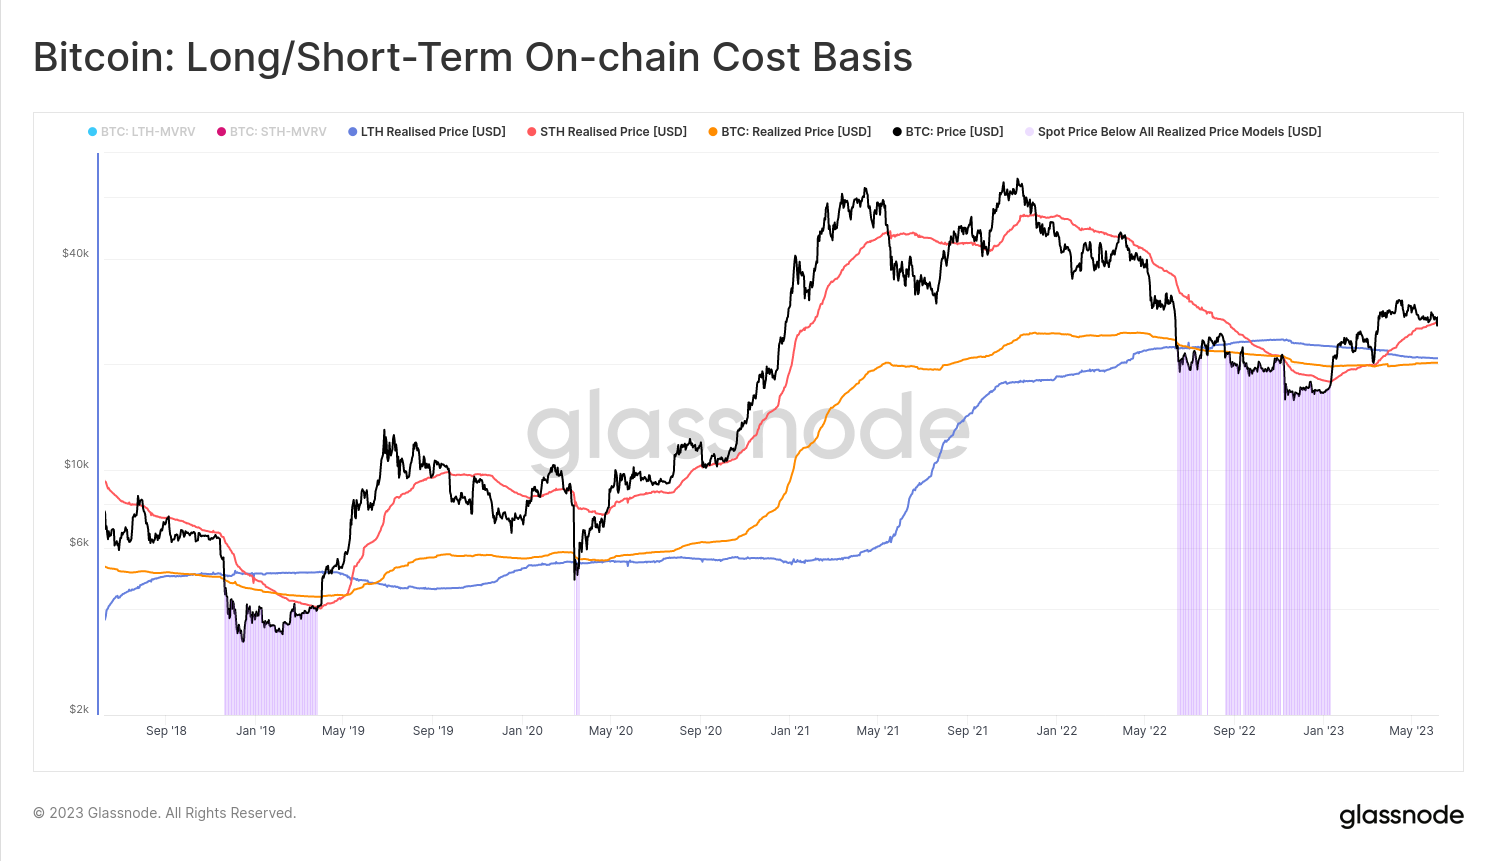
In the wake of such an event, the cost basis, or average price at which coins were acquired, of long-term and short-term holders begins to converge. This convergence suggests the formation of a homogeneous market, where both holder types are entering at similar price points, implying a reset in the market with new high-conviction investors entering the space. This shift in holder profiles, in tandem with the convergence of cost basis, provides a strong foundation for the next market cycle.
This is precisely the kind of dynamic that we have been observing since the FTX crash in November of last year. That was the moment of a market-wide capitulation where we saw the changing of hands between underwater long-term holders and new buyers with strong conviction in Bitcoin. In the chart above, that dynamic is marked by the rising cost and ultimate convergence of both the short-term and long-term holder (STH & LTH) realised price.
This shift in holder behaviour corresponded with significant changes in net unrealised profit and loss (NUPL). NUPL, a tool used to measure the level of profit or loss held by investors across the coin supply, showcased a substantial rise in the overall profitability of Bitcoin holdings post the November capitulation event. This suggested a market-wide transfer of coins from those who had capitulated and sold at a loss to new market entrants who were seeing their coins move into profit territory as the price rebounded.
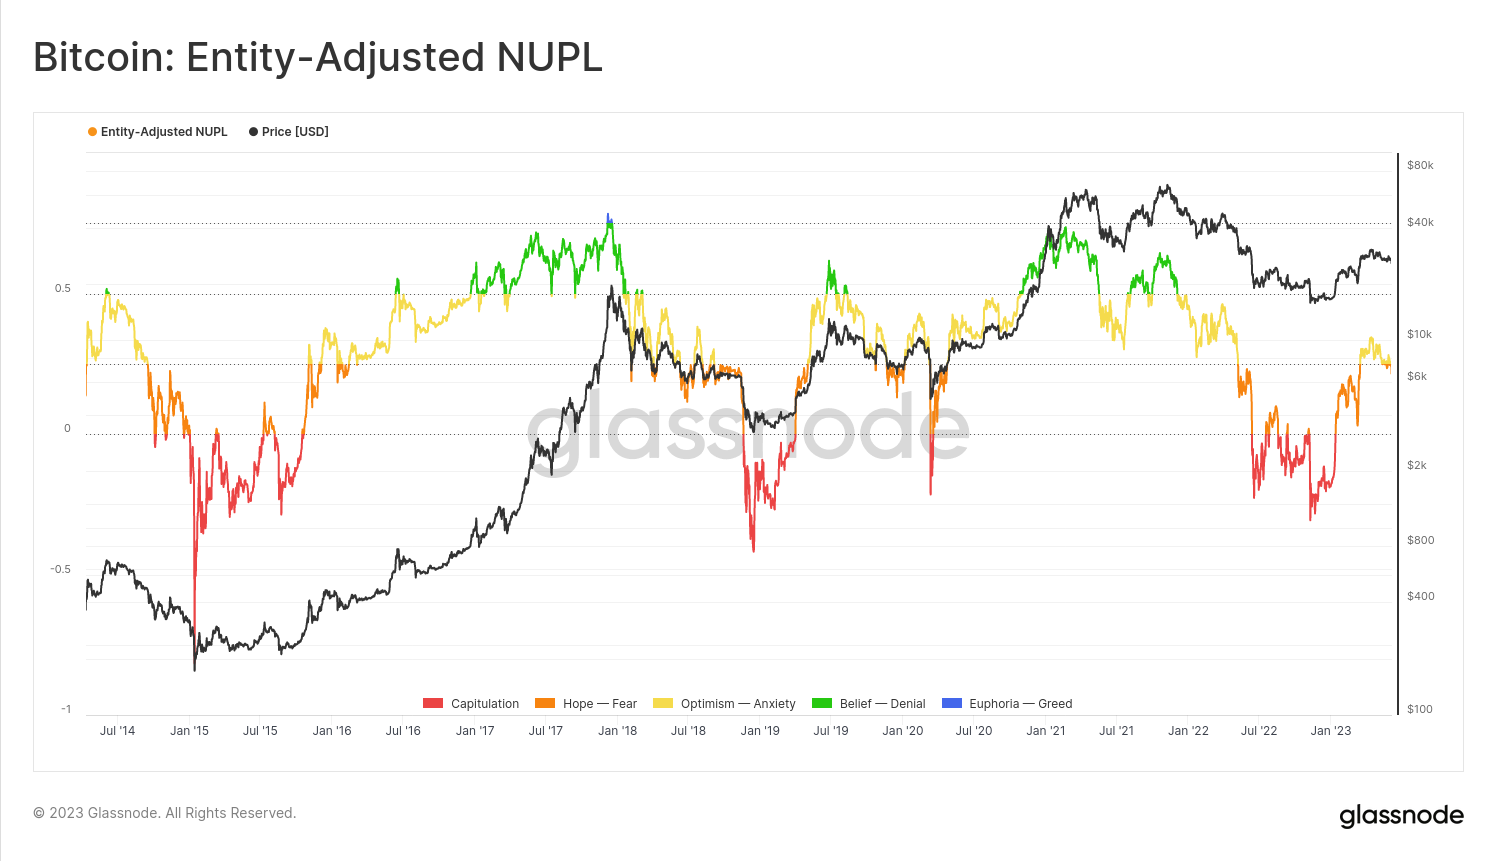
These two metrics - Long/Short-Term Holders Cost Basis and NUPL - allow us to conclude that, as of this writing, we're seeing indications that we’re past the market bottom for the cycle and in the early stages of recovery. This could suggest a time of opportunity. The new entrants into the market may now position themselves to benefit from the next potential uptrend. While the market bottom could be retested, Glassnode’s price tools can help to further corroborate the thesis of a recovery for the Bitcoin market.
A Case for a Recovery
Below, you can see a complex chart that can be found on Glassnode's Recovering from a Bitcoin Bear Dashboard. While holder dynamics and loss realization indicators can help identify a potential market bottom, the Dashboard can help gauge whether a market turnaround is underway. By examining four major on-chain data categories, this sophisticated tool can offer essential insights into Bitcoin's market recovery post-FTX crash.
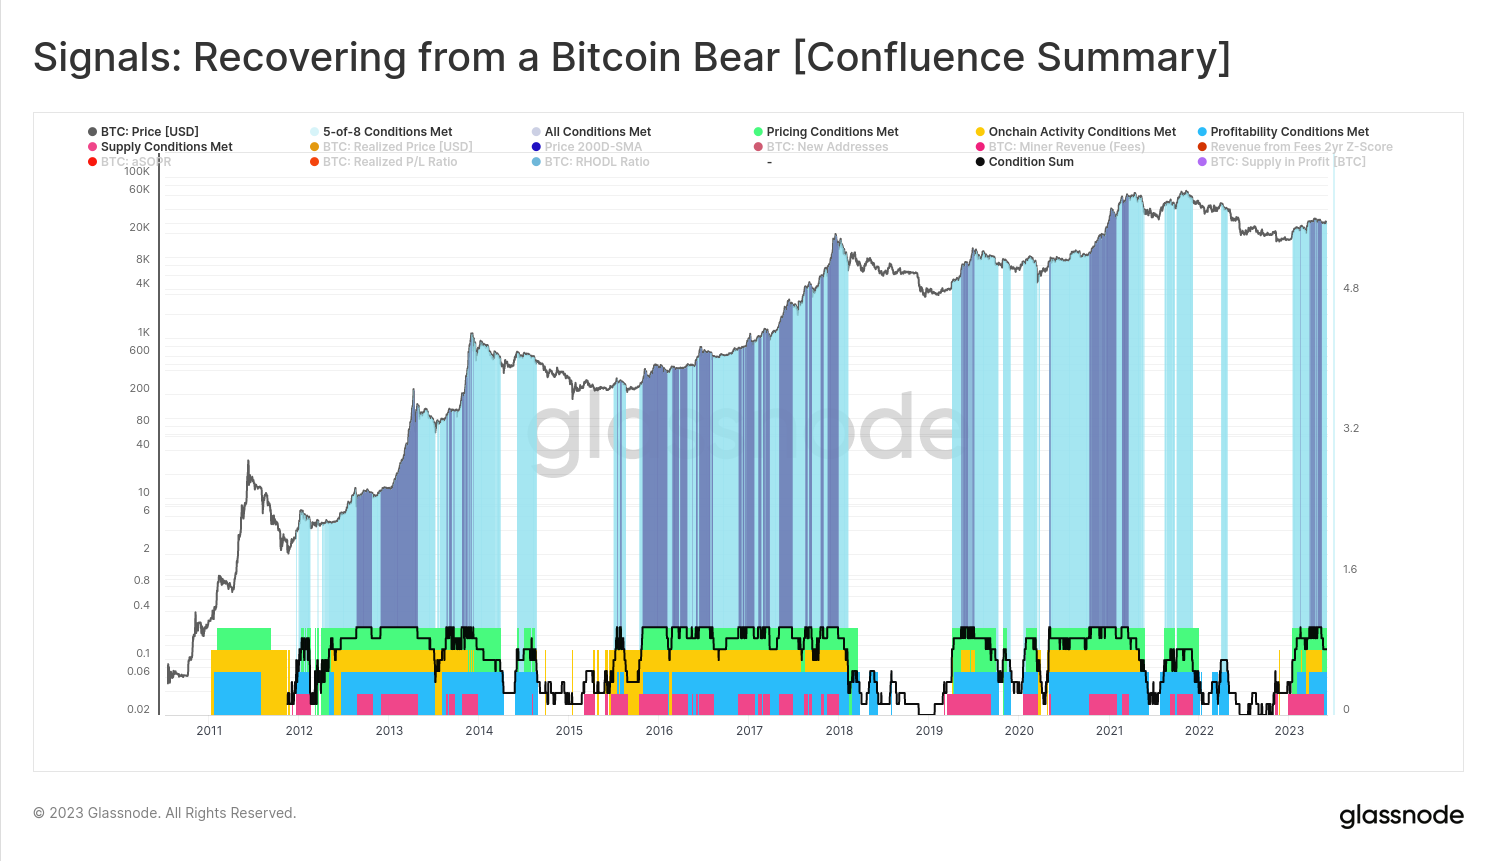
Category one involves spot prices exceeding key pricing models like the realised price and 200-day average. Trading above these levels, marked green on the Dashboard, signals a potentially bullish trend.
Second, the Dashboard monitors network utilization, assessing user base growth and transaction volume, visualised in yellow. Growing utilization is indicative of a thriving Bitcoin ecosystem.
Thirdly, the Dashboard tracks market profitability, appearing as blue when profits begin to emerge. This indicator reveals improved market sentiment and a possible end to the bearish phase.
Finally, the tool monitors wealth accumulation by long-term holders or 'HODLers', highlighted in red. A shift from bear market lows to profitability implies that committed investors are seeing their patience pay off.
The Dashboard tracks eight indicators across these four categories. When five out of eight criteria are met, it turns light blue, implying a substantial recovery. Currently, all eight indicators are triggered, suggesting a robust recovery despite price volatility, making a strong case that the market is on a recovery trajectory.
Key Takeaways
As we look at recent weeks, the Bitcoin market has entered a more indecisive phase, oscillating between gains and losses. This transitional phase prompts us to revisit the pressing questions we initially posed: Are Bitcoin's gains sustainable? Are we in the midst of a fleeting bear market rally, or are these the early stages of a more robust recovery and potentially a new bull market?
An analysis of the on-chain data offers a compelling response. The shifting profiles of Bitcoin holders, the alignment of their cost basis, and the overall increase in the net unrealised profit and loss signal a more resilient market. The strong network utilization and balance of wealth leaning towards long-term holders, as evidenced by the Recovering from a Bitcoin Bear Dashboard, indicate sustainable gains rather than transient spikes.
The recent sideways price action, in this light, appears to be more of a consolidation phase in a broader recovery narrative, rather than a precursor to another bear market. The accumulation patterns among long-term holders and new entrants' profitability suggest that the current market is laying the groundwork for a more sustained upward trend.
These insights, derived from on-chain data, do not guarantee a certain future but provide a data-driven foundation for our market understanding. As we navigate the complexities of the crypto landscape, these indicators will continue to play a critical role in discerning market patterns and making informed predictions.
Risk Vectors
In the volatile crypto investment landscape, proactively managing risk is even more critical than in traditional markets. With its robust analytics suite, Glassnode empowers investors to keep a real-time pulse on such risk vectors. This month, we bring into sharp focus two significant elements that could influence the Bitcoin market dynamics as soon as the next quarter: The upcoming Mt. Gox Bitcoin distributions and the movement of US Government-held Bitcoin.
Understanding the Mt. Gox Situation
Mt. Gox, the once-dominant Bitcoin exchange, became infamous in 2014 when a devastating hack led to the loss of an estimated 650,000 to 850,000 Bitcoins. The aftermath saw a protracted legal battle that concluded in 2021 with a rehabilitation plan agreement. The plan placed a trustee, Nobuaki Kobayashi, in charge of 141,686 BTC remaining in Mt. Gox's possession.
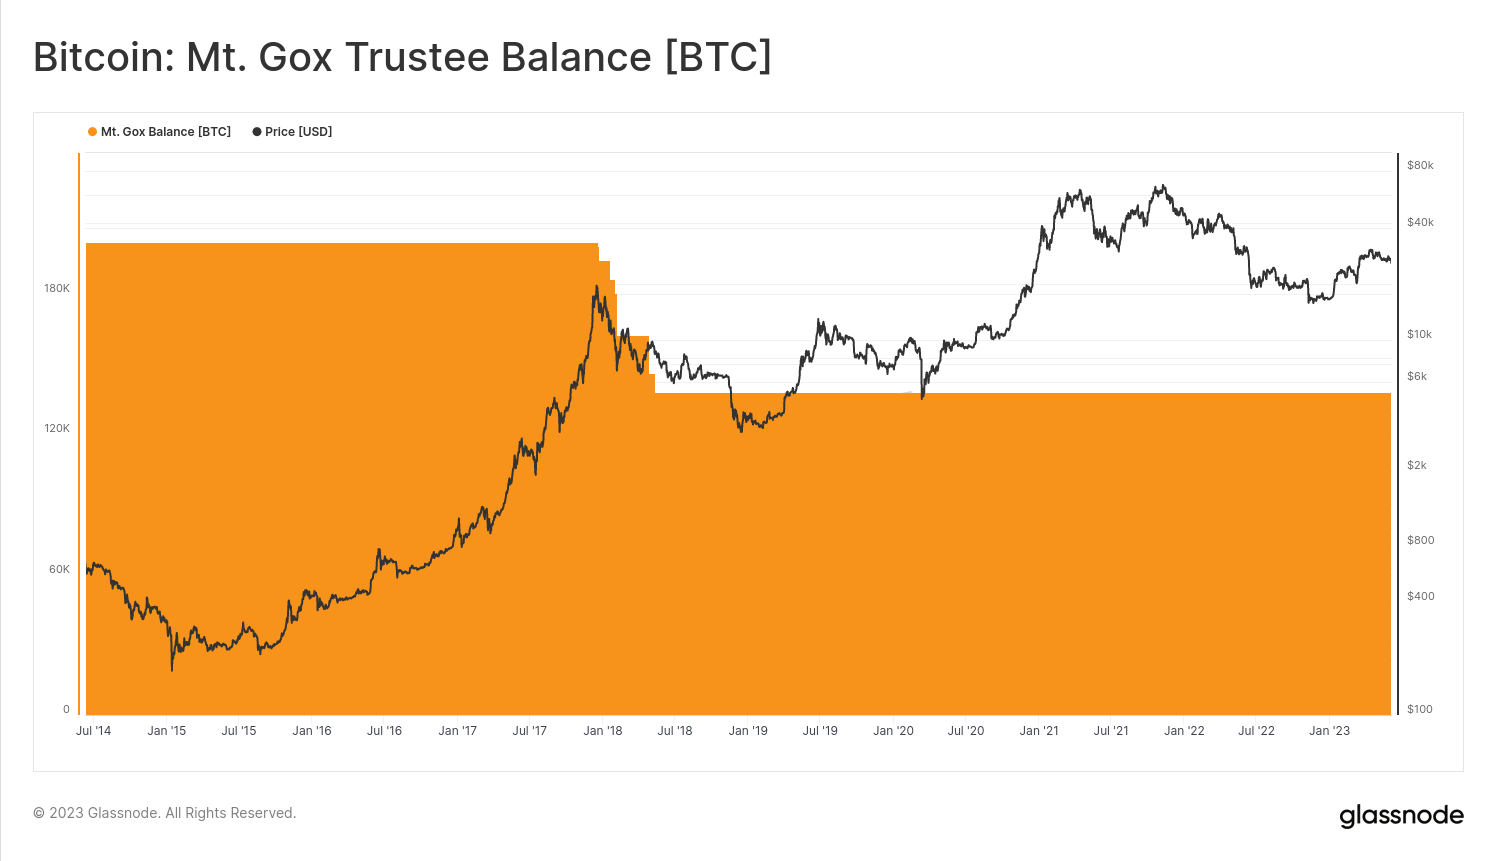
These assets are now slated for distribution to claim holders later this year, but the specifics of these distributions remain clouded in uncertainty. Questions abound, such as where will this Bitcoin be sent, and whether will creditors rush to liquidate them?
Staying on top of such volatile situations requires more than just reactive strategies—it calls for proactive planning. Glassnode facilitates this with the Mt. Gox Trustee Balance chart that tracks the BTC held in addresses controlled by Nobuaki Kobayashi. With updates as frequently as every 10 minutes, the chart allows investors to track the movement of Mt. Gox’s Bitcoin in near-real time.
Investors can also set custom alerts to be notified of any decrease in the Mt. Gox BTC balance, a potential signal that distributions have begun. Furthermore, Glassnode offers API access to these charts, enabling the integration of this data into automated trading and risk management strategies.
A Close Eye on the US Government Bitcoin
The US Government's involvement in Bitcoin holdings is a result of seizures from various criminal activities. Some of these seizures include the funds from the 2016 Bitfinex Hack and the 2012 Silk Road Hack. As of now, the government holds a significant amount of 205K Bitcoin, which represents about 6% of the current liquid supply. Recently, around 9,800 BTC were transferred to Coinbase, stirring speculations of an upcoming auction.
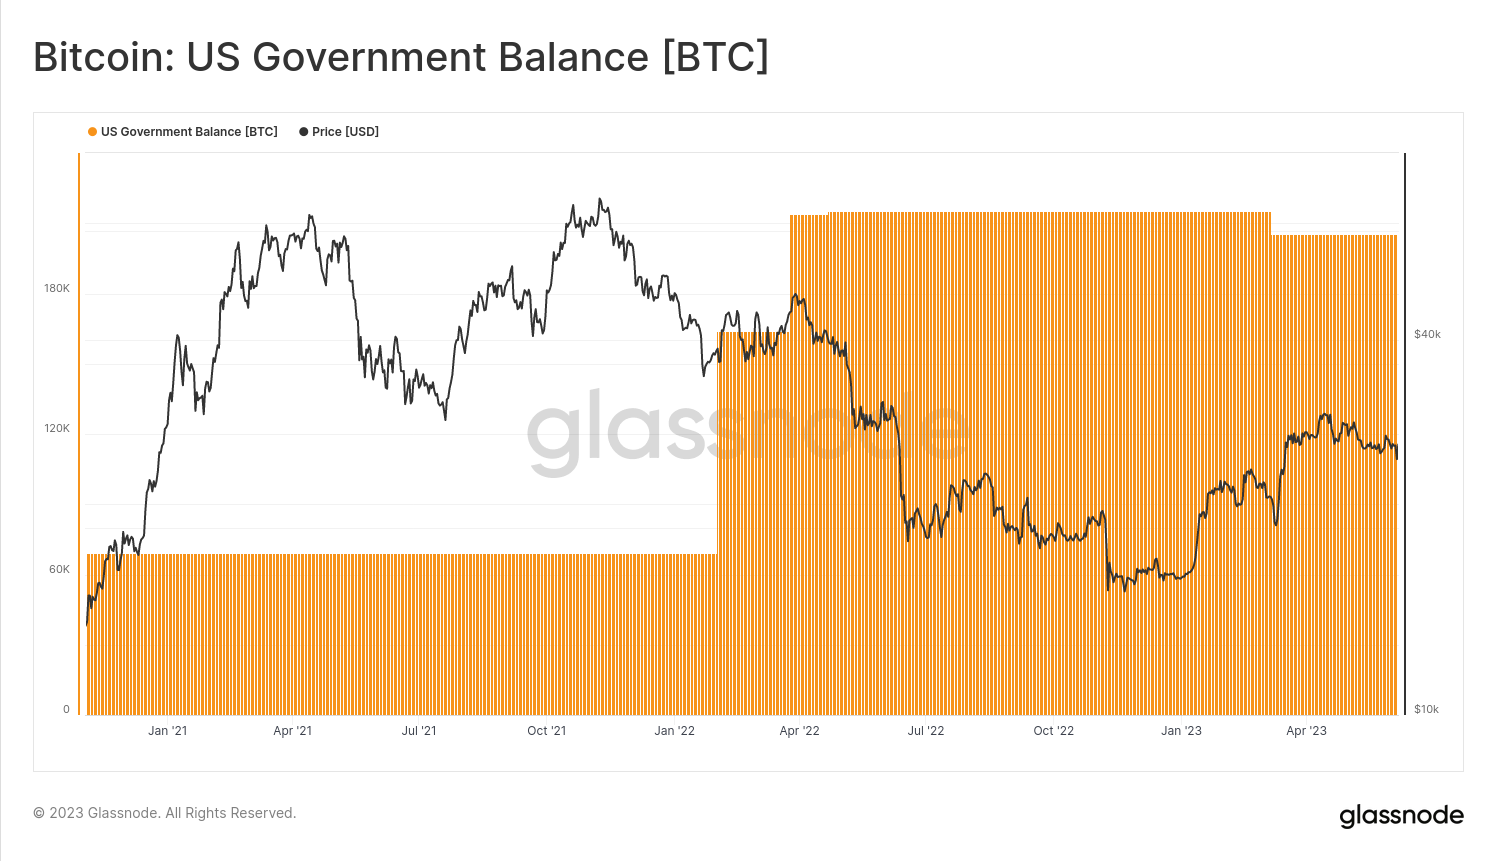
This redistribution of Bitcoin by the US Government is noteworthy as these Bitcoins could be viewed as 'regulation-compliant' by some investors, thereby influencing market demand. Moreover, sudden movements of such large volumes can trigger short-term market volatility. For instance, a recent false alarm regarding the movement of these coins caused significant fluctuations in the market, underscoring the market sensitivity to these potential distributions.
To mitigate these risks and stay informed, Glassnode's US Government Balance chart can be instrumental. It provides near real-time tracking of the BTC held in addresses controlled by US authorities. This metric is continually updated based on publicly available information and can be accessed via Glassnode's API, facilitating its integration into automated trading and risk management strategies.
A useful strategy for investors could be setting an alert to track the US Government Balance for declines below the current level of 205,514 BTC. This would serve as a possible early indication of increased distribution from this entity, allowing investors to prepare for any ensuing market shifts.
Being Prepared for Market Reaction
Investors must be aware of these risk vectors and the potential they have to impact the market. As highlighted by the false alert incident last month, even rumours can trigger significant market responses. The subsequent short-term selling pressure and market liquidations demonstrate how vital it is to base investment and risk management strategies on reliable, up-to-date data sources.
On-chain Basics: Understanding Payload
Definition
In the context of the Bitcoin blockchain, "payload" refers to the actual value of transactions being moved on the Bitcoin network. This concept is used to highlight the difference between the number of transactions (which signifies on-chain activity) and the value these transactions represent (the payload).
Benefits
The payload concept is essential for the following reasons:
- Assessing Network Value: Payload helps determine the actual value being transferred over the Bitcoin network. High transaction counts may not always align with high-value movement. For instance, many transactions could be taking place, but if they all represent low values, the overall payload could be relatively small.
- Identifying Network Activity: If there's a surge in transaction counts but a low payload, it could suggest a higher frequency of non-value-adding transactions, such as exchanges consolidating Unspent Transaction Outputs (UTXOs) or other activities. Payload can help differentiate between various types of activity occurring on the network.
- Understanding Network Adoption: While high transaction counts can suggest increasing adoption, a low payload might indicate that these transactions do not involve significant volumes of coins being exchanged. As such, payload allows to gauge the true adoption and usage of the Bitcoin network.
- Monitoring Economic Activity: Payload can serve as a more accurate representation of economic activity on the Bitcoin network. A rise in the payload could signify increasing economic activity, while a drop might suggest the opposite.
Use Cases
Understanding the concept of payload is crucial in on-chain analysis as it provides valuable insights into Bitcoin's network health, economics, and adoption trends. Incorporating payload analysis into market assessment strategies is highly recommended for investors and analysts.
Payload variations often indicate significant shifts in the Bitcoin market. A sustained increase in payload signifies growing economic activity, presenting potential investment opportunities. Conversely, a significant drop in payload indicates a decrease in value transfer, highlighting potential risks. Thus, monitoring payload trends should be an integral part of an investor's strategy.
Related Glassnode Tools
Glassnode's comprehensive suite of analytics can help you understand this metric and use it in real-life scenarios. Related Glassnode’s tools for differentiating between mere activity and actual value transfer include our proprietary Dashboards, such as:
As can be seen, the concept of payload introduces a lot of nuance to the world of on-chain analysis. Being able to accurately track payload is indispensable to identify trends in the adoption of Bitcoin which, in turn, have crucial implications for investment decision metrics.
Get Personalised Insights
Thank you for joining us for this inaugural edition of the Finance Bridge newsletter. We hope it provides valuable perspectives and helps you navigate the fascinating crypto landscape more effectively.
To help us serve your needs even better, we invite you to engage with us. Do you have any questions about the content of this issue or any other queries? Would you like to connect directly with our team of analysts? Or are you interested in discovering how you can leverage Glassnode’s full potential?
Don't hesitate to reach out. Your thoughts and insights will help us continue to improve the quality of our services and this newsletter, so we're genuinely excited to hear from you. Schedule a call with a dedicated member of our Institutional sales team to begin the conversation.
Disclaimer: This report does not provide any investment advice. All data is provided for information and educational purposes only. No investment decision shall be based on the information provided here and you are solely responsible for your own investment decisions.
- Join our Telegram channel
- Follow us and reach out on Twitter
- Visit Glassnode Forum for long-form discussions and analysis.
- For on-chain metrics, dashboards, and alerts, visit Glassnode Studio
- For automated alerts on core on-chain metrics and activity on exchanges, visit our Glassnode Alerts Twitter
