Market Making on Uniswap: An Analytical Approach - Part I


A Breakdown of Uniswap's Protocol Activities
Introduction
One of the fundamental building blocks within the cryptocurrency ecosystem is decentralized exchanges (DEXs). These platforms enable users to trade cryptocurrencies directly with each other, or via liquidity pools, eliminating the need for a counterparty or a centralized entity to execute the trade.
Within DEXes, Automated Market Making (AMM) facilitates the creation of liquidity in an automated and decentralized manner. One of the biggest DEXs, Uniswap, also allows market makers to allocate their liquidity across custom price ranges where they expect higher trading activity. By doing so, market makers can better manage their yield strategies and risks according to market conditions, thereby enhancing overall capital efficiency. This technology offers more options for actively managed liquidity and has significantly enhanced the trading experience for users on the Uniswap platform.
The present report is the first part of an ongoing research piece designed to assist Uniswap market makers in understanding these new dynamics.
Part I (this report) - A Breakdown of Uniswap Protocol Activities
In the first part of our report, we provide a comprehensive overview of the protocol performance. We present various metrics and methodologies we believe can help market makers better understand Uniswap as well as help assess the preferences by Market Makers and Traders.
Part II - Understanding Liquidity Supply and Demand Dynamics on Uniswap
In this part, we examine the various exogenous and endogenous variables that influence Market Makers on Uniswap and their decision-making process. We cover frameworks for selecting a token pair and the right fee tier for a market-making position.
Part III - Classifying Uniswap's Liquidity Providers and Their Strategies
In this section, we deliver an extensive analysis of Uniswap's liquidity providers, and classify them into bots and organic Market Makers. We then shed some light on the different strategies by each cohort group.
(Please be aware that the metrics featured in these reports cover activities on Ethereum's mainnet)
A Breakdown of Uniswap's Protocol Activities
DEXs in the Context of Digital Asset Trading
Automated Market Making is a core primitive in the blockchain-based financial system known as Decentralized Finance (DeFi). DeFi encompasses a range of financial services and applications built using automated smart contracts hosted on blockchain technology.
Its goal is to recreate traditional financial services, such as trading, lending, and borrowing markets, except in a decentralized manner. Automated Market Making is one such primitive that enables the creation of liquidity, and maintaining of prices for Decentralized Exchanges (DEXs). If you are unfamiliar with Uniswap's main design features, please refer to our Primer about Uniswap for a full overview.
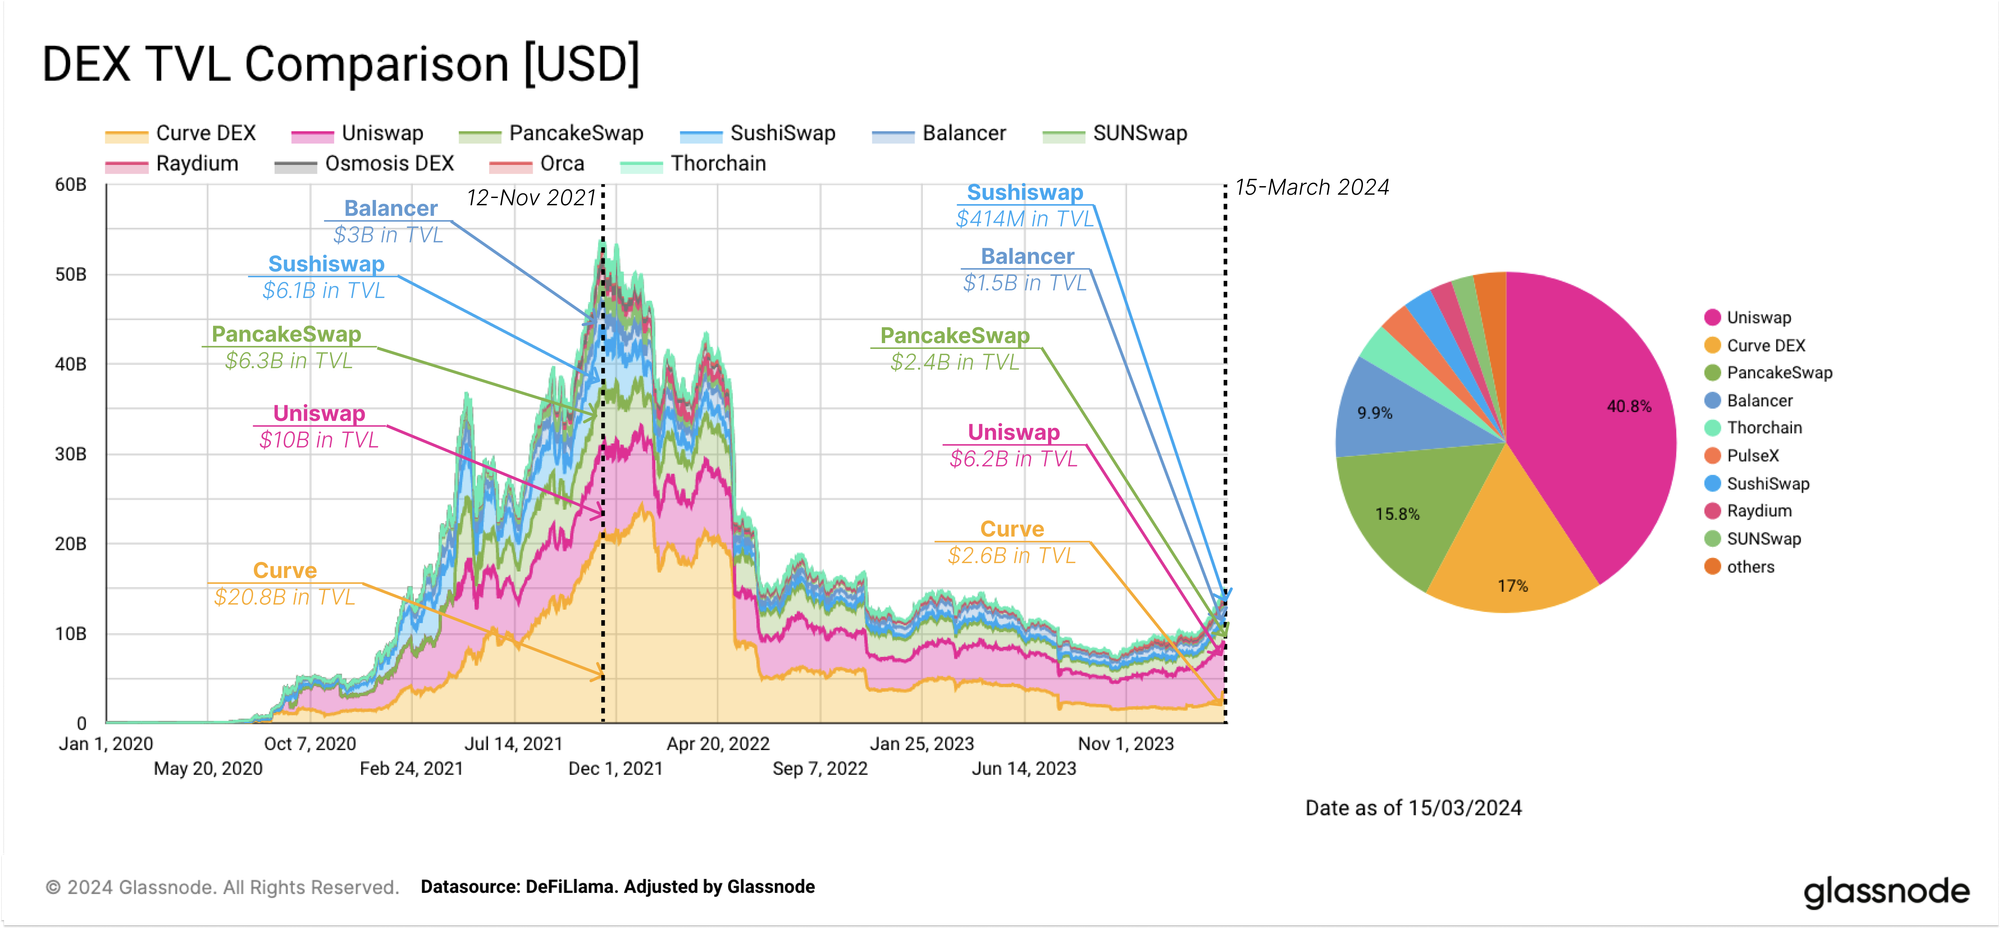
The growth of the DeFi ecosystem resulted in a surge in capital inflows into DEXs, with Uniswap, Curve, PancakeSwap, Sushiswap, and Balancer seeing the largest inflows during the recent uptick in prices. The volume of liquidity hosted on Uniswap and Curve has been the most stable, Similar newer DEXs, especially from non-Ethereum chains, are starting to play catch up.
A Breakdown of Uniswap Protocol Activities
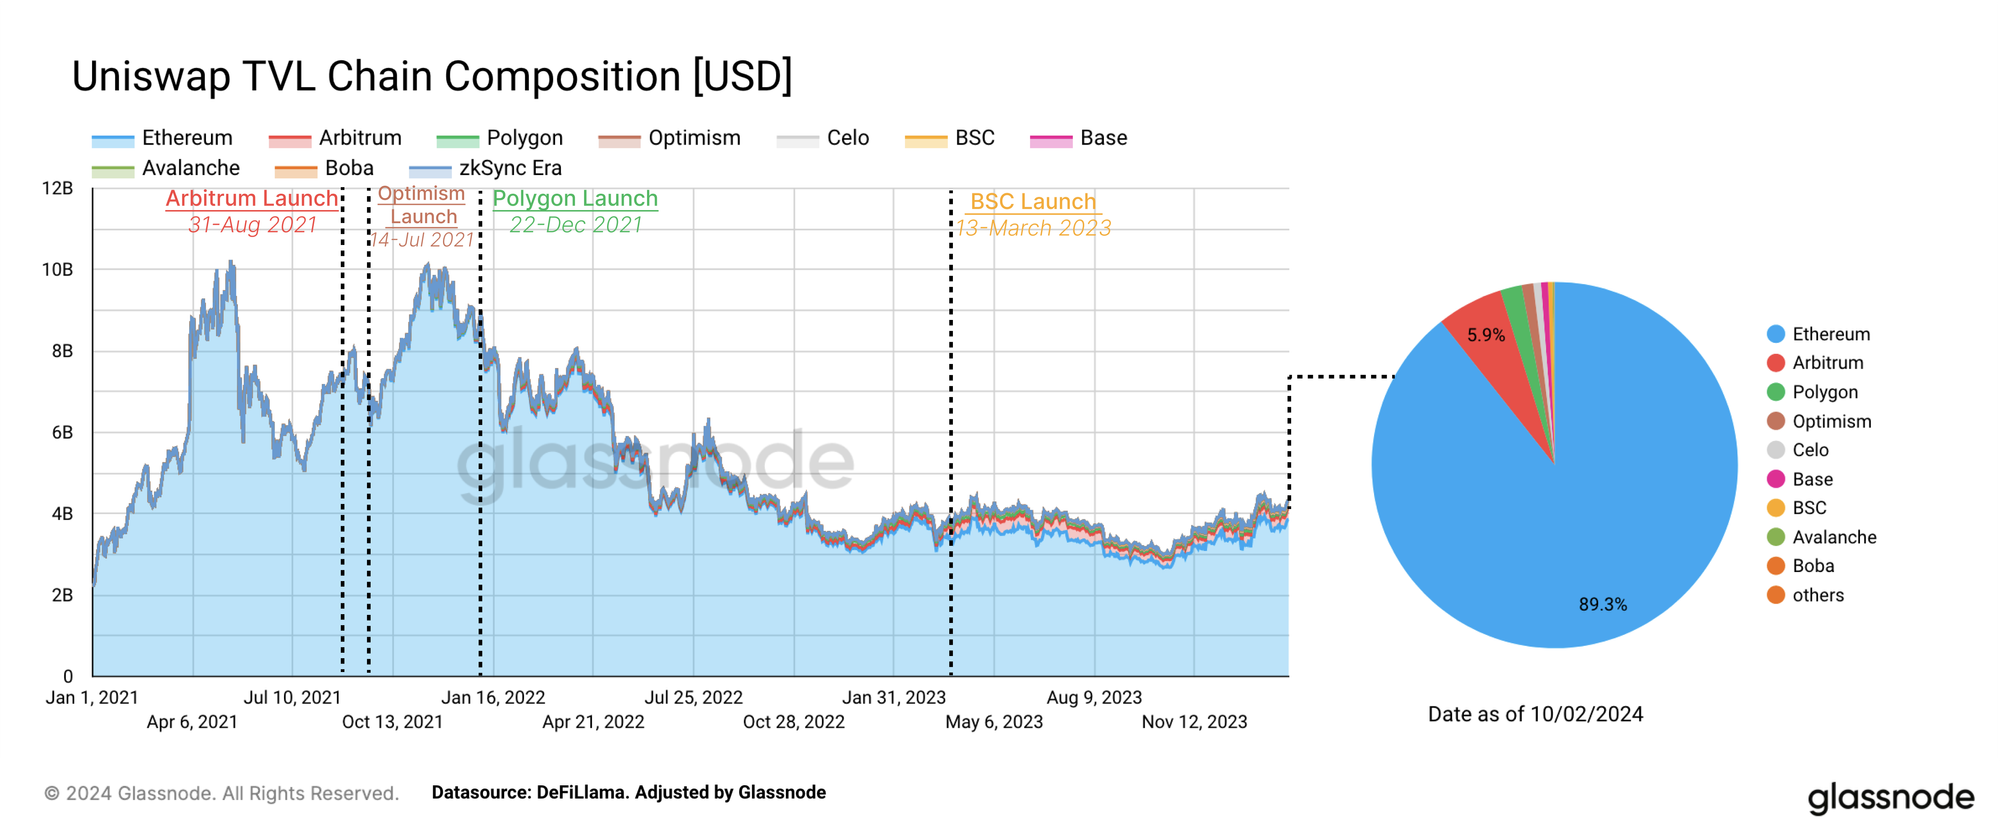
Similar to other DeFi protocols, the Uniswap protocol has expanded and launched on several of the new Ethereum scaling solution blockchains, called Layer-2s. However, Uniswap remains one of the most established venues for market-making strategies on the Ethereum mainnet.
As Ethereum's scaling solutions gain prominence, we anticipate changes in market-making dynamics due to the significantly reduced gas costs these chains offer. However, as 82% of Uniswap's Total Value Locked (TVL) remains on the Ethereum mainnet, this report will primarily focus on that mainnet data.
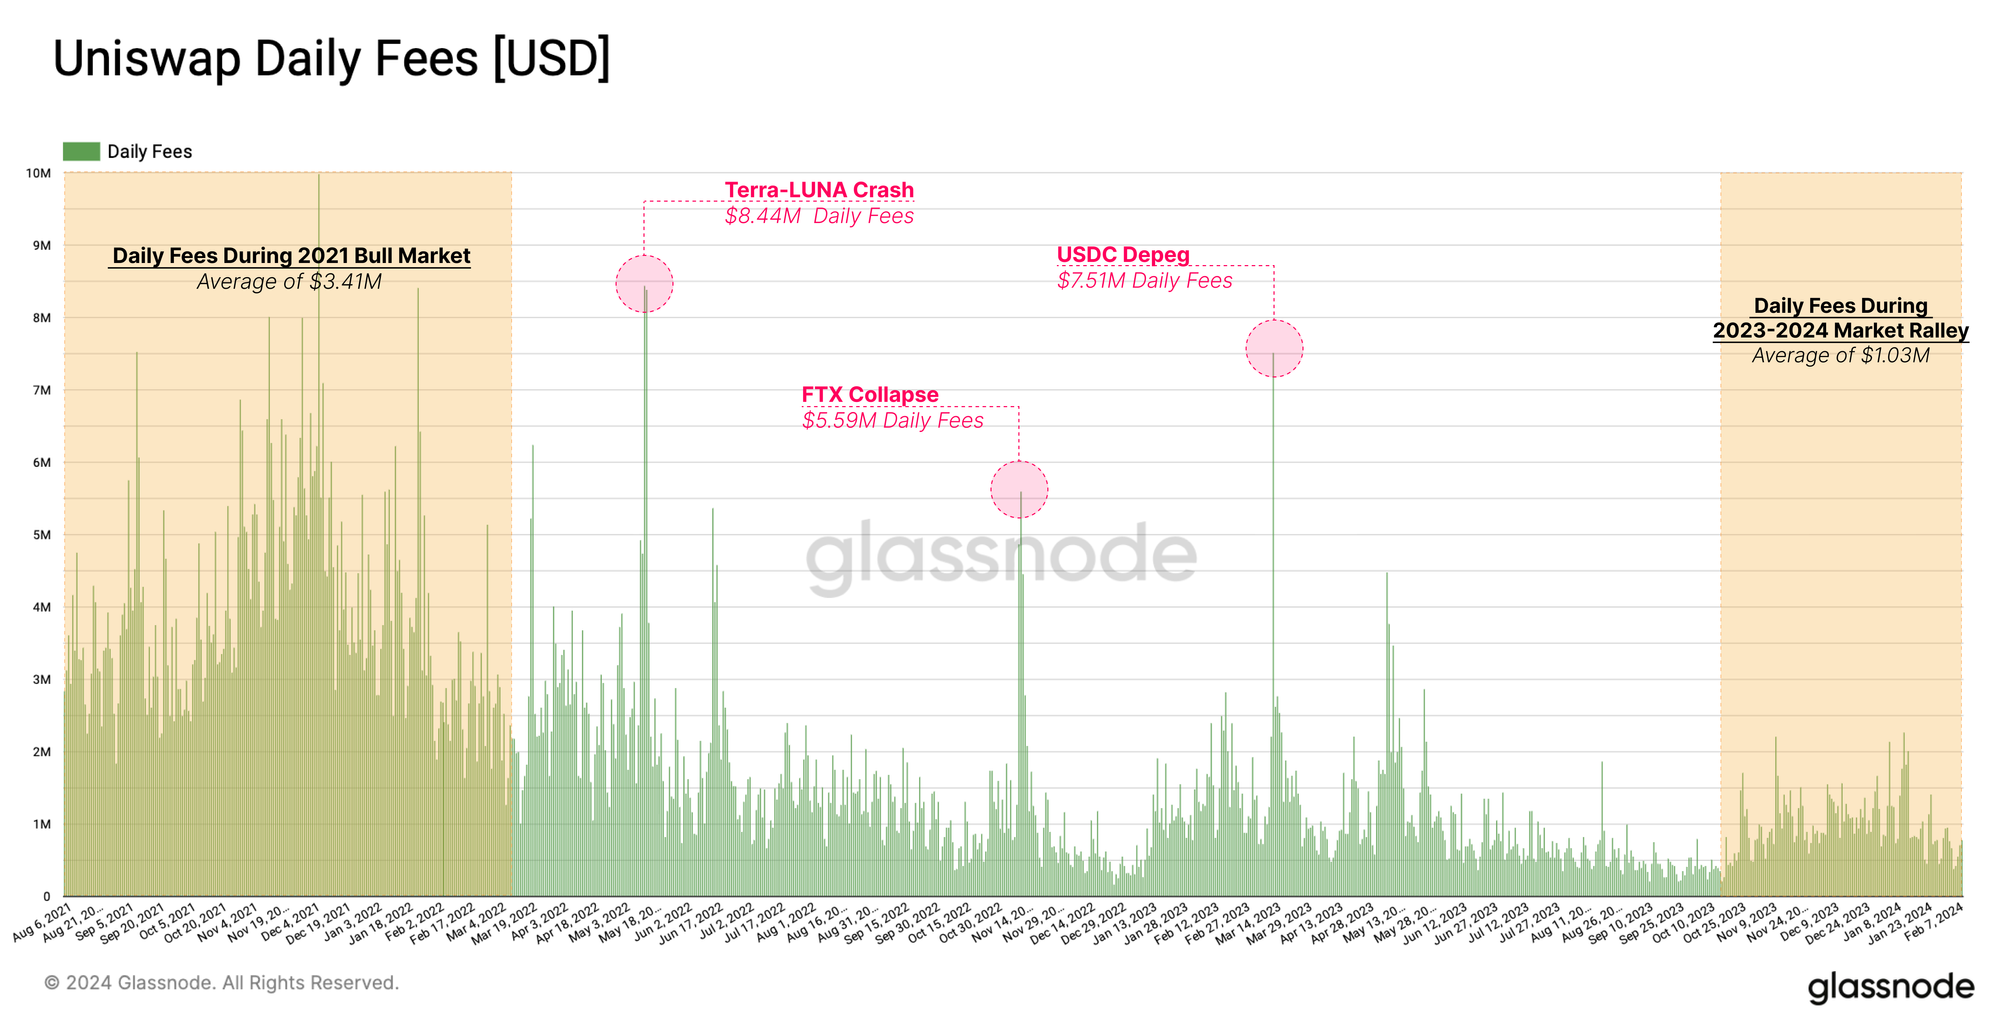
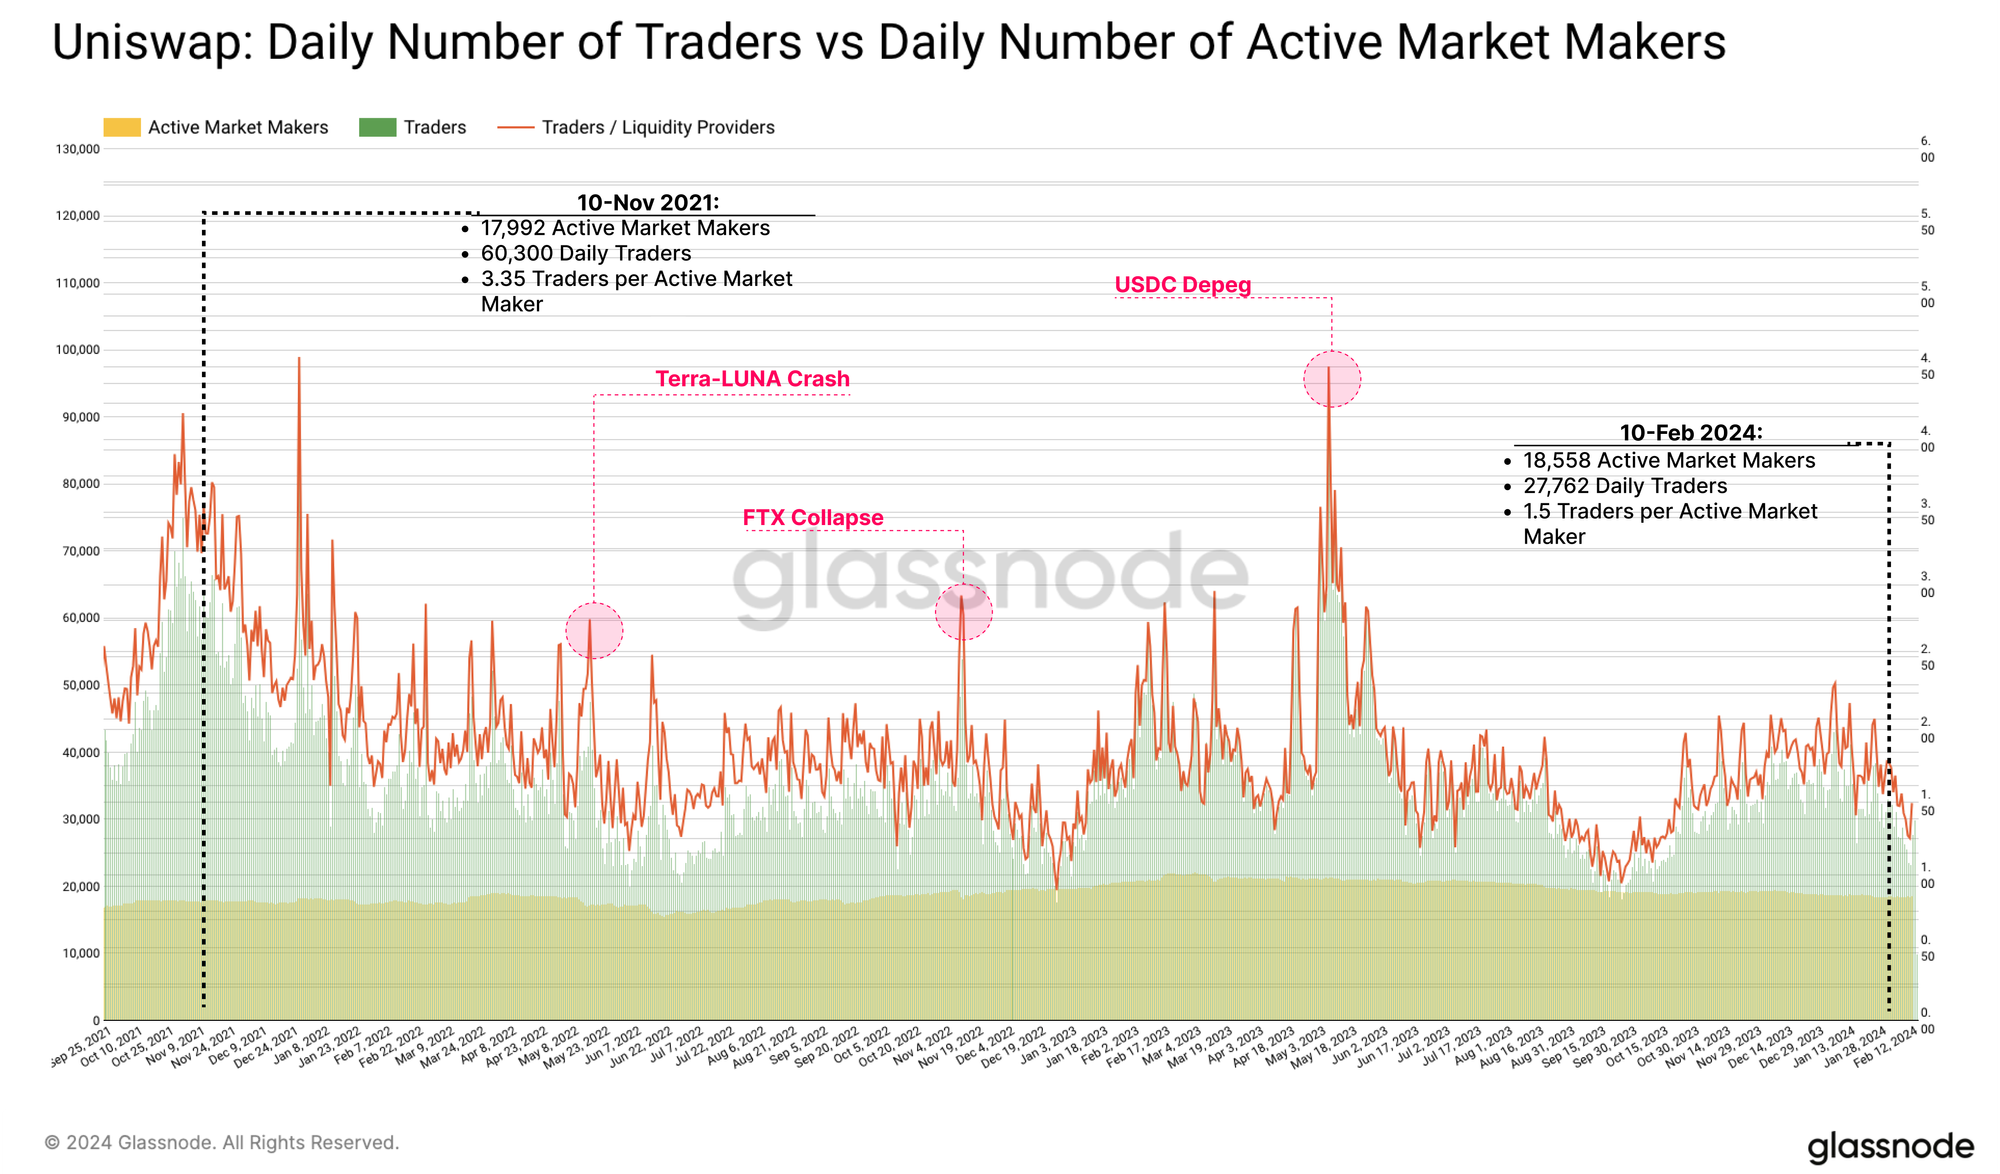
In the Uniswap ecosystem, traders drive demand for liquidity, while liquidity providers (LPs) supply it. The protocol's success hinges on this interplay, reflected in a total of $2.5 billion in fees generated. However, it should be noted that trade fees did not directly translate into the valuation of the protocol itself, as fees collected for trades were historically allocated entirely to LPs.
After reaching an all-time high in November 2021, a downward trend in daily fees was established, only punctuated by sporadic surges tied to specific high volatility events. Recent months have shown a modest and gradual increase in daily fees, but they still fall short of the peak, being only one-third of typical 2021 figures.
Competition has also intensified for Uniswap LPs, alongside the dispersion of its liquidity across various Layer-2s. This fragmentation across chains and platforms is starting to influence the strategies of market makers, as they must now consider factors like bridge risks, user demographics, and trading volumes to optimize their positions across multiple chains and user profiles.
When looking at the number of unique traders and market makers, we can determine a slight decrease for both over recent years, however, the proportions of these cohorts have started to shift. During the 2021 bull cycle, there was an average of 3 traders per active market maker. Since the beginning of 2022, this number has oscillated between one and two traders per market maker, suggesting a relative reduction in trader activity.
This trend must not be solely related to market conditions, and could also be attributed to traders, potentially smaller in size, transitioning towards Layer-2s. Market makers tend to prefer the larger volume traders who are more likely to stay on the mainnet, whilst smaller and more fee-sensitive traders are more likely to move to cheaper alternatives.
Note: We've adjusted the number of Liquidity Providers in this chart to exclude positions smaller than $100, which we believe to be inactive positions, where, the costs of closing would surpass the value of the position.
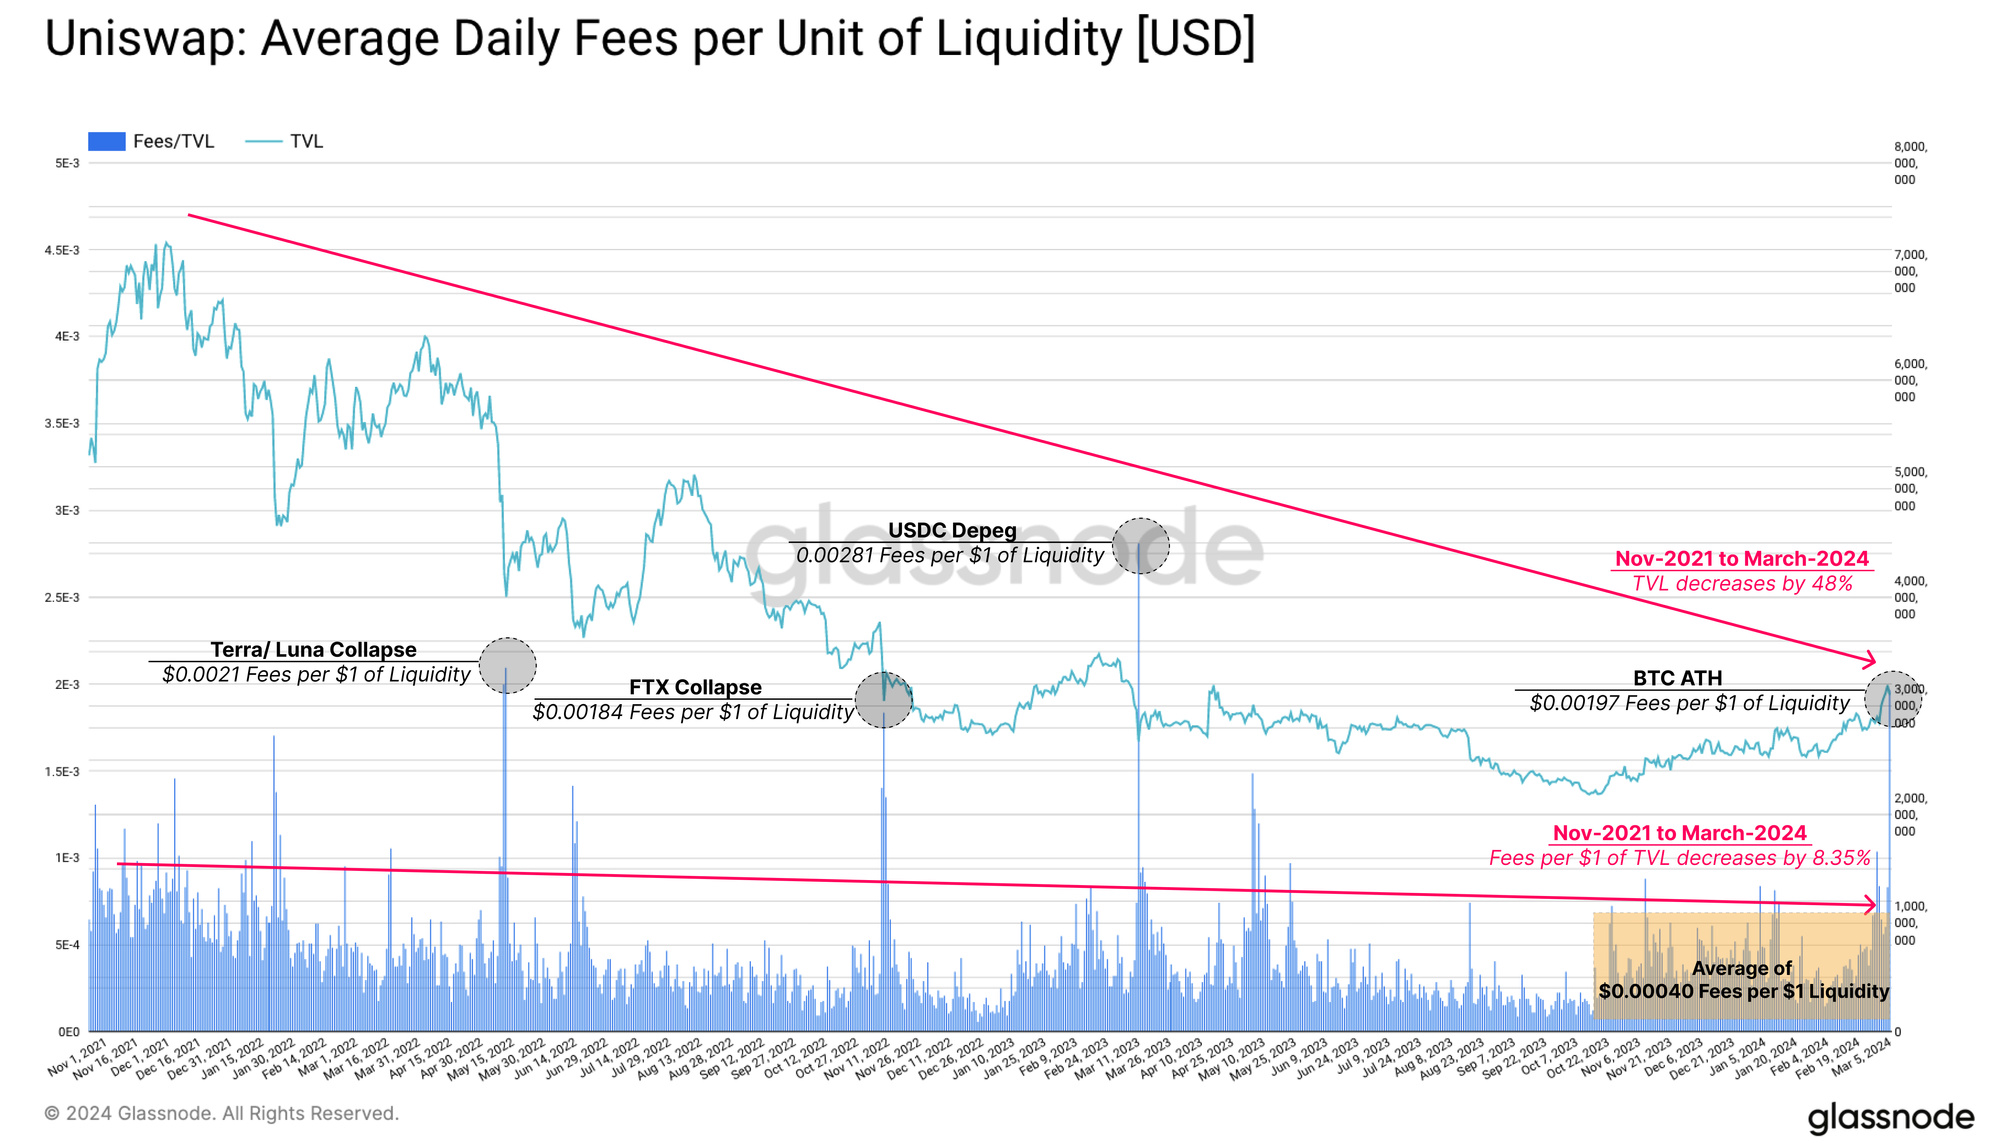
However, there is even more information to extract from understanding the relationship between Traders and LPs. Next, we will look into the average daily fees per dollar unit of liquidity, as a general measure for market maker income.
From November 2021 through to March 2024, TVL on Uniswap dropped by over -48%. However, the fees received per $1 of liquidity only fell by 8.35%, maintaining an average fee amount of $0.0004 per dollar of liquidity.
Interestingly, LP income does not seem to have been as significantly impacted by either the bear market or the ongoing deleveraging observed within Uniswaps TVL. We argue this is because the fees paid by traders over the same period have decreased less on a relative basis, leading to only a slight dip in LP income, and maintaining a stable market equilibrium on the protocol.
Market Maker's Favourite Tokens
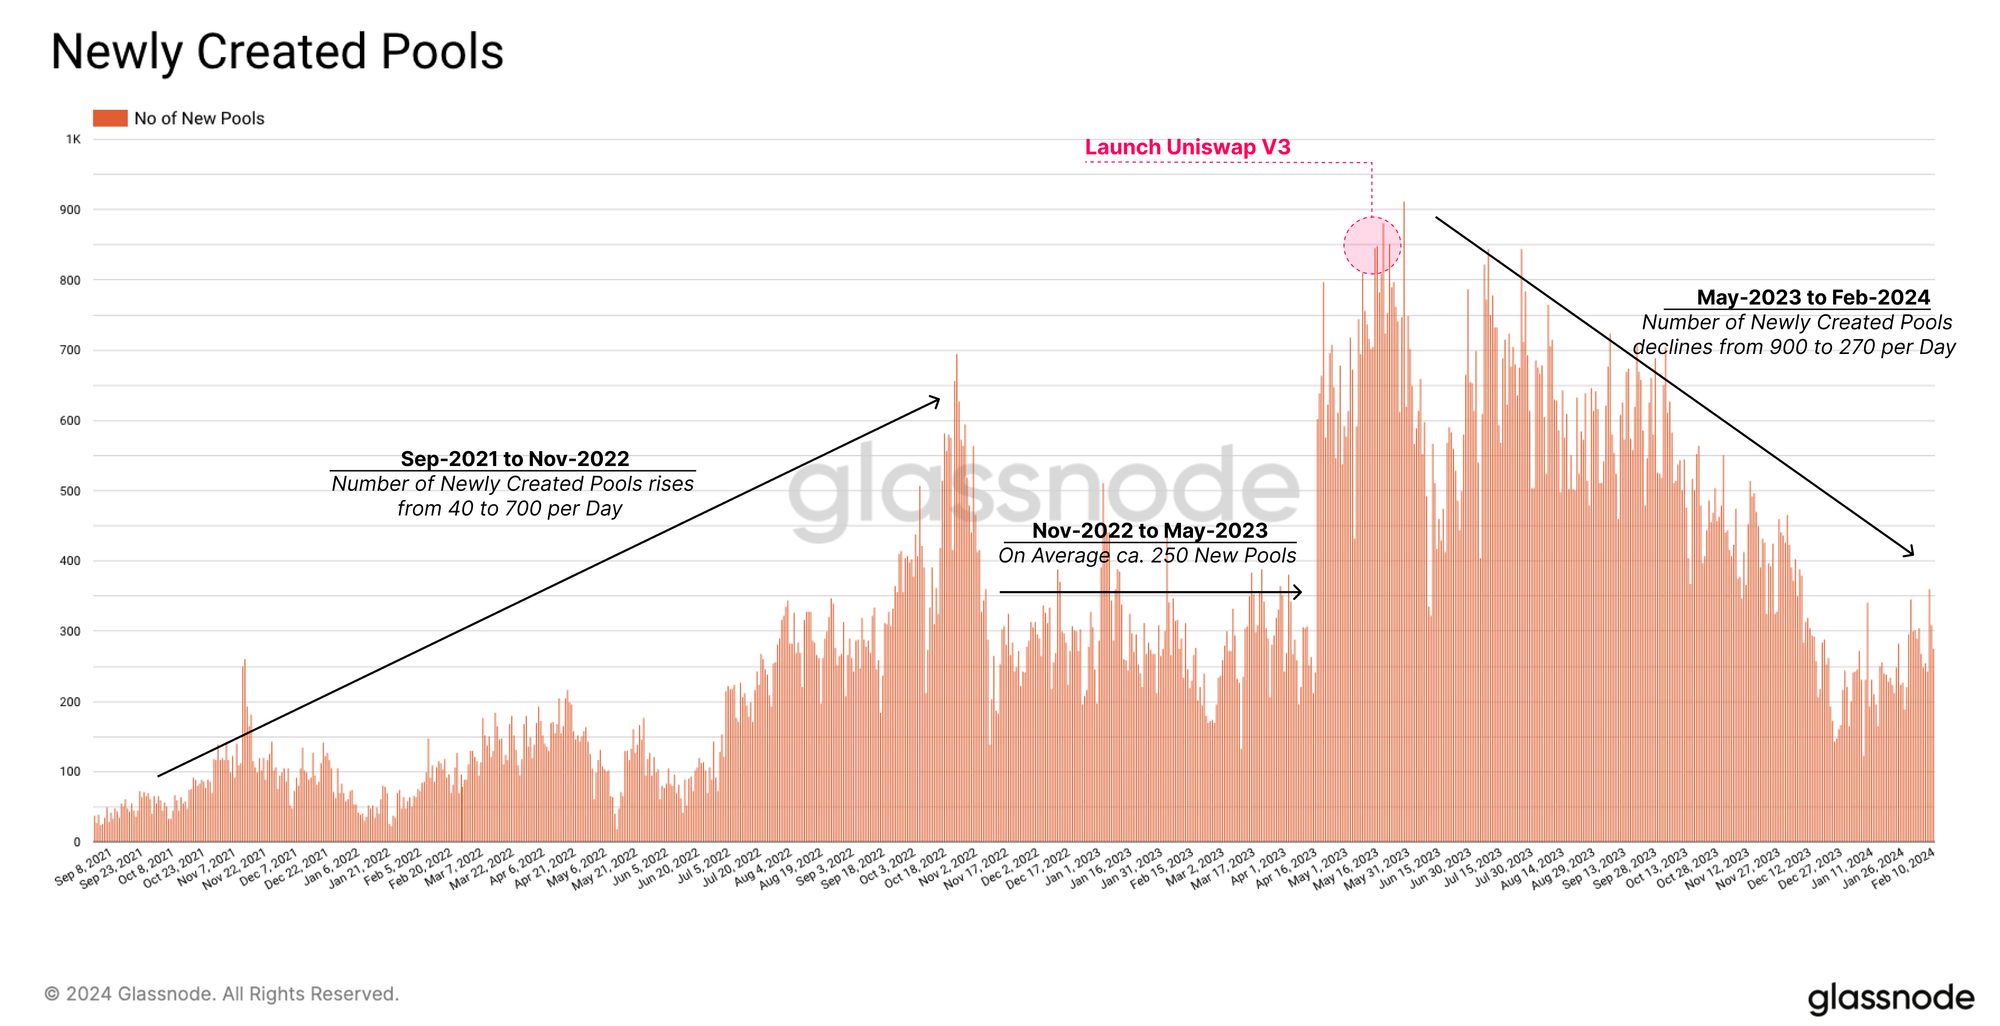
Market makers on Uniswap have a vast and ever-increasing selection of pools and tokens available for providing liquidity. Ever since the launch of Uniswap V3, the rate of newly created liquidity pools for both Uniswap V2 and V3 has been extremely high.
Whilst the rate of new pool creation is decreasing again, we can still see around 270 newly created pools per day, coming off the May 2023 peak of around 900/day.
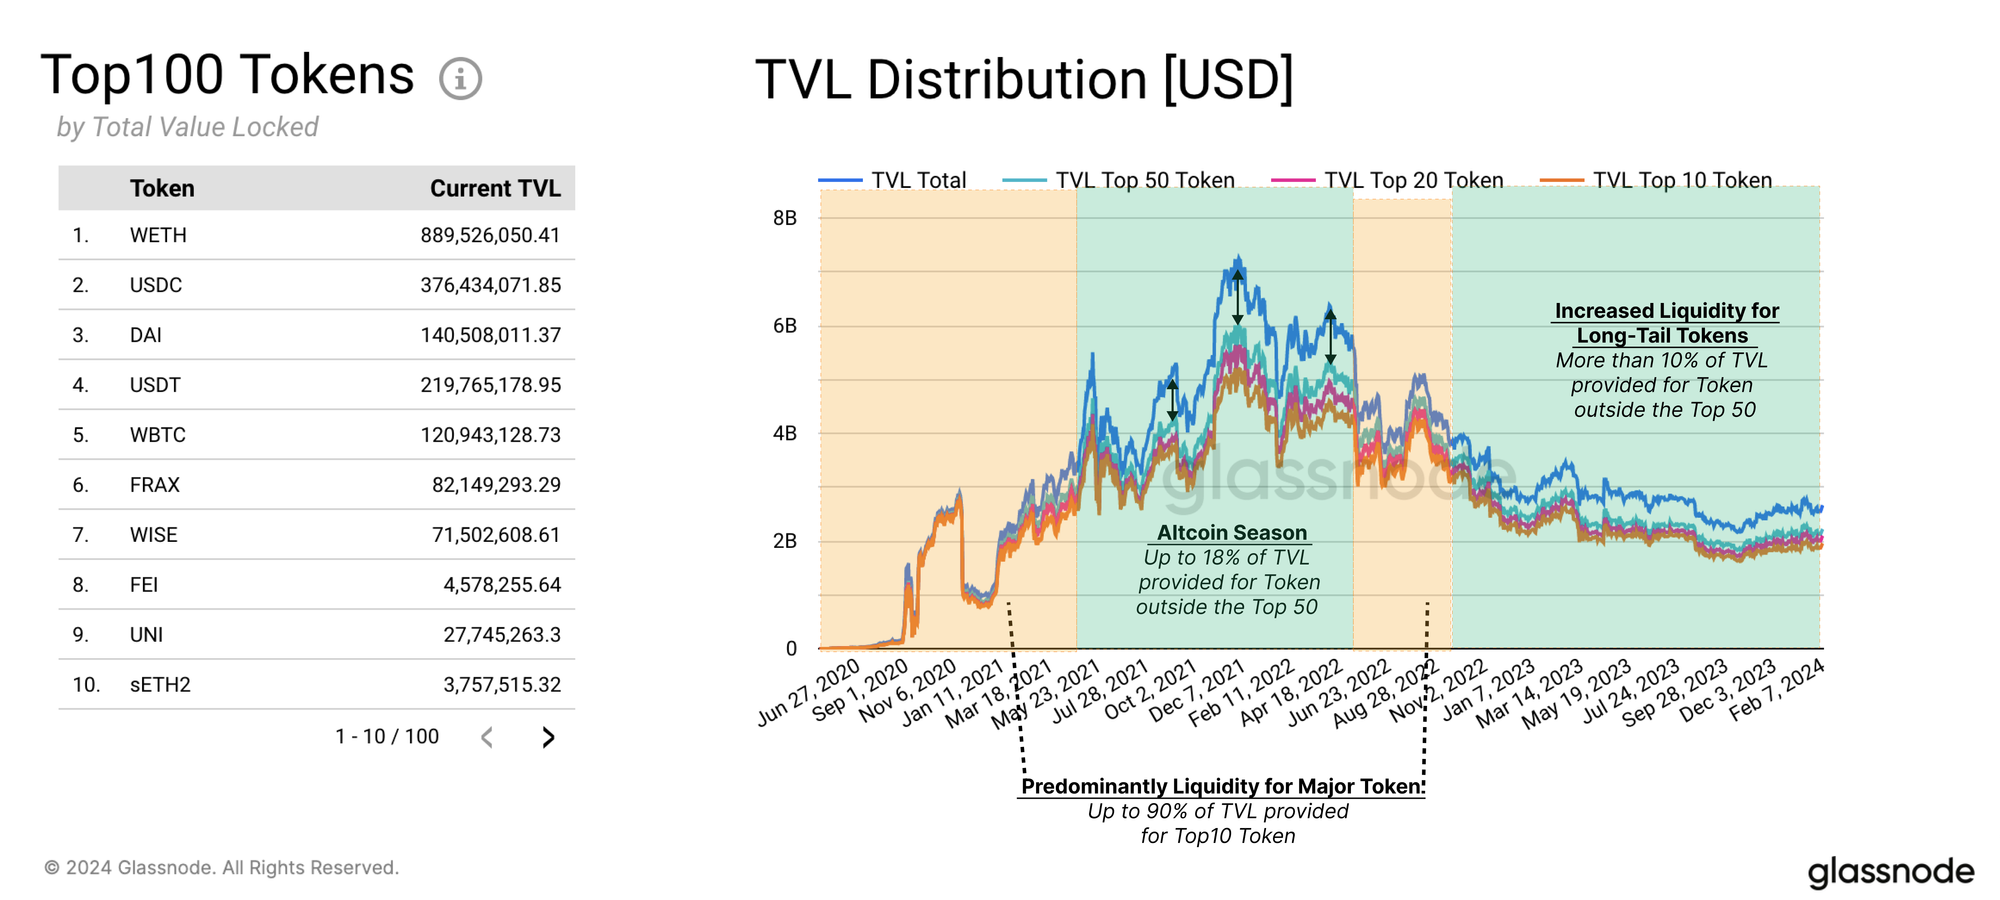
However, upon closer examination, we quickly discover that despite the large number of newly created pools, it is actually only a few pools that attract any serious liquidity from market makers. When examining the TVL distribution, it is evident that approximately 70% to 85% of the total liquidity is contributed to pools in the Top-10 tokens. Tokens ranked between the Top-20 and Top-50 receive only marginal extra liquidity (note that tokens are ranked based on their average TVL over time).
Another observation is that this ratio shifted during the peak of the 2021 bull market. This suggests that during the market mania, more TVL was being directed towards pools containing long-tail tokens. However, this trend understandably slowed and reversed during the 2022 bear market, where the total TVL was almost entirely made up again of the Top-50 tokens. Overall, this suggests that market makers do respond to the trading demand expressed by traders, effectively following the fee revenue into whatever pools provide it.
Since the beginning of 2024, we have seen an influx in liquidity into long-tail altcoins once again, reflecting an expectation by market makers for more risk-off behaviour.
Trader's Favourite Tokens
DEX trading is still relatively niche and tends to lag behind its centralized counterparts. For instance, while Binance often has over $20B in daily trade volume, Uniswap has rarely exceeded $1B over the past few years.
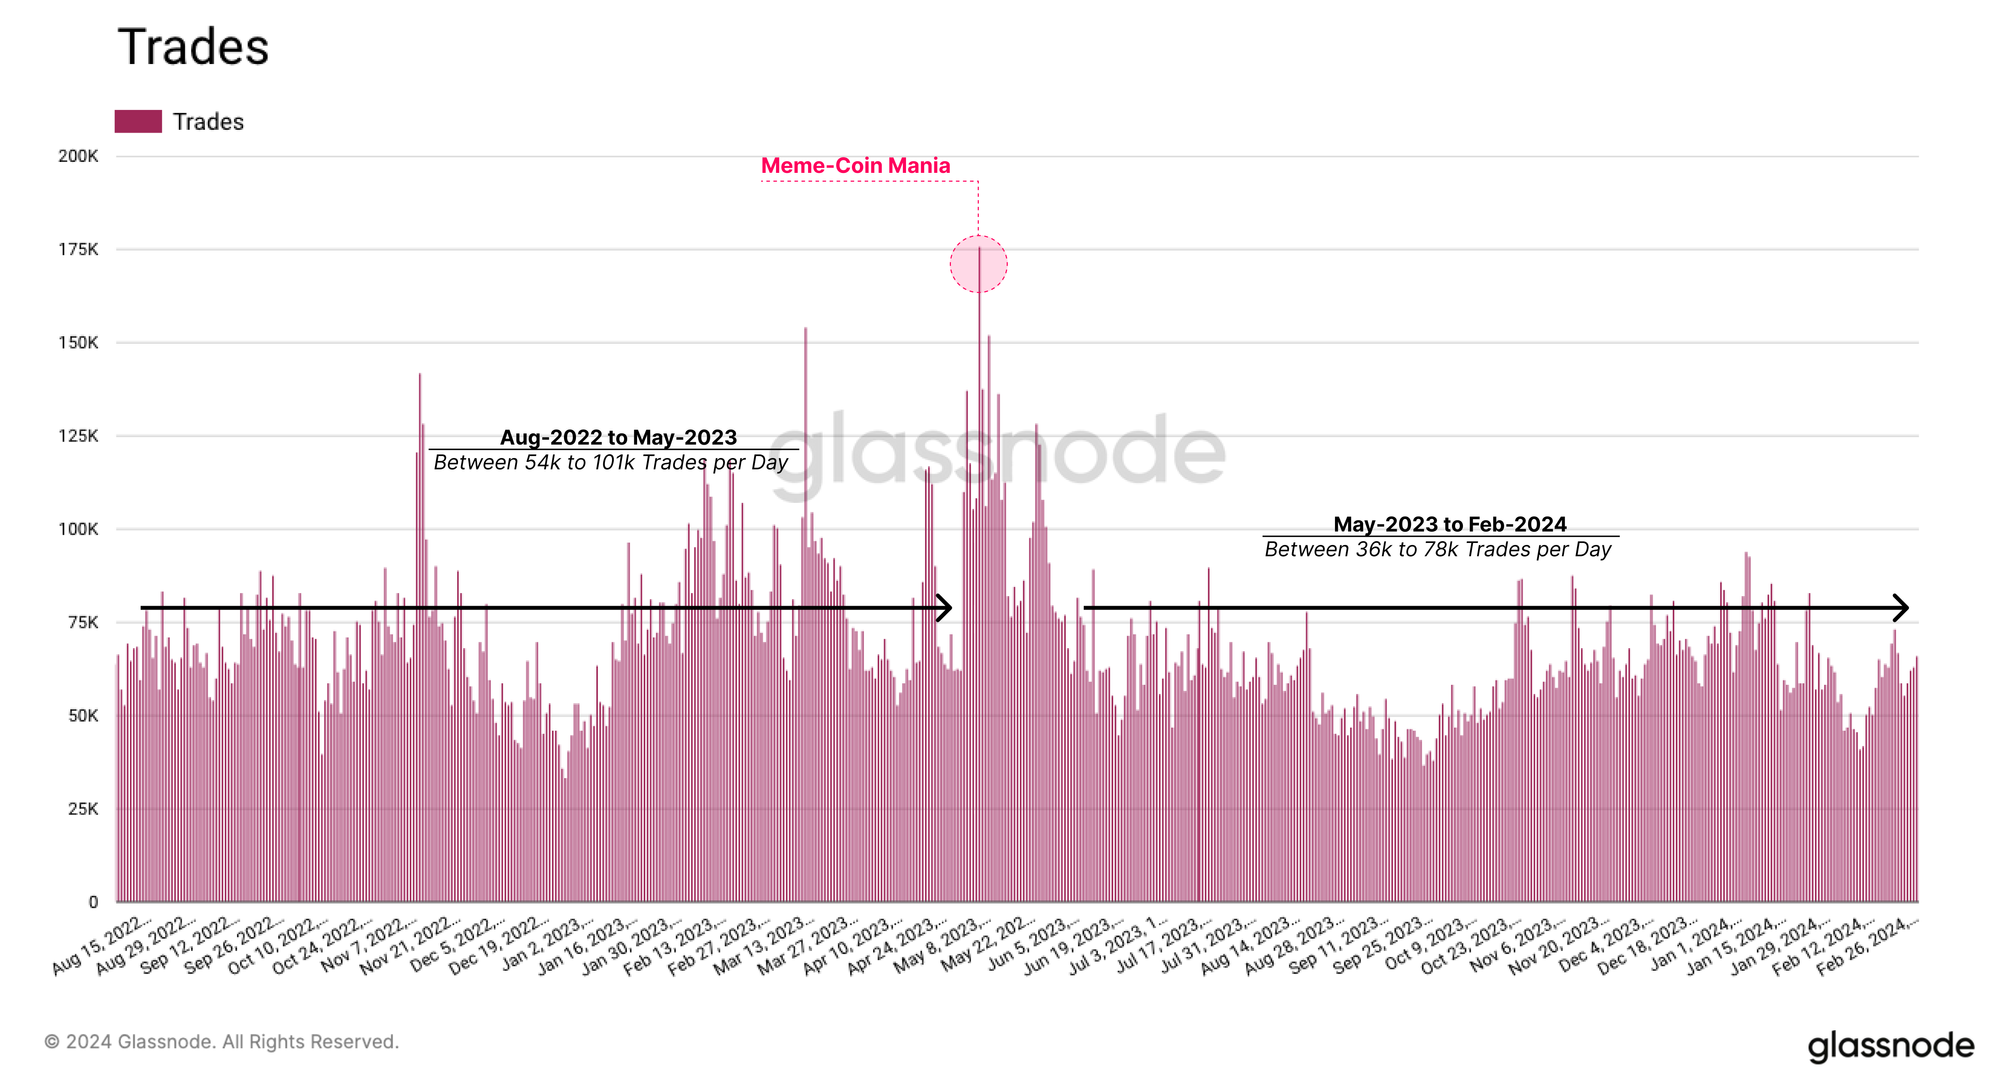
Uniswap has maintained a consistent and stable number of trades per day, however. Up until May of 2023, we can see daily trade counts ranging from 54k to 101k per day, which peaked during the 'meme-coin-mania'. Since then, the number of trades has fluctuated between around 36k to 78k per day.
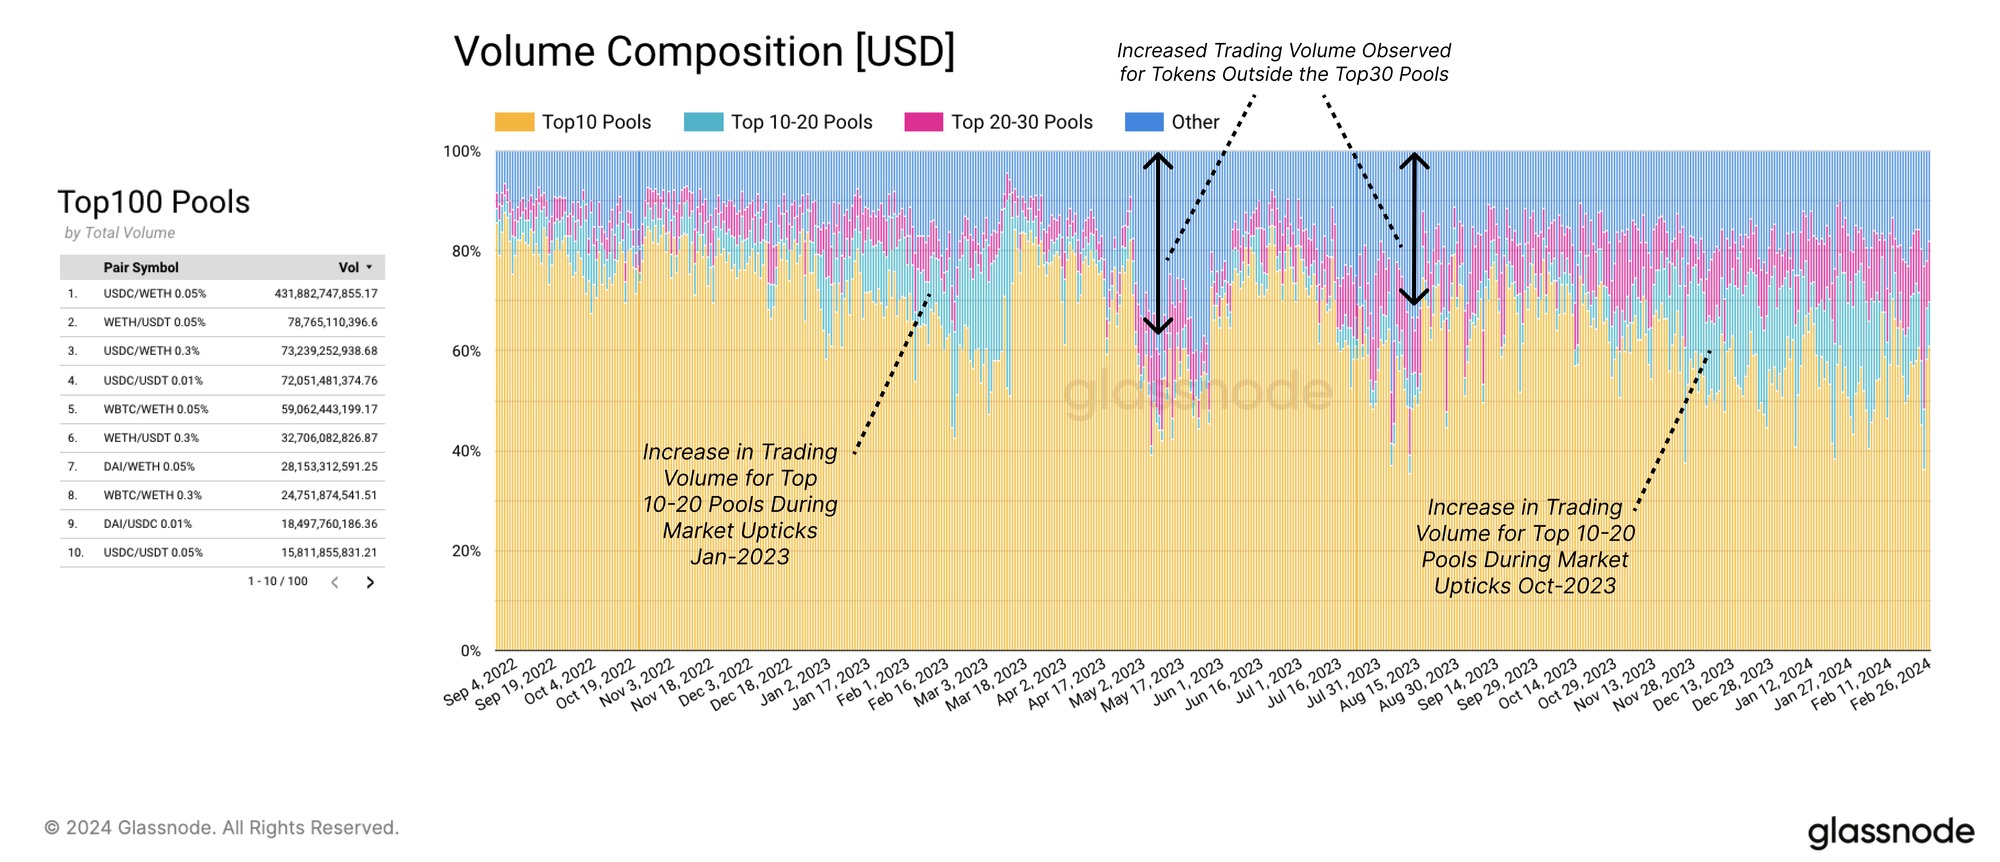
As with our previous findings for market makers, DEX traders also seem to have a similar preference for tokens. Most of the Uniswap trade volume is concentrated in the Top-10 pools, which generally include pairs between the dominant stablecoins, WETH, and WBTC.
During market rallies, volume tends to increasingly flow into the Top-10 to Top-20 pools, which starts to cover more established altcoin pairs. However, there seems to be no corresponding increase in demand for tokens outside the Top-20 during these periods.
Increased trading volume for tokens outside the Top-30 pools seems to only center around narrative-based developments, such as Memecoins in early summer last year, and also tends to be relatively short-lived.
This concludes the first part of our report. In the upcoming second chapter, we will delve deeper into the factors that drive the decision-making of the Market Makers. You can find the second part here.
- Join our Telegram channel
- For on-chain metrics, dashboards, and alerts, visit Glassnode Studio
- For automated alerts on core on-chain metrics and activity on exchanges, visit our Glassnode Alerts Twitter