Market Making on Uniswap: An Analytical Approach - Part II


Understanding Liquidity Supply and Demand Dynamics on Uniswap
Introduction
The introduction of concentrated liquidity in Uniswap V3 has given market makers more freedom and opportunity to manage their positions. It has also made the competitive landscape more challenging, and thus the decision-making process has become substantially more complex for selecting pools to optimize returns.
This report is the second part of an ongoing research piece designed to assist Uniswap market makers in understanding these new dynamics. The goal is to provide a comprehensive overview of the competitive market-making landscape on Uniswap. We will also present various metrics and methodologies we believe can help market makers identify and select the appropriate strategy to navigate the Uniswap liquidity landscape more effectively.
Part I - A Breakdown of Uniswap Protocol Activities
In the first part of our report, we provide a comprehensive overview of the protocol performance. We present various metrics and methodologies we believe can help market makers better understand Uniswap as well as help assess the preferences by Market Makers as well as Traders.
Part II (this report) - Understanding Liquidity Supply and Demand Dynamics on Uniswap
In this part, we examine the various exogenous and endogenous variables that influence Market Makers on Uniswap and their decision-making process. We cover frameworks for selecting a token pair and the right fee tier for a market-making position.
Part III - Classifying Uniswap's Liquidity Providers and Their Strategies
In this section, we deliver an extensive analysis of Uniswap's liquidity providers, and classify them into bots and organic Market Makers. We then shed some light on the different strategies by each cohort group.
(Please be aware that the metrics featured in these reports cover activities on Ethereum's mainnet)
Understanding Liquidity Supply and Demand Dynamics on Uniswap
The introduction of concentrated liquidity in Uniswap V3 has given market makers more freedom and opportunity to manage their positions. It has also made the competitive landscape more challenging, and thus the decision-making process has become substantially more complex for selecting pools to optimize returns.
Several dynamic factors influence this decision. These include:
- The type of token and token-pair for which they wish to provide liquidity.
- Fees, which are determined by the fee tier and trade volume, resulting in the total fees generated for the pool.
- The existing liquidity in a pool also determines the providers' share in the generated fees.
- The price range for which they wish to provide liquidity is also a factor. This depends on the price movement of that token pair and the actively managed liquidity in that pool.
Traders on the other hand, are drawn in not only by low fees, but also consider a pool’s active reserve, as a low or imbalanced liquidity might increase slippage. It is this interaction between Market Makers and Traders which raises an intriguing question: At what point does liquidity follow trade volume?
As shown in the chart below, for the four different fee-tiers for USDC-WETH pools, trading volume has not been retained in the lowest fee-tier pool as one would first expect.
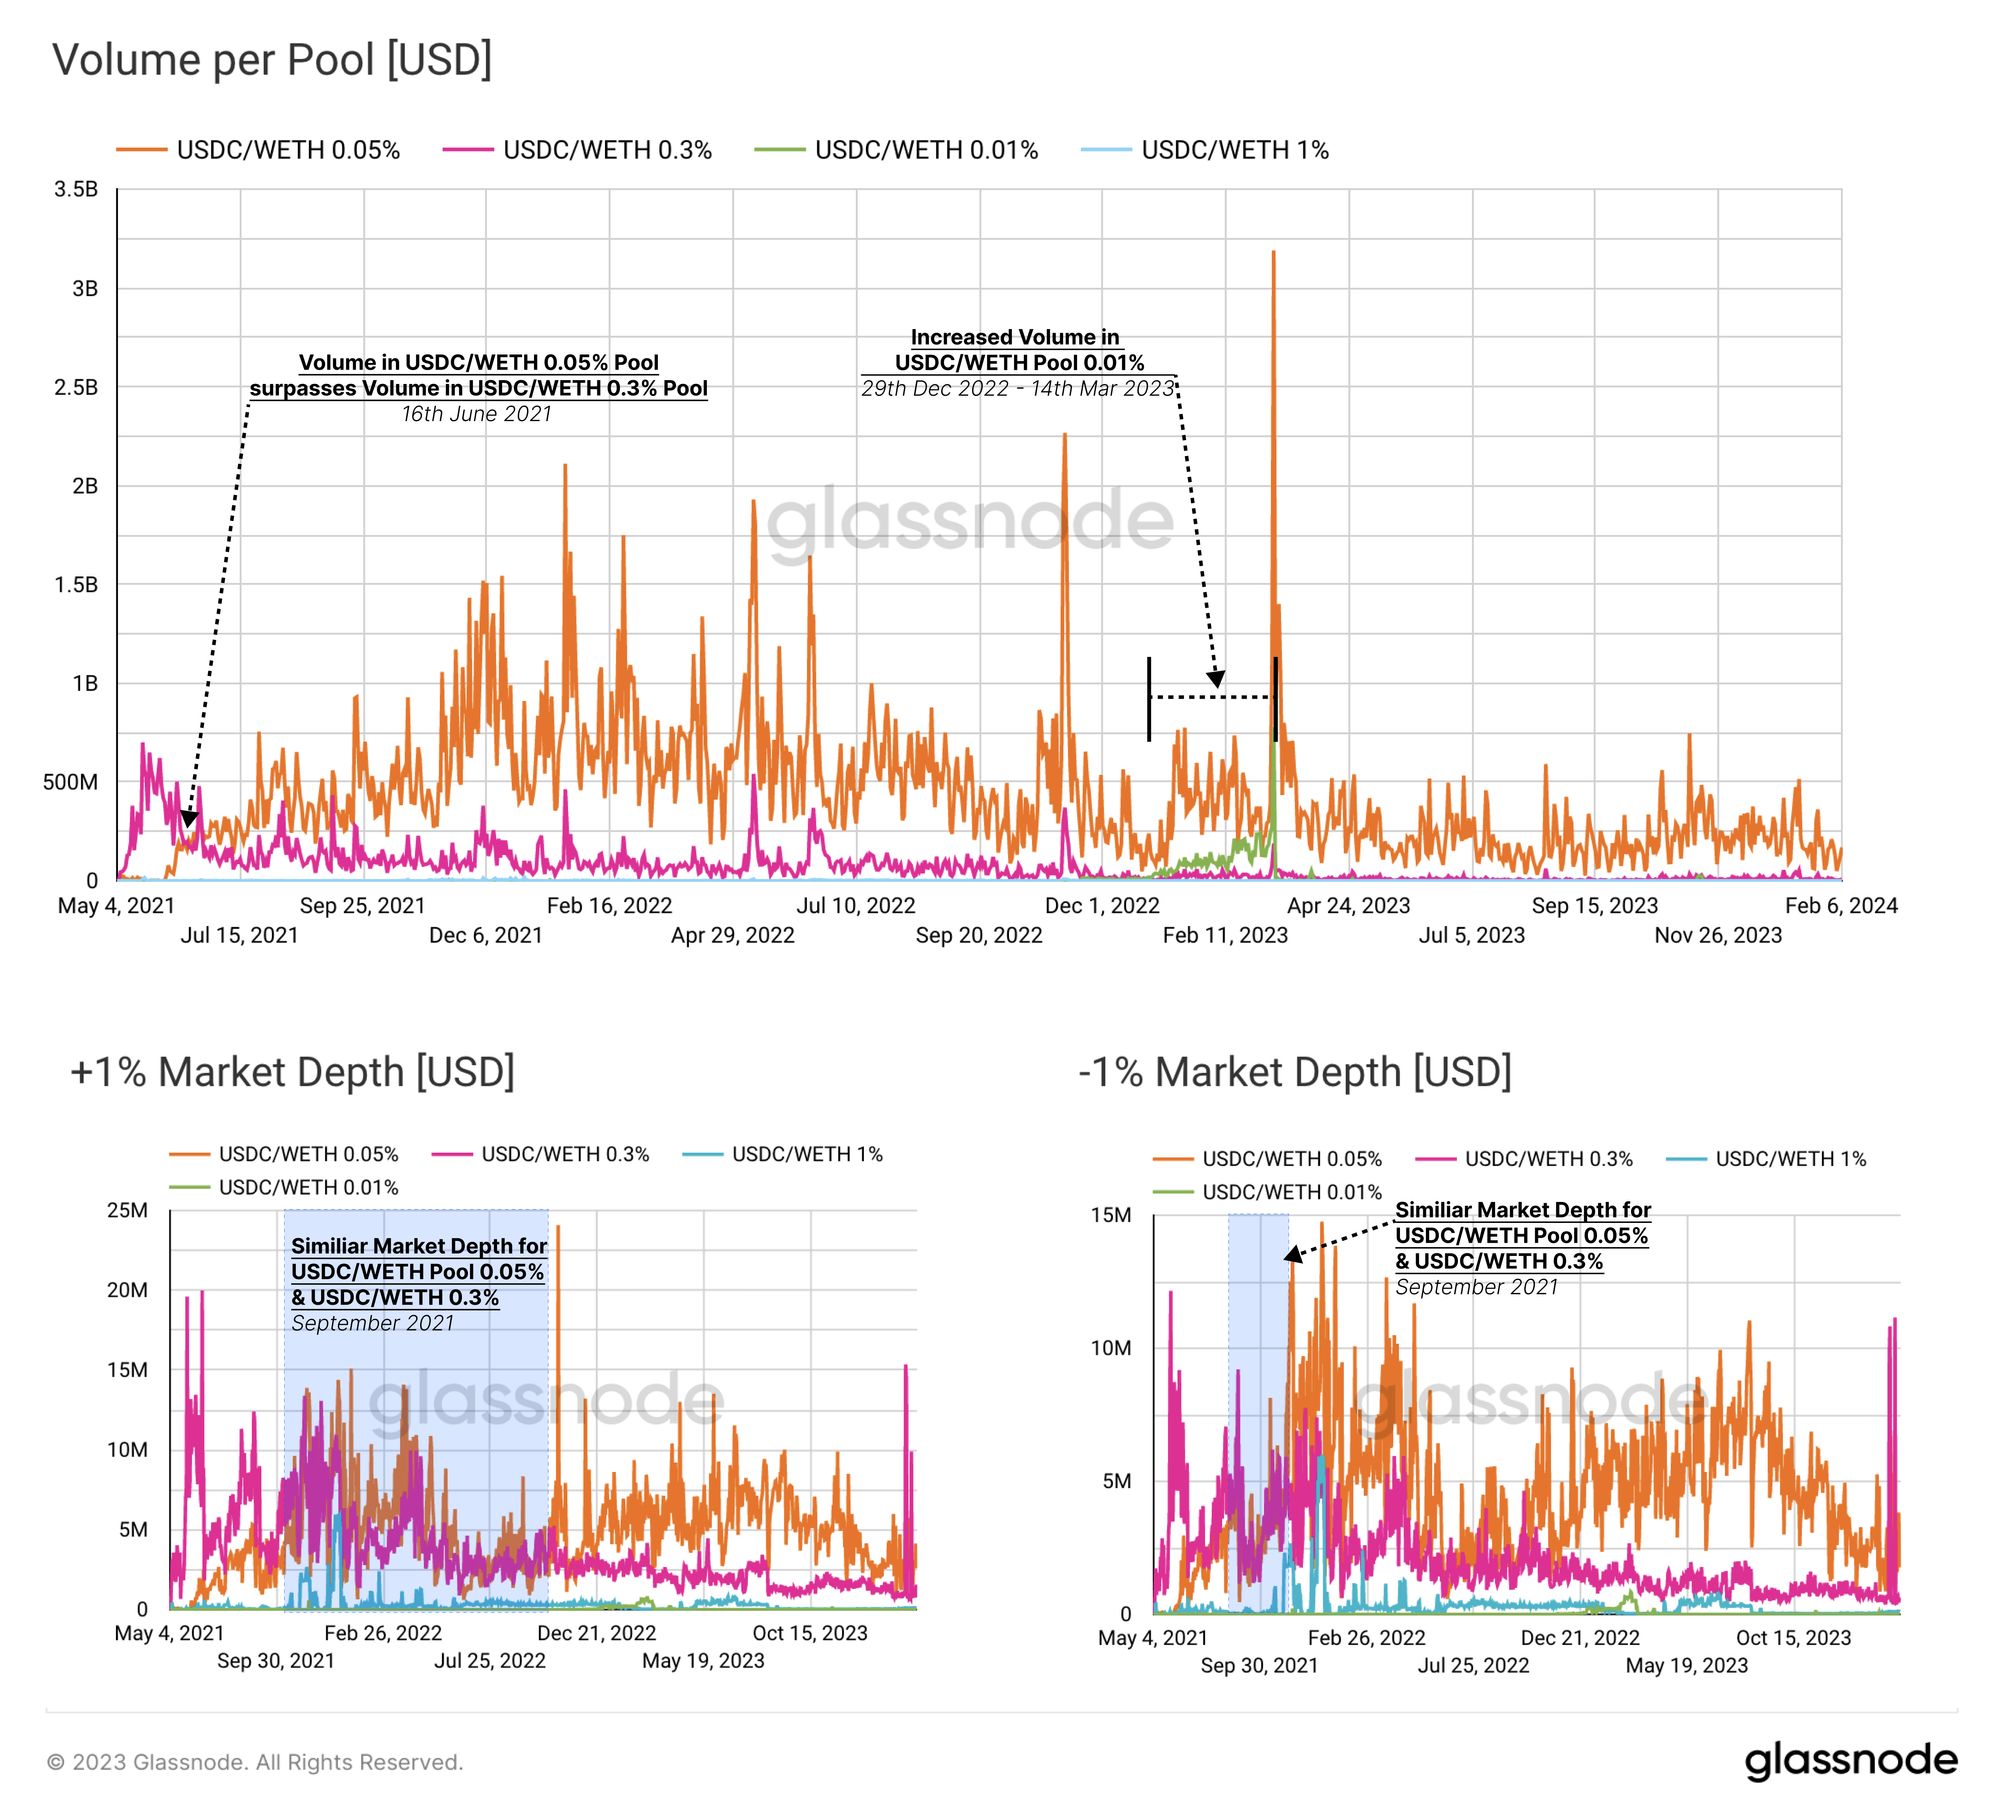
When comparing volume with TVL, volume for the 0.03% tier pool had spiked some time before the TVL saw an equivalent uptick. From this, it seems that liquidity tends to move at a slower pace when following the volume between pools. However, this observation could also be explained by market makers reacting to changes in available fees, rather than trade volumes.
Fee revenue for LPs is calculated based on volume weighted by fee tiers. Thus, a lower trading volume within the 0.3% pool may still generate smaller revenue compared to the 0.05% pool if the latter has more than six times the trade volume.
As previously mentioned, pools compete for volume by using different fee tiers. Traders typically gravitate towards the middle tiers of 0.3% and 0.05%, often favouring the latter over time. Liquidity providers on the other hand tend to optimize for fees, which are determined by the product of the pool fee tier and trading volume, and tend to follow trading activity.
Capital Efficiency in Liquidity Pools
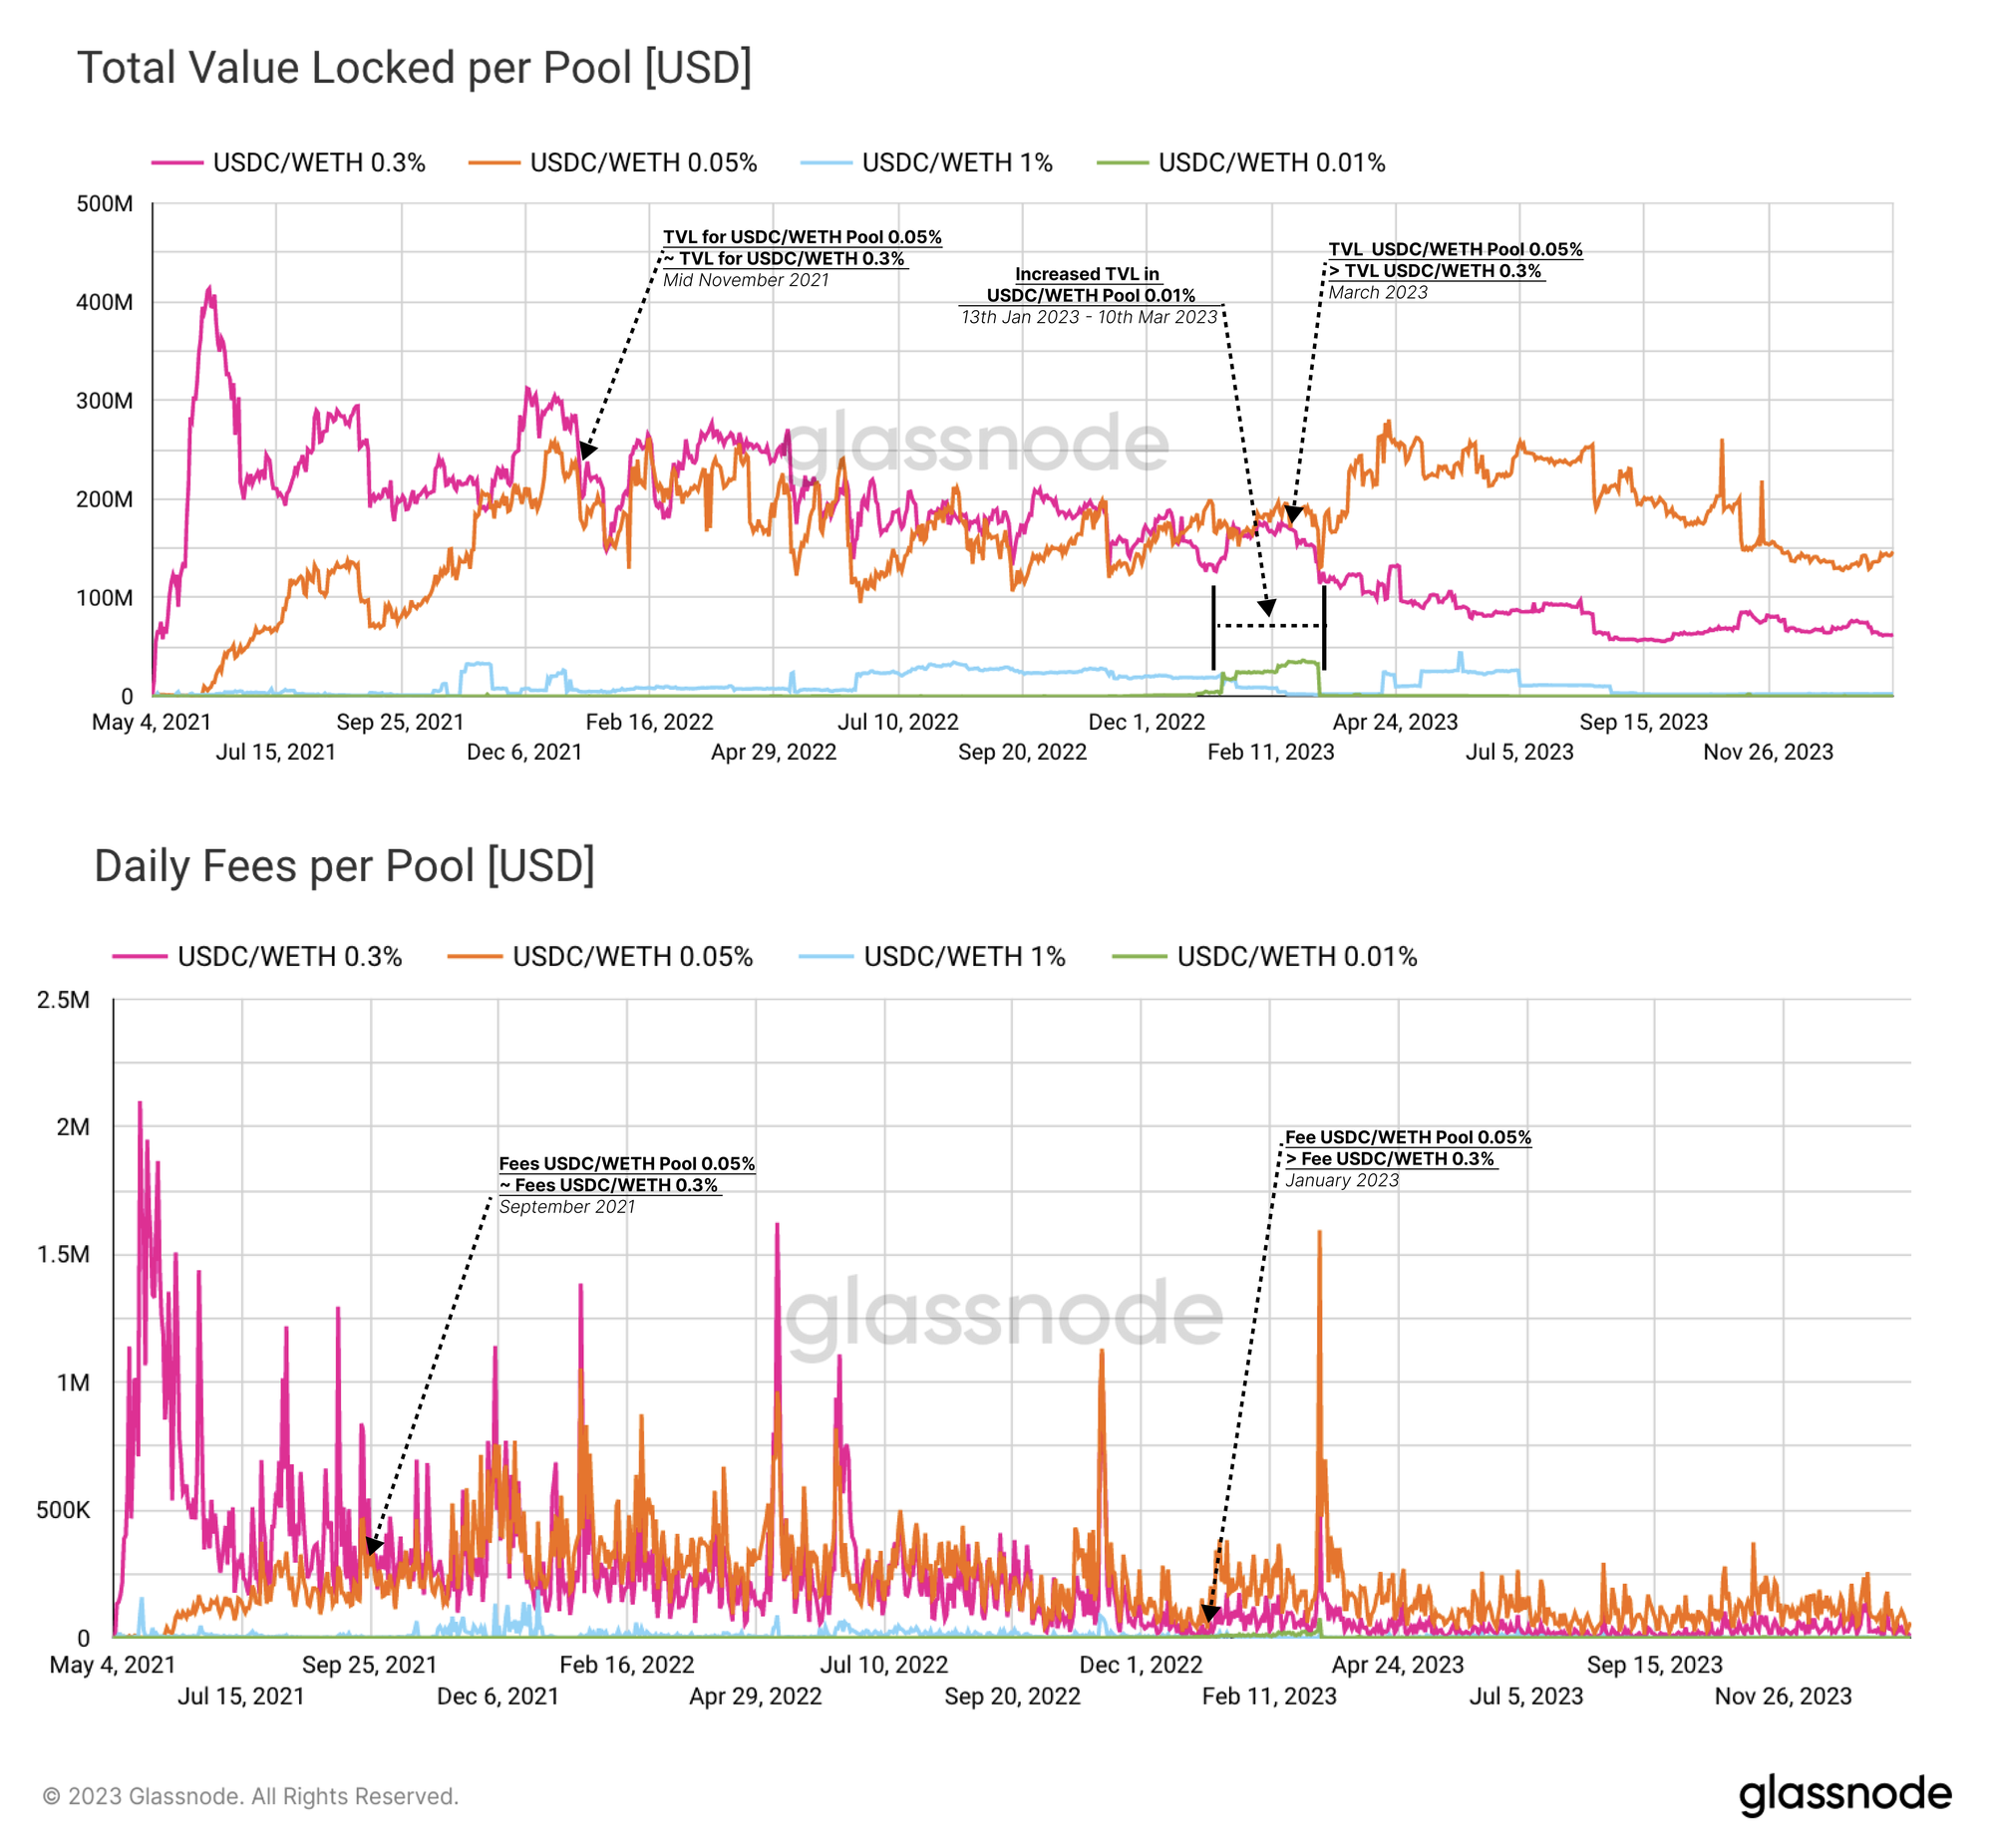
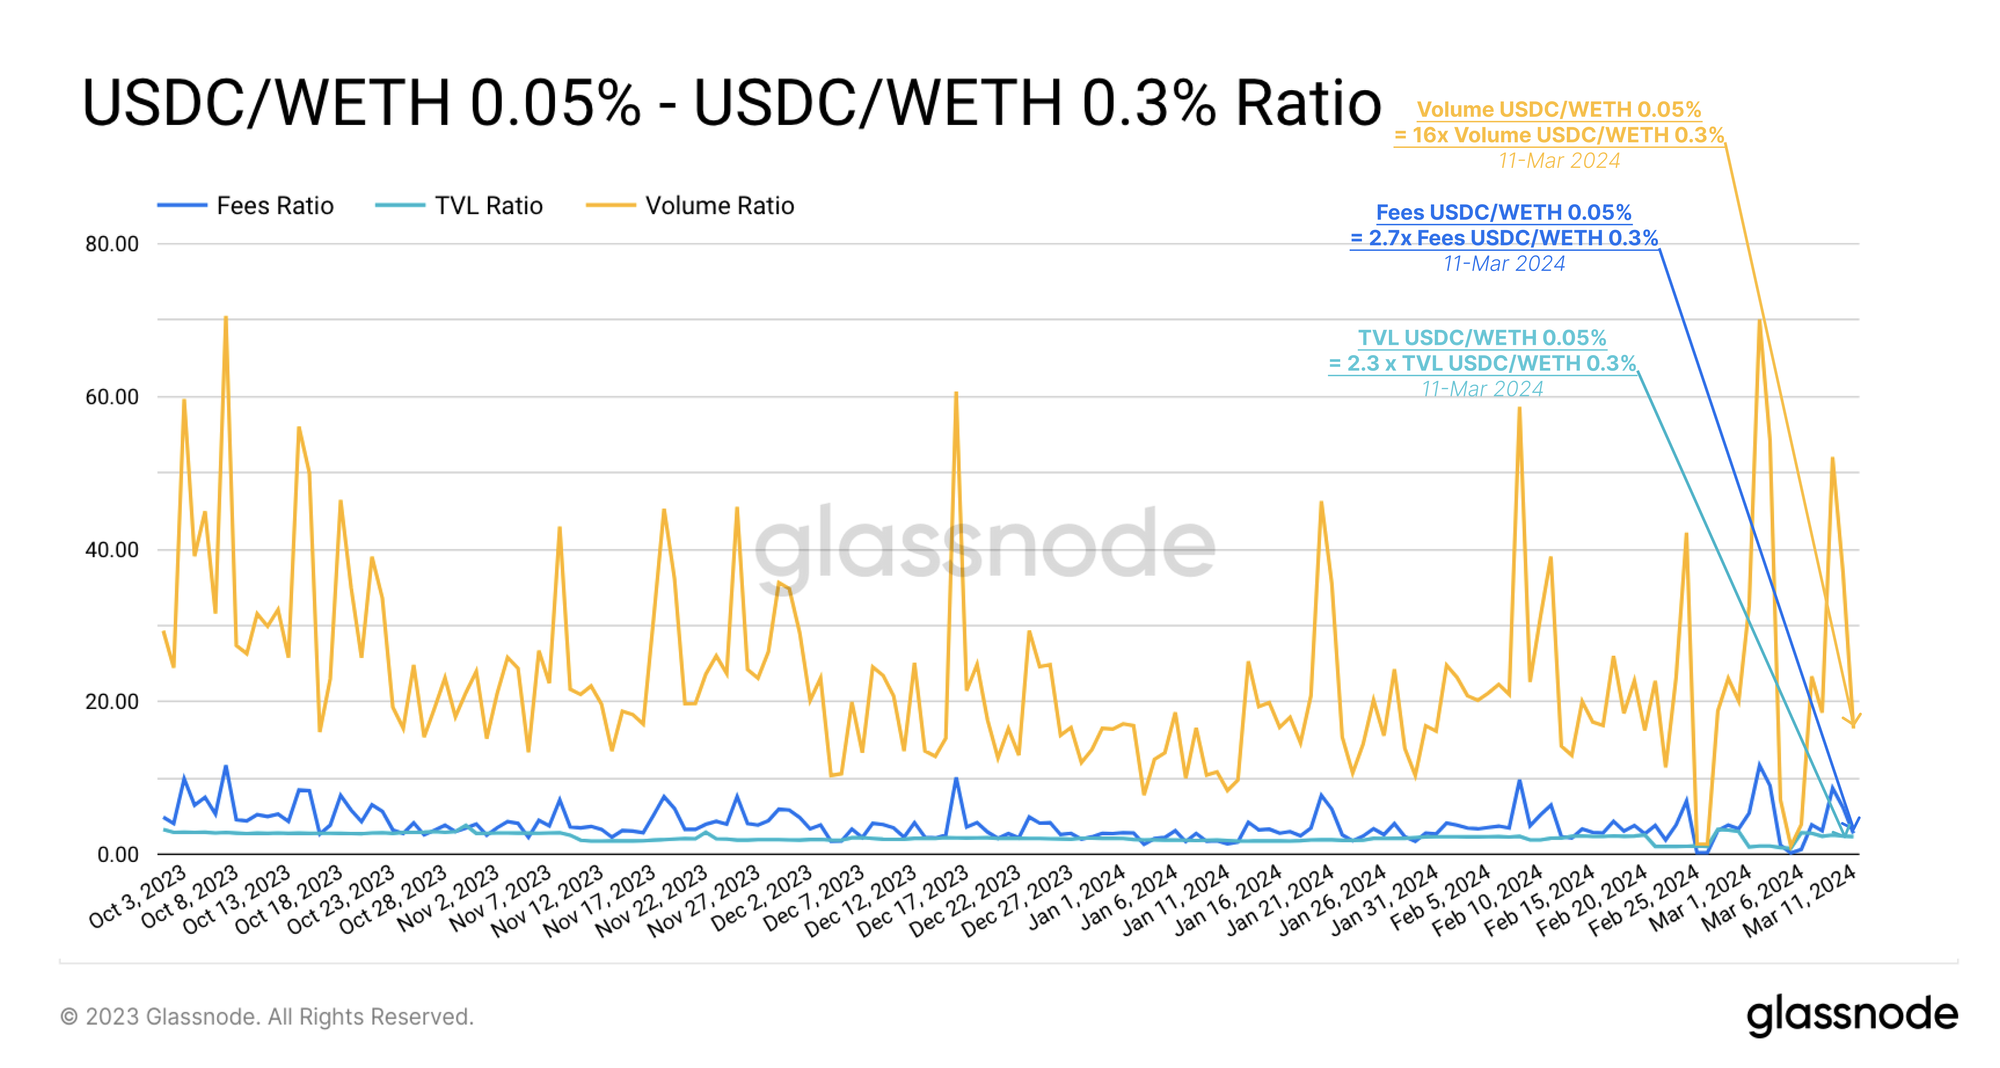
Another observation that stands out from the above charts is the ratio of volume, TVL, and fees between the two most active pools. Currently, the volume in the USDC/WETH 0.05% Pool is 16 times higher than the volume in the USDC/WETH 0.3% pool. In contrast, TVL in the 0.05% pool is only 2.3 times higher than in the 0.3% pool.
However, this doesn't consider the concentration of liquidity. As a reminder, liquidity in the Uniswap v3 protocol is distributed into specific price ranges by LPs. Only trading activity within each LPs' liquidity price ranges generates fee revenue fees (if you are unfamiliar with Uniswap's concentrated liquidity features, please refer to our Primer about Uniswap.)
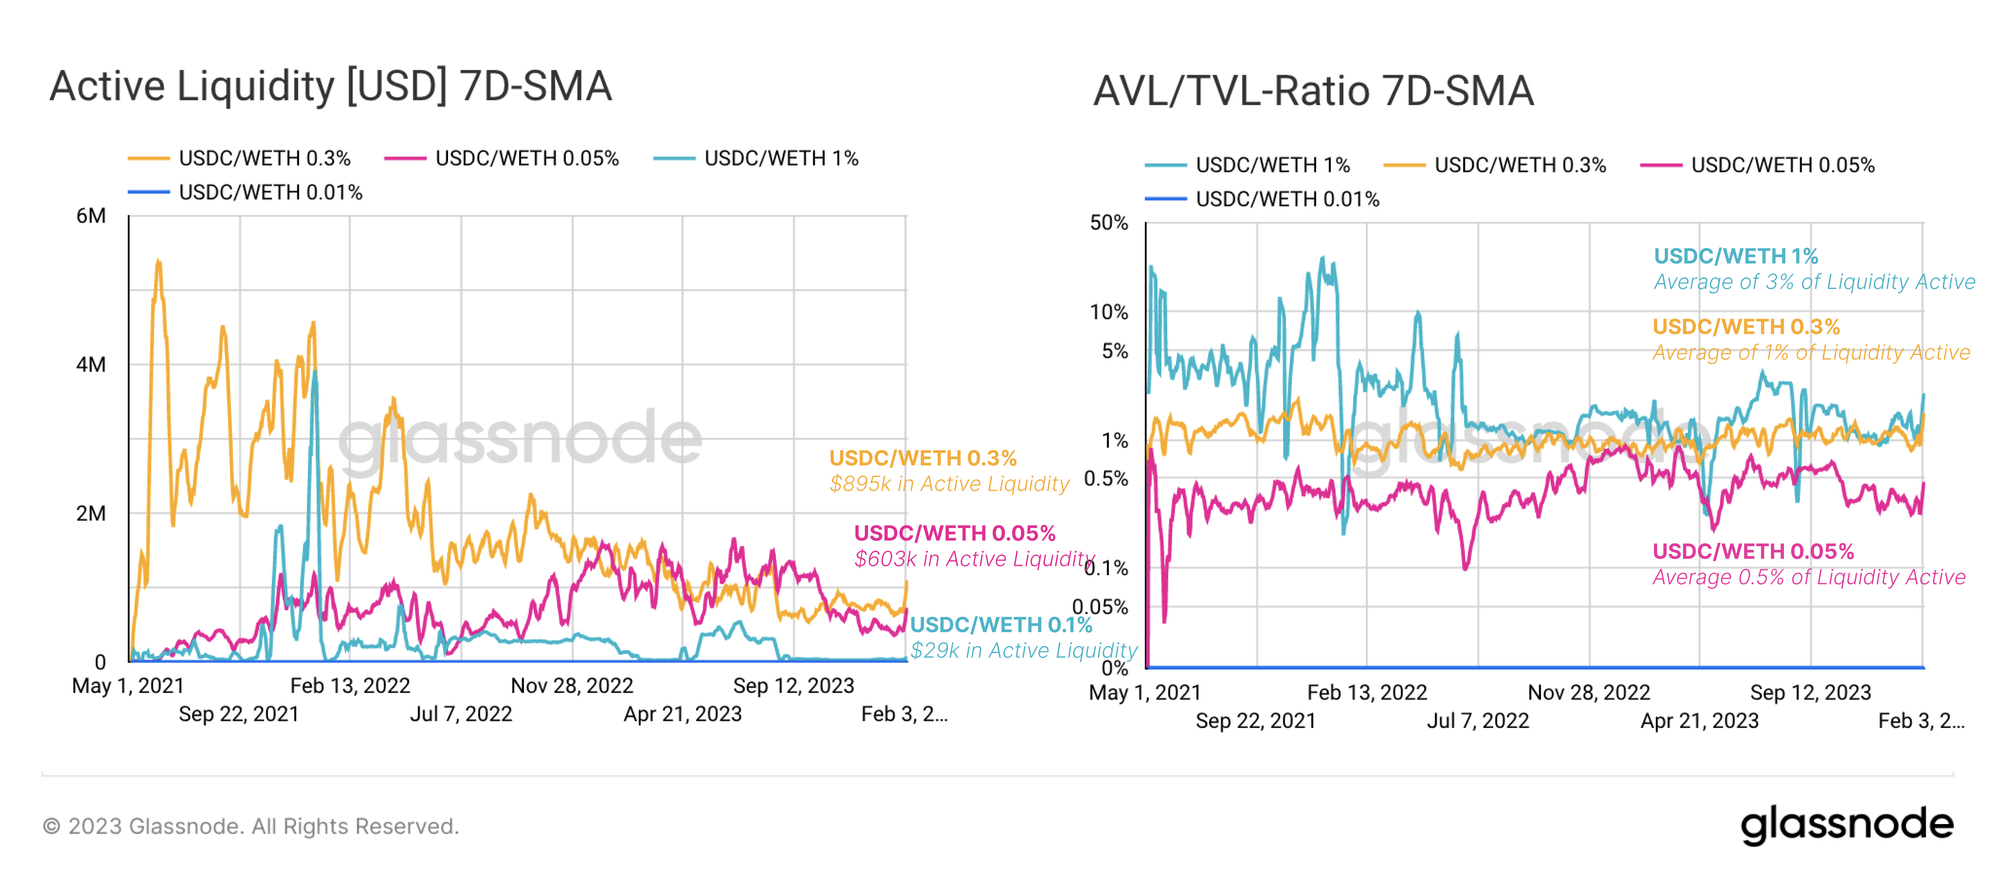
In order to measure the effects of liquidity concentration at Glassnode, we've popularized a metric to assess capital efficiency within a pool. This metric is referred to as Active Value Locked (AVL), and it calculates the average reserves being actively applied within a specific pool each day.
In the charts below we can see that AVL in the 1% pool has been the most actively managed, and recorded a higher concentration of liquidity for the majority of the past two years. On average, around 5% of the liquidity of the pool is actively managed in this pool.
In the 0.3% pool, a fairly consistent 1% of the available liquidity is active, whilst in the 0.5% pool, it averages closer to 0.5% of total liquidity. From this, we can conclude that both pools are dominated by a higher degree of passive market making, with only a sub-set actively managing their LP positions.
Dancing Around Fees
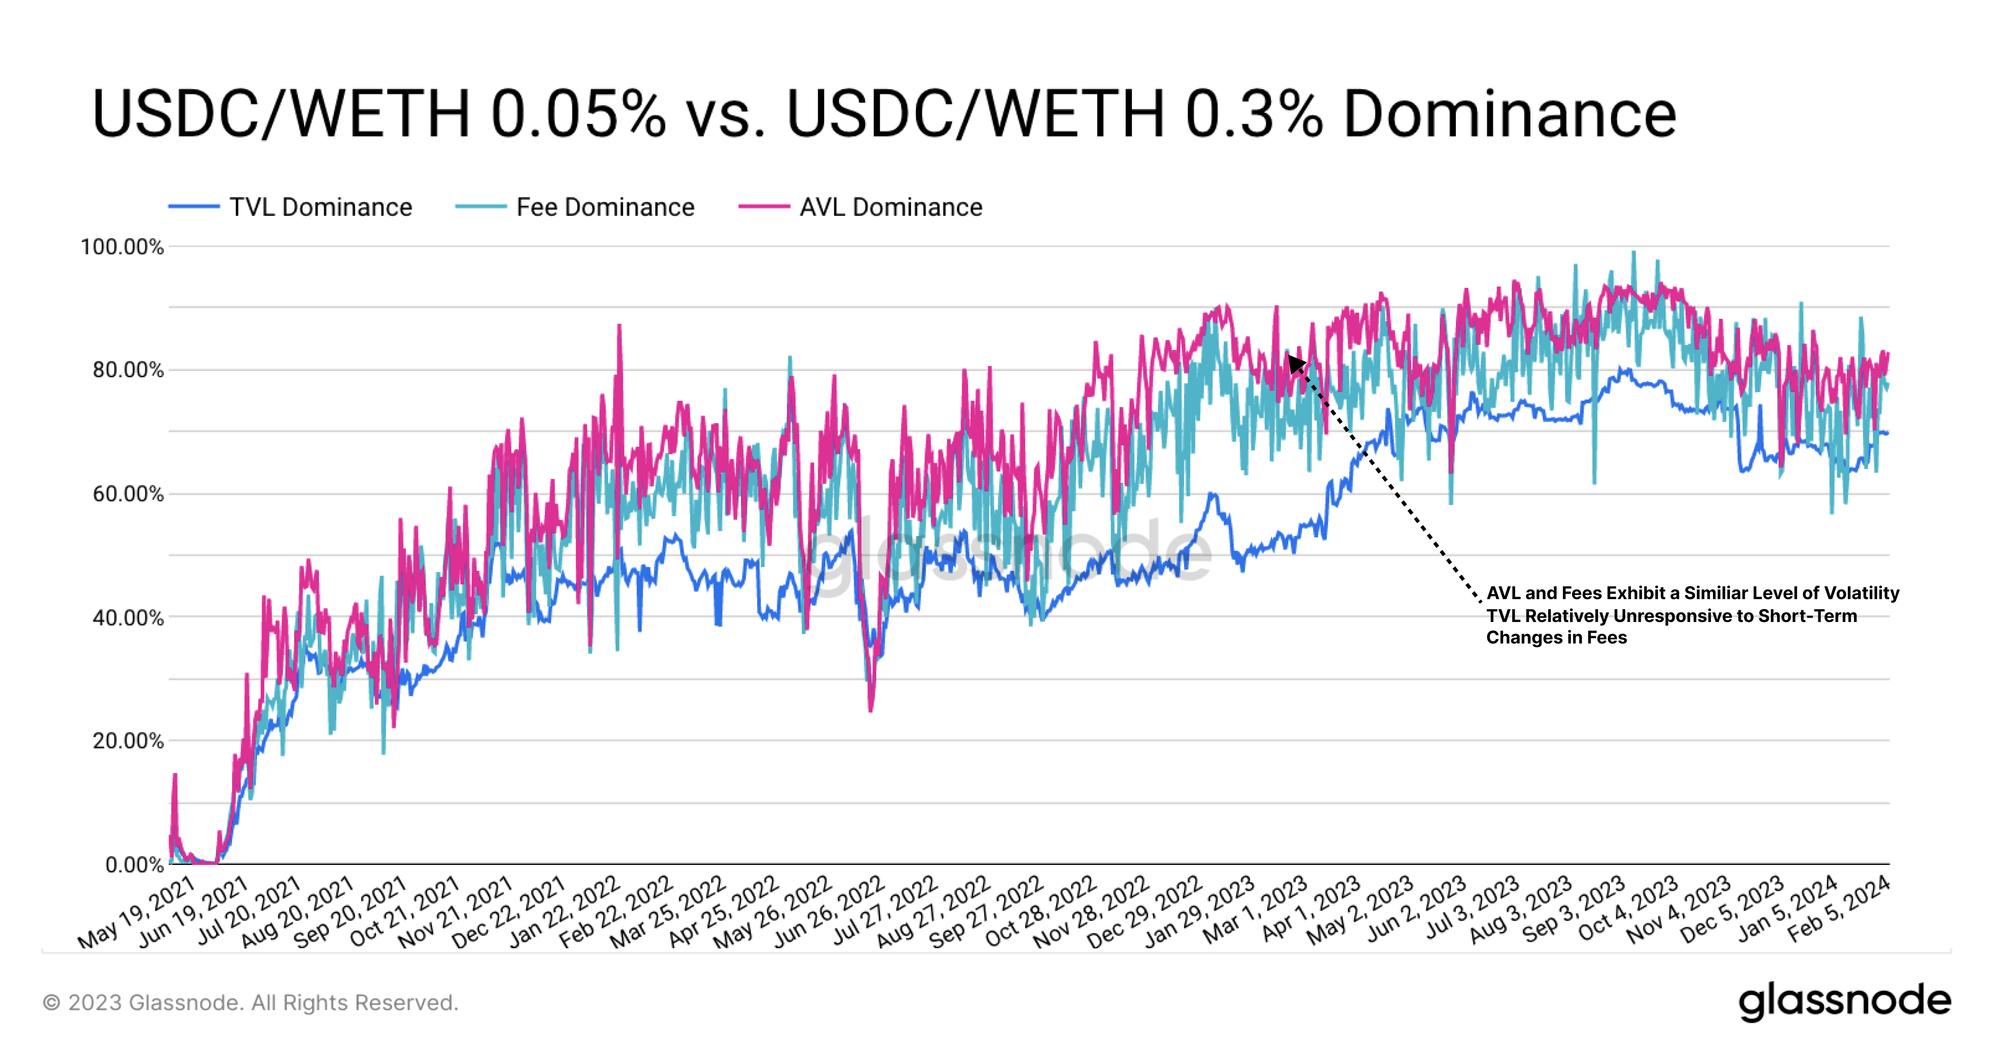
In this final section, we will assess the profitability of the two primary USDC-WETH pools, denoted by the fee ratio. We can examine how shifts in profitability between these pools influence the TVL and AVL in each pool. This helps us evaluate the strategies employed by market makers and their optimization criteria.
The chart below illustrates the dominance of the 0.05% Pool vs. the 0.3% Pool for the three aforementioned metrics (TVL Dominance, AVL Dominance and Fee Dominance). The 0.05% has clearly become more dominant in attracting fees when compared to the 0.3% pool over time. Remarkably, AVL and fees exhibit similar levels of volatility, while TVL tends to be relatively unresponsive to short-term market dynamics.
This seems to indicate that LPs tend to adjust their liquidity concentration within a given pool in an immediate response to changes in profitability. It is also clear that market makers prefer to readjust their positions within a pool rather than shifting liquidity between poolsmakers' when optimizing for fees.
Hence, already existing liquidity in a pool seems to play a less important role in market makers' decision-making frameworks. This is a trend that we have again seen echoed across several major token-pairs.
To conclude, we will provide initial insights into the strategies that market makers deploy across both pools.
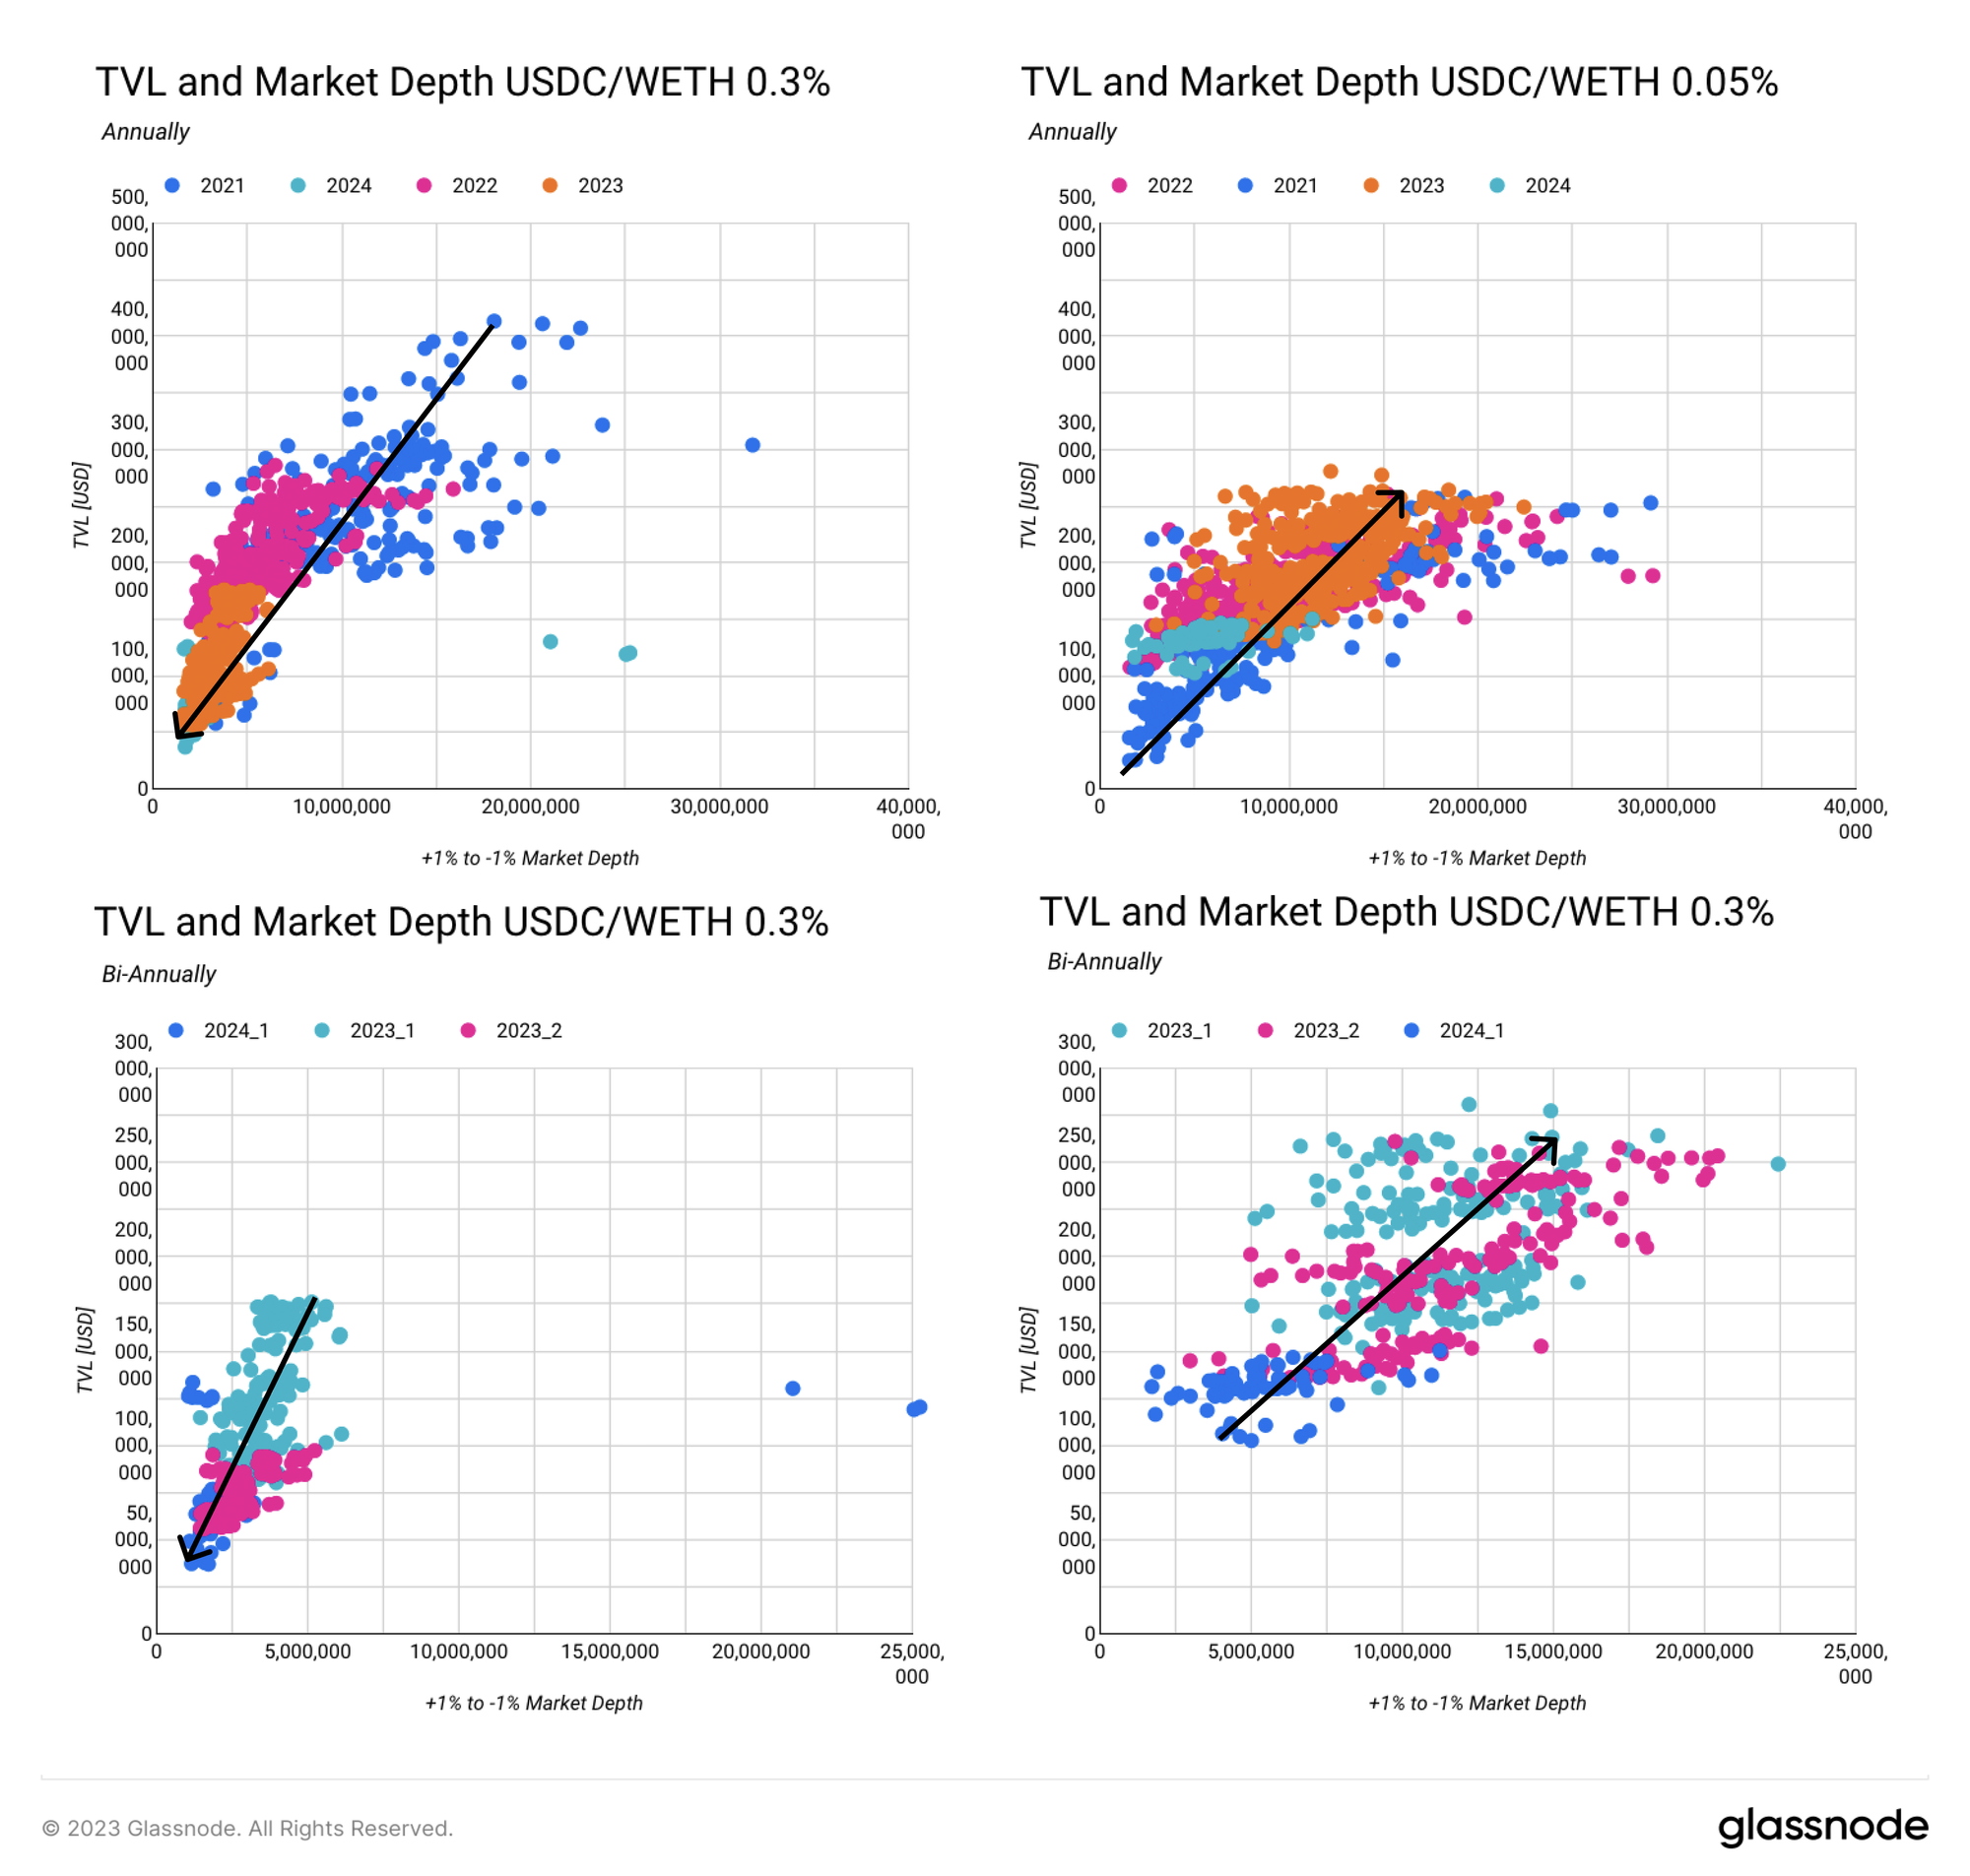
We observe a decrease in both TVL and market depth (1% price range) over the past three years in the USDC/WETH 0.03% pool (indicated by the shift from blue to orange). The steep slope suggests that liquidity was not only withdrawn but also distributed into wider ranges to accommodate potential price volatility. Consequently, liquidity in the 0.3% pool has become less concentrated over time.
In the 0.05% pool, we observe an opposite trend. There is an increase in both TVL and Market Depth during the same timeframe. The shape of the graph is somewhat less steep, more linear, and dispersed. The pool shows a relatively higher market depth around the 1% range. An increase in funds inflow correlates with higher liquidity concentration in the pool.
Since 2023, besides a downtrend in both TVL and market depth, there hasn't been much movement in the 0.3% pool's liquidity. The minimal dispersion suggests that liquidity providers are not actively managing their positions.
The 0.05% pool shows a contrasting trend and has exhibited an increase in both TVL and liquidity concentration since the market uptick in 2023. There is also notable fluctuation in spreads and overall market depth as a result. Market makers are more actively managing their positions in this pool, deploying and removing liquidity more frequently, as well as increasing or decreasing liquidity as needed.
This concludes this second chapter of our analysis into the market-making and trading mechanics of Uniswap. In an upcoming third chapter, we will highlight the degrees of actively managed liquidity positions, the various strategies used to provide liquidity, and the impact of JIT bots. You can find the third part here.
Disclaimer: This report does not provide any investment advice. All data is provided for information and educational purposes only. No investment decision shall be based on the information provided here and you are solely responsible for your own investment decisions.
Exchange balances presented are derived from Glassnode’s comprehensive database of address labels, which are amassed through both officially published exchange information and proprietary clustering algorithms. While we strive to ensure the utmost accuracy in representing exchange balances, it is important to note that these figures might not always encapsulate the entirety of an exchange’s reserves, particularly when exchanges refrain from disclosing their official addresses. We urge users to exercise caution and discretion when utilizing these metrics. Glassnode shall not be held responsible for any discrepancies or potential inaccuracies. Please read our Transparency Notice when using exchange data.
- Join our Telegram channel
- For on-chain metrics, dashboards, and alerts, visit Glassnode Studio
- For automated alerts on core on-chain metrics and activity on exchanges, visit our Glassnode Alerts Twitter
