BTC Market Pulse: Week 18
Spot demand and ETF participation are materially improving, Hot Capital Share is ticking higher, and profitability metrics have expanded notably. However, daily active addresses remain suppressed, suggesting organic network engagement is still rebuilding.


Overview
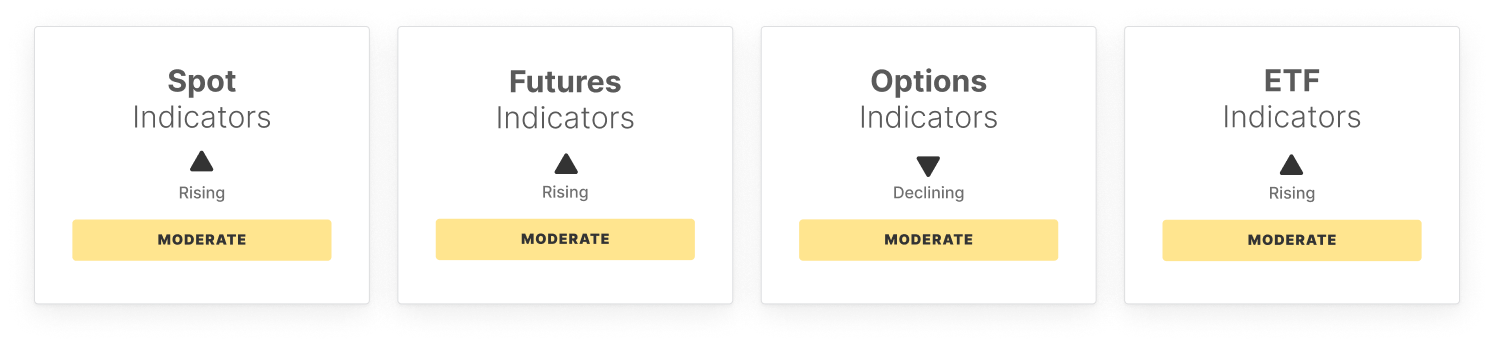
Bitcoin’s rally toward $94.7K has found increasingly stronger backing from both the spot market and ETF inflows, offering a more solid foundation compared to prior rebounds. Spot price momentum surged above the statistical high band, supported by improvements in spot volume and aggressive ETF inflows of $2.9B weekly. ETF trade volume also spiked, signaling that traditional finance participants are not just buying but actively positioning around the move.
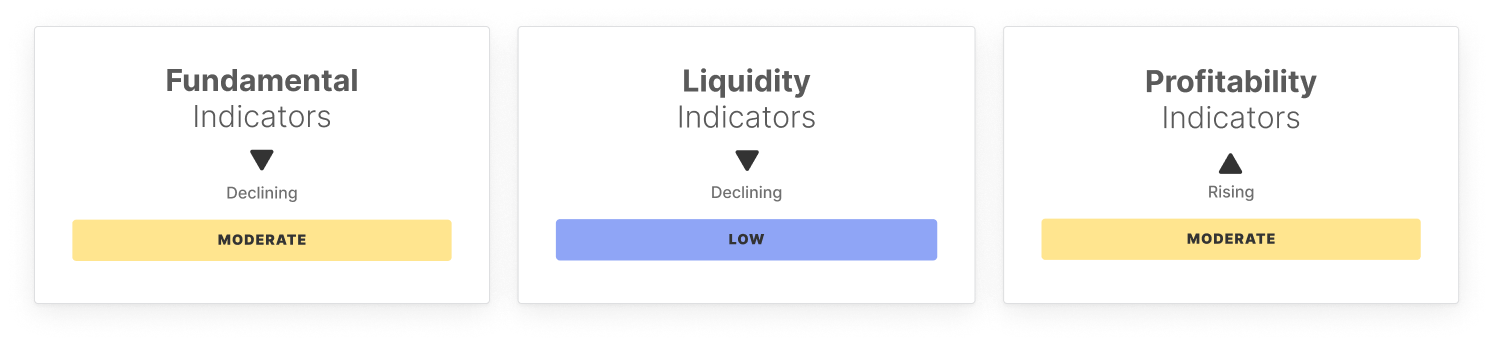
Signs of early FOMO are emerging, with the Hot Capital Share ticking higher and profitability metrics like Percent Supply in Profit (86%) and NUPL (0.53) expanding notably. However, while on-chain activity such as transfer volume and fees are recovering, daily active addresses remain suppressed, suggesting that full organic network engagement is still rebuilding.
In the Futures market, a complex dynamic is forming. Futures open interest rose steadily, showing patient buyers accumulating. At the same time, funding rates flipped deeply negative, signaling that aggressive short sellers have entered the market. Rising Perpetual CVD suggests taker-side buyers are still absorbing sell pressure.
This combination of elevated leverage, aggressive short positioning, and persistent taker demand creates a fragile but explosive setup. Should the rally sustain, short squeezes could drive a volatile extension higher; conversely, if momentum stalls, the market could see amplified swings as both sides unwind.
Overall, spot demand and ETF participation are materially improving, giving the rally more legitimacy. Yet, the growing signs of FOMO and leveraged imbalance in futures suggest that volatility risks remain elevated in the short term.
Off-Chain Indicators
On-Chain Indicators

- Follow us and reach out on Twitter
- Join our Telegram channel
- For on-chain metrics, dashboards, and alerts, visit Glassnode Studio
Disclaimer: This report does not provide any investment advice. All data is provided for information and educational purposes only. No investment decision shall be based on the information provided here and you are solely responsible for your own investment decisions.
Exchange balances presented are derived from Glassnode’s comprehensive database of address labels, which are amassed through both officially published exchange information and proprietary clustering algorithms. While we strive to ensure the utmost accuracy in representing exchange balances, it is important to note that these figures might not always encapsulate the entirety of an exchange’s reserves, particularly when exchanges refrain from disclosing their official addresses. We urge users to exercise caution and discretion when utilizing these metrics. Glassnode shall not be held responsible for any discrepancies or potential inaccuracies.
Please read our Transparency Notice when using exchange data.