Market Pulse: Week 30
With price pulling back slightly after touching a new all-time high, Bitcoin has hovered around $117k throughout the week. Capital flows remain robust. Profitability metrics have started to cool. Overall, market conditions reflect a healthy yet fragile balance.


Overview
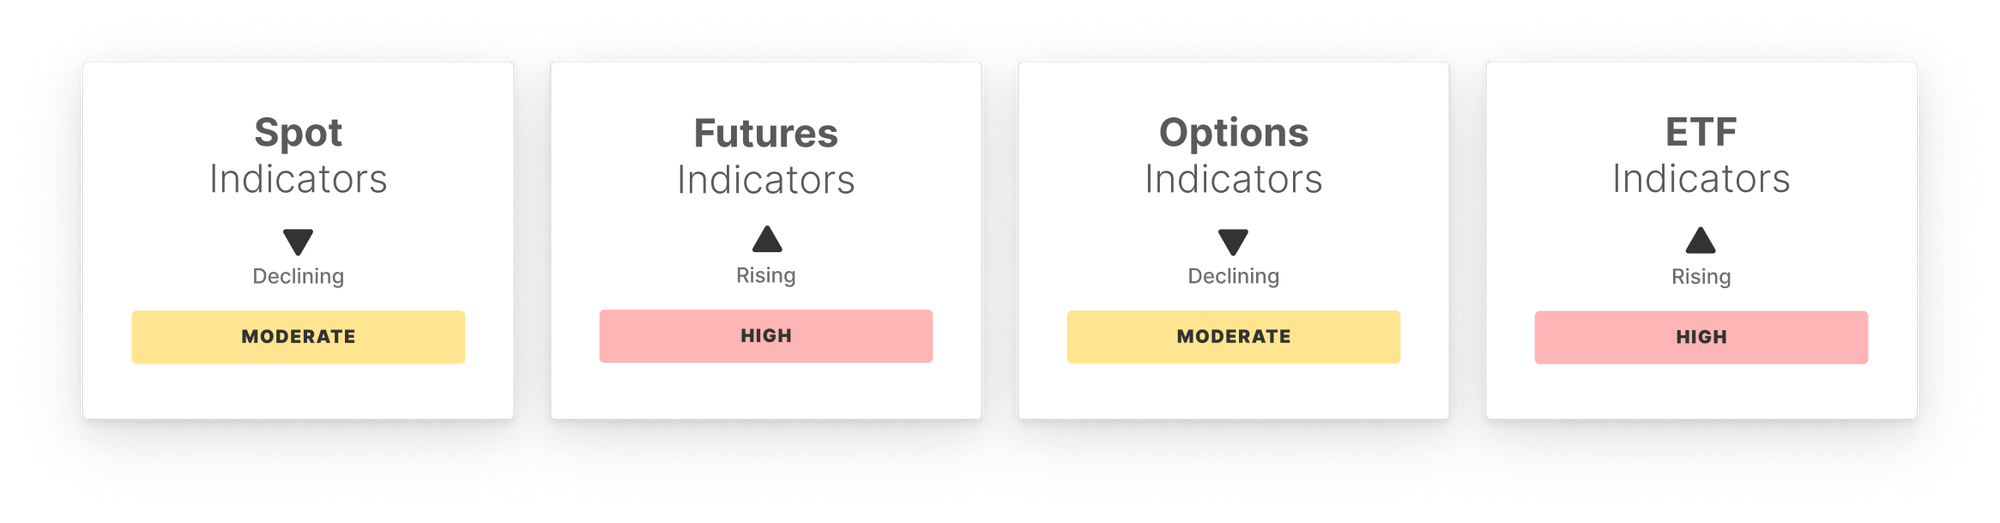
With price pulling back slightly after touching a new all-time high, Bitcoin has hovered around $117k throughout the week. In the spot market, RSI has cooled from overheated levels, and spot CVD flipped sharply negative, signaling aggressive selling pressure. Despite this, spot volume remains elevated, suggesting continued market engagement and demand resilience.
In the futures market, Open Interest has surged above its high band, accompanied by rising funding rates, evidence of growing speculative positioning. However, the sharp reversal in Perpetual CVD indicates substantial profit-taking, and possibly seller exhaustion, pointing to a market more vulnerable to short-term volatility.
Options markets remain highly active, with Open Interest climbing further.
Meanwhile, a narrowing volatility spread and persistent negative skew reflect a market still tilted toward bullish speculation, yet doing so with increasing caution. Traders appear optimistic but are beginning to hedge downside risk.
US-listed Bitcoin spot ETFs saw a notable rise in net inflows and trading volumes, indicating strong institutional demand. Although trading activity slightly eased from its peak, the ETF MVRV ratio has dipped modestly, hinting at early stages of profit realization while still signaling healthy investor positioning.
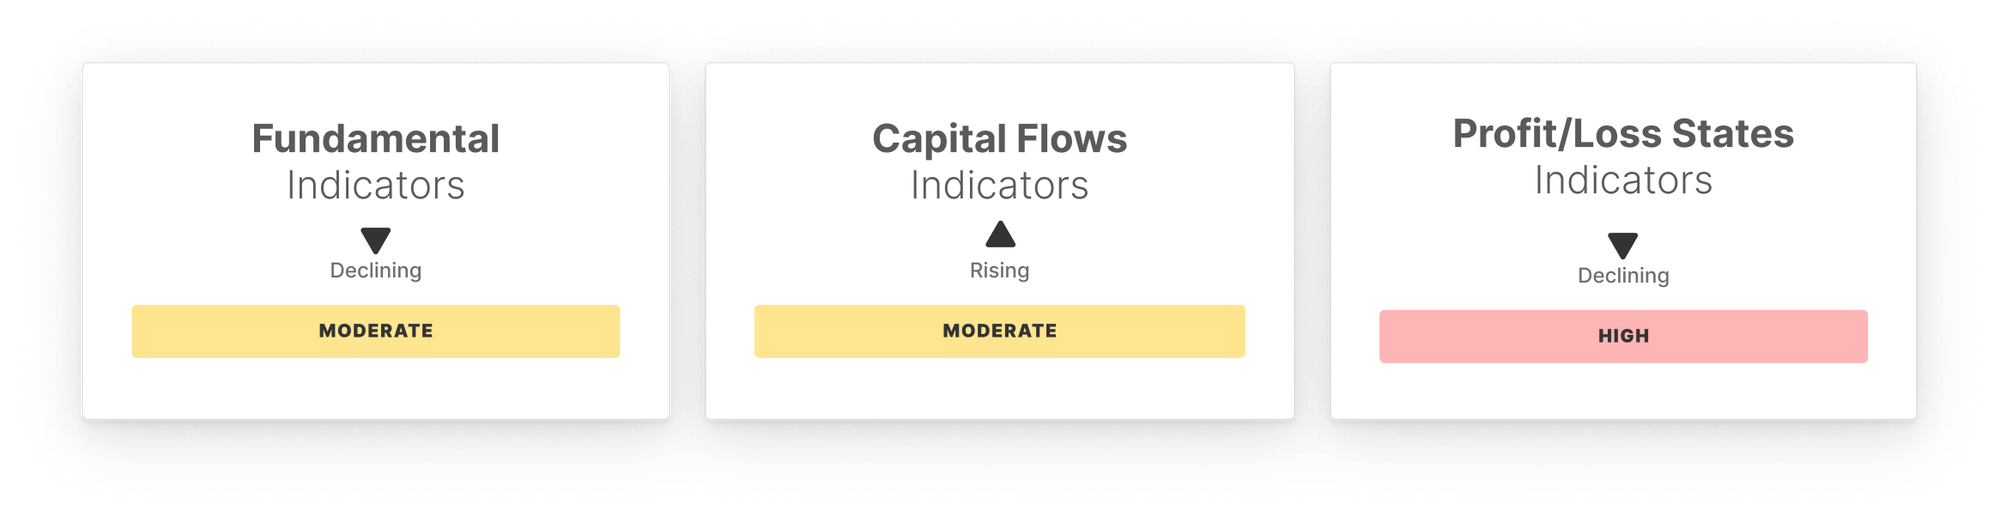
Network activity saw mixed developments. Daily active addresses and fee volume declined, signaling a softening in retail or transactional demand. However, entity-adjusted transfer volume spiked sharply, pointing to large-scale capital movement - likely reflecting strategic reallocations by larger market participants.
Capital flows remain robust. Realized Cap Change hit a new cycle high, while Hot Capital Share and the STH-to-LTH Supply Ratio both rose, reflecting a modest increase in speculative participation without displacing the do zminance of long-term holders. The market structure remains balanced for now.
Profitability metrics have started to cool. The percentage of supply in profit and unrealized profit both declined slightly but remain in euphoric territory. The Realized Profit to Loss Ratio also pulled back, suggesting that while most investors remain in profit, some are starting to de-risk in light of recent gains.
Overall, market conditions reflect a healthy yet fragile balance. Seller exhaustion appears likely and ready for another potential leg up, but if profitability continues to weaken, the market may transition into a broader consolidation phase as sentiment cools and positioning normalizes.
Off-Chain Indicators
On-Chain Indicators

- Follow us and reach out on X
- Join our Telegram channel
- For on-chain metrics, dashboards, and alerts, visit Glassnode Studio
Disclaimer: This report does not provide any investment advice. All data is provided for information and educational purposes only. No investment decision shall be based on the information provided here and you are solely responsible for your own investment decisions.
Exchange balances presented are derived from Glassnode’s comprehensive database of address labels, which are amassed through both officially published exchange information and proprietary clustering algorithms. While we strive to ensure the utmost accuracy in representing exchange balances, it is important to note that these figures might not always encapsulate the entirety of an exchange’s reserves, particularly when exchanges refrain from disclosing their official addresses. We urge users to exercise caution and discretion when utilizing these metrics. Glassnode shall not be held responsible for any discrepancies or potential inaccuracies.
Please read our Transparency Notice when using exchange data.