Quantifying Short-Term and Long-Term Holder Bitcoin Supply
We introduce a new methodology to classify Bitcoin supply owned by long-term investors and short-term traders, and create a set of on-chain metrics that show when these two investor types are in a state of profit or loss.

By Kilian Heeg and Rafael Schultze-Kraft
To understand investor behaviour from an on-chain perspective, it is crucial to differentiate between Long-Term Holders (LTH, "investors") and Short-Term Holders (STH, "traders").
While traders aim to "beat the market" and exploit price fluctuations on short time scales, long-term investors have a low time preference and are in for the long haul – remaining of the conviction that BTC will see future price appreciation. These market participants HODL over long time frames (A True HODLer Does Not Sell Their Coin), or only temporarily decrease their bitcoin positions in bull markets for profit-taking ("Swing HODLers").
But how can such different behaviours be quantified, and what conclusions with respect to the market can be drawn from this?
In the present work we introduce a new methodology to classify the amount of Bitcoin supply owned by these two investor types, and we create a set of on-chain metrics that show when long-term and short-term holders are in a state or profit or loss.
Classifying Long-Term Holders (LTH) and Short-Term Holders (STH)
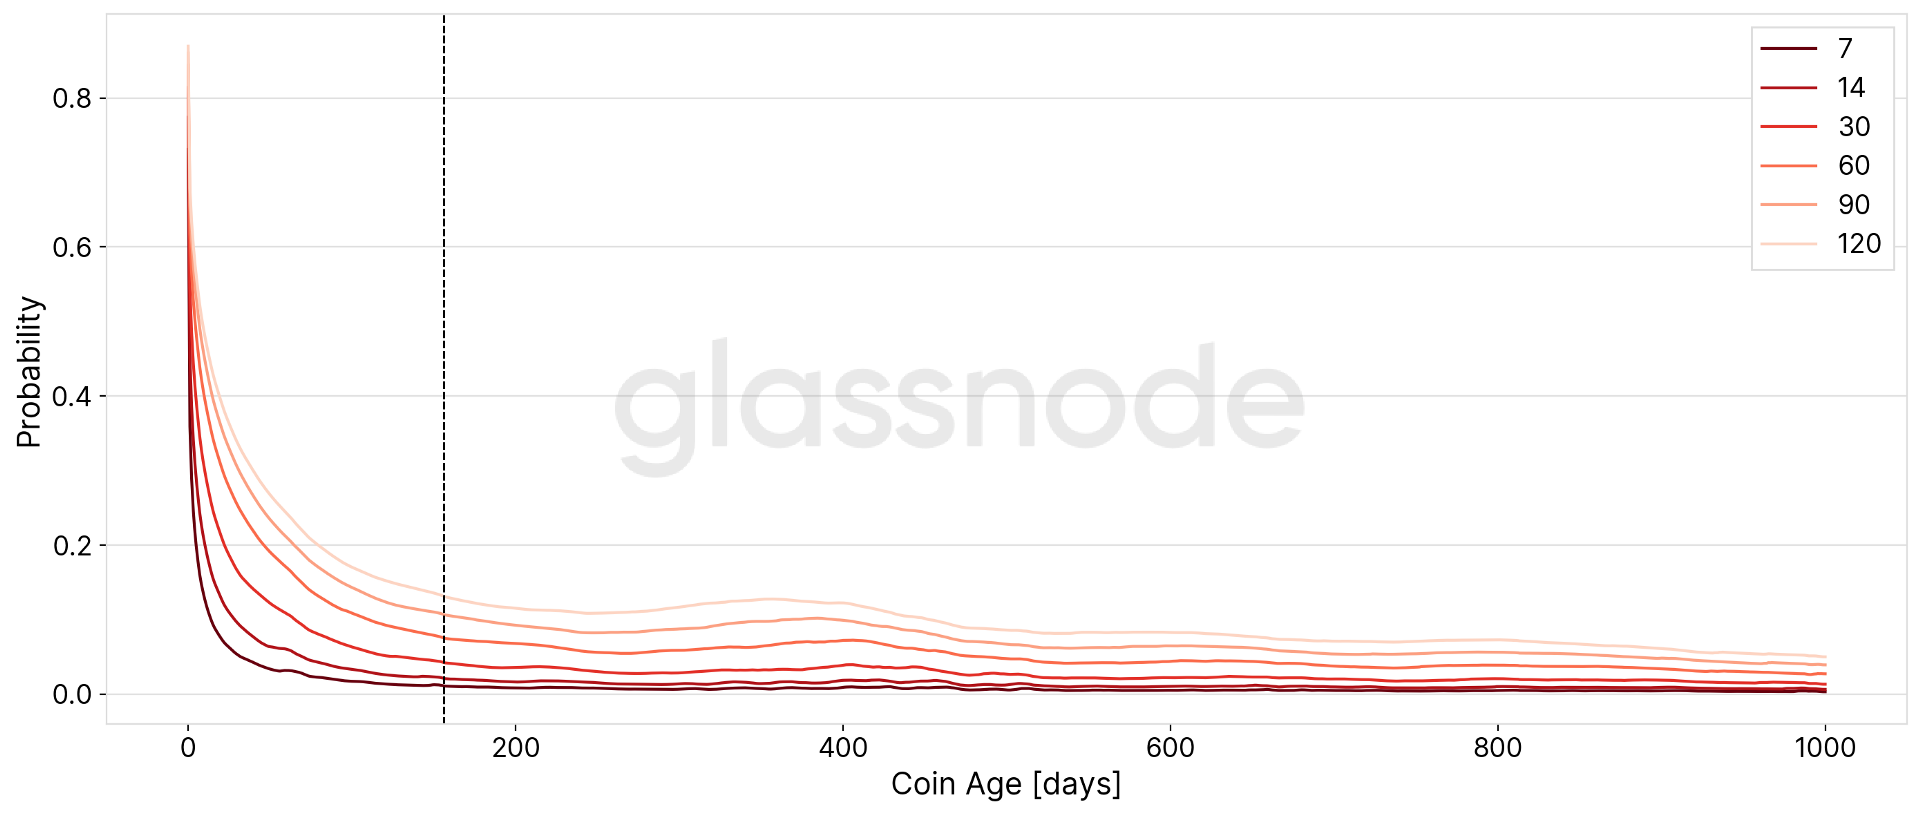
In previous works, we looked at the probability that an Unspent Transaction Output (UTXO) is spent within a certain time window, and identified 155 days as the threshold at which the slope of this probability flattens out – marking the level that classifies whether a bitcoin (UTXO) is being held by a long-term or short-term investor (Figure 1).
For more information, please refer to our previous work: Breaking up On-Chain Metrics for Short and Long Term Investors.
In the present work, we take this approach a step further. Instead of simply looking at UTXOs, we analyze Bitcoin entities and the supply held on their respective wallets. To determine the amount of BTC owned by long- and short-term holders, we first considered the time since the (averaged) purchasing date for each entity: If this duration exceeds 155 days (the above-mentioned threshold derived in our previous analysis), then the entity is considered to be a long-term holder.
In a second step, we refined this sharp classification threshold and turned it into a smooth curve of weighting factors. In particular, we used a logistic function with a midpoint of 155 days and a transition width of 10 days.
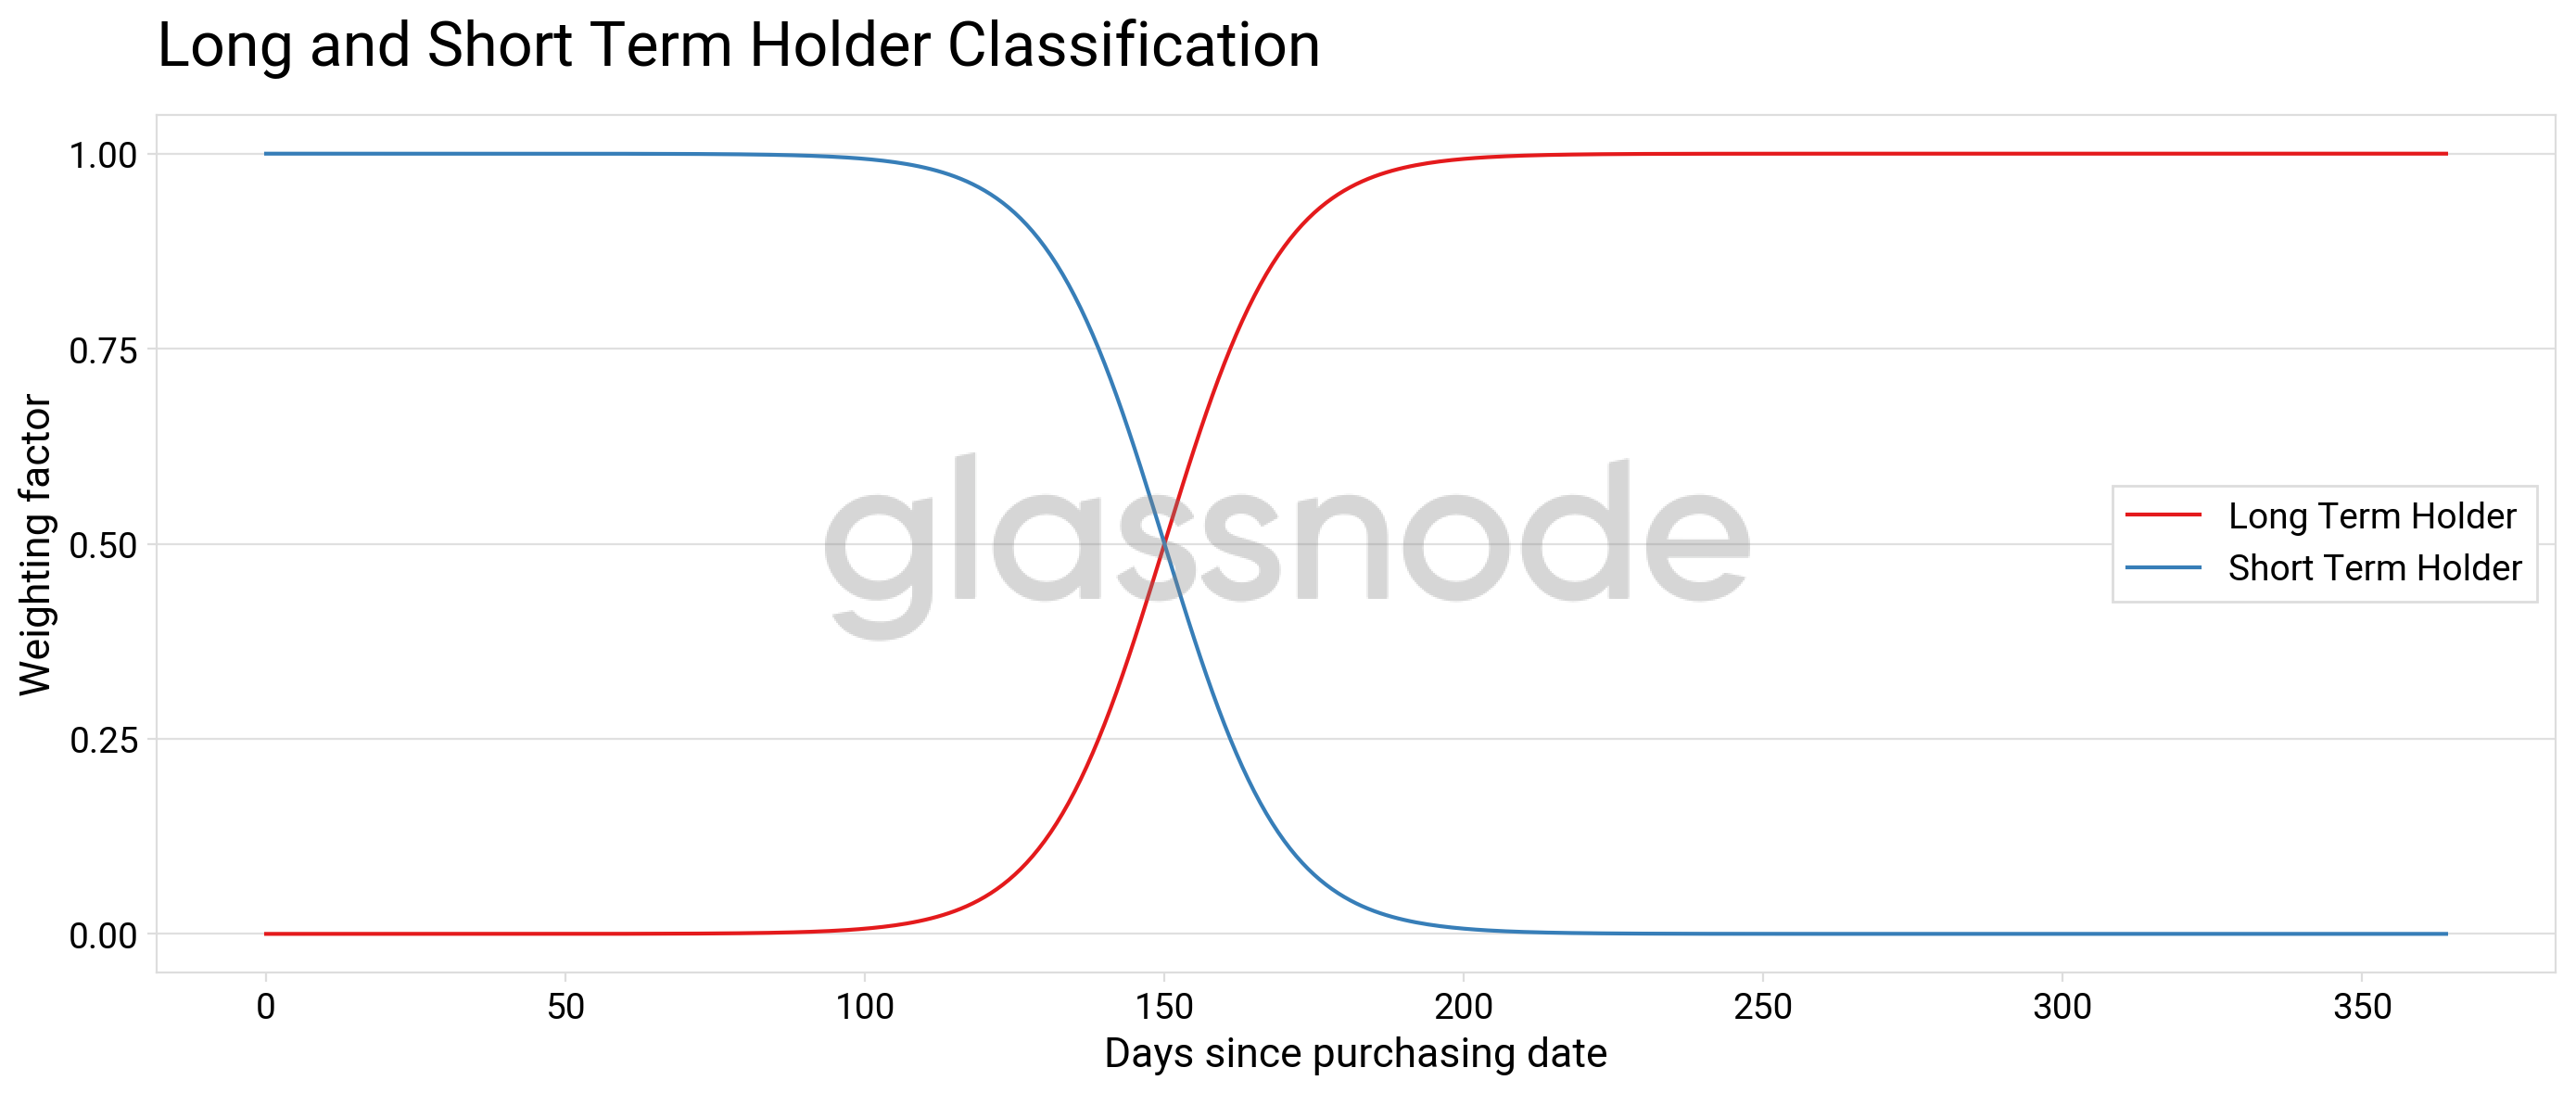
As a result, an entity's balance now equally contributes to LTH and STH supply at 155 days, each with a share of 50%. In contrast, at around 177 days (around half year) after an entity acquires its BTC, 90% is attributed to the LTH supply. Using such a continuous transition between STH and LTH has the advantage that the resulting metrics are smoothed and don't suffer from artifacts related to a few hodlers suddenly crossing the sharp threshold.
Note: To further improve the data and better reflect the real hodler behaviour, Bitcoin supply held on exchanges is excluded from the analysis.
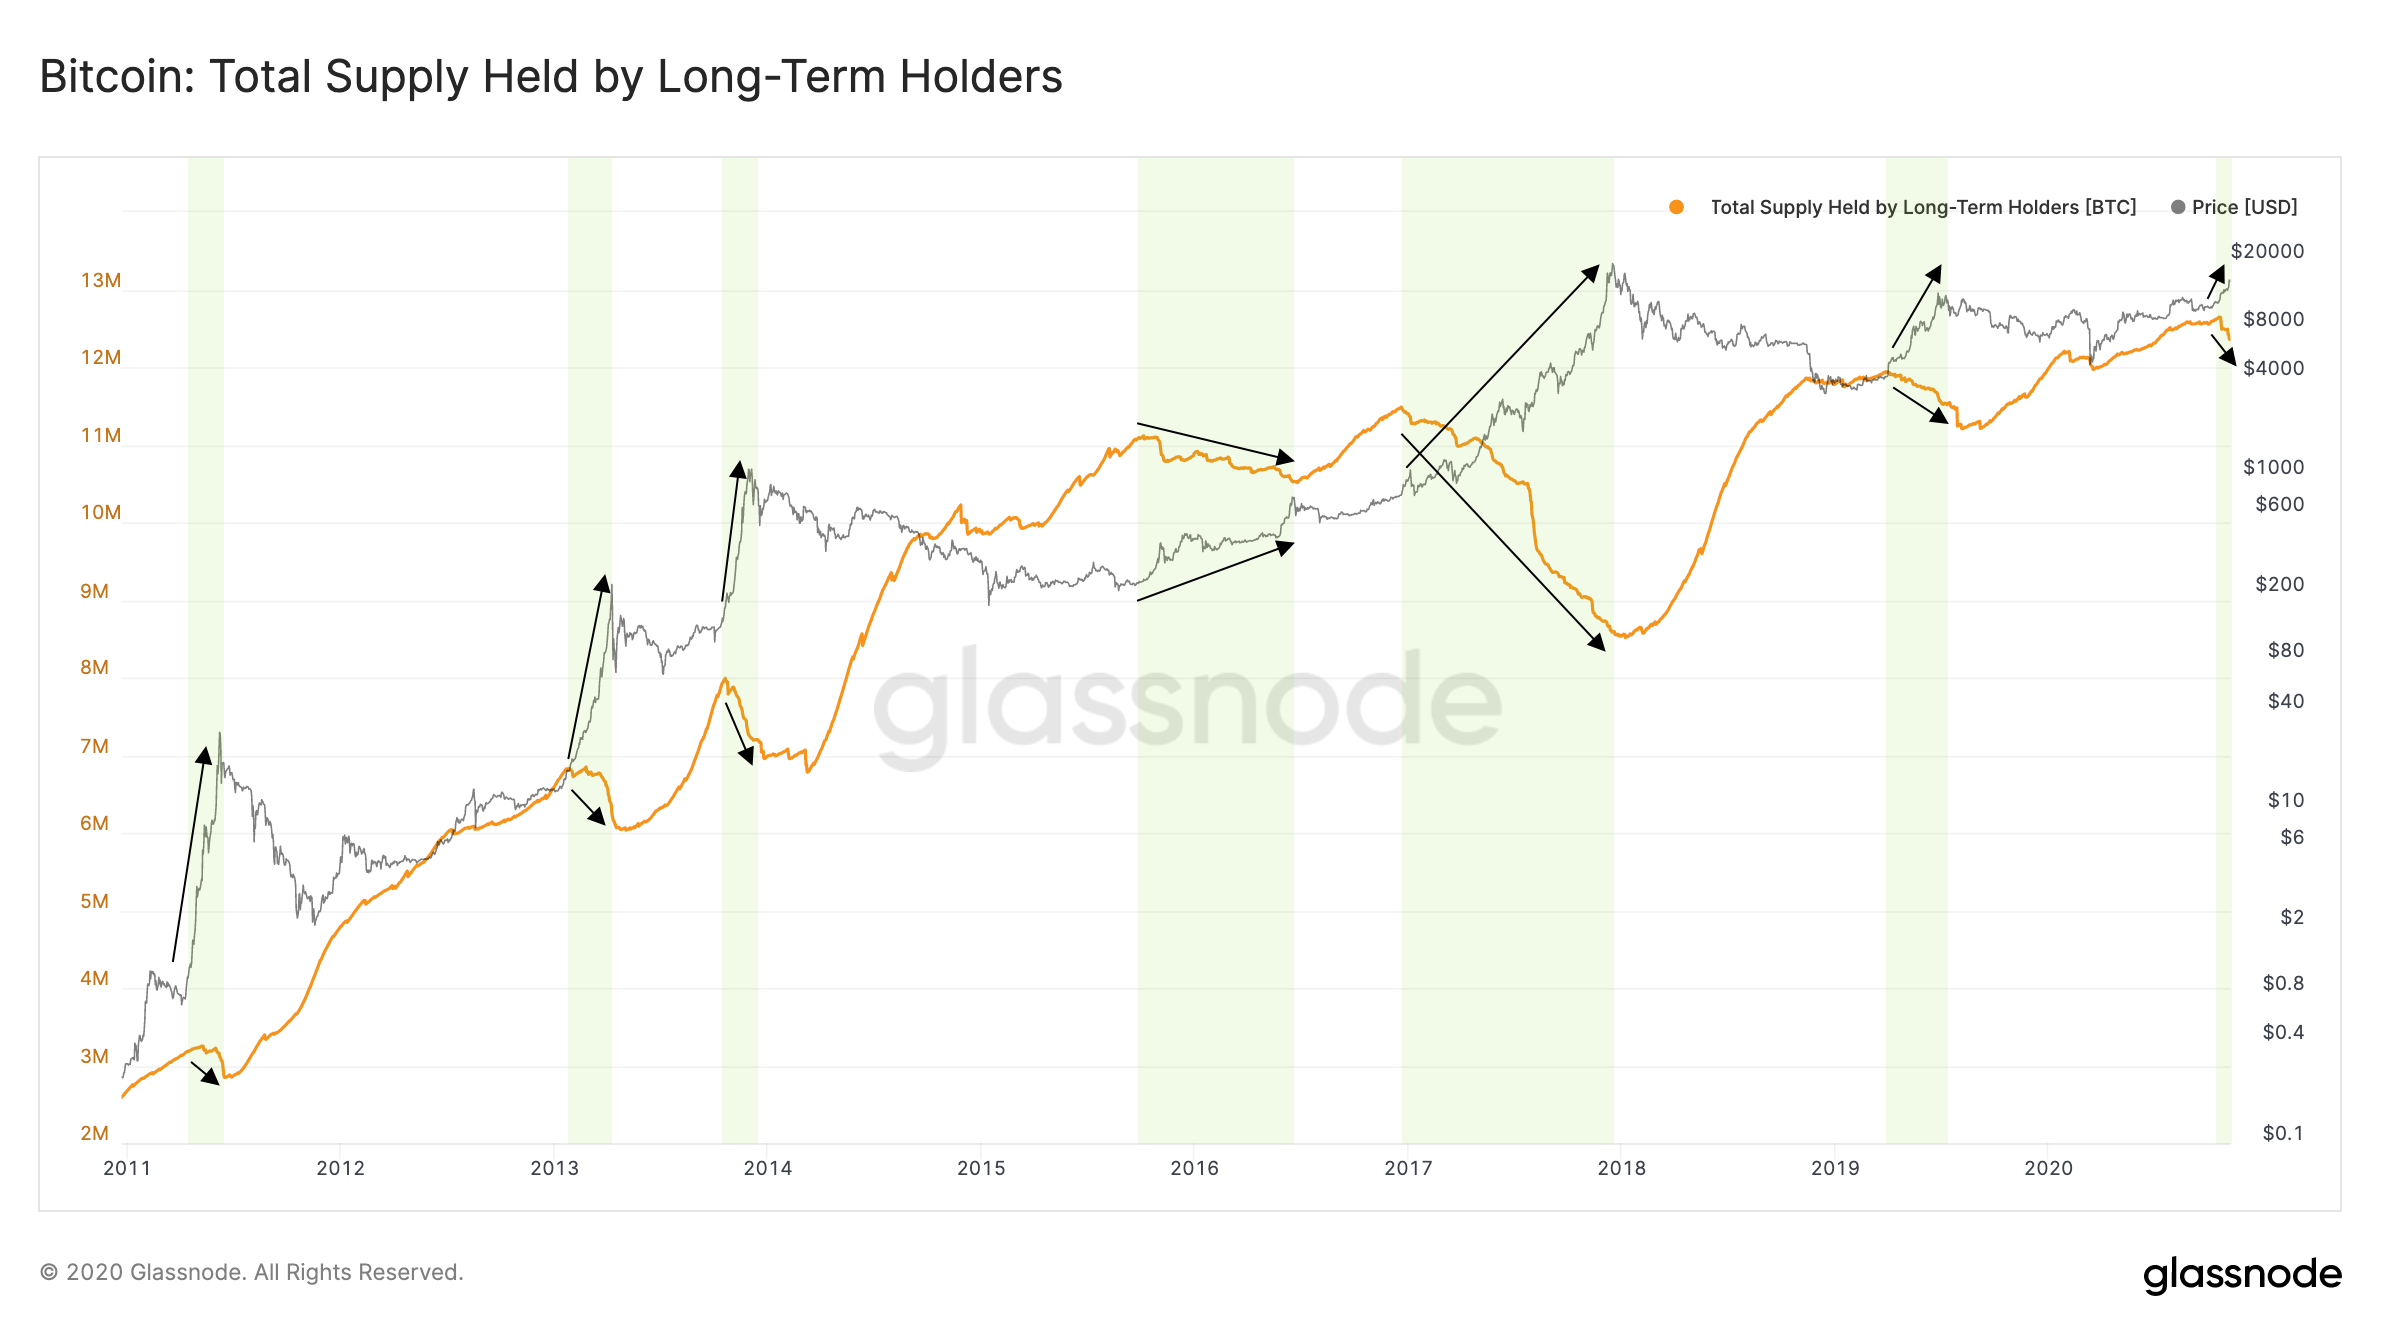
Long-Term Holder Supply
As of writing, the current LTH supply is 12.3M BTC – that is around two thirds (66%) of the circulating supply.
The amount of BTC held by long-term investors follows a regular pattern over the course of Bitcoin's history (Figure 3). Specifically, LTH supply tends to decrease during bull markets. This is expected, and a clear indication of profit-taking from long-term holders.
At the time of writing, the LTH supply has started to decline – pointing to the early stages of a new bull market.
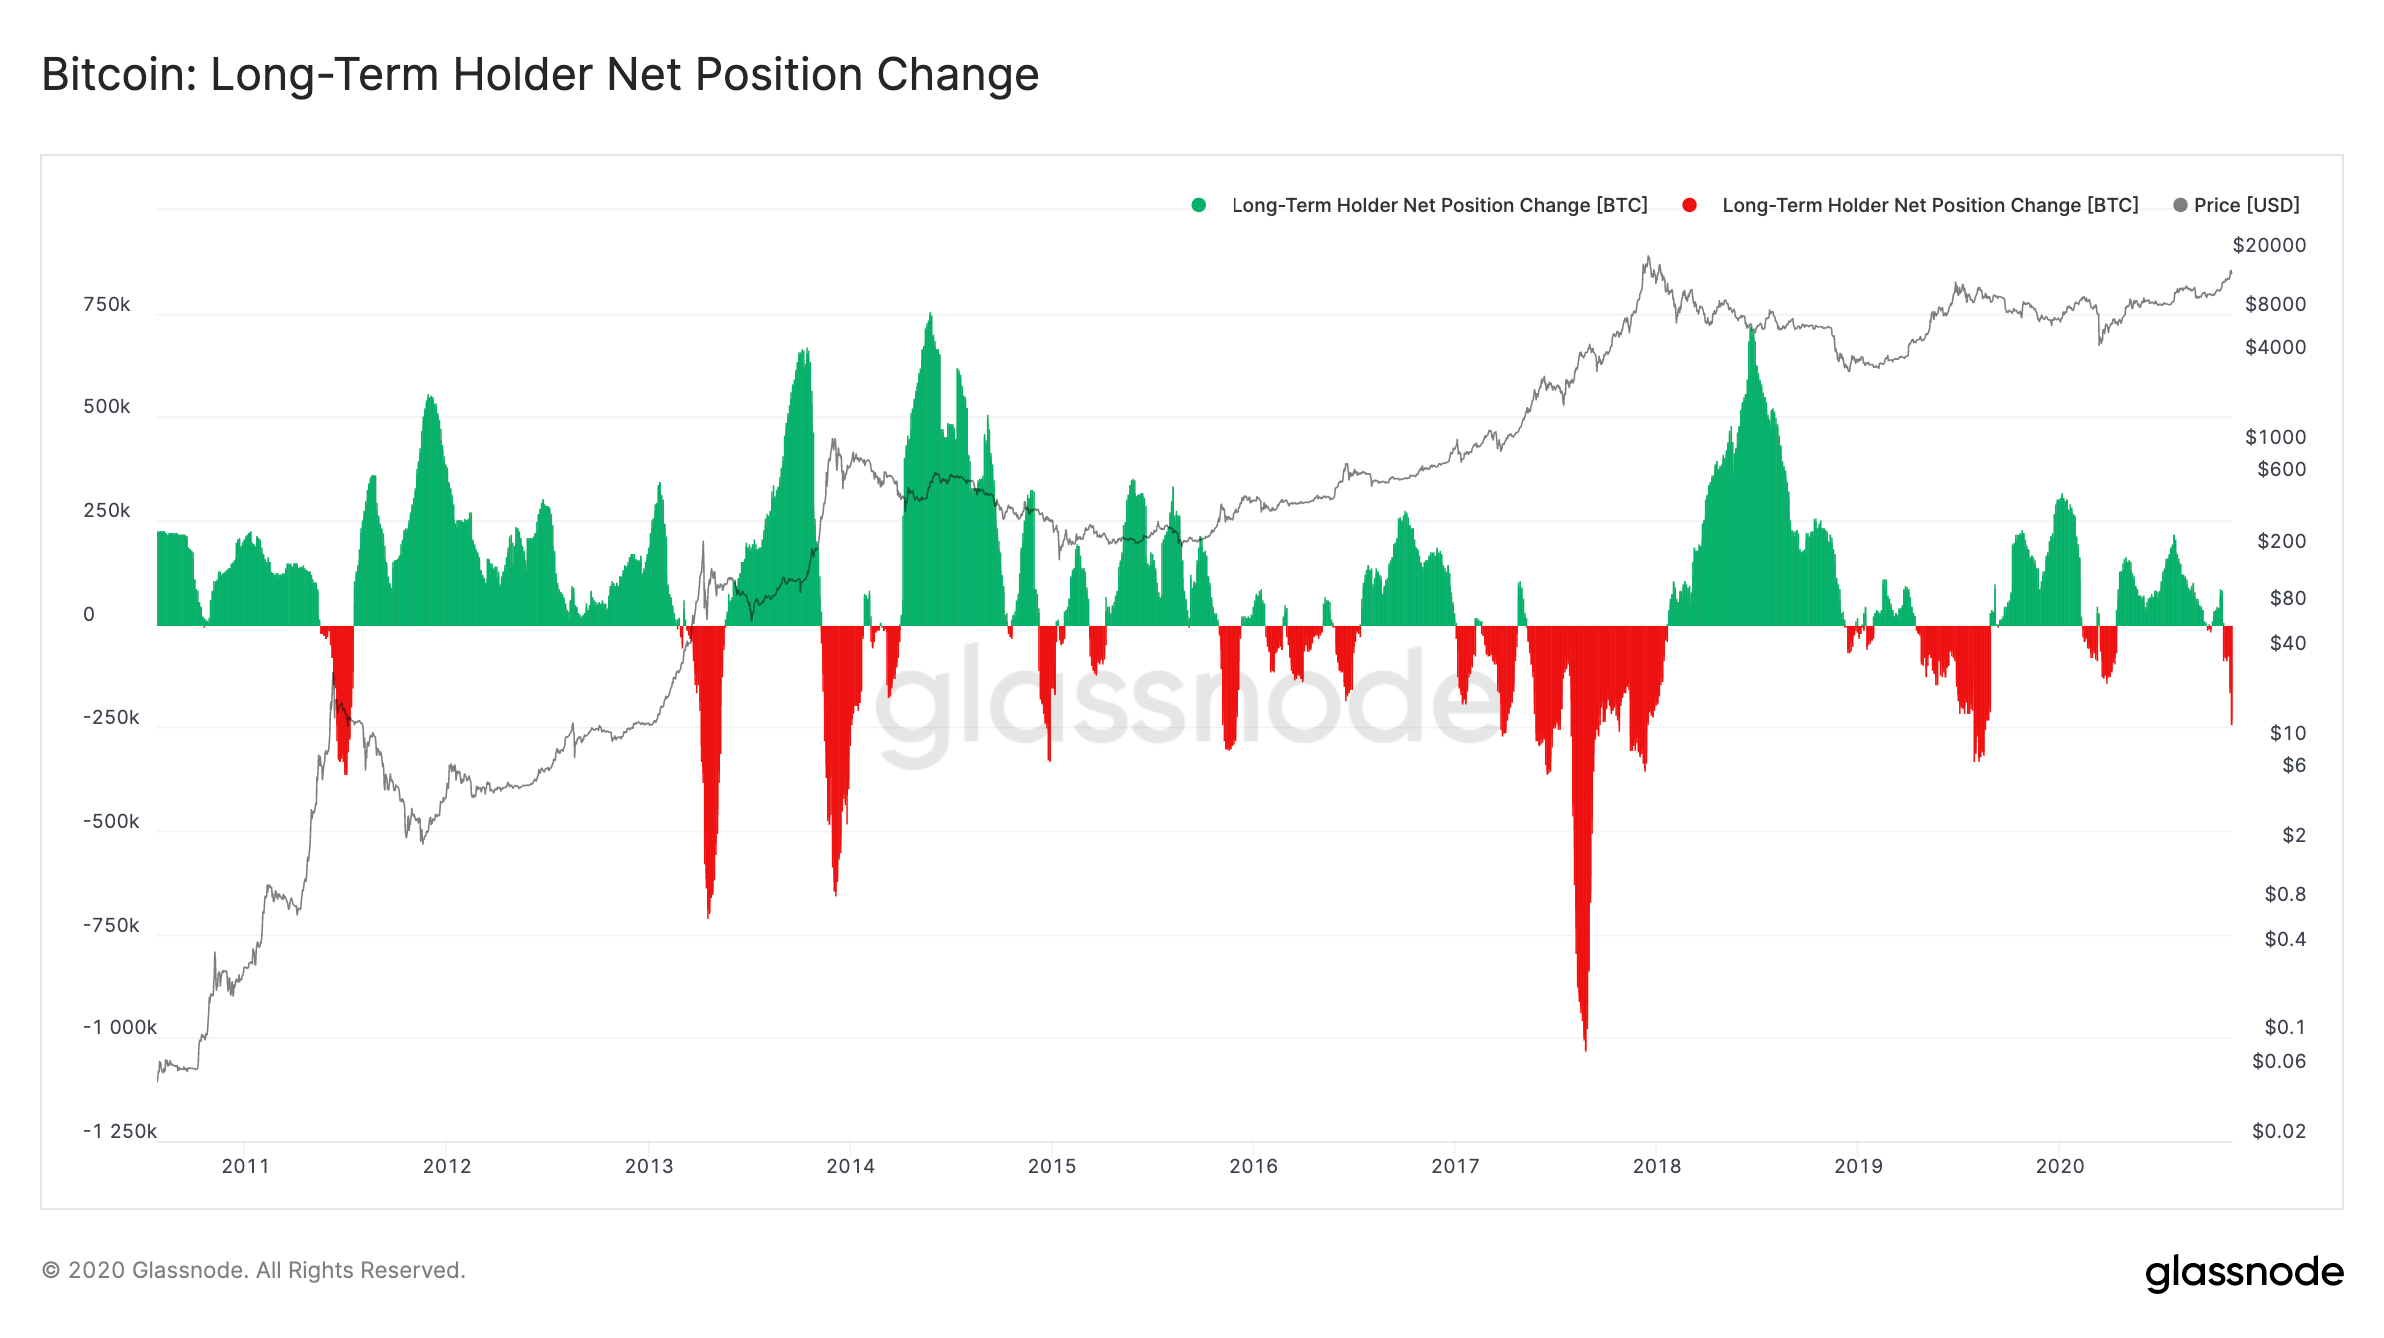
Looking at the monthly change of the LTH supply (Figure 4, Long-Term Holder Net Position Change) shows how the LTH supply increases and decreases at different times in the BTC market cycle. In particular, the chart clearly visualizes changes in on-chain behaviour of long-term investors, and paints a clear picture of accumulation periods during bear markets and decreasing positions in bull markets.
The absolute LTH supply numbers in Figure 3 above include not only hodled coins, but also coins that have been lost. LTH Net Position Change on the other hand eliminates the contribution from lost coins, as it depicts relative numbers by computing the 30 day changes in LTH supply.
Currently, we are seeing a downward spike, pointing to the fact that BTC from hodlers started to move on-chain, as a reaction to the recent price appreciation. Note that this has been commonly observed in previous cycles as well, and indicates that we are potentially at the early stages of a bull run.
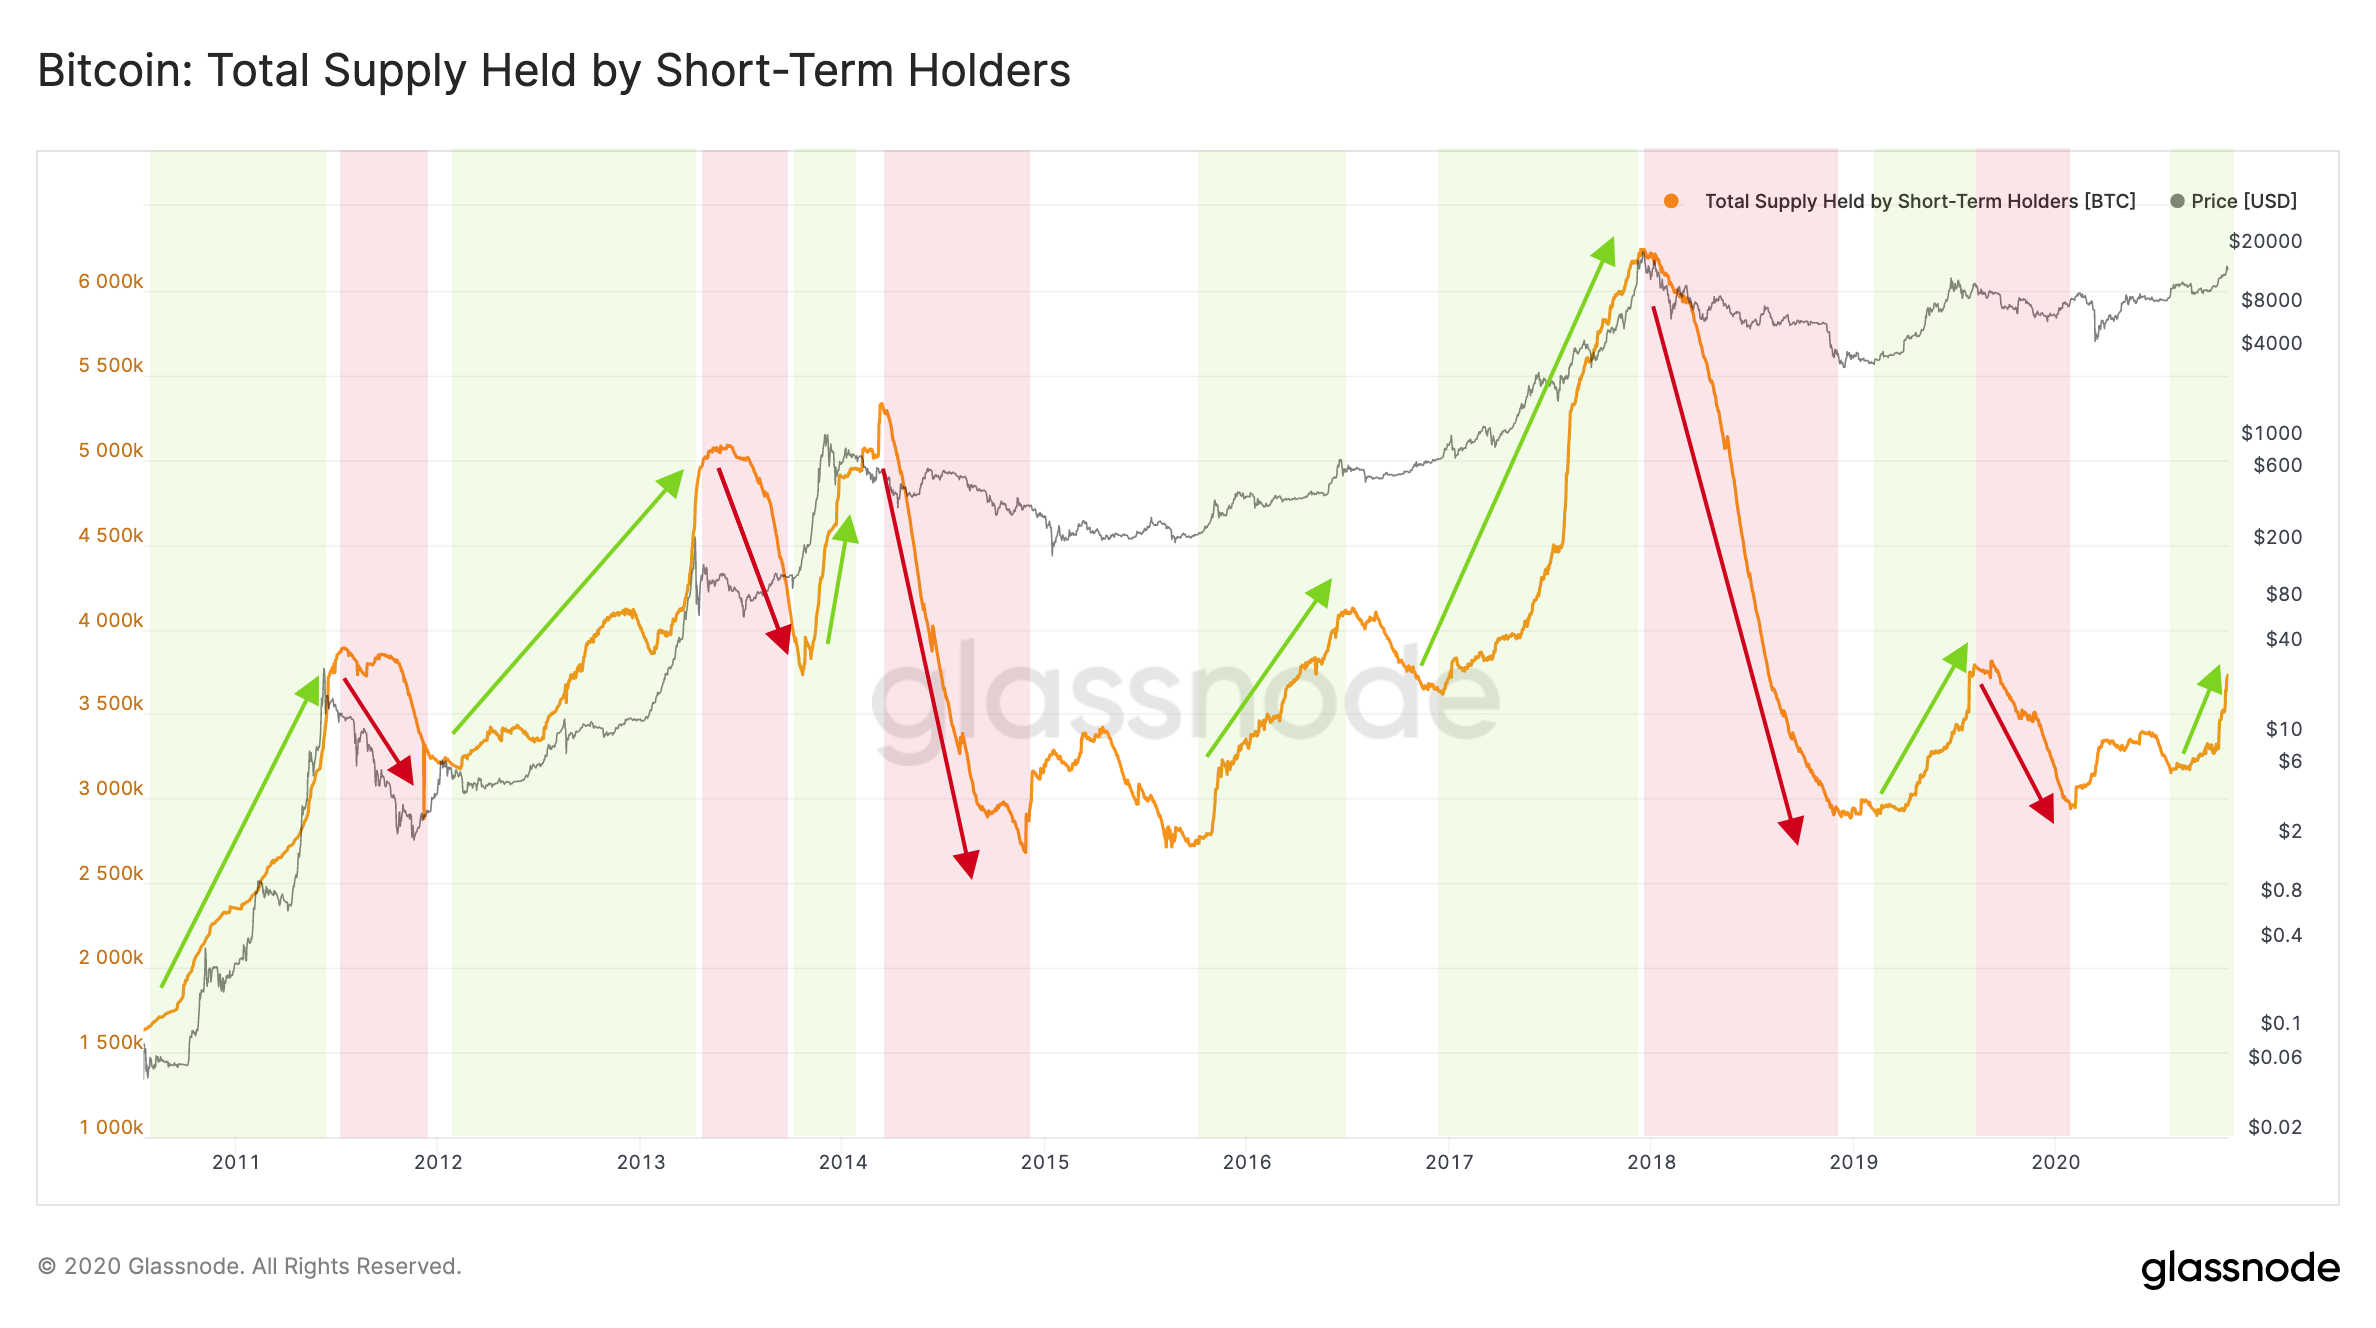
Short-Term Holder (STH) Supply
The amount of Bitcoin supply held by short-term traders increases as BTC's price appreciates – a clear indication of older bitcoin stashes being reactivated in bull markets for trading.
Over the course of the past month the amount of STH supply has increased by more than 500,000 BTC and sits currently at around 3.7 million BTC – 20% of the circulating supply. (Note that bitcoins sitting on exchanges are treated separately and not included in this number.)
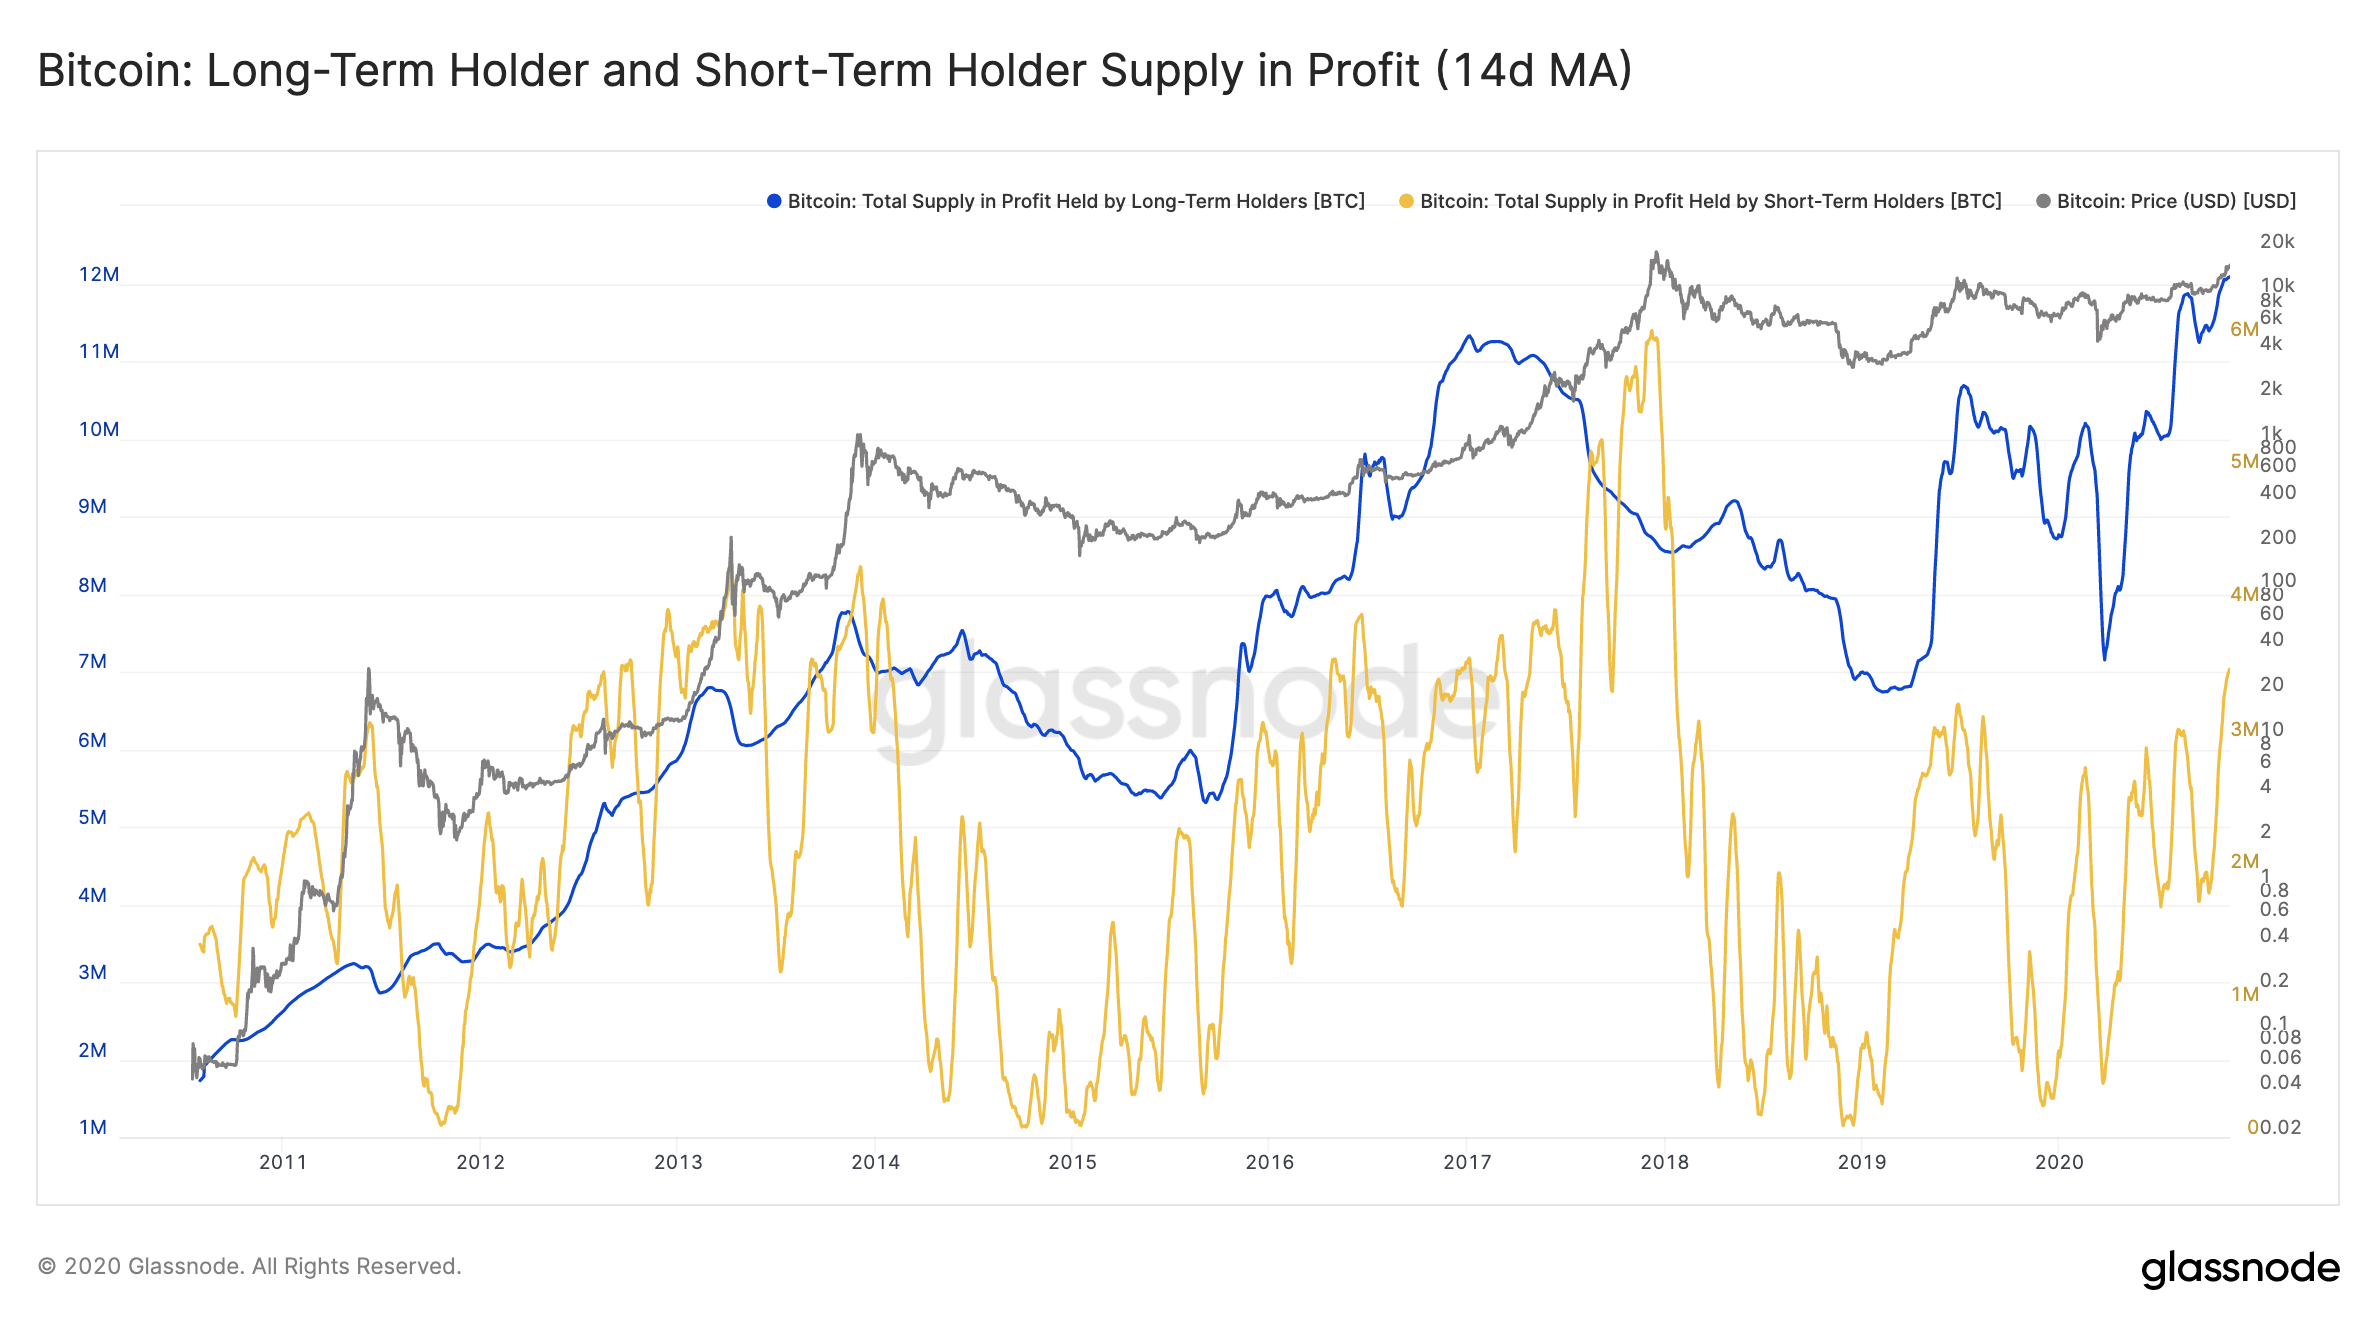
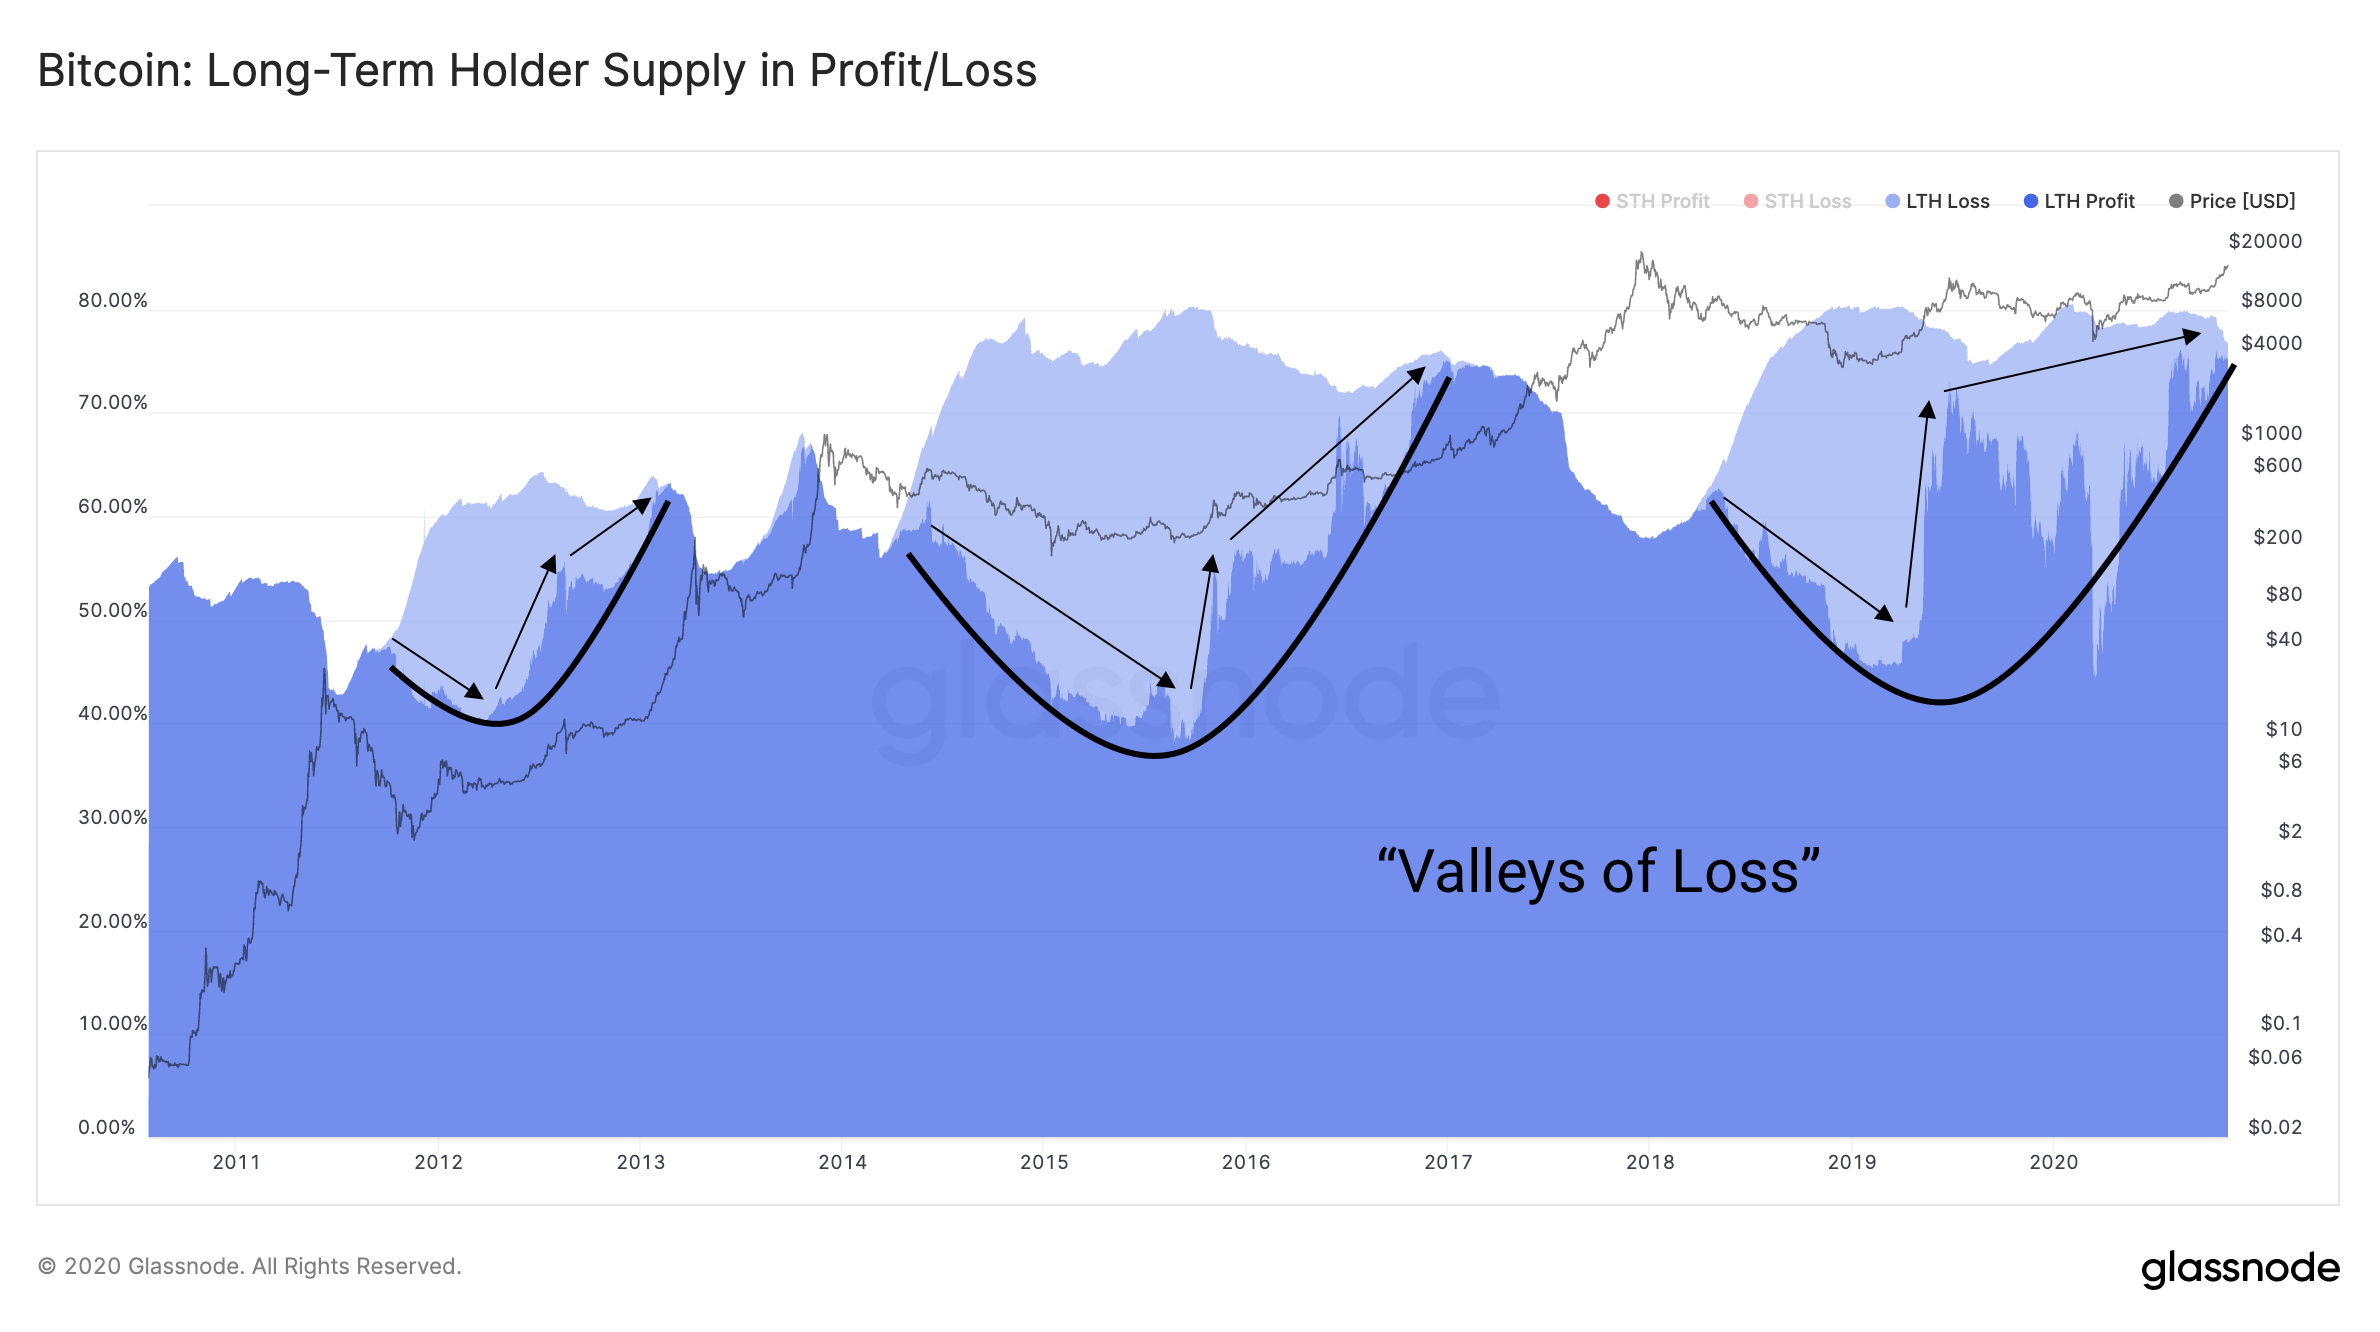
Long-Term and Short-Term Holder Supply in Profit/Loss
By not only looking at the average purchasing date for each entity, but also at their averaged purchasing price, we can determine whether the current LTH and STH supply is in a state of profit or loss.
Currently, 12 million BTC of the LTH supply (~97%) and 3.5 million of the STH supply (~97%) are in a state of profit.
Looking at the Relative LTH/STH Supply in Profit/Loss (Figure 7) shows, as expected, that during bull markets, as prices reach for new all-time highs, most LTH supply is in profit.
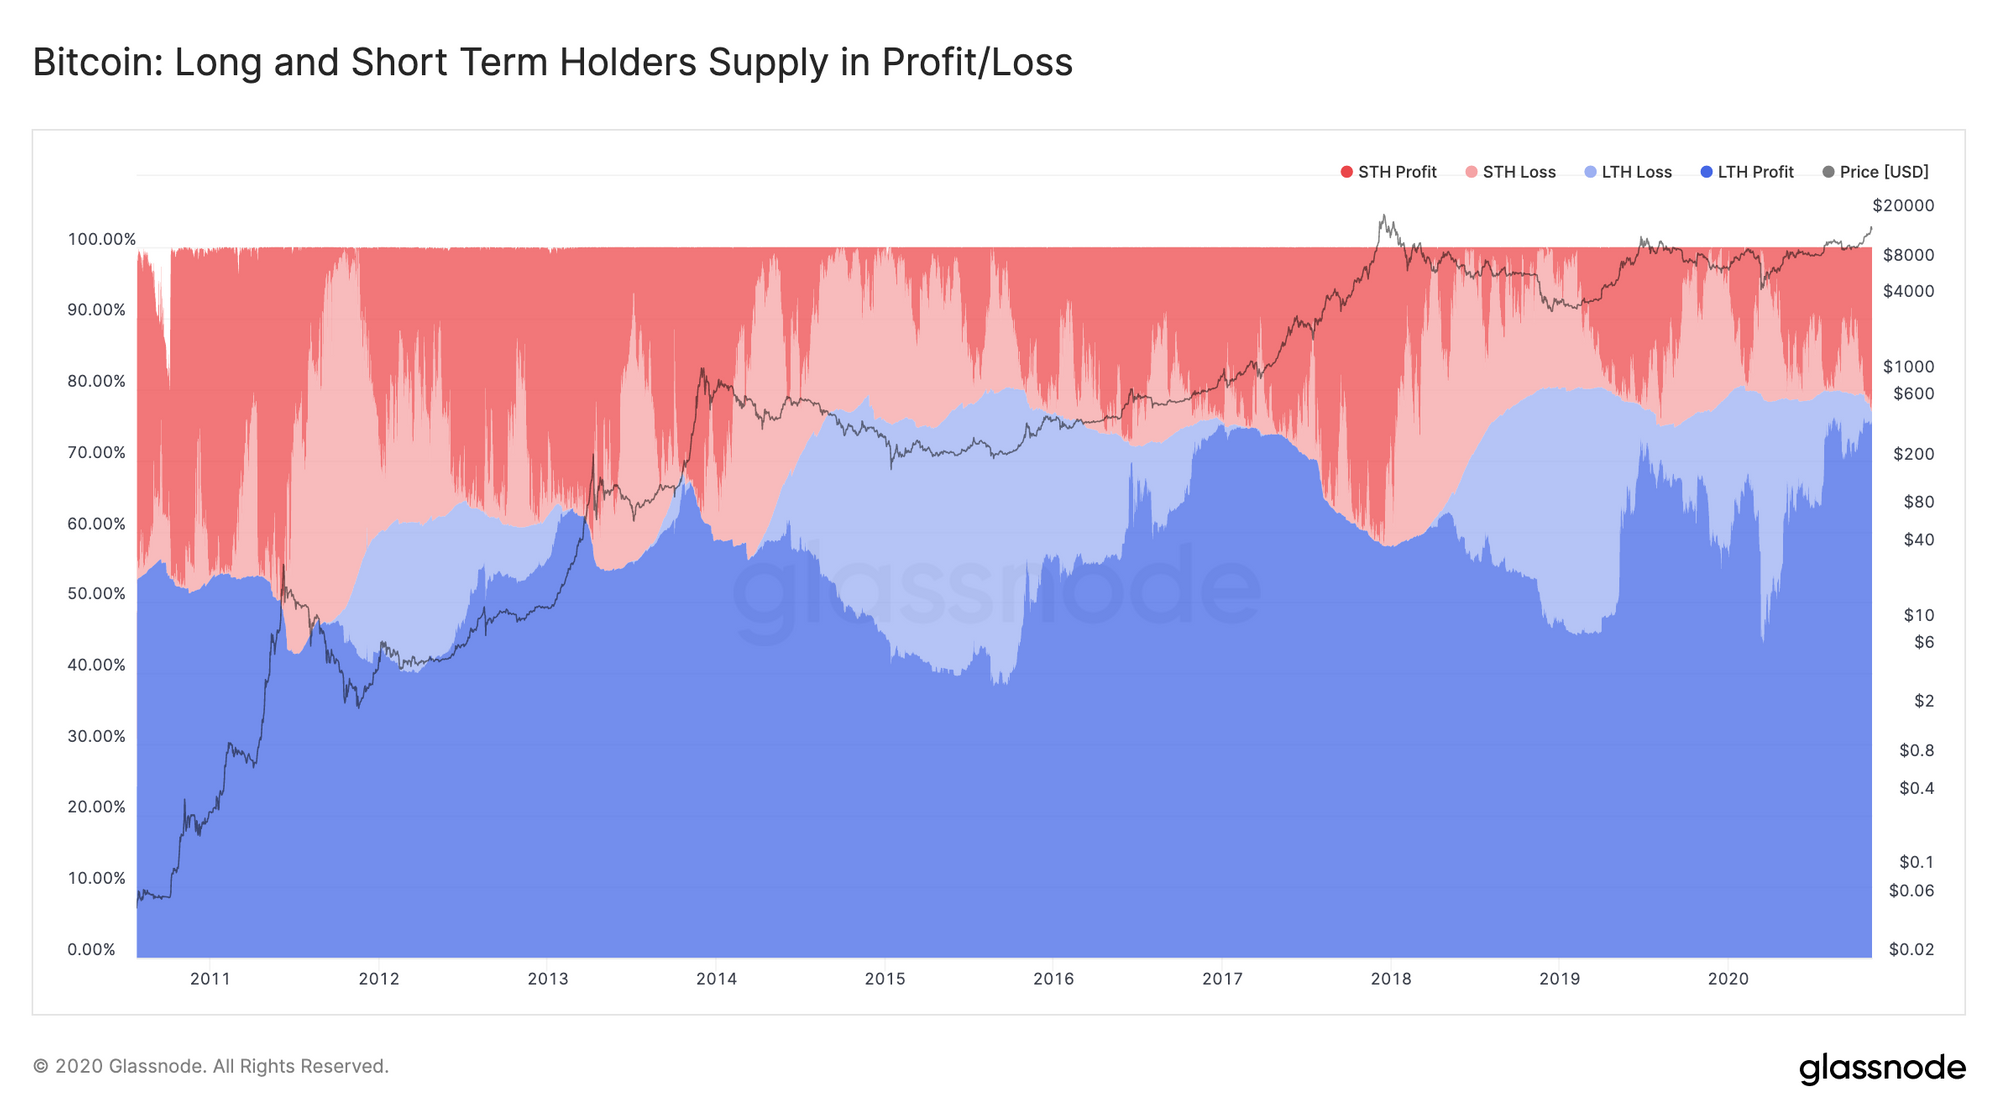
In contrast, a considerable amount of LTH supply is at a loss in a bear market and decreases as a new bull cycle arrives. There are different ways how LTH supply at loss can build up: On the one hand, in cases of sudden price drops such as "Black Thursday" in March 2020, LTH supply that was previously in profit can enter the loss zone. On the other hand, new investors from the STH domain can cross over and become long-term holders. The latter case is well visible in the latest "valley of loss" (Figure 8), starting in mid 2018: It implies that a lot of BTC were purchased by investors which entered the space in late 2017 around the peak of the bull run. Unfortunately, the subsequent bear cycle caused them to enter the LTH zone "at loss" and not "in profit". However, by now almost all of the long-term investors' supply is back in a state of profit, including that of the 2017 investors. We believe this results in a generally positive sentiment across BTC holders and points to a favorable outlook.
Comparison to Previous Metrics
To evaluate the present approach, we can compare our new data with previous metrics, such as Hodled or Lost Coins and Hodler Net Position Change. (These metrics were created by Adamant Capital – for a detailed description, see their blog post here).
We observe a very good agreement of the general trend as well as in the ups and downs of the respective metrics.
However, there is one qualitative difference when looking at the position change data: In the traditional Hodler Net Position Change metric, the positive values (in contrast to the negative ones) tend to be capped (see the comparison in Figure 9). In contrast, with our new approach, the metric is unbounded in both directions – providing a much clearer signal.
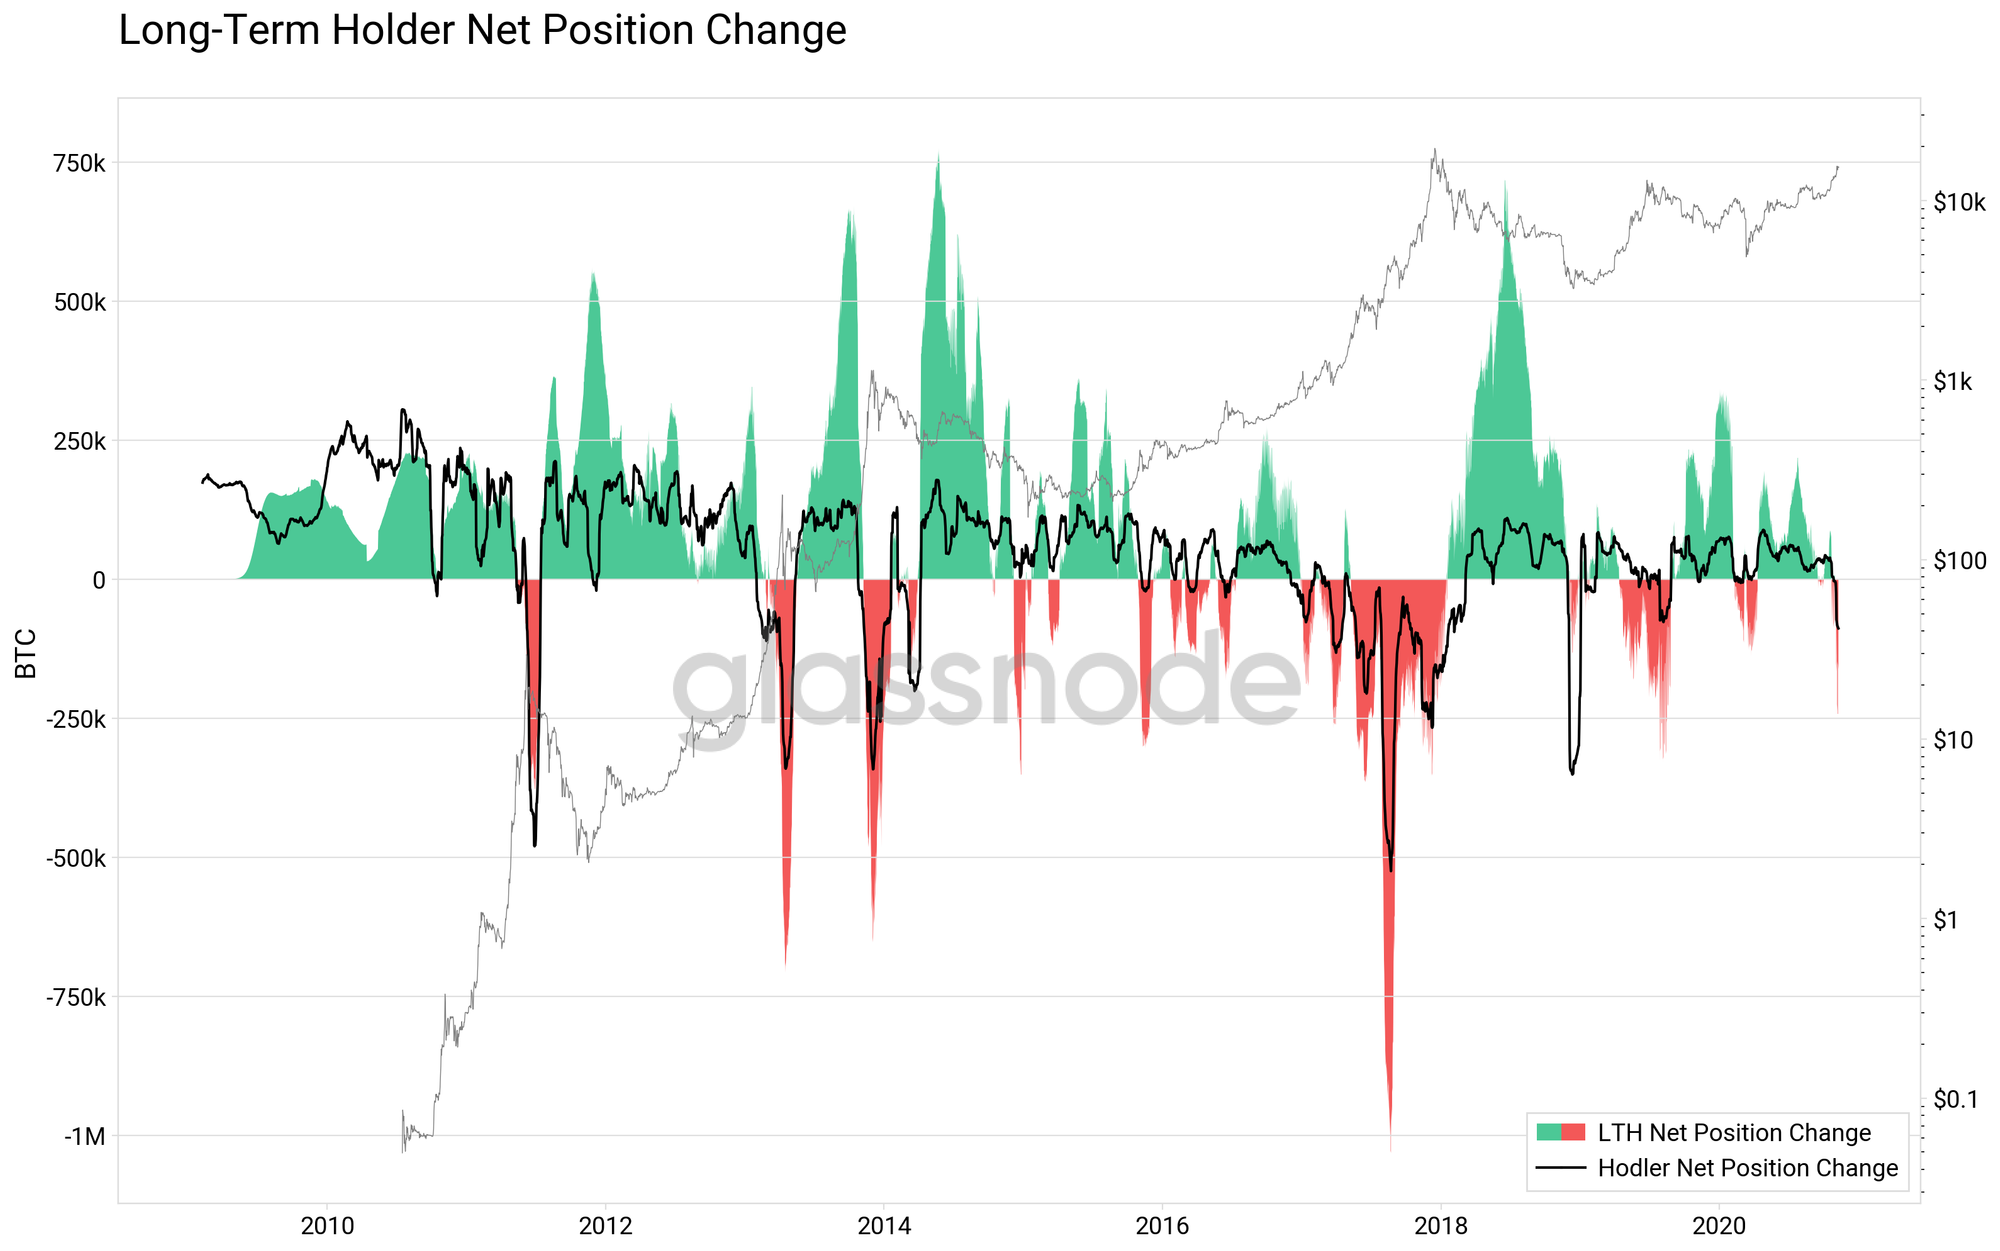
The capped values in the Hodler Net Position Change metrics can be understood in the following way: It is based on the Liveliness metric, which due to the cumulative sums in its definition can exhibit sudden increases, but a decrease in value can only occur slowly, over much longer time periods. Since Hodler Net Position Change is based on the negative Liveliness, the argument reverses and positive changes become visible only after longer time scales. Consequently, it's impossible for the monthly differences to skyrocket and big changes in the hodler behavior might become apparent only after a certain amount of time – in contrast to our new proposed metric based on the LTH supply.
Summary
We introduced a new methodology to differentiate Bitcoin supply that is held by long-term investors and short-term traders. The separation of these market participants on a network level is crucial in order to gain a deeper understanding of investor behaviour during different periods of the BTC market cycle. The supply distribution among investor groups can serve as a proxy to investor sentiment and sheds light on the primary usage of Bitcoin (e.g. store of value).
With this work we introduced a new set of on-chain metrics that quantify the supply held by these two investor types, and their current trends strongly support the narrative of an onset of a bull market.
All metrics introduced here are available live in Glassnode Studio:
- Long-Term Holder (LTH) Supply
- Short-Term Holder (STH) Supply
- Long-Term Holder Net Position Change
- Long-Term Holder Supply in Profit
- Long-Term Holder Supply in Loss
- Short-Term Holder Supply in Profit
- Short-Term Holder Supply in Loss
- Relative LTH/STH Supply in Profit/Loss
The present work was done in collaboration with Swissblock Technologies.
A big, big thank you goes to my great colleague Kilian for the amount of effort put in this work.

- Follow us and reach out on Twitter
- Join our Telegram channel
- For on–chain metrics and activity graphs, visit Glassnode Studio
- For automated alerts on core on–chain metrics and activity on exchanges, visit our Glassnode Alerts Twitter