The Week On-Chain (25 Mar 2020 - 1 Apr 2020)
A series of on-chain metrics that typically highlight BTC market tops and bottoms have recently bounced out of zones that have historically signalled market bottoms.


Bitcoin Market Health
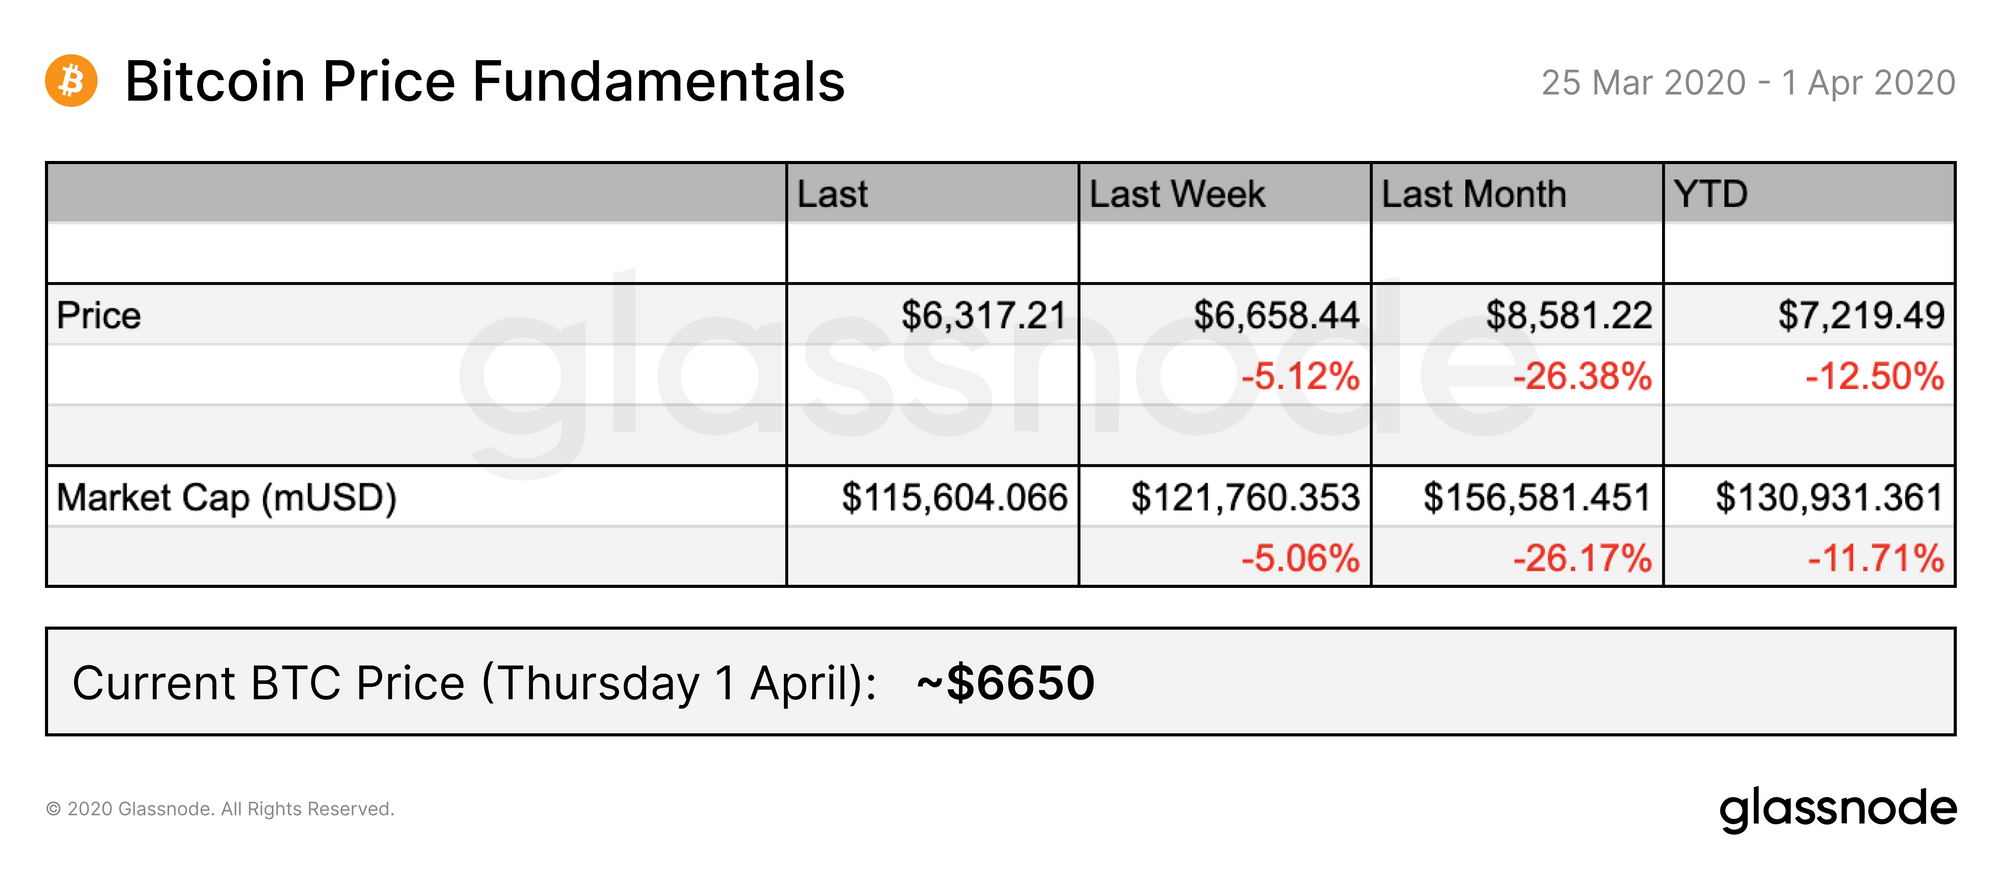
Over the past week, BTC declined from the ~$6650 price point down to the range of $6100-6300, moving mostly horizontally but briefly dipping below $6k at one point. However, as of today, the price has recovered by over 5%, and is sitting above $6650 once again.
On-chain fundamentals continue to show a trend reversal from smaller numbers of large transactions (following the price drop), back to larger numbers of smaller transactions. This signals a return to normal trading activity following the larger movements seen in March as investors revised and consolidated their positions.
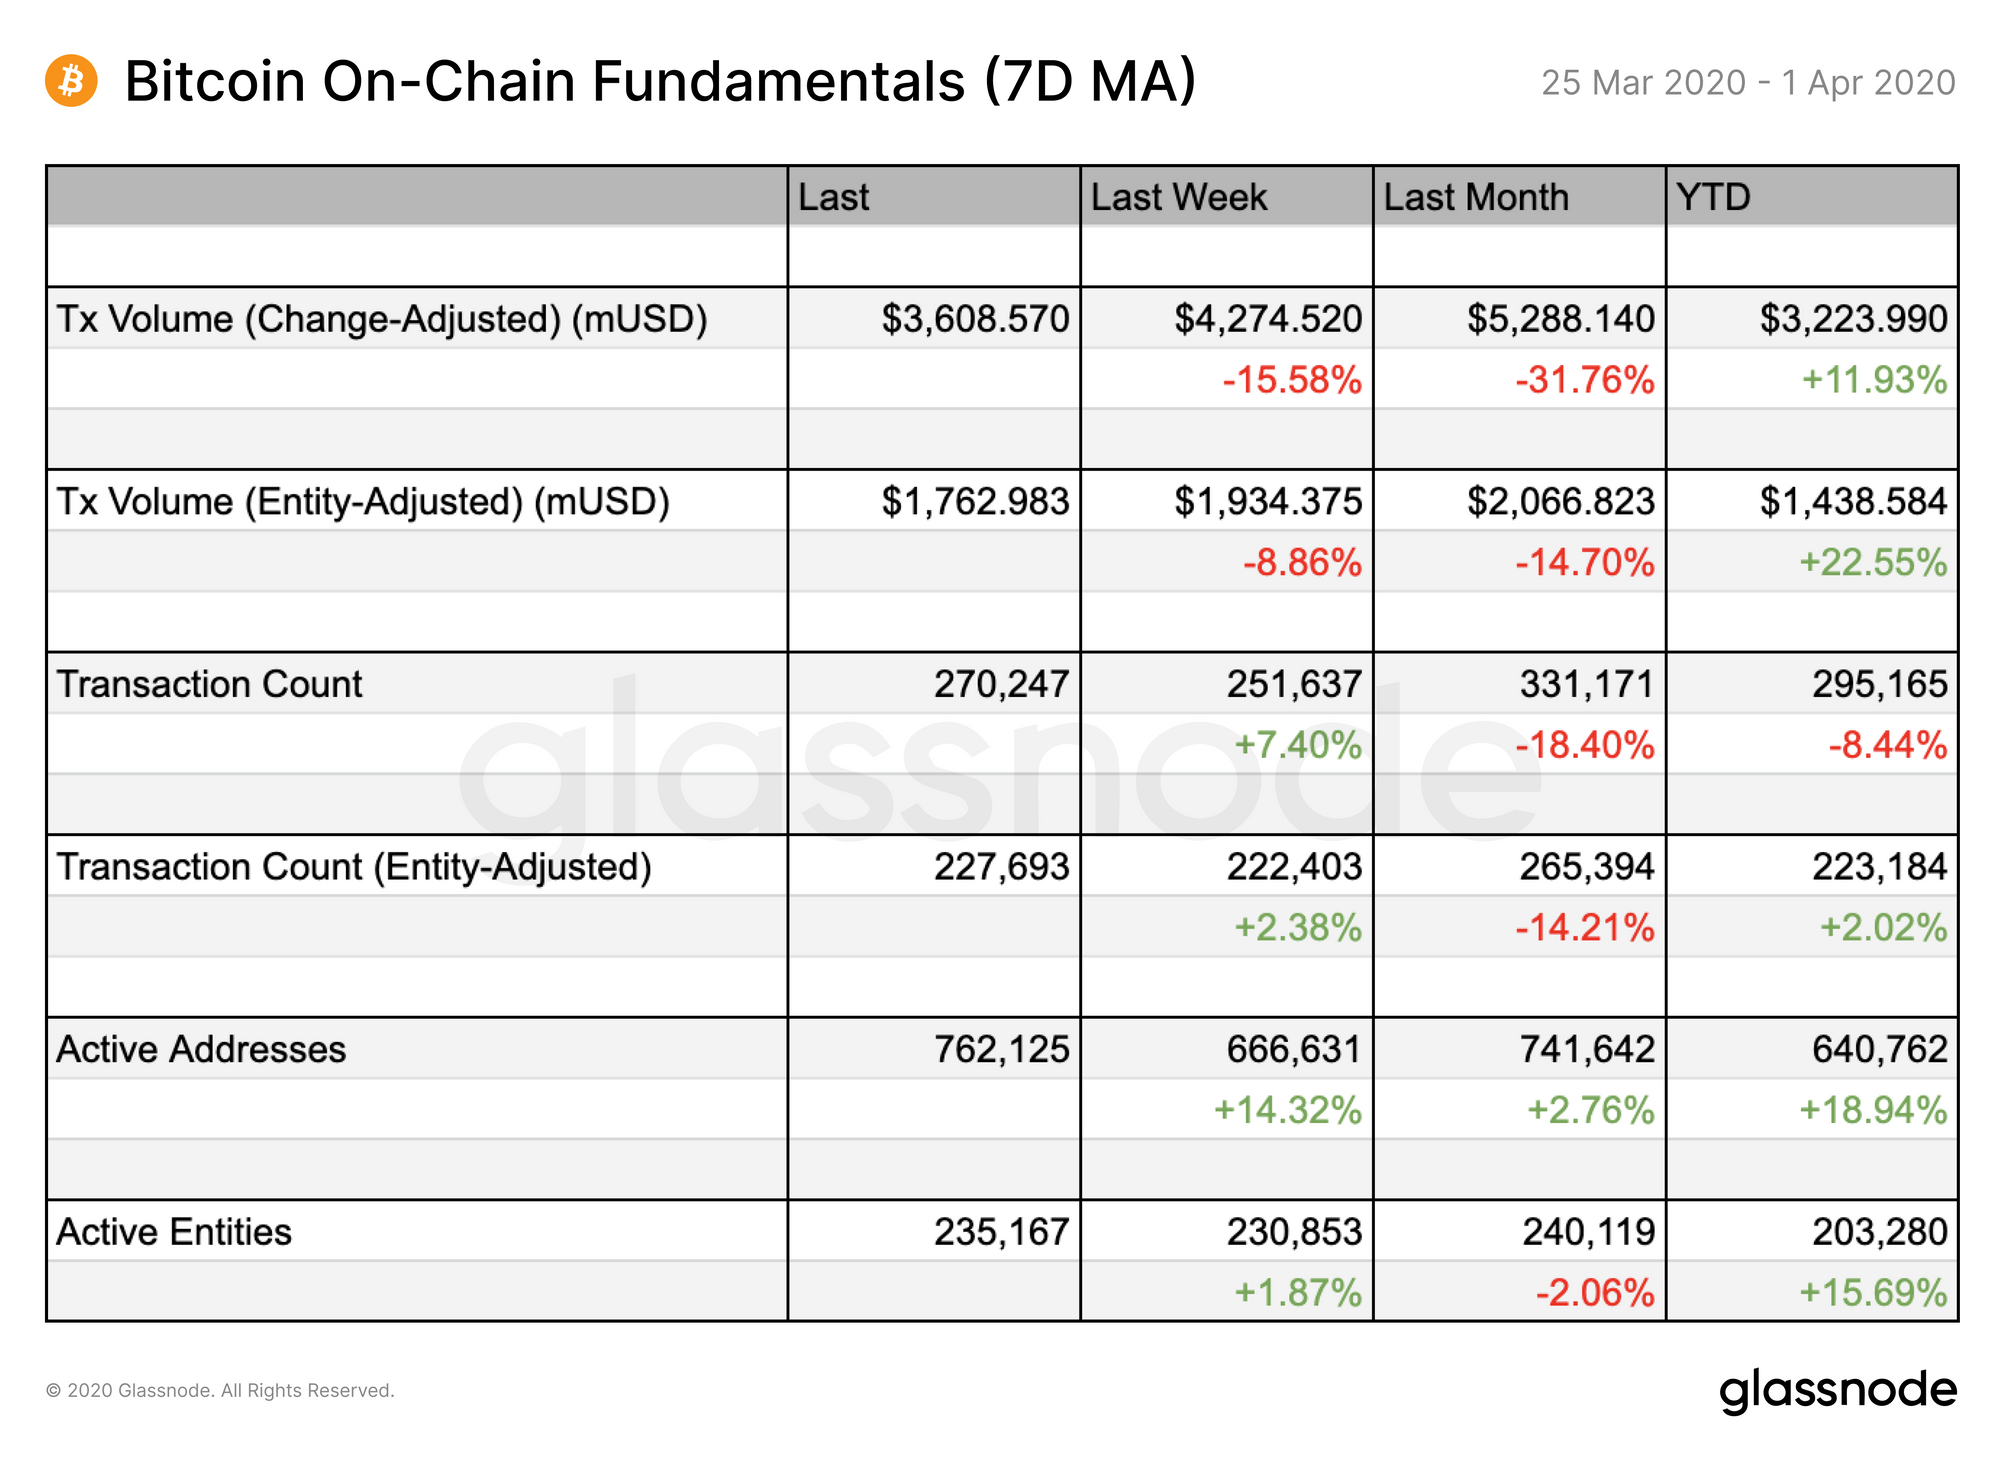
The increase in active addresses and entities also indicates more widespread network use, as opposed to the smaller numbers of big movers that were active during the capitulation phase following last month's price drop.
This return to normal network activity suggests that the panic triggered by the crash may have subsided, providing room for recovery. Other on-chain metrics also support this interpretation...
On-Chain Metrics Which Highlight Market Cycles Suggest a Change in Sentiment
A series of on-chain metrics that typically highlight market tops and bottoms have recently bounced out of or currently sit in zones that have historically signalled bottoms and good entry points, indicating a potential shift towards more positive sentiment.
When the price of bitcoin crashed in March, these metrics universally fell into the "market bottom" region, signalling that BTC was undervalued at those prices, and indicating a good time to buy. These metrics are now moving out of those lower ranges, suggesting that we may have seen the bottom.
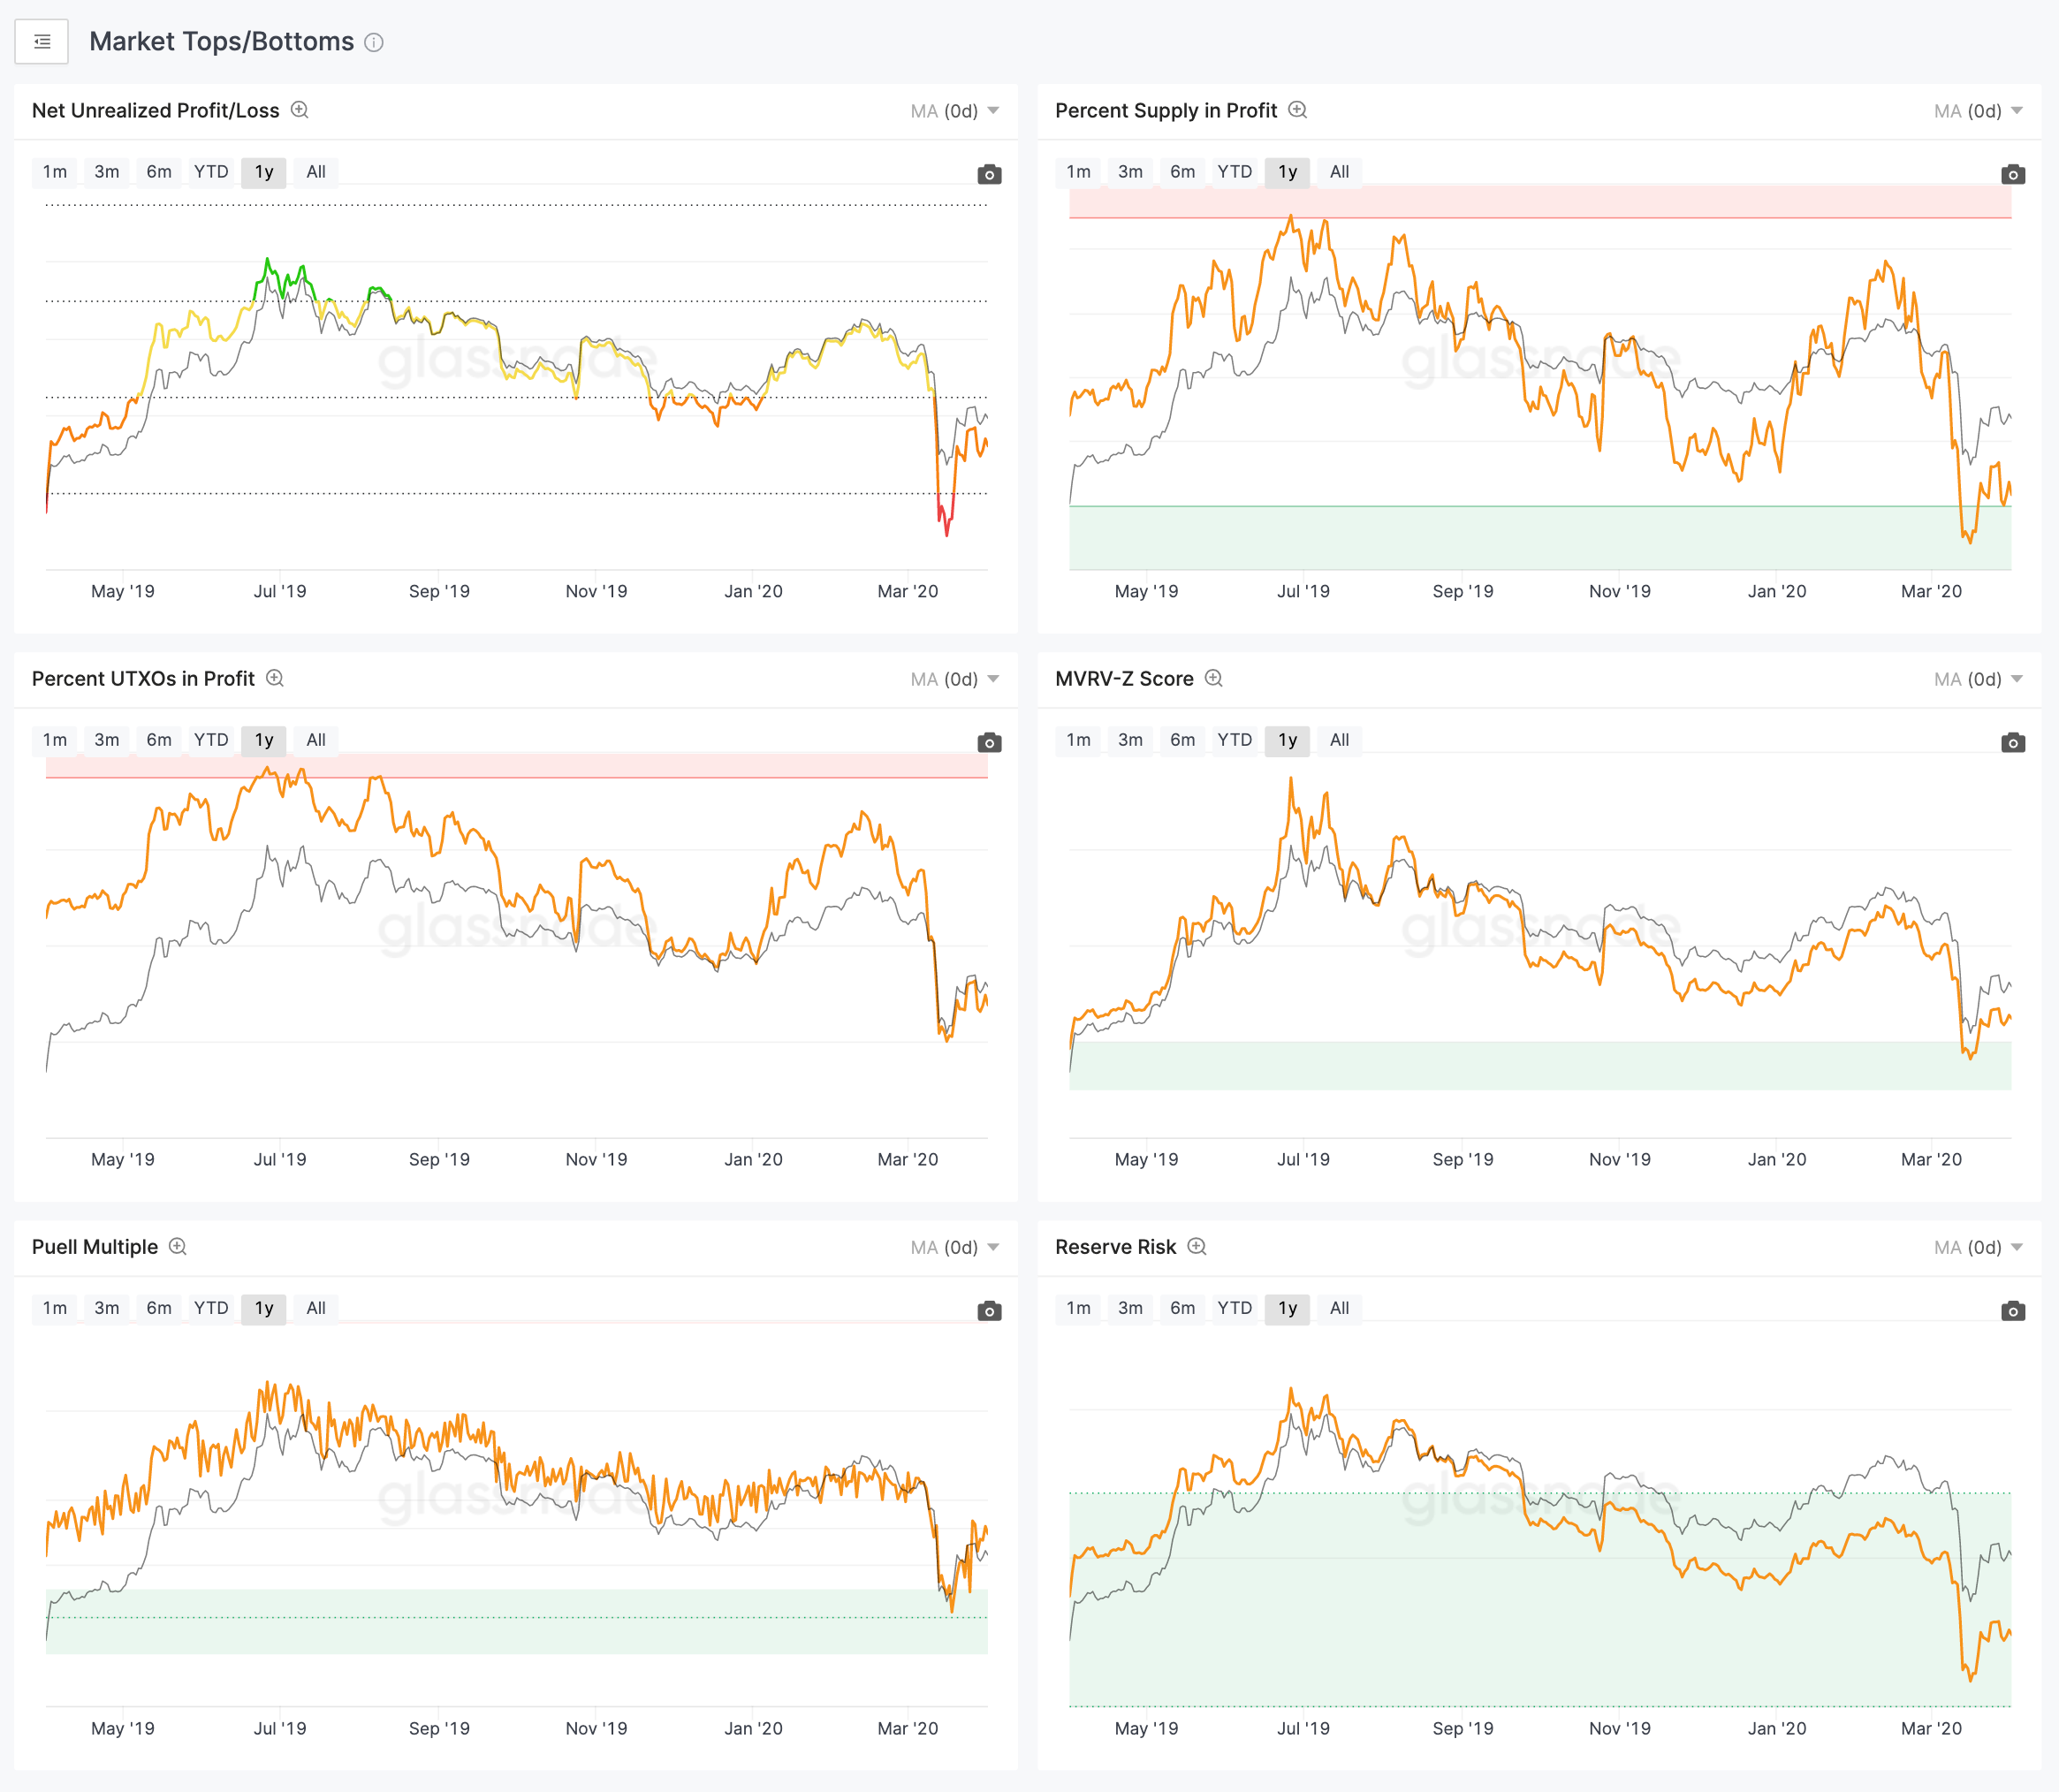
While unprecedented global events make it more risky to predict price movements based on historical trends, so far, these metrics appear to be providing sound signals.
Net Unrealized Profit/Loss
For example, historically, Net Unrealized Profit/Loss (NUPL) has fallen into the red (capitulation) zone when the market reaches a cyclical bottom.
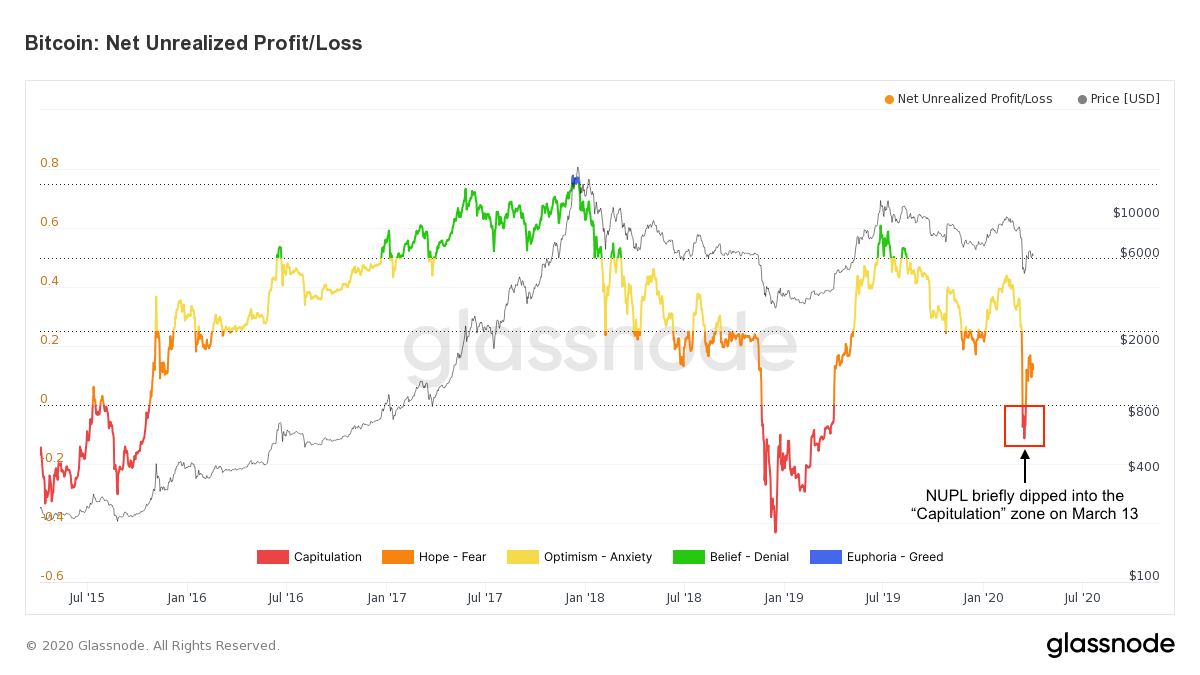
In the past, NUPL has stayed in this zone for at least a few months before recovering back to levels of hope and then optimism. However, it has never fallen into the red zone so close to a halving event before, providing hope that this ice age may not last as long as previous ones.
Learn more about NUPL on Glassnode Academy to predict the upcoming trend for yourself.
MVRV-Z Score
The MVRV-Z Score is used to assess when bitcoin is overvalued or undervalued relative to its "fair value". When it drops below zero, this signals that BTC is undervalued. Historically, this has proven true, as values below zero have represented market bottoms.
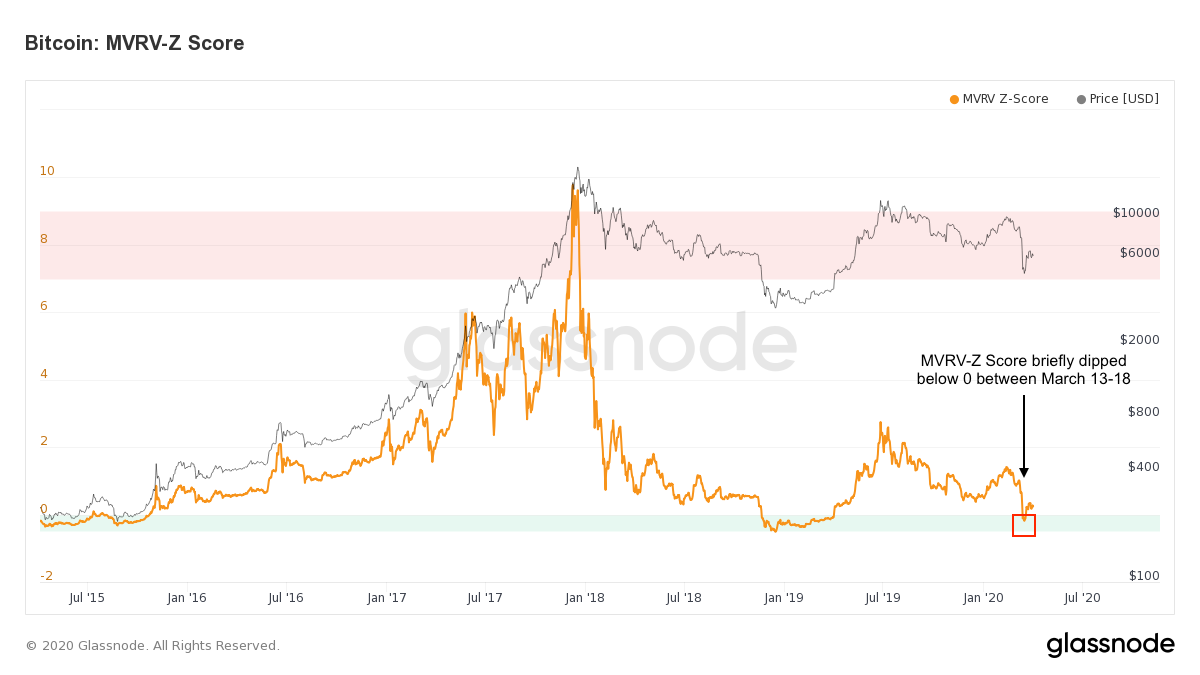
The value of MVRV-Z Score dropped below zero in late March for the first time since the late 2018/early 2019 bear market, signalling that the market had reached a bottom. Again, whether this bottom lasts as long as previous ones remains to be seen. Confounding factors such as the upcoming halving and the global economic state make this unpredictable.
Learn more about MVRV-Z Score on Glassnode Academy to get ahead of this trend.
Community Narrative
Content and insights derived from Glassnode data by our community
The number of Bitcoin addresses holding at least 1 BTC continues to hit all-time highs, as observed by @Markchain_io.
Keeping an eye on the price is important, but that's not all!#Bitcoin Number of Addresses holding 1+ coins just reached an ATH of 798,555.000 🔥
— Markchain (@Markchain_io) March 30, 2020
Previous ATH of 798,040.000 was observed on 29 March 2020. People keep buying!
By @glassnode pic.twitter.com/Hdw1rVvax5
This consistent uptrend is a positive sign for bitcoin, suggesting a wider spread of demand and adoption, as well as potential hodling behaviour.
Stay updated on the number of addresses holding at least 1 BTC to keep watching this trend, and remember to send us your own content using Glassnode data to be featured in our next weekly update.

- Follow us and reach out on Twitter
- For on–chain metrics and activity graphs, visit Glassnode Studio
- For automated alerts on core on–chain metrics and activity on exchanges, visit our Glassnode Alerts Twitter
Disclaimer: This report does not provide any investment advice. All data is provided for information purposes only. No investment decision shall be based on the information provided here and you are solely responsible for your own investment decisions.