The Week On-chain (Week 13, 2021)
Bitcoin continues to trade above $50k as long term holders dramatically slow their spending, and a new class of HODLers are forged.


Bitcoin Market Overview
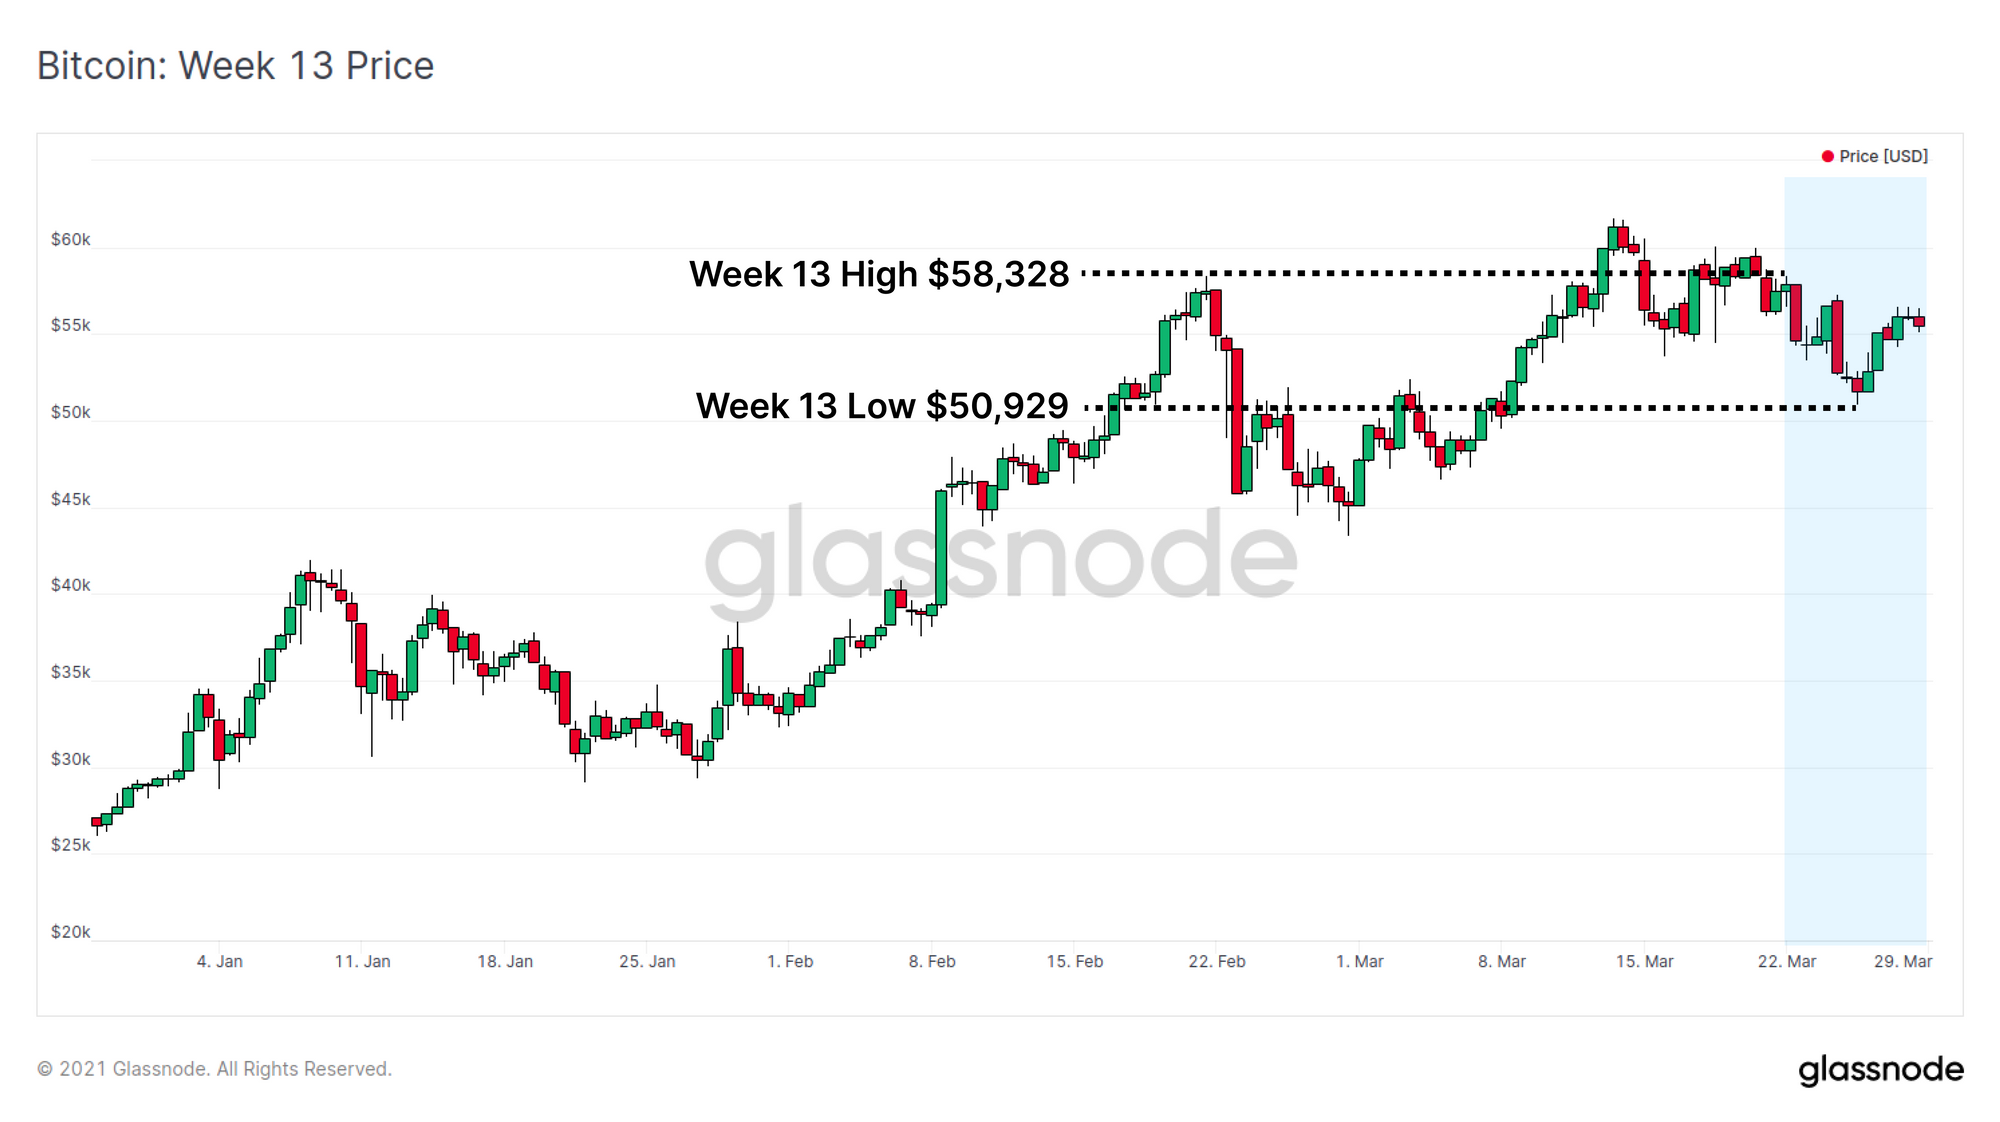
Bitcoin has traded down from a high of $58,328 to an intra-day low of $50,929. Despite this, long term holders have dramatically slowed their spending, HODLed coins are beginning to mature, and continued outflows from exchanges demonstrates accumulation is not slowing down.
This week we are seeing signals of coin maturation on-chain as coins moved into cold storage earlier in this bull market have now accumulated meaningful lifespans. Many are on their way to becoming classified as long-term holder (LTH) coins. These are the first signs of a new generation of HODLer, those who were forged in the dynamic market realities brought on in 2020 and 2021.
Forging New HODLers
This week we see continued growth in coins aged between 1m and 6m. These represent coins accumulated throughout the bull that are beginning to mature. Once a coin ages (HODLed) beyond 5-6 months, it is increasingly likely to remain dormant and is reclassified as a Long term holder (LTH) coin once lifespan exceeds 155-days. This makes the age bracket between 3m and 6m quite important when looking for strength and growth in new HODLers.
Some price context since the Bitcoin market has moved exceptionally fast:
- 6 months ago price was $10.8k (below $20k ATH).
- 3 months ago price was $26.6k (before the first major pullback).
- 1 month ago price was $47.7k (Bottom of second major pullback)
(Side note: Can you believe that 6mths ago price was $10.8k!)
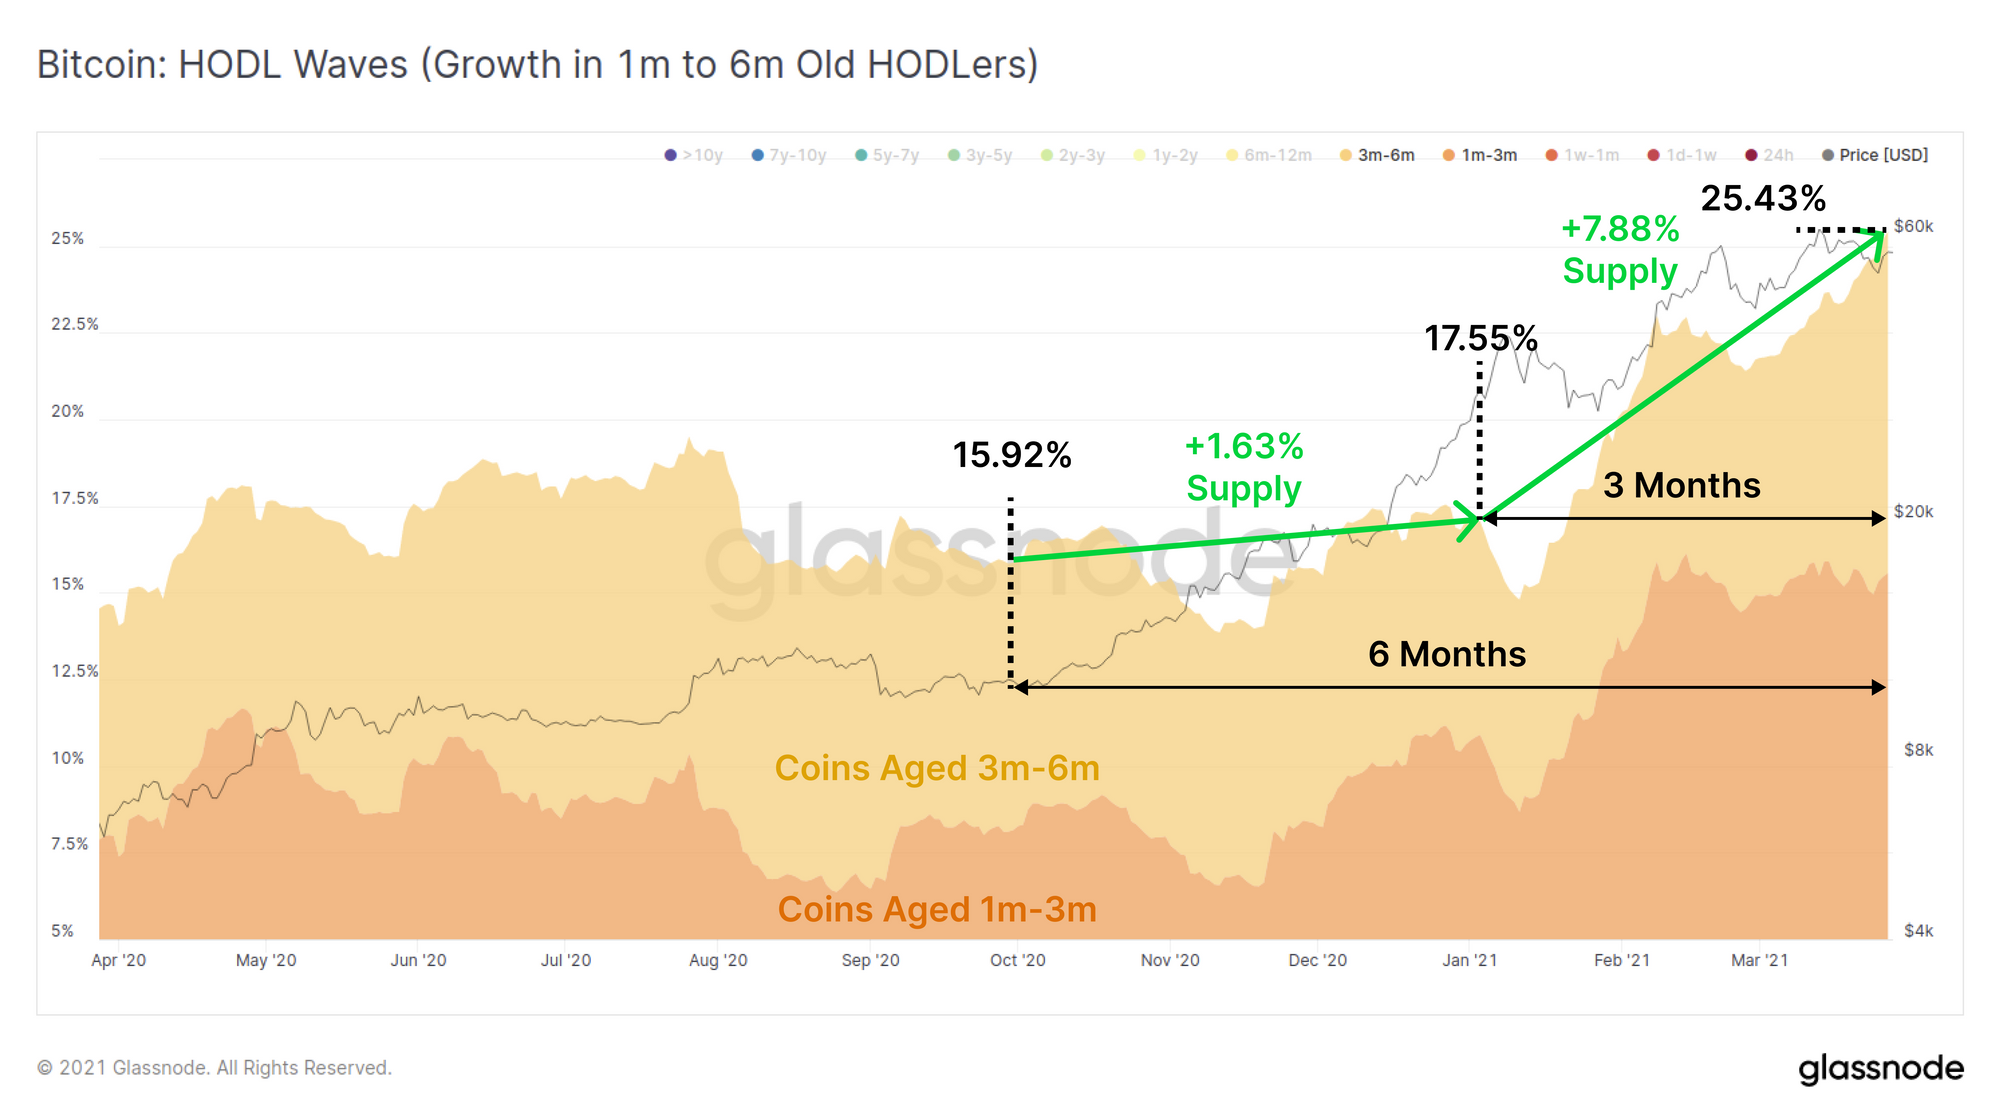
The HODL Waves chart below shows that the volume of coins with lifespan between 1m and 6m have swelled by over 9.51% of the supply, with a notable acceleration starting three months ago. Coins purchased between prices of $10.8k and $58.8k now represent 25.43% of the total supply with no sign of slowing down (HODL Waves trending up and to the right!).
This demonstrates a normalisation of buying the top and in fact, the overall shape of these combined HODL waves looks exactly like the price chart, just shifted 1 month to the right. The take home message here is that investors and traders have continued to buy in to BTC, throughout this bull market.
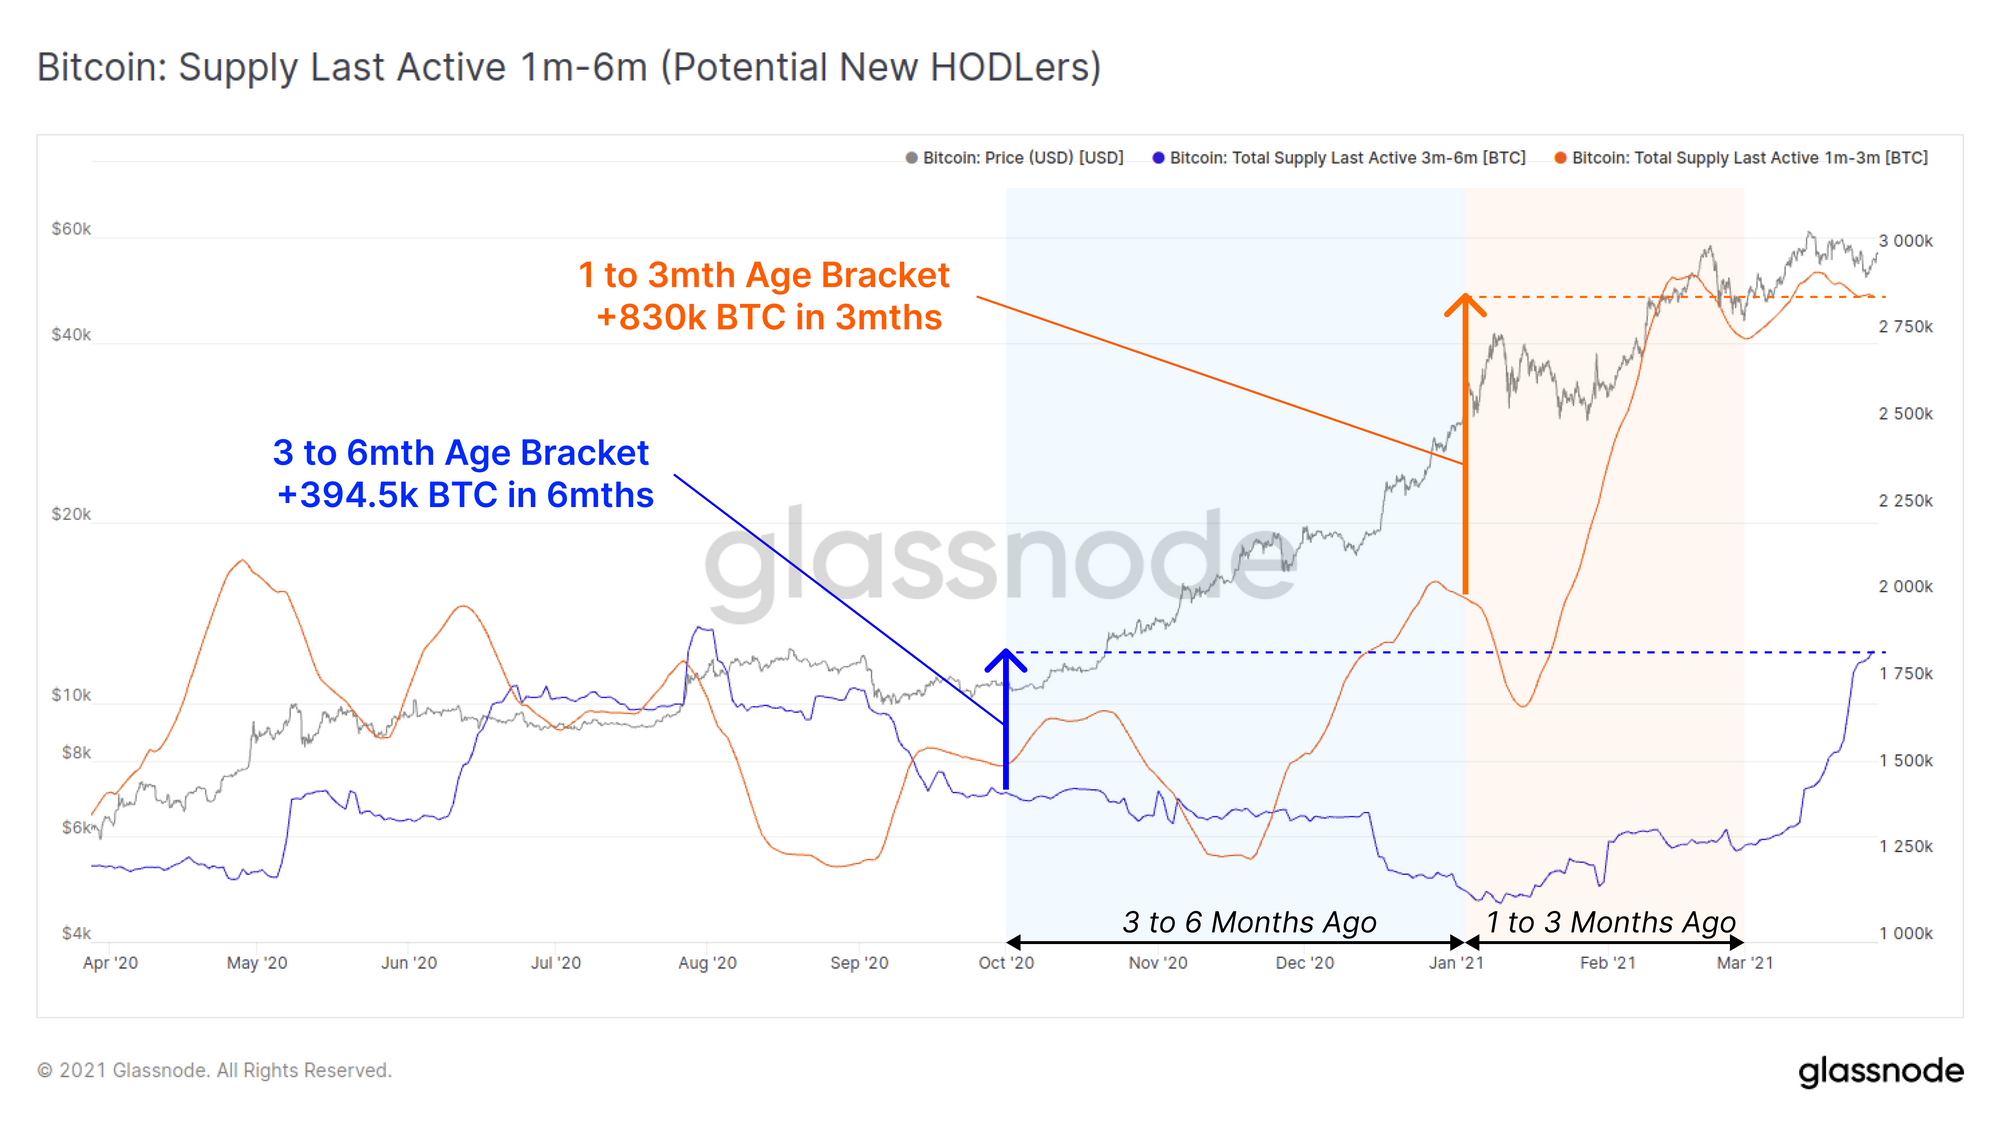
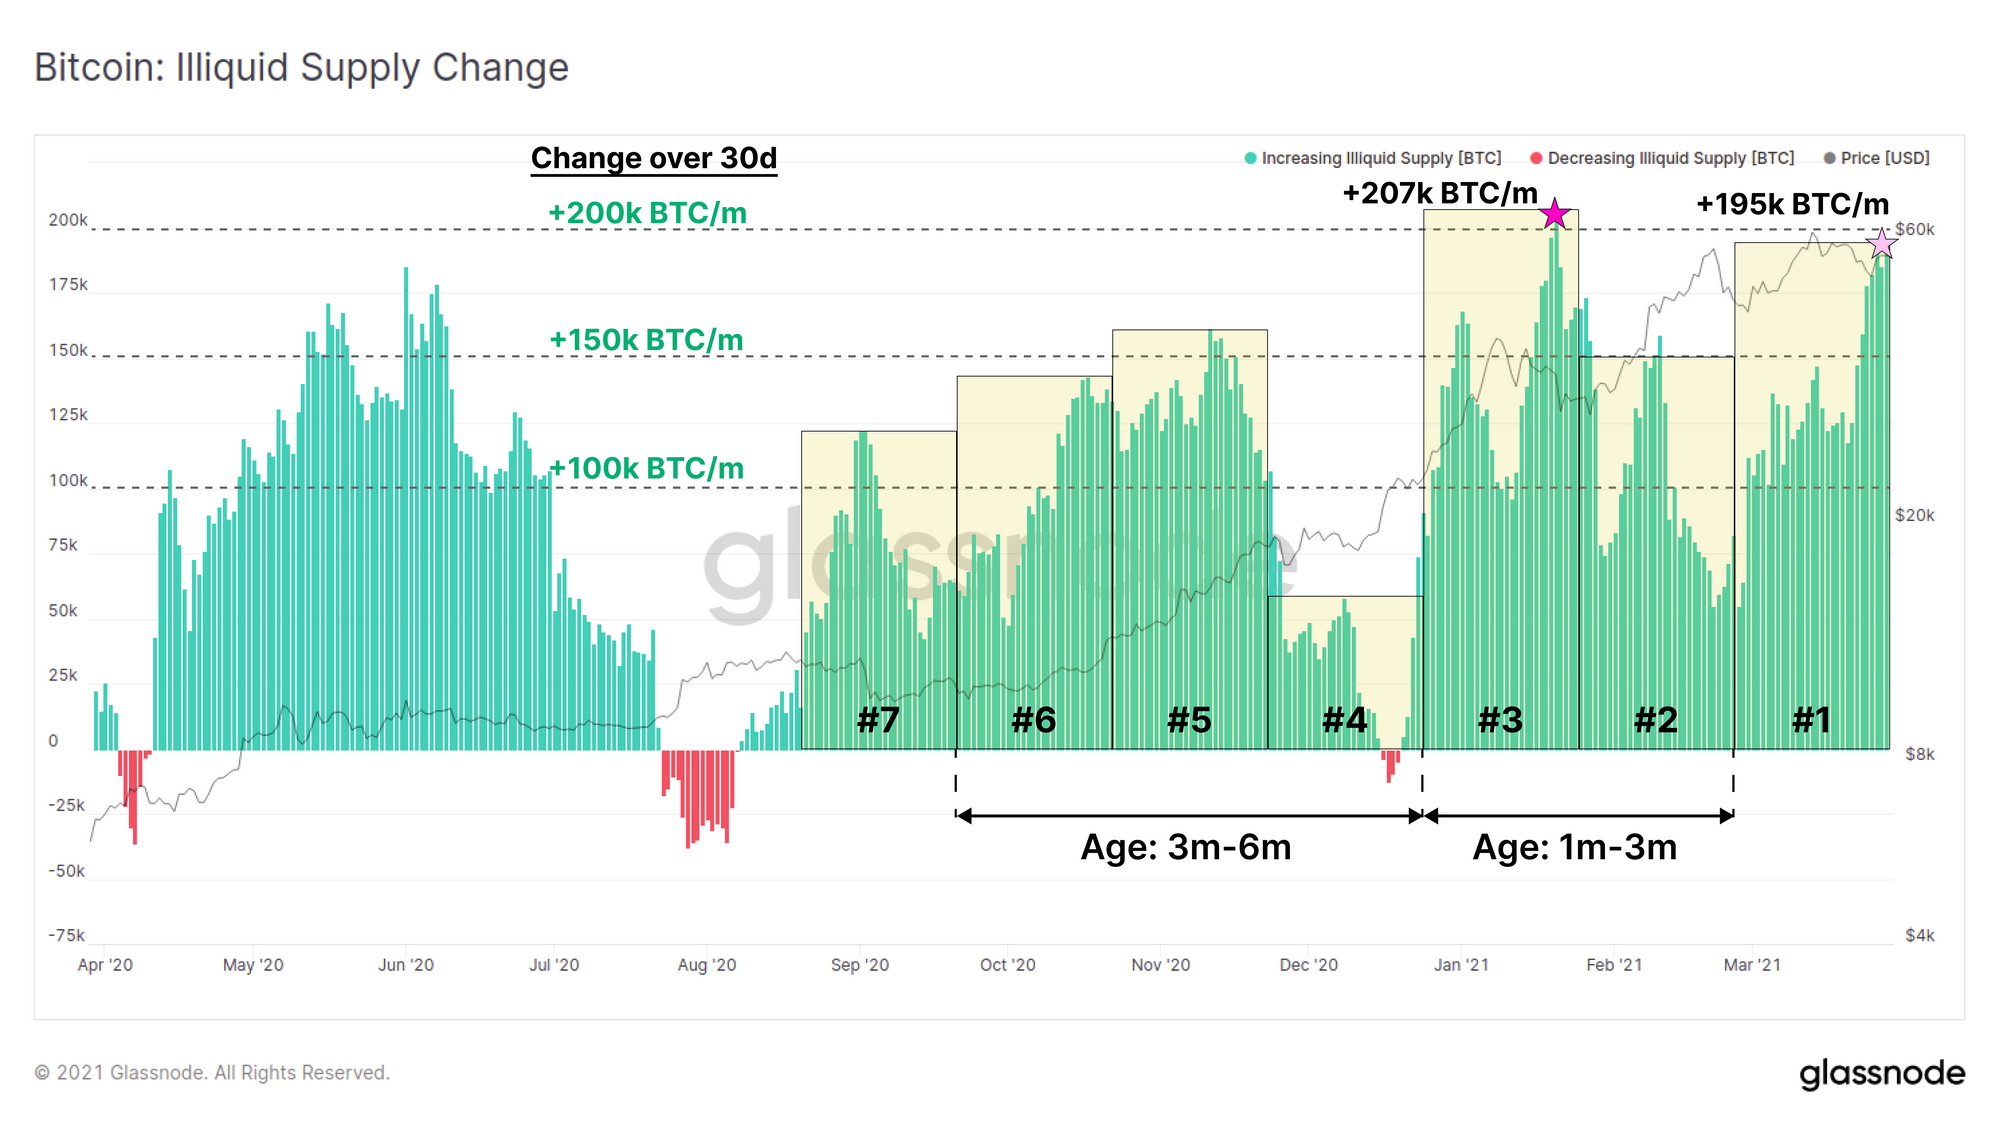
The next chart shows the volume of coins maturing in/out of these two age brackets. Coins aged 1m-3m (accumulated in orange zone) have grown by +830k BTC, whilst coins aged 3m to 6m (accumulated in blue zone) have grown by +394.5k BTC.
One of our most powerful metrics is the Illiquid Supply Change which shows the 30-day change in supply moving from a Liquid state (readily traded) into Illiquid state (HODLed coins). This can be due to both HODLers accumulating but also, importantly, coins maturing as their lifespan increases.
- Green bars are Liquid coins moving to HODLed state (accumulation).
- Red bars are HODLed coins moving to Liquid state (distribution).
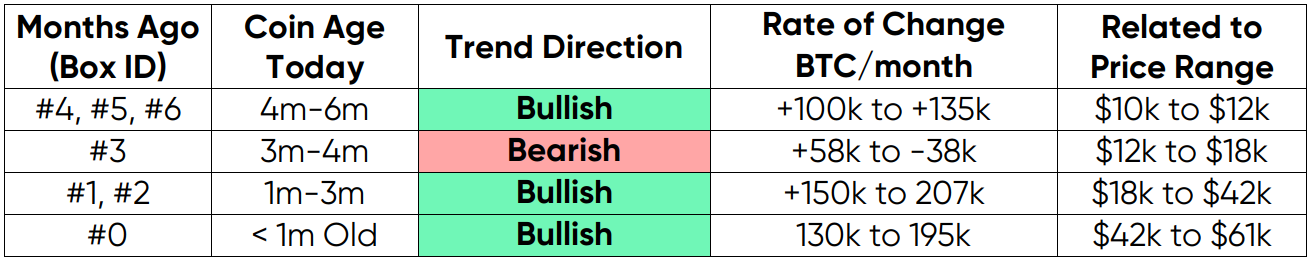
This chart looks at the monthly change, so we need to compare the bar chart (rate of change) to the price range in the preceding 30-days to see where periods where HODLer strength is increasing.
We can make the following observations regarding the supply vs demand balance over the past 6 months:
- Accumulation at rates exceeding +130k BTC/month have been consistently maintained throughout this bull market.
- Holders were nervous on the rally from $12k to $18k and distributed some coins (box #4).
- Significant Volume of coins matured/HODLed (+207k BTC/m) as price broke above last cycles ATH as shown by large green bars in Box #3 (related to prices in Box #4).
- Maturing and HODLing of coins continues today with a rate of change hitting +195k BTC/m this week.
Old Hands Slow Their Spending
As if quantifiable accumulation wasn't enough, we also have old hands slowing their spending this week.
Many on-chain metrics measure we use to HODLer strength use lifespan to quantify how long a coin has been held in wallets. As coins mature and get older, it indicates they are more likely to be held by stronger hands who are not shaken out by price volatility.
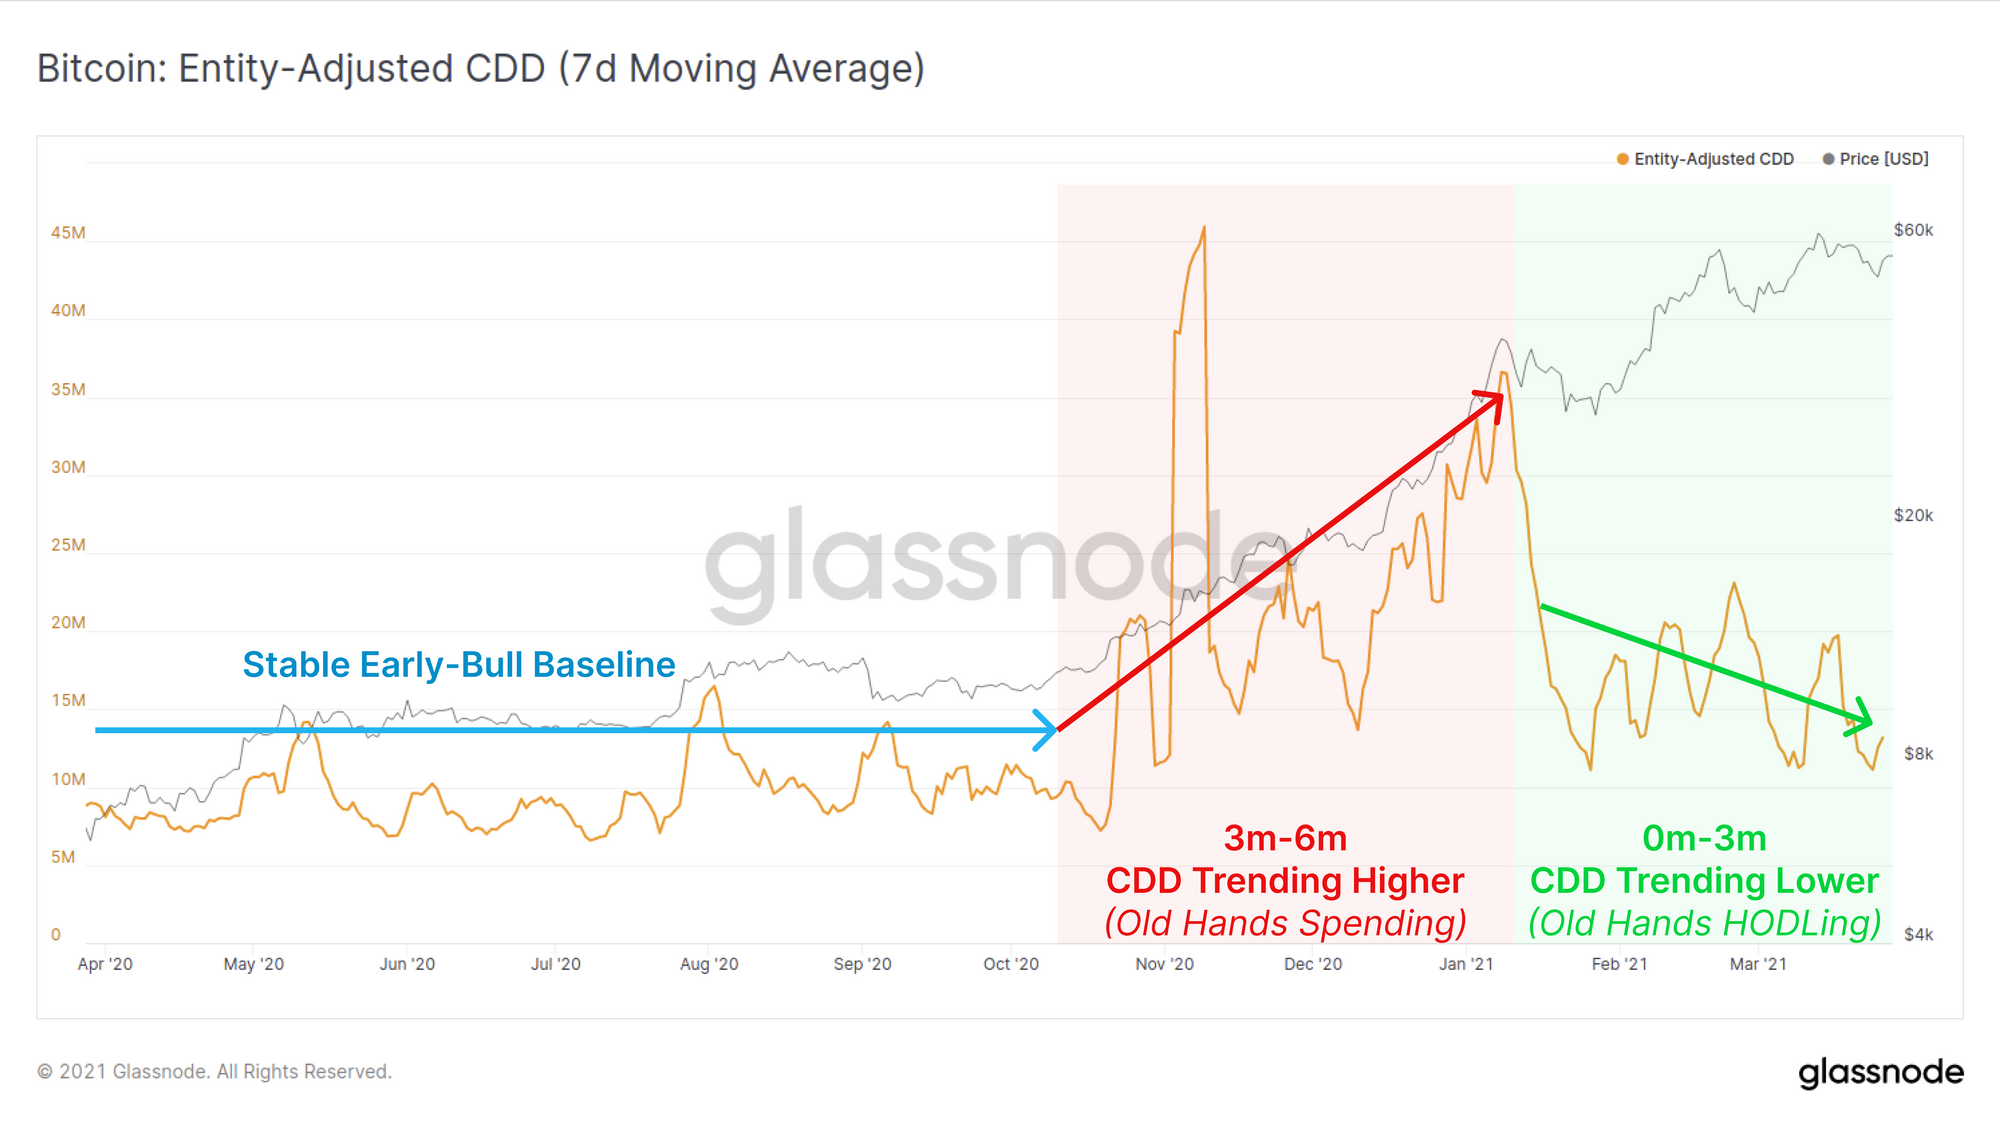
Coin Days Destroyed (CDD) is a metric that:
- Trends higher when LTHs are distributing (many coin days destroyed, e.g. red zone).
- Trends lower when LTHs are HODLing (fewer coin days destroyed, e.g. green zone).
The CDD metric indicates that over the last three months, Old Hands have slowed their spending significantly. This week in particular, CDD has returned to levels similar to the early 2020 bull market baseline signalling HODLing is the preferred behaviour for old coins.
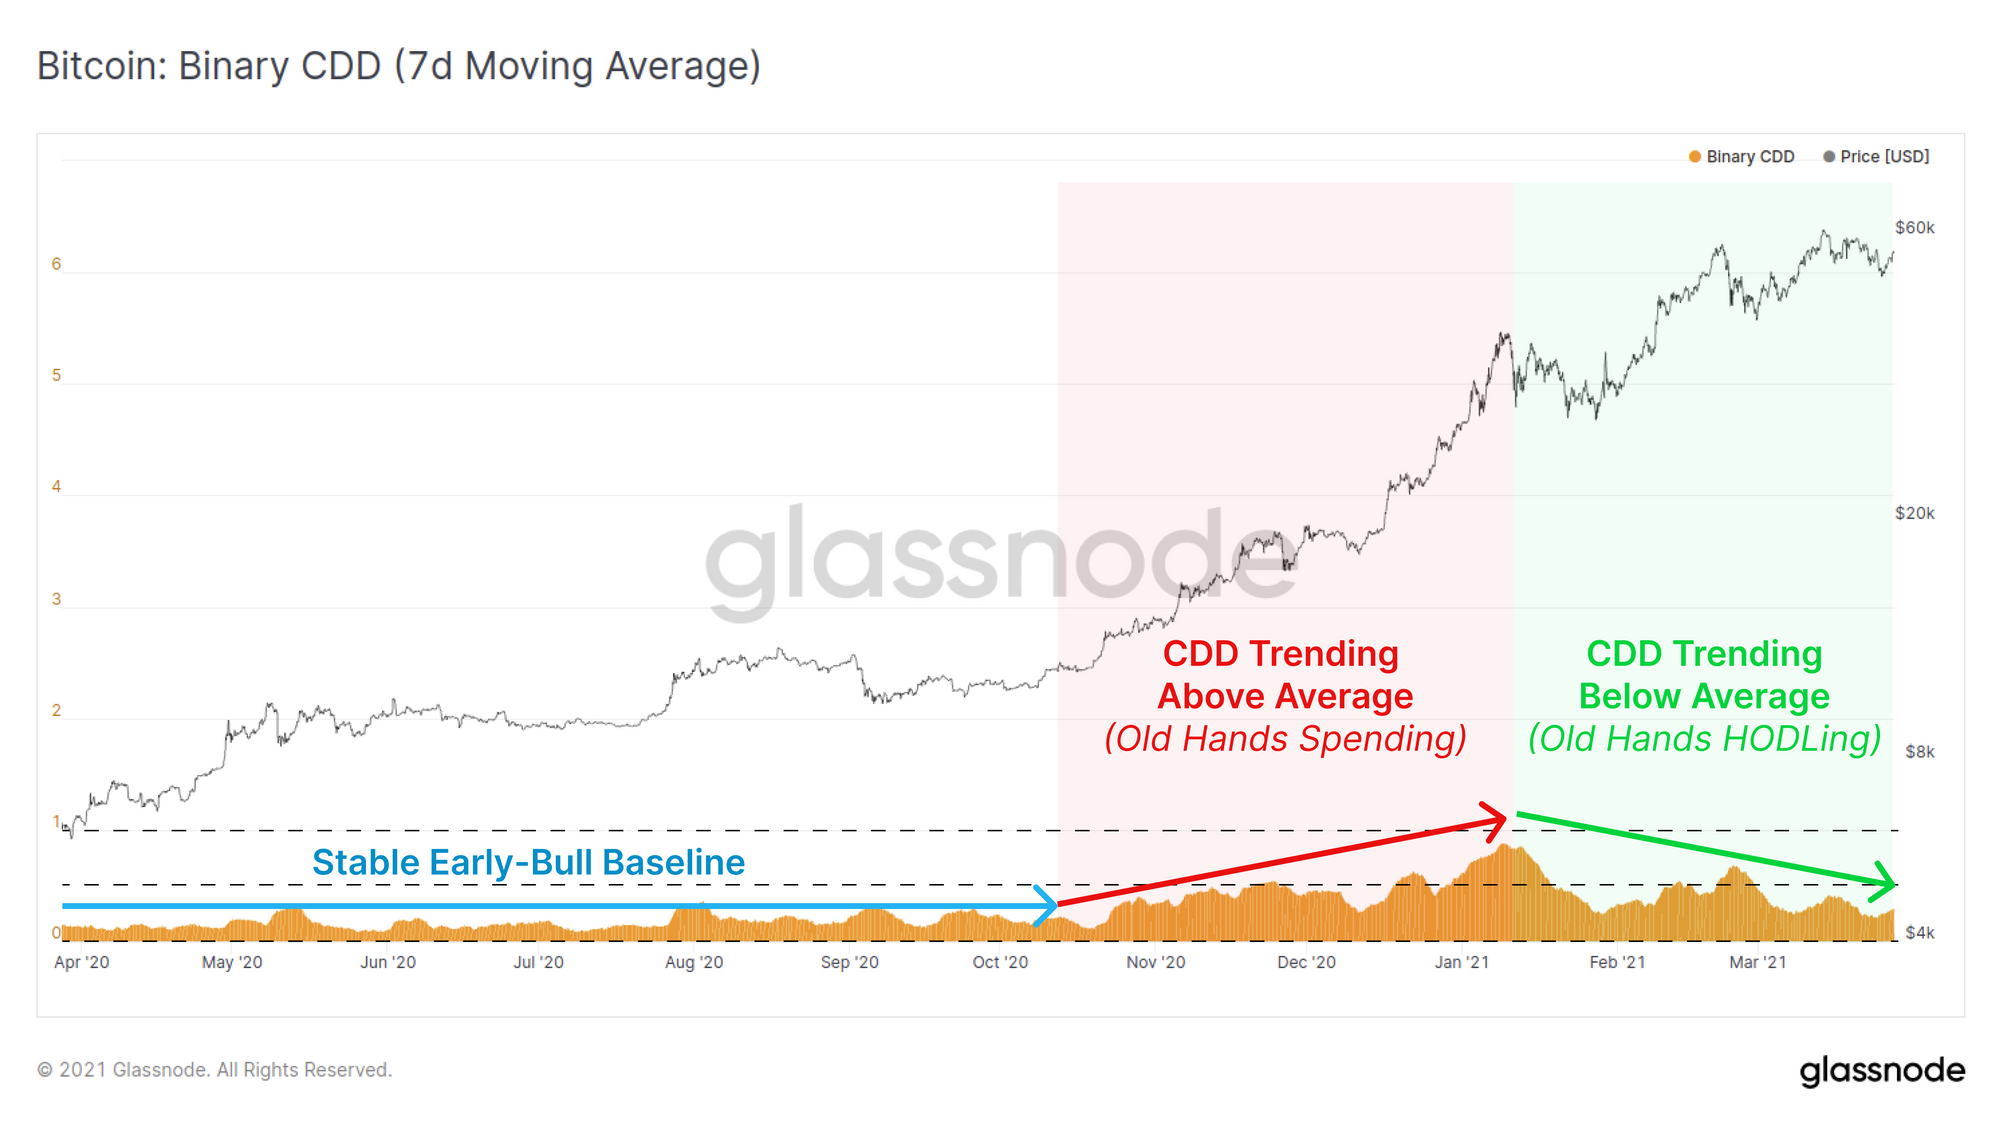
We can also see this behaviour in the Binary CDD metric which measures whether coin day destruction is greater than, or less than the long term average. Here we have applied a 7-day moving average that shows the last three months have indeed been trending below average, indicating LTHs are HODLing more and spending less.
Hint: Applying moving averages to Binary CDD helps spot trends and filter noise from the indicator. Check out our improved metric explanations in Glassnode Academy for details.
Finally, we take a look at Liveliness, a metric that looks at macro activity on-chain. It compares cumulative on-chain activity to the cumulative lifespan of the protocol. The most important observation related to Liveliness is the prevailing trend direction:
- Downtrend (green): More coin days accumulated than destroyed. This means HODLing behaviour dominates.
- Steep Uptrend (red): Significantly more coin days destroyed than accumulation. This means Old Hands are spending heavily.
- Gentle Uptrend (orange): More coin days destroyed than accumulated. This means Old Hands are spending, but are not rushing for the exits.
- Sideways (blue): Balanced accumulation and destruction suggesting HODLing is increasing, especially relative to the preceding uptrend.
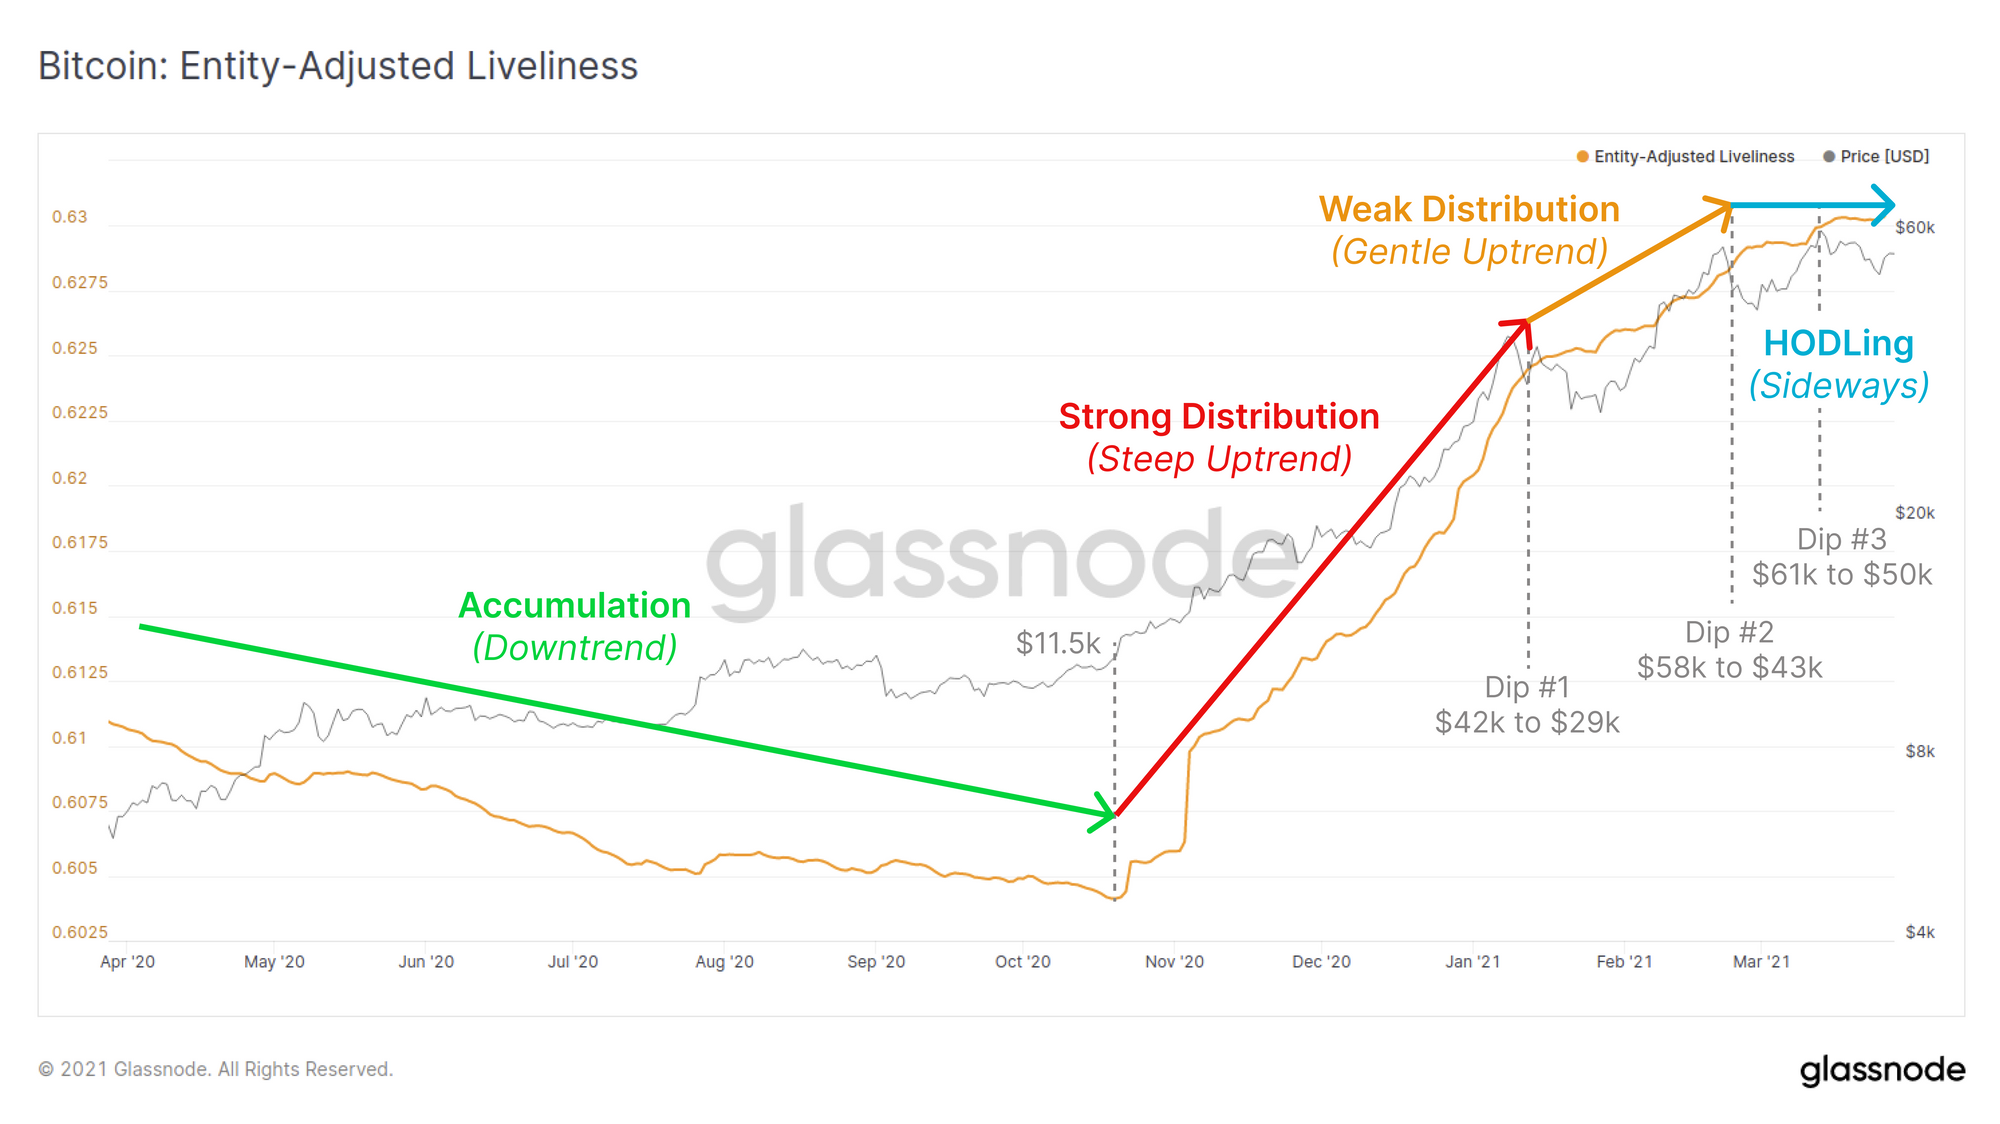
Since the first major dip from $42k to $29k, we have seen a notable slow down in LTH spending. This, alongside strong signals of accumulation show a supply vs. demand balance that is unlike any bull cycle we have seen before.
And just when you thought supply dynamics weren't exciting enough already...let's deep dive into exchange balances.
Weekly Feature: Exchange Balance Deep Dive
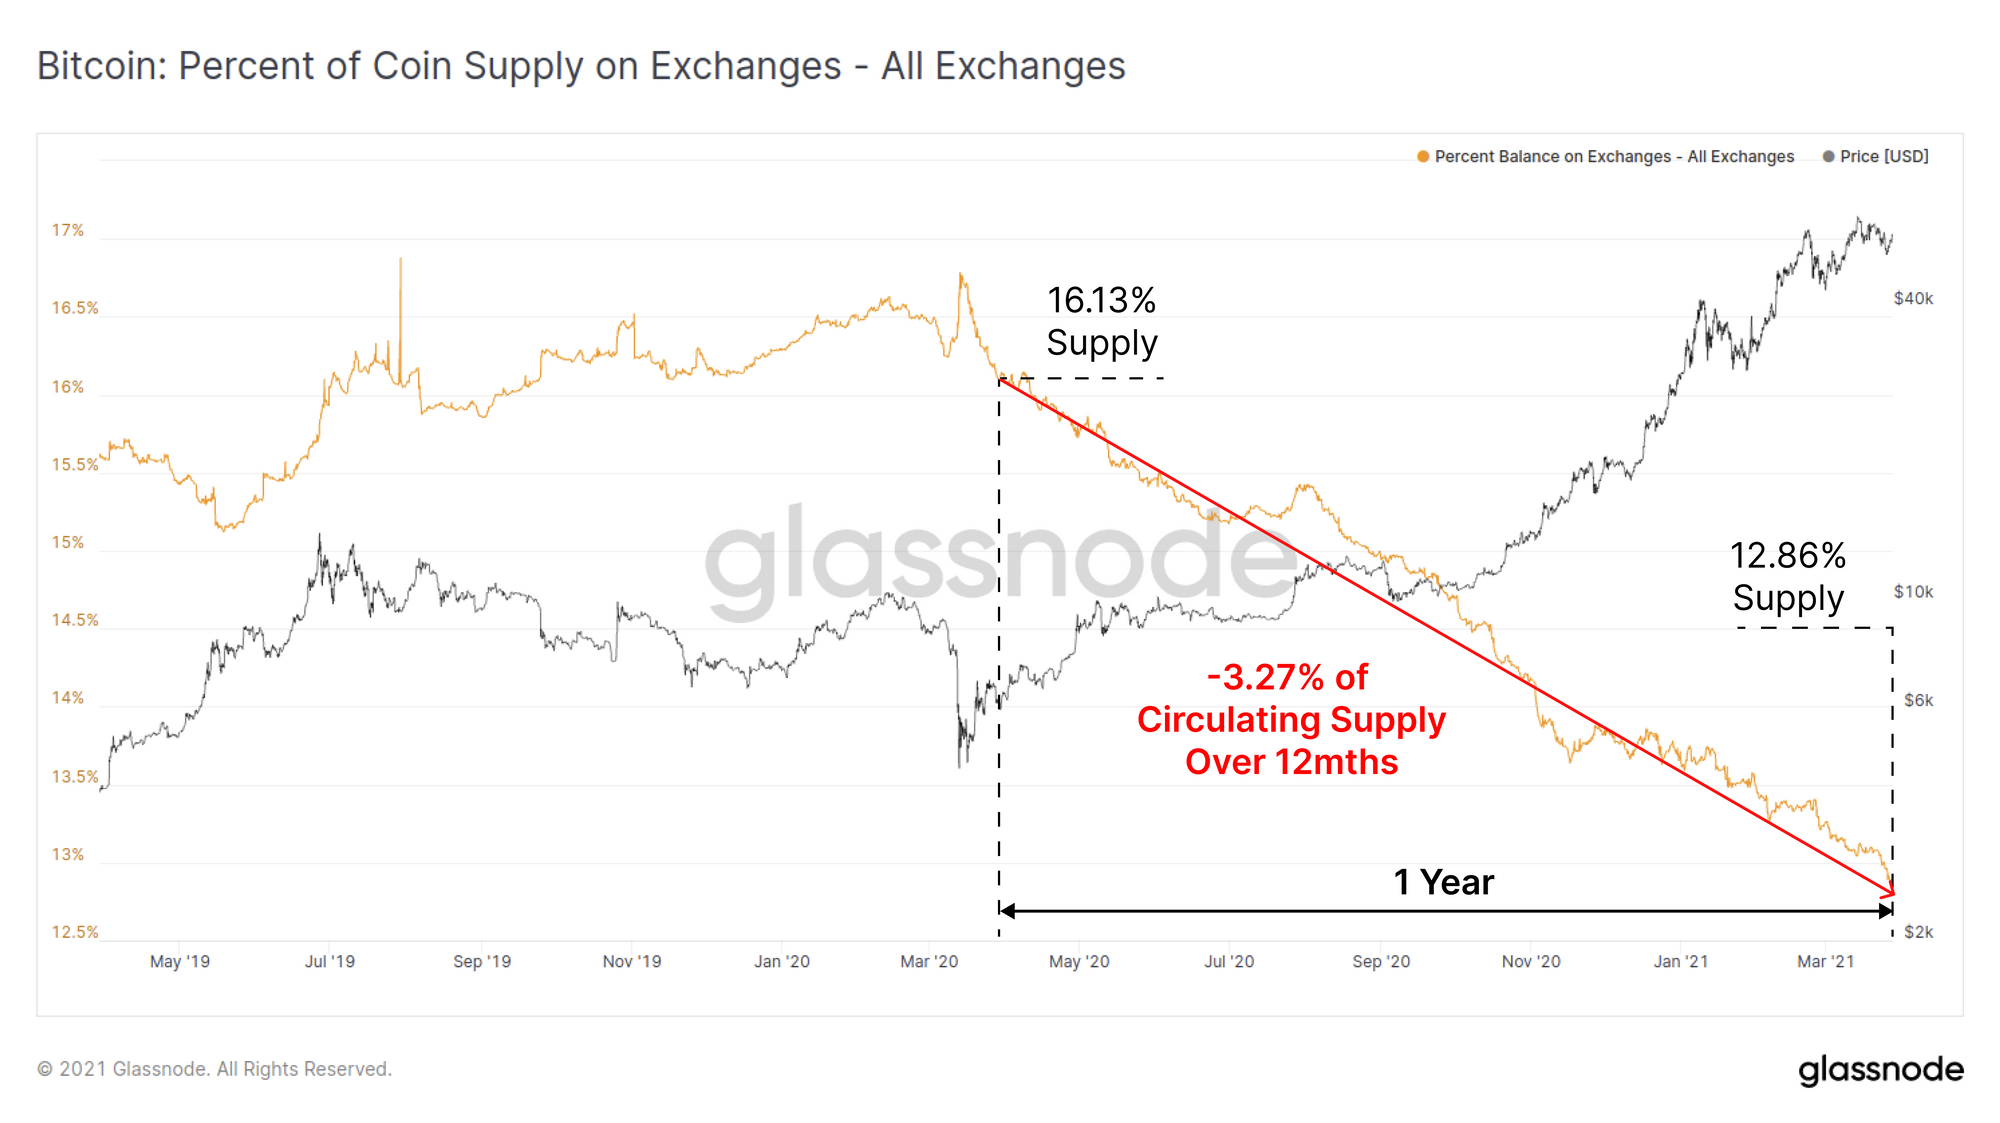
It is no secret that exchange balances have been in a consistent downtrend as more and more coins are accumulated and transferred into long term storage. Over the past 12 months alone, over 3.27% of the circulating BTC supply has migrated out of exchanges and into third part wallets.
Some of these coins will be self-custodied by sat stackers, whilst others will be held on behalf of institutions by professional custodians.
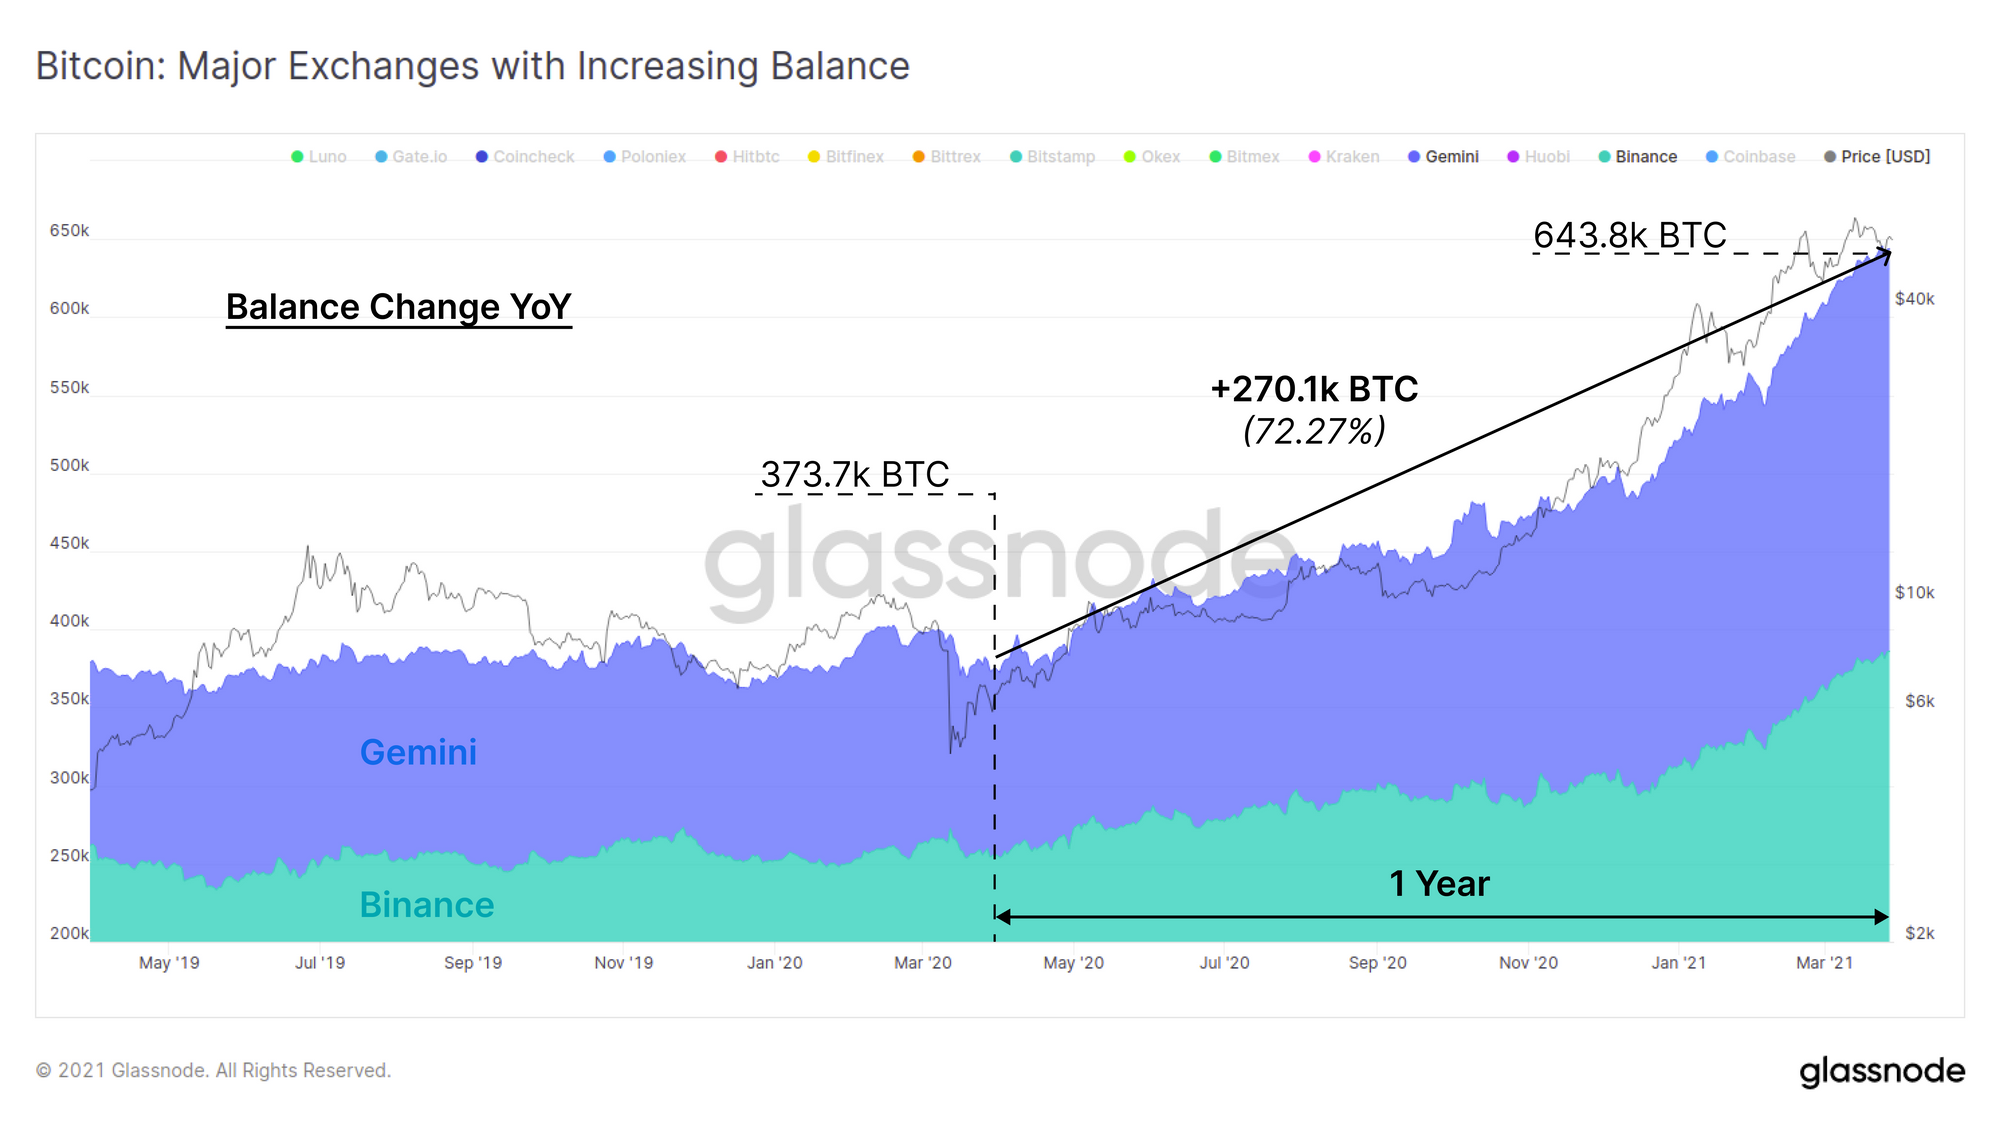
Over the past year, only two major exchanges have seen aggregate positive inflows (increased balances), Binance and Gemini. These two exchanges have attracted combined inflows of over 270k BTC, representing significant increases to their total balance. A significant portion of Gemini inflows will also correlate with Gemini's institutional custody solutions which further adds to the supply held in long term storage.
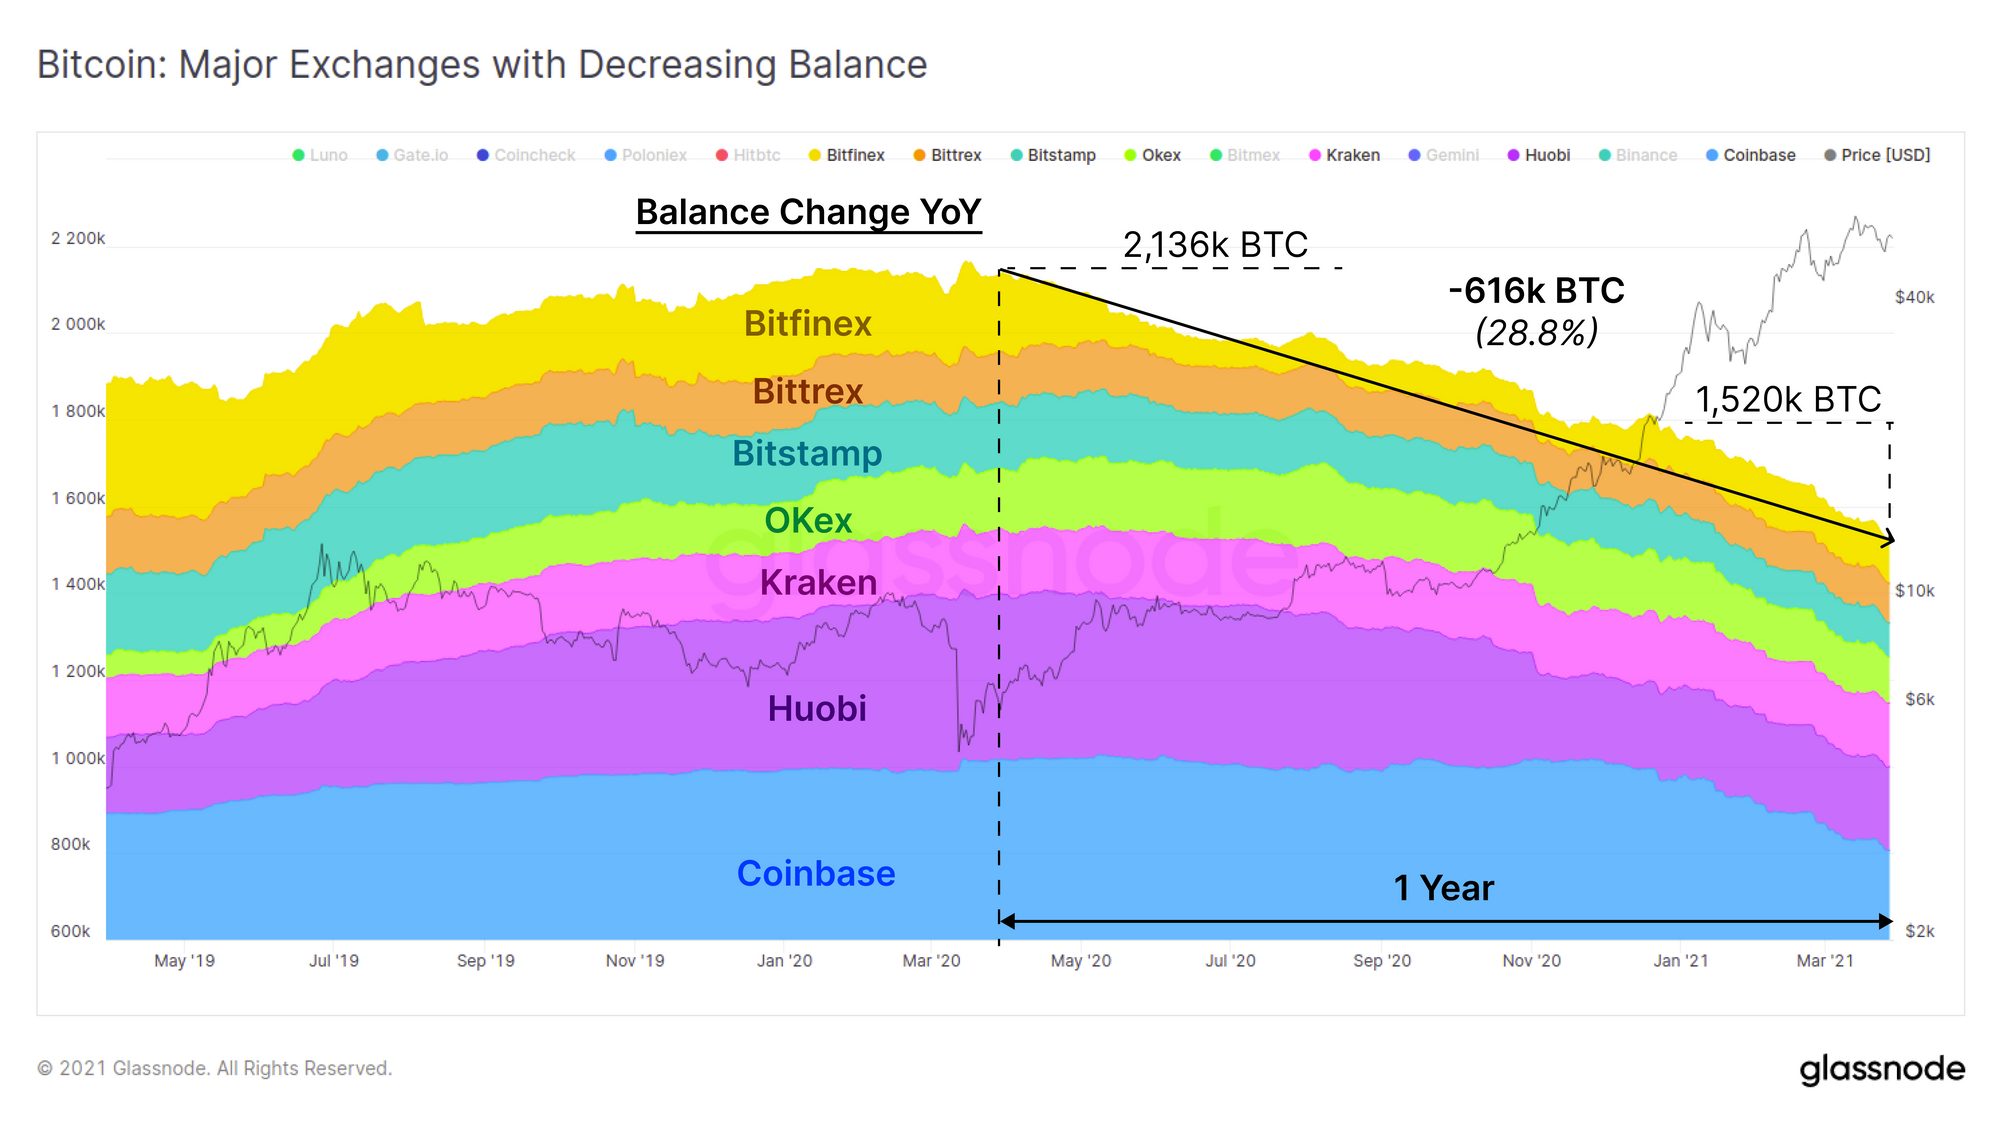
Meanwhile, the remaining major exchanges have seen combined outflows of over 616k BTC over the past year. Between Coinbase and Huobi alone, the combined outflow is around 400k BTC which completely offsets the positive inflows into Gemini and Binance.
This demonstrates the magnitude of the exchange balance draw-down that has occurred since March 2020.
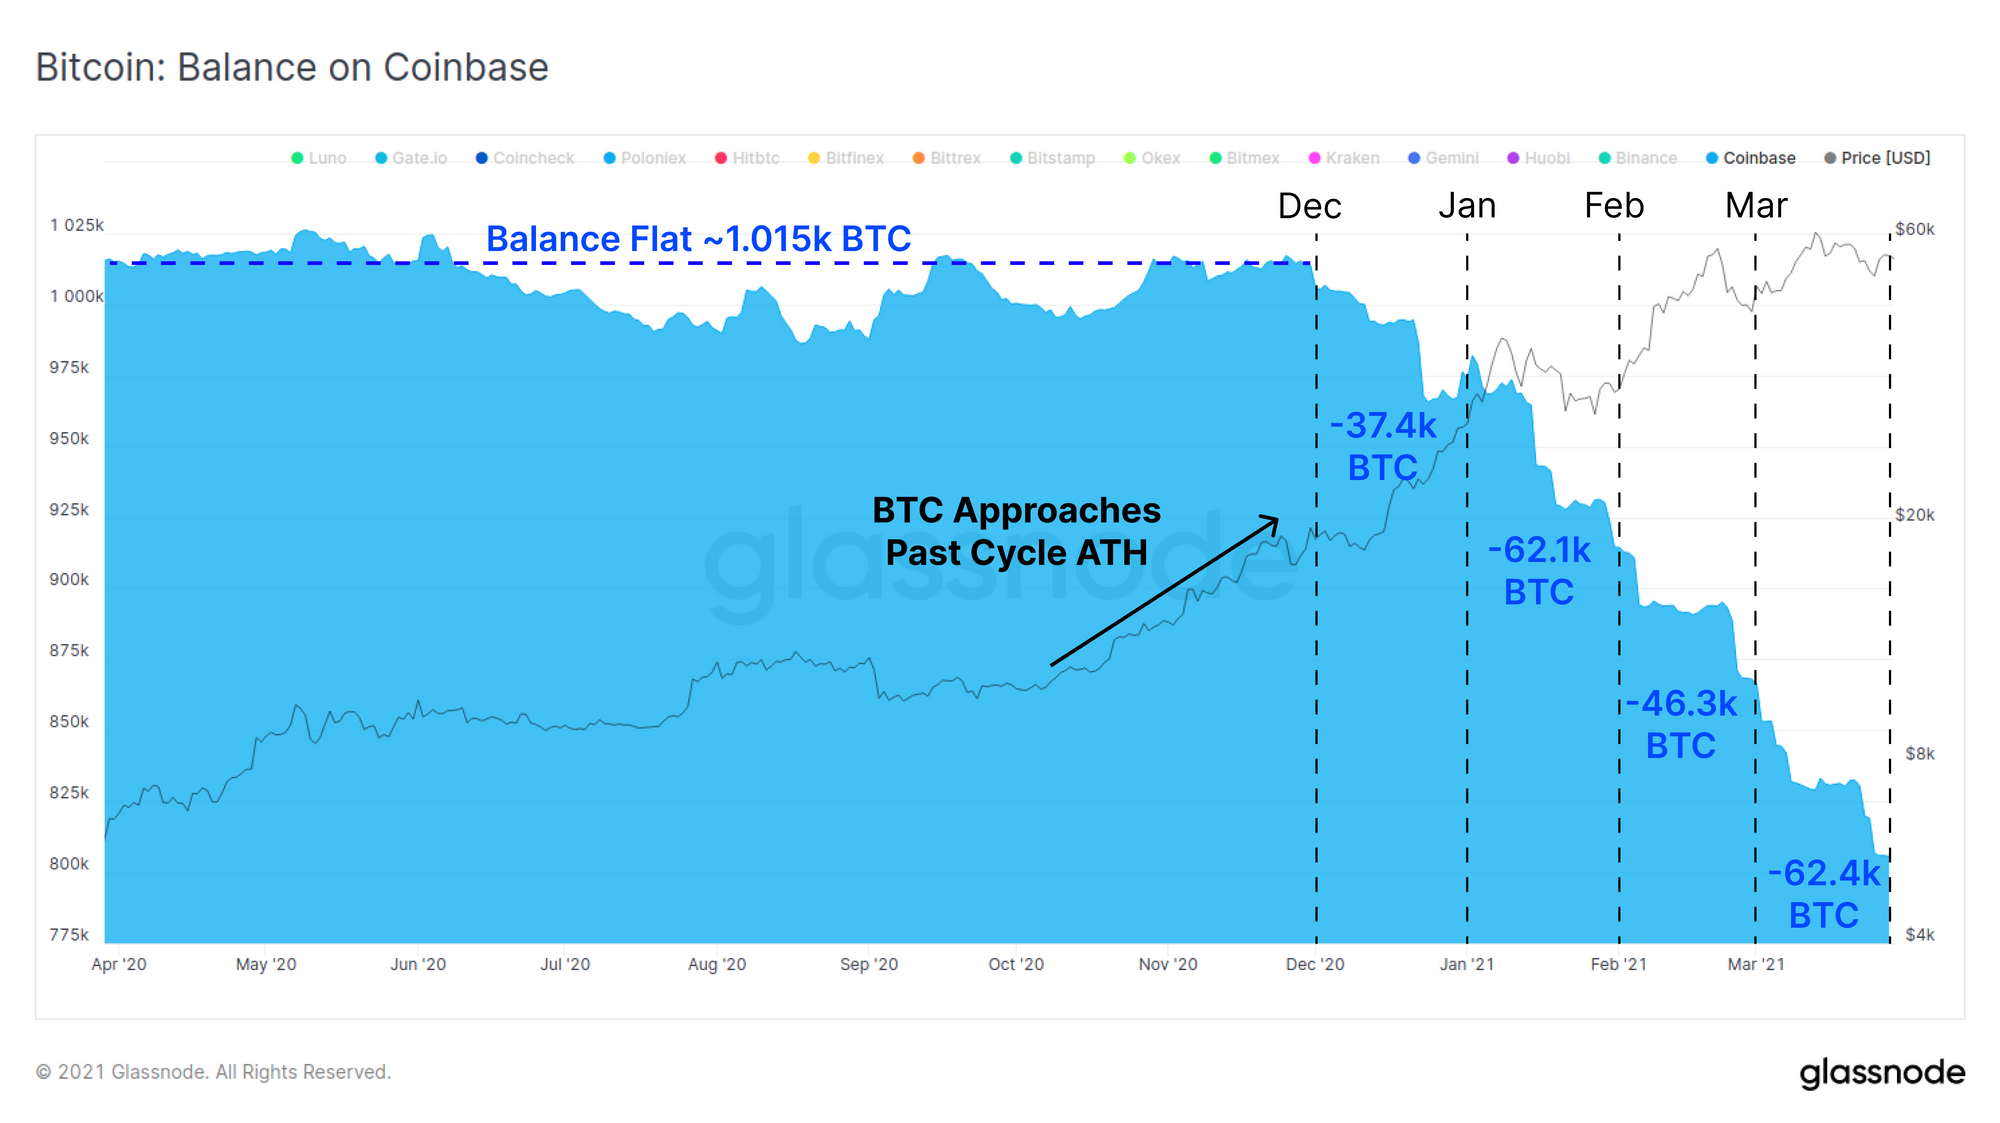
Of particular interest is the balance of coins on Coinbase, a preferred venue for accumulation by US institutions. The chart below shows the BTC balance on Coinbase over the past year.
We can see that in December 2020, the game changed. As BTC price approached the previous cycle ATH at $20k and market confidence grew, serious institutional accumulation commenced. This started with 37.4k BTC withdrawn in December.
In the months that followed an incredible stair stepping 'whale cost averaging' pattern emerged, as tens of thousands of coins were accumulated each month. The consistency, frequency and size of this balance change is astounding to see play out in on-chain data and really shows the aggressive accumulation by institutions this year.
Watching supply and demand dynamics play out on-chain is a fascinating process. By combining coin lifespan, considering age brackets and spending behaviour alongside exchange balances, we can establish a model for the overall coin flow in across the network.
It is important to remember monitoring exchange inflows and outflows is a dynamic system with imperfect data. It is key to consider all such metrics as indicative and within a wider macro trend and context. At Glassnode, we aim to present the highest quality and most accurate data possible and use publications like this one to help contextualise our metrics.
New Glassnode Content
Introduction to On-chain Analysis
If you are wondering where to start with on-chain analysis, we have collaborated with Bitcoin Magazine to bring out a new monthly series covering the fundamental principles of this new analysis technique. Our goal is to make on-chain analysis accessible for everyone.
Be sure to check out Issue #1: Introducing On-chain Bitcoin Analysis!
Our Latest Newsletter: Uncharted
Check out out bi-weekly newsletter,