The Week On-chain (Week 14, 2021)
Bitcoin solidifies its position as a $1 Trillion asset as on-chain indicators signal market confidence.


Bitcoin Market Overview
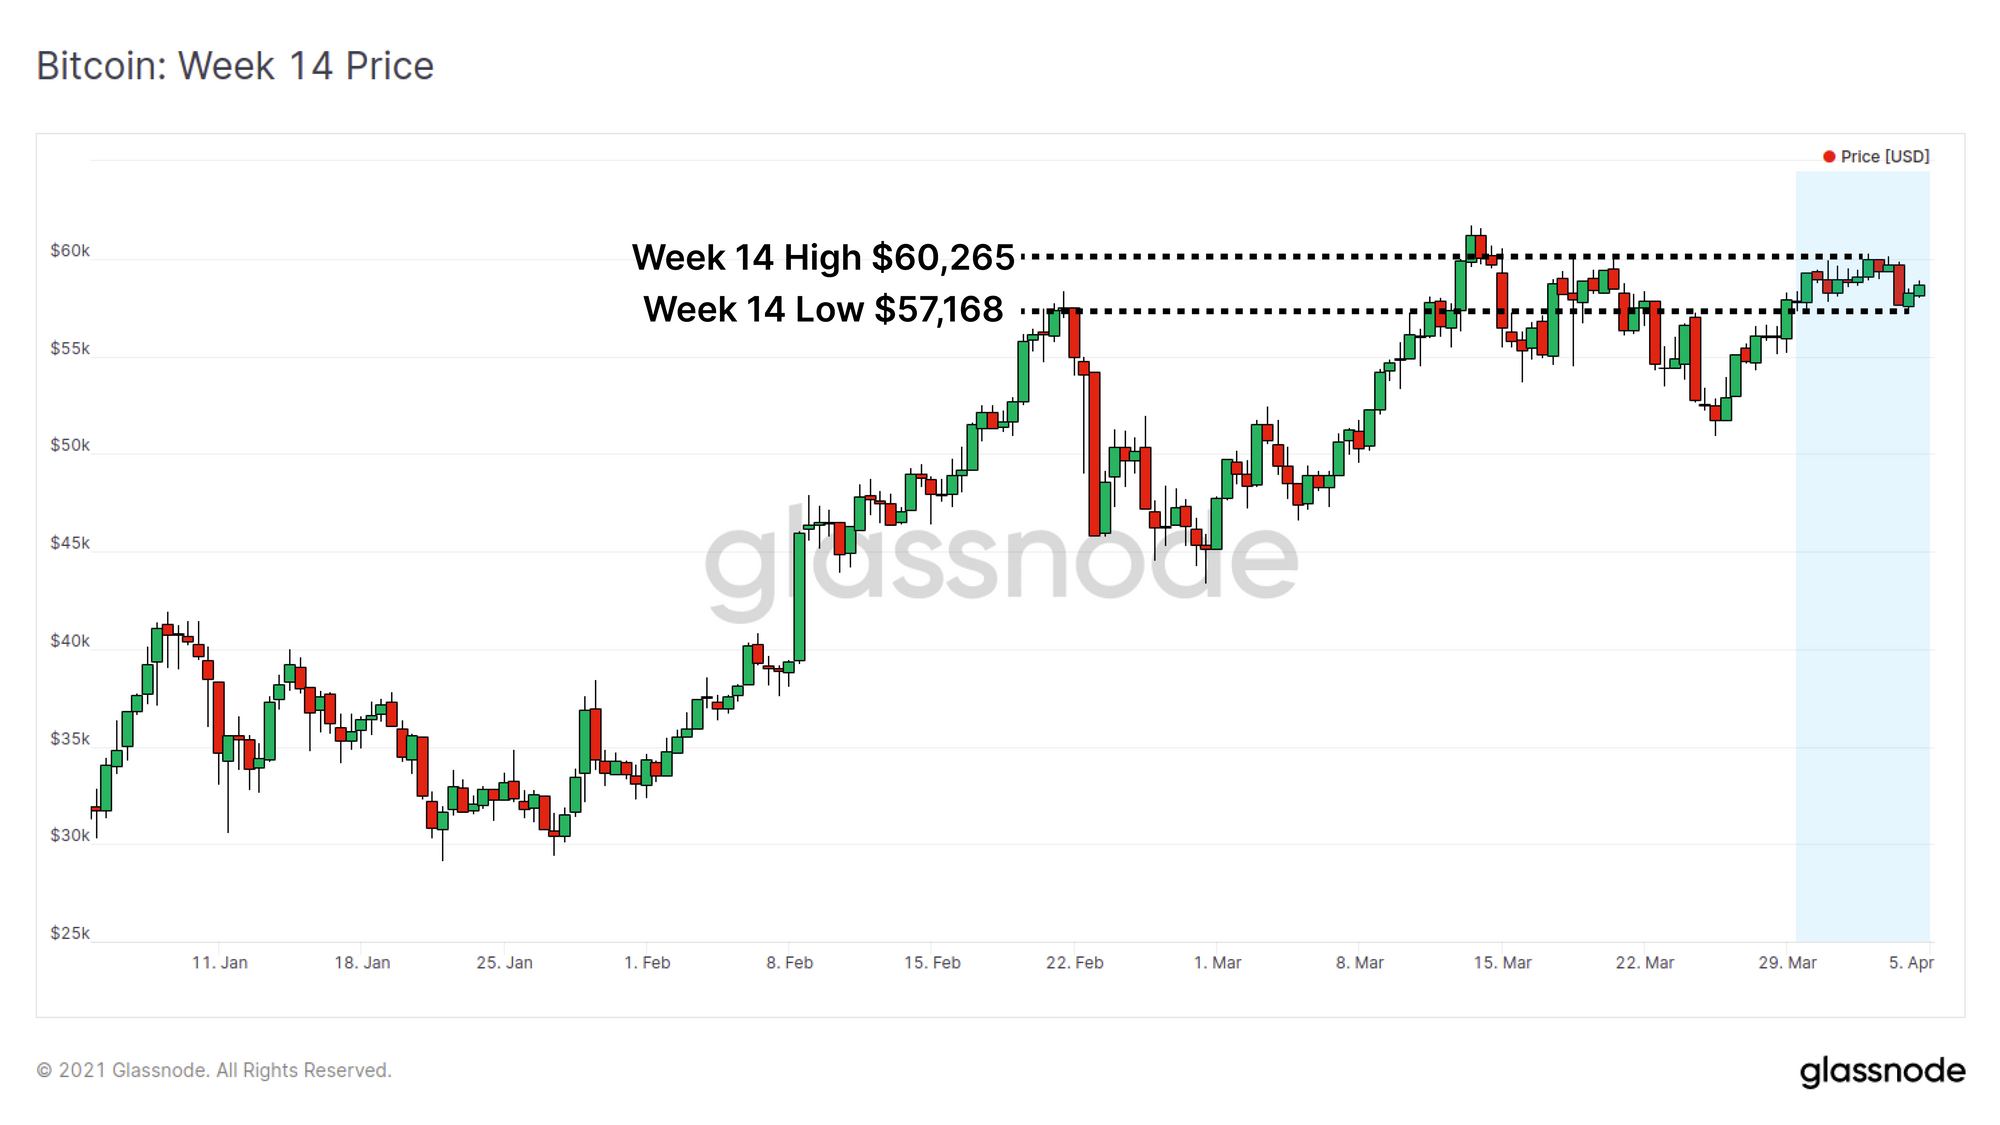
The Bitcoin market has traded within a relatively narrow 5.4% range this week, between a low of $57,168 and a high of $60,265. Bitcoin has now reached the milestone of trading at a $1 Trillion market capitalisation for one whole week, a position that will hold for all prices above $53,566. This is a strong vote of confidence for Bitcoin and the cryptocurrency asset class as a whole.
On-chain activity continues to reinforce this position with a volume equivalent to over 10% of circulating supply transacting above the $1 Trillion threshold. Meanwhile, miners have returned to accumulation mode and on-chain metrics have almost reset. Interestingly, futures open interest has hit new ATHs whilst both volume and short liquidations are in decline.
$1 Trillion On-chain Support
Having now entered the 'twelve zeros club', the immediate question is whether the market can sustain these levels and what degree of price support we have below us.
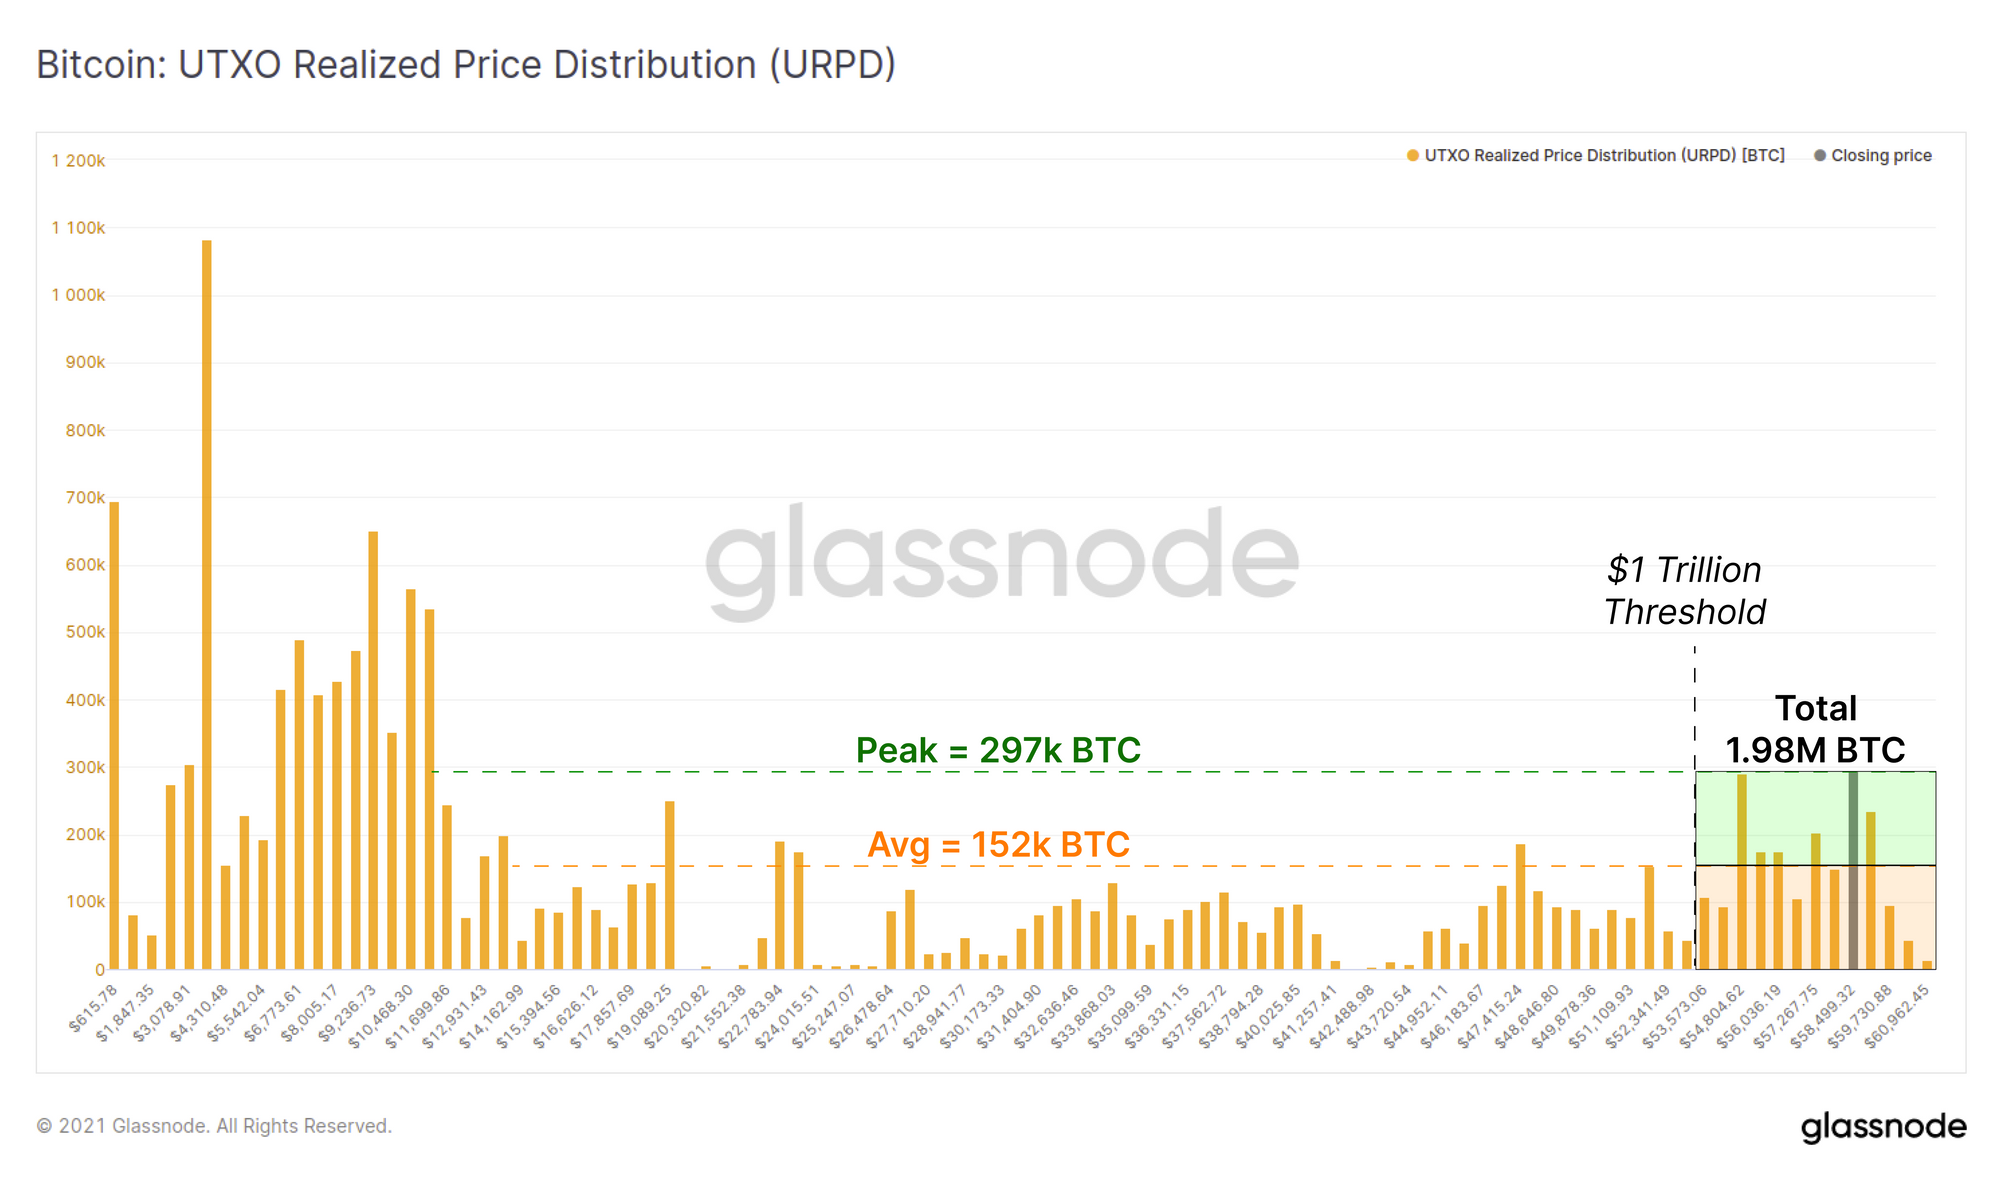
The URPD metric shows on-chain transaction volume grouped into price clusters, forming an on-chain equivalent to the volume profile metric often deployed in technical analysis. Where a large volume of coins are transacted within a particular price band, it is likely to form a strong support (or resistance) level.
Above the $1 Trillion Threshold, over 1.98M BTC have been transacted, equivalent to 10.6% of the circulating supply. Impressively, this on-chain volume has formed one of the strongest on-chain support levels since prices were $11k to $12k.
Peak volume in this cluster hit 297k BTC, transacted between $58.5k and $59.1k. The average volume of this cluster is 152k BTC which is also higher than the majority of clusters transacted at lower prices. It is likely that this volume cluster will form a very strong support level and appears to be justifying Bitcoin's 'twelve zeros club' status.
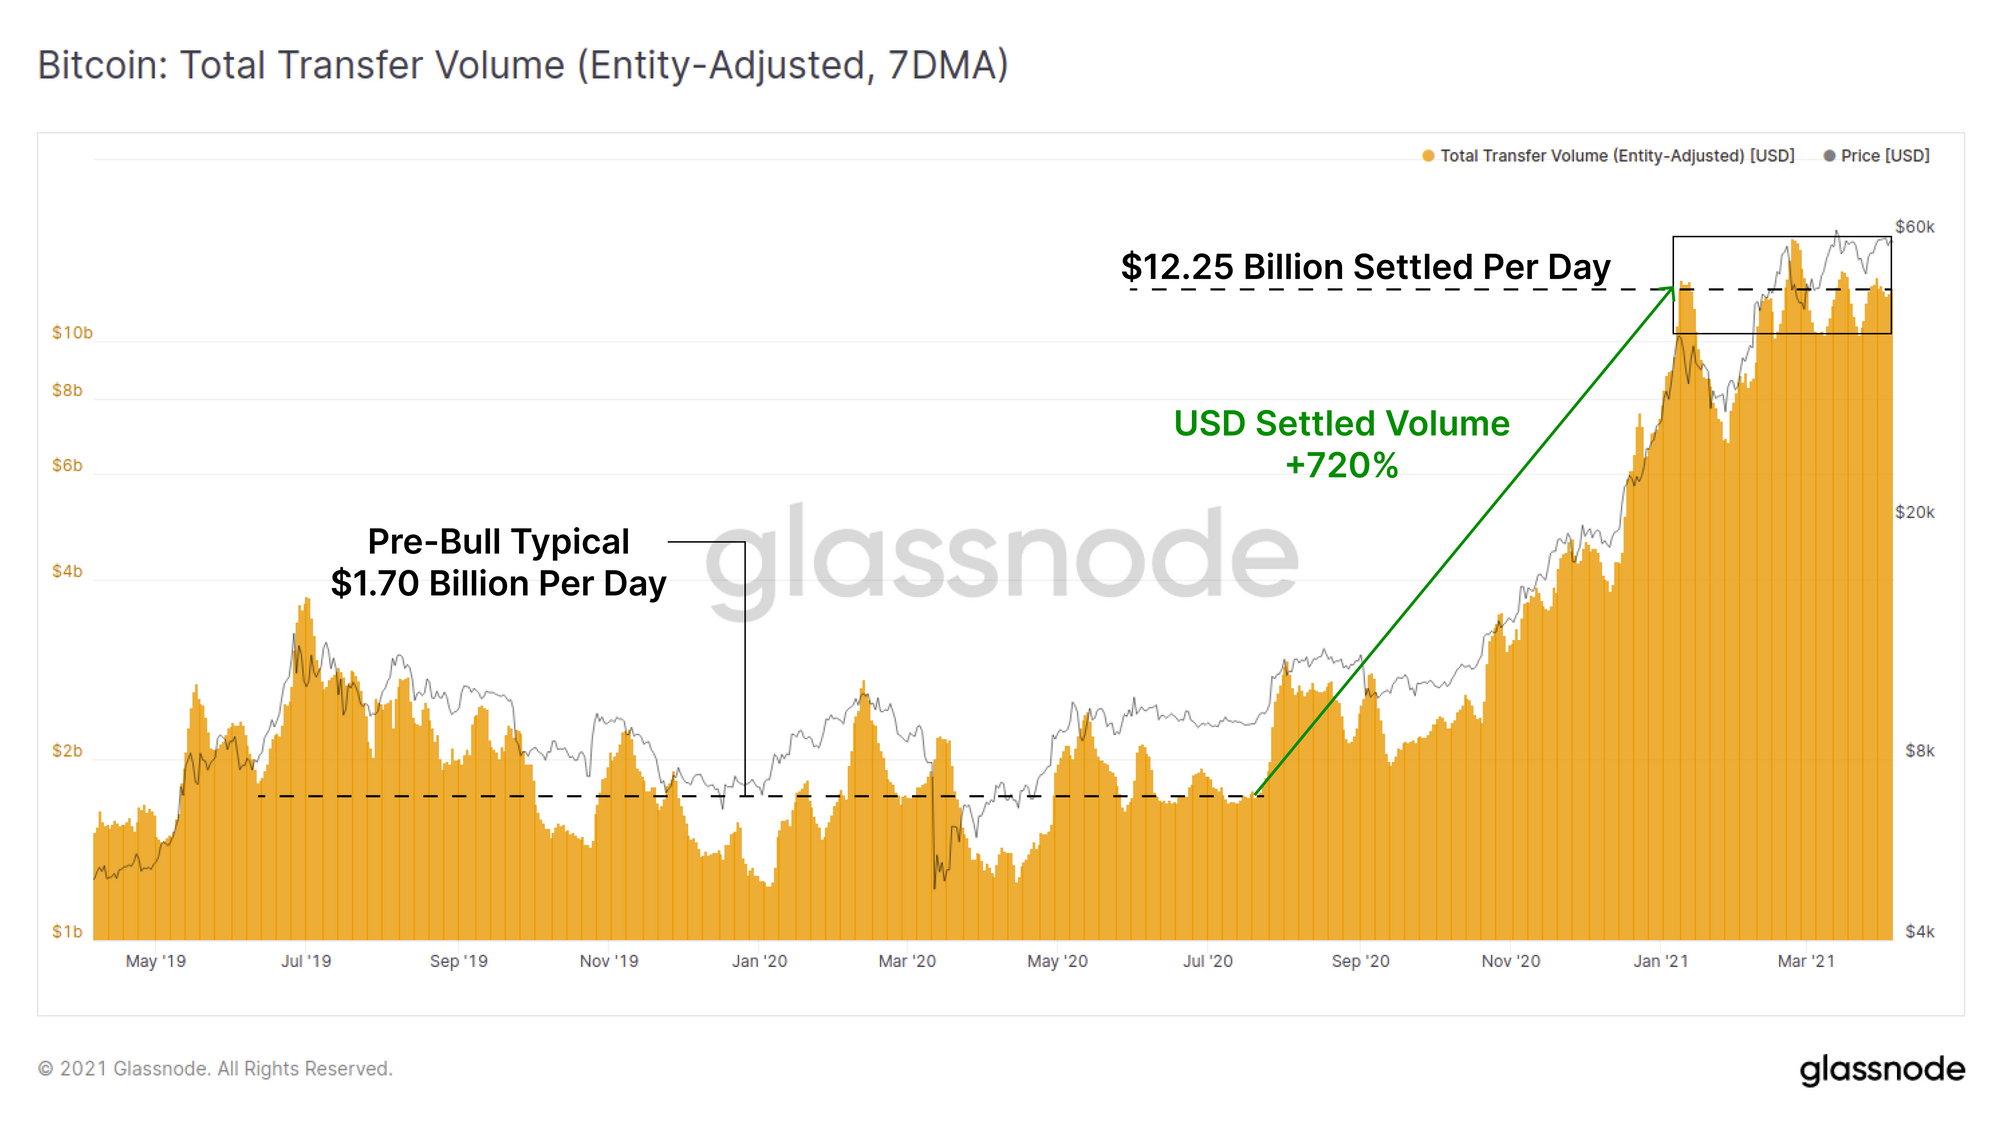
To support this observation, we review the total transaction volume denominated in USD over time. The chart below uses Glassnode's Entity Adjustment algorithm (EA) which is used to filter out transfers which are not considered economically meaningful (e.g. internal exchange transactions and self-transfers).
Through 2019 and into mid 2020, the Bitcoin network typically settled around $1.7B in EA volume per day. On-chain transaction volume has since risen, alongside price, by over 720%, now settling a typical $12.25B in EA value per day. This implies that despite the significant increase in coin price, there has been an an equivalent increase in transaction (and trade) volume to support and justify the bull market performance.
On-chain Sentiment
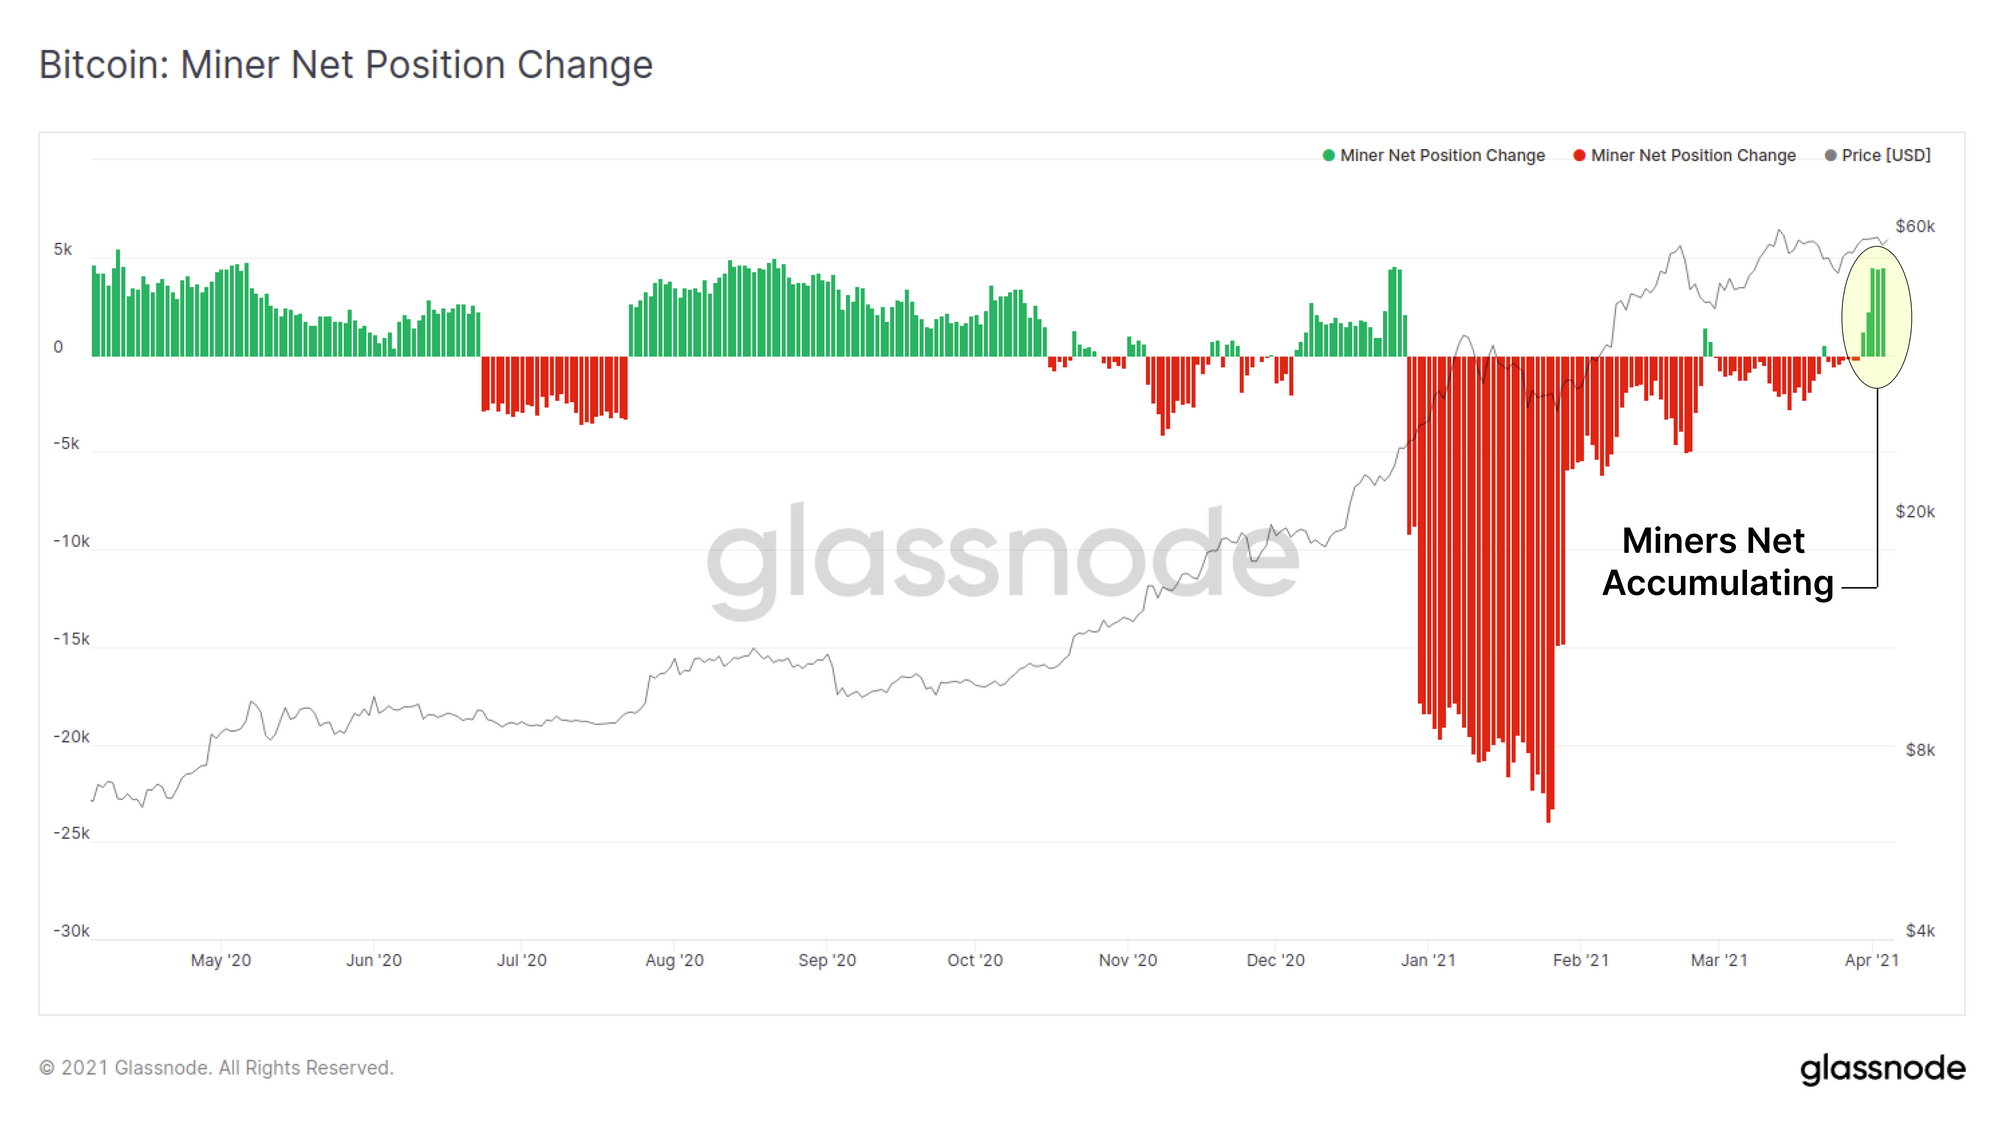
Last week we showed how long term holders have slowed the spending of old coins in the last three months, a trend that has continued into this week. Additionally, Miners have now joined in, with the Miner net position change metric flashing green, indicating miners are holding onto newly mined coins.
Whilst miners have an increasingly small influence as sell-side entities (when compared to daily trade volume), their spending patterns provide insight into the sentiment of some of the biggest bulls in the Bitcoin market.
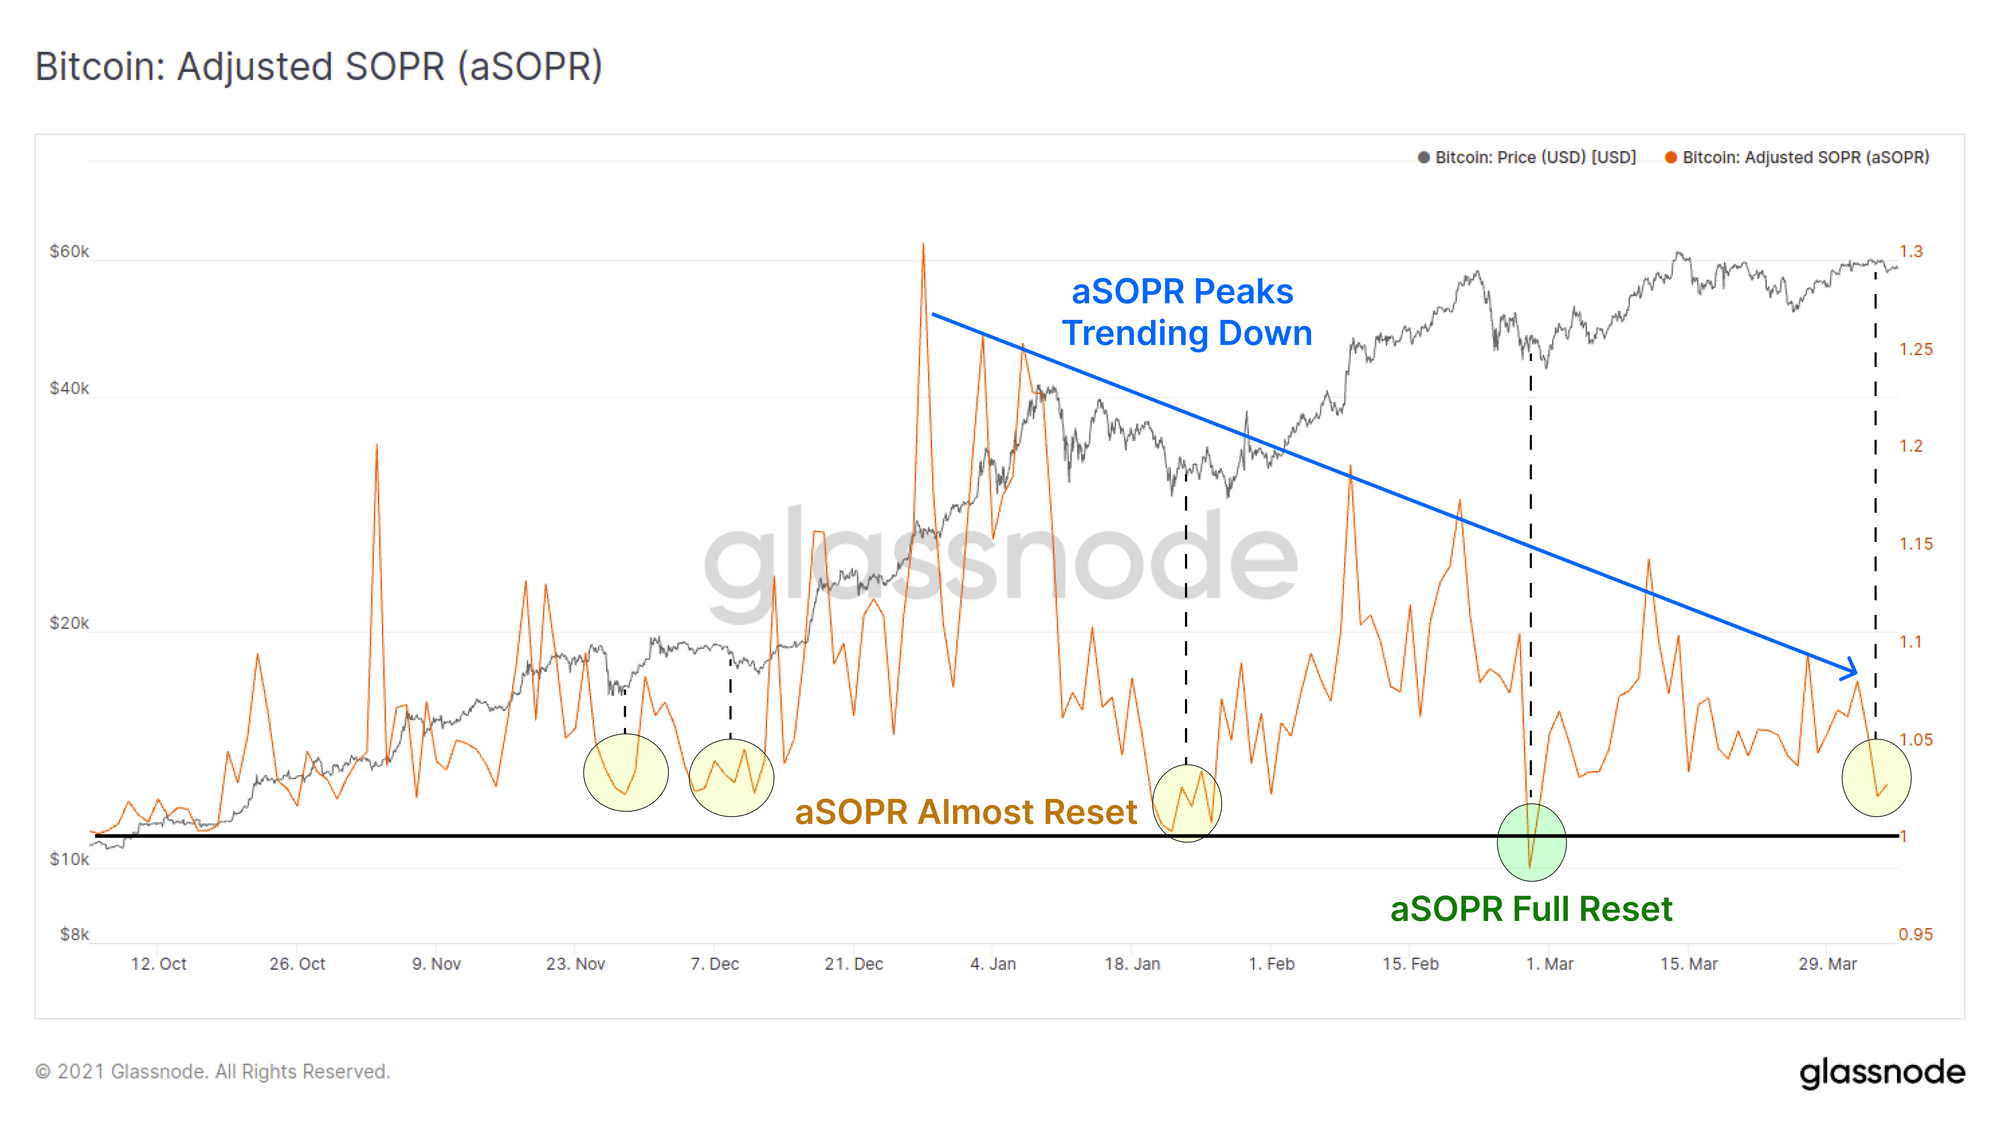
The Adjusted SOPR indicator provides us with insight into how much profit was realised by spent coins each day (whilst ignoring coins younger than 1hr). If profits are taken by old coins, aSOPR will trend higher and, conversely, it will trend lower when profitable coins remain dormant.
- The higher the aSOPR metric is, the more profit has been taken off the table.
- When aSOPR falls below 1.0, it means spent coins were at an aggregate loss.
In bull markets, we typically see a 'reset' of aSOPR where it returns close to or below 1.0 during price corrections. This signals that profitable coins are staying dormant and confidence is returning to hold the asset.
The aSOPR chart below shows two key observations:
- aSOPR has almost reset to 1.0 this week suggesting reduced profit taking and suggests confidence remains in the market.
- Successive peaks in aSOPR have reduced over the past three months. This suggests that fewer profits are being taken as the bull market carries on, again signifying a longer term trend of confidence in the market.
Finally we review the wealth distribution between long-term holders (LTH) and short-term holders (STH) which is often a cyclical indicator of wealth transfer events.
This analysis points to some key observations:
- STHs have accumulated around 440k more BTC than LTH's have spent over the past 6 months suggesting new demand coming into the market has exceeded LTH sell volume.
- The relative wealth transfer is slowing down as shown in pink. This will occur as Long term holders slow their spending and coins accumulated in the last 6 months begin to mature.
- A similar wealth transfer occurred near the 2017 peak, making this an interesting metric to keep an eye on. This has potential to be both a supply constraint (bullish) but also suggests a cyclical change in holding behaviour (potential for volatility in either direction).
- A key difference to 2017 is that LTHs currently hold 66% of the circulating supply which is much higher than the 58% they held at the 2017 peak. This suggests that this cycle has increased 'HODL' demand compared to historical cycles. The flip-side to this is that there are more coins in profit that may become overhead supply in the future.
Overall, the past few weeks have seen remarkable strength and demand to HODL coins in a bull market. This week has largely continued that trend with positive signs from both miners and long term holders whilst transaction volumes support the new Trillion dollar valuation.
The above analysis considers the spot market and on-chain flows. Since this is the first Bitcoin bull market with widespread access to derivatives, we will also look into the futures markets to assess overall performance of derivatives markets.
Futures Cash and Carry Trade
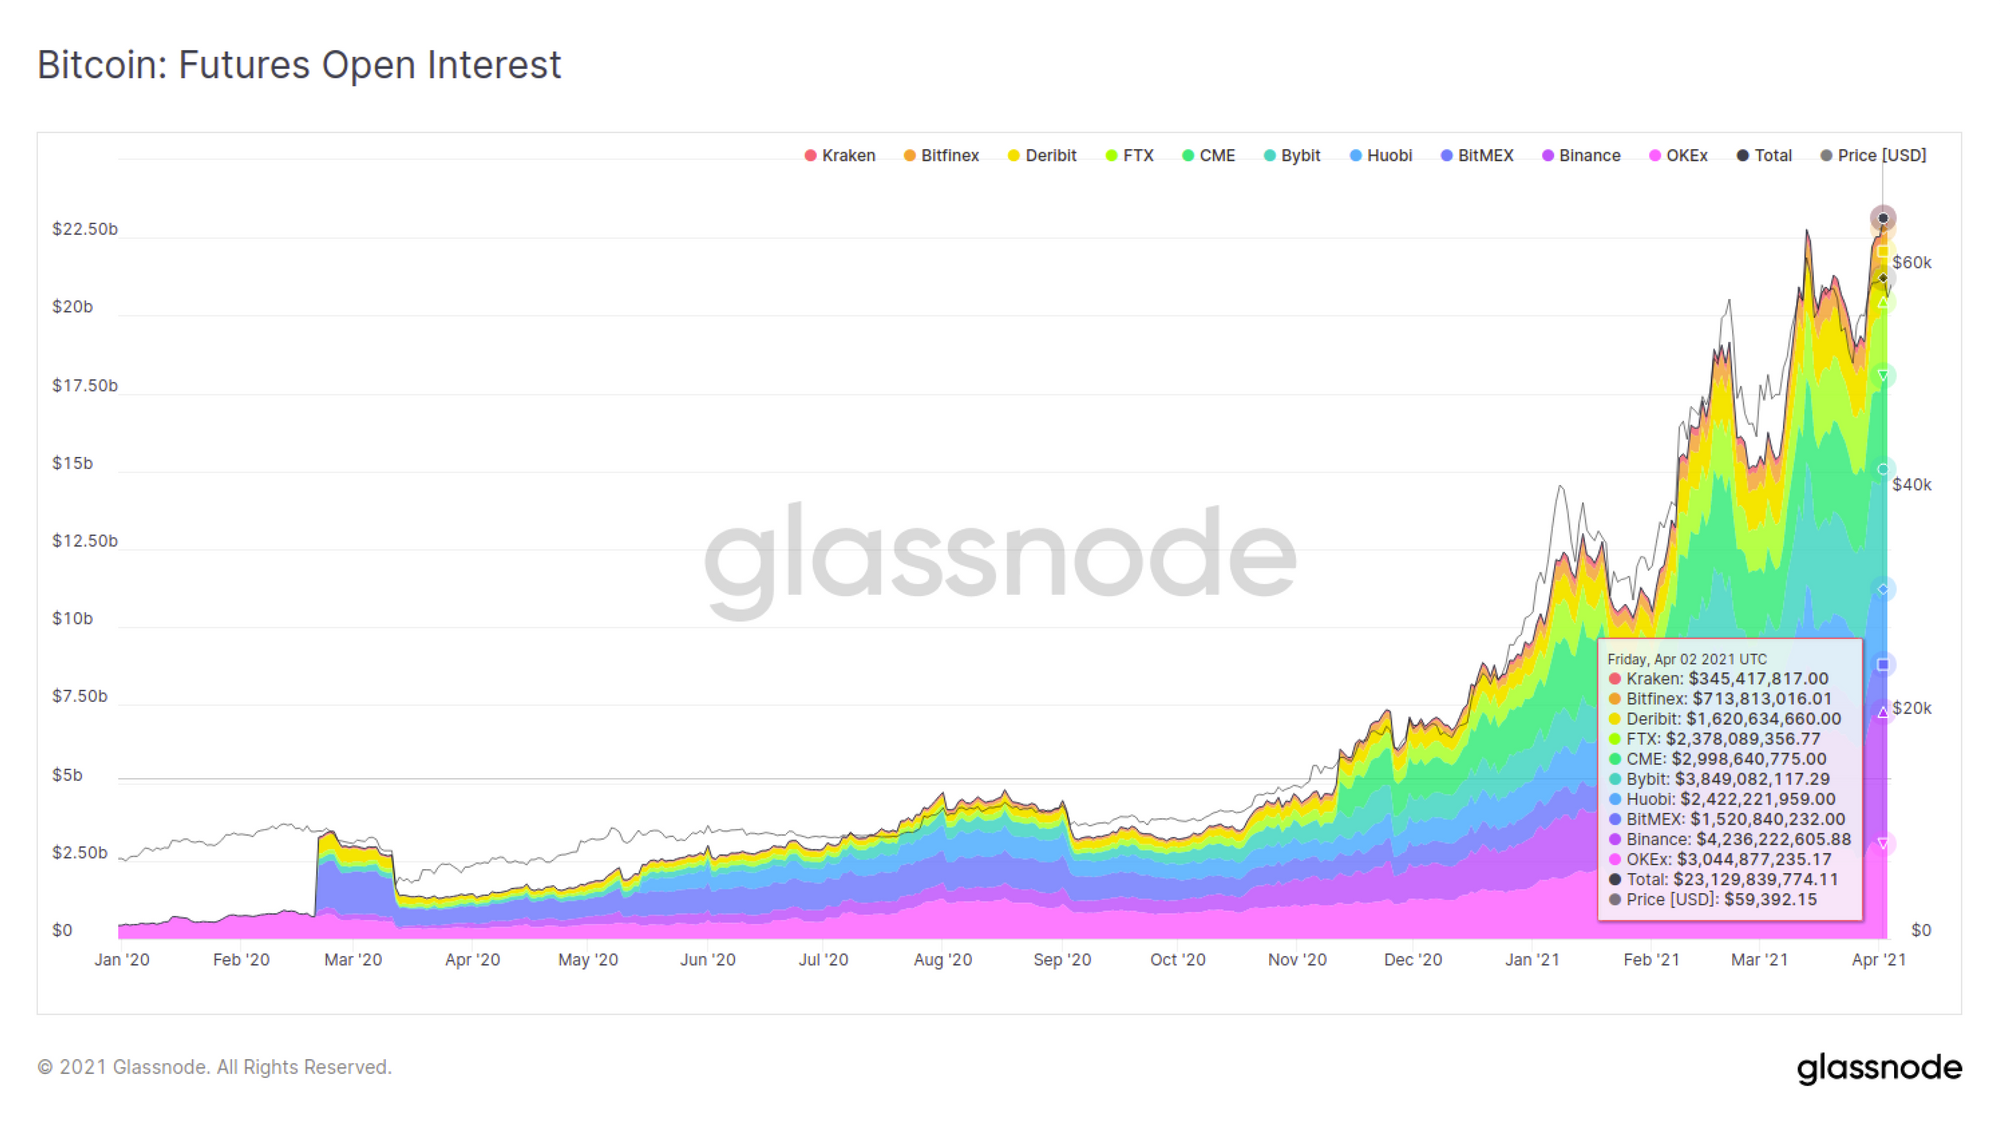
Futures open interest has hit yet another all-time-high of over $23.1B this week, with Binance and OKex representing the lions share with a combined total of 32% of all contracts.
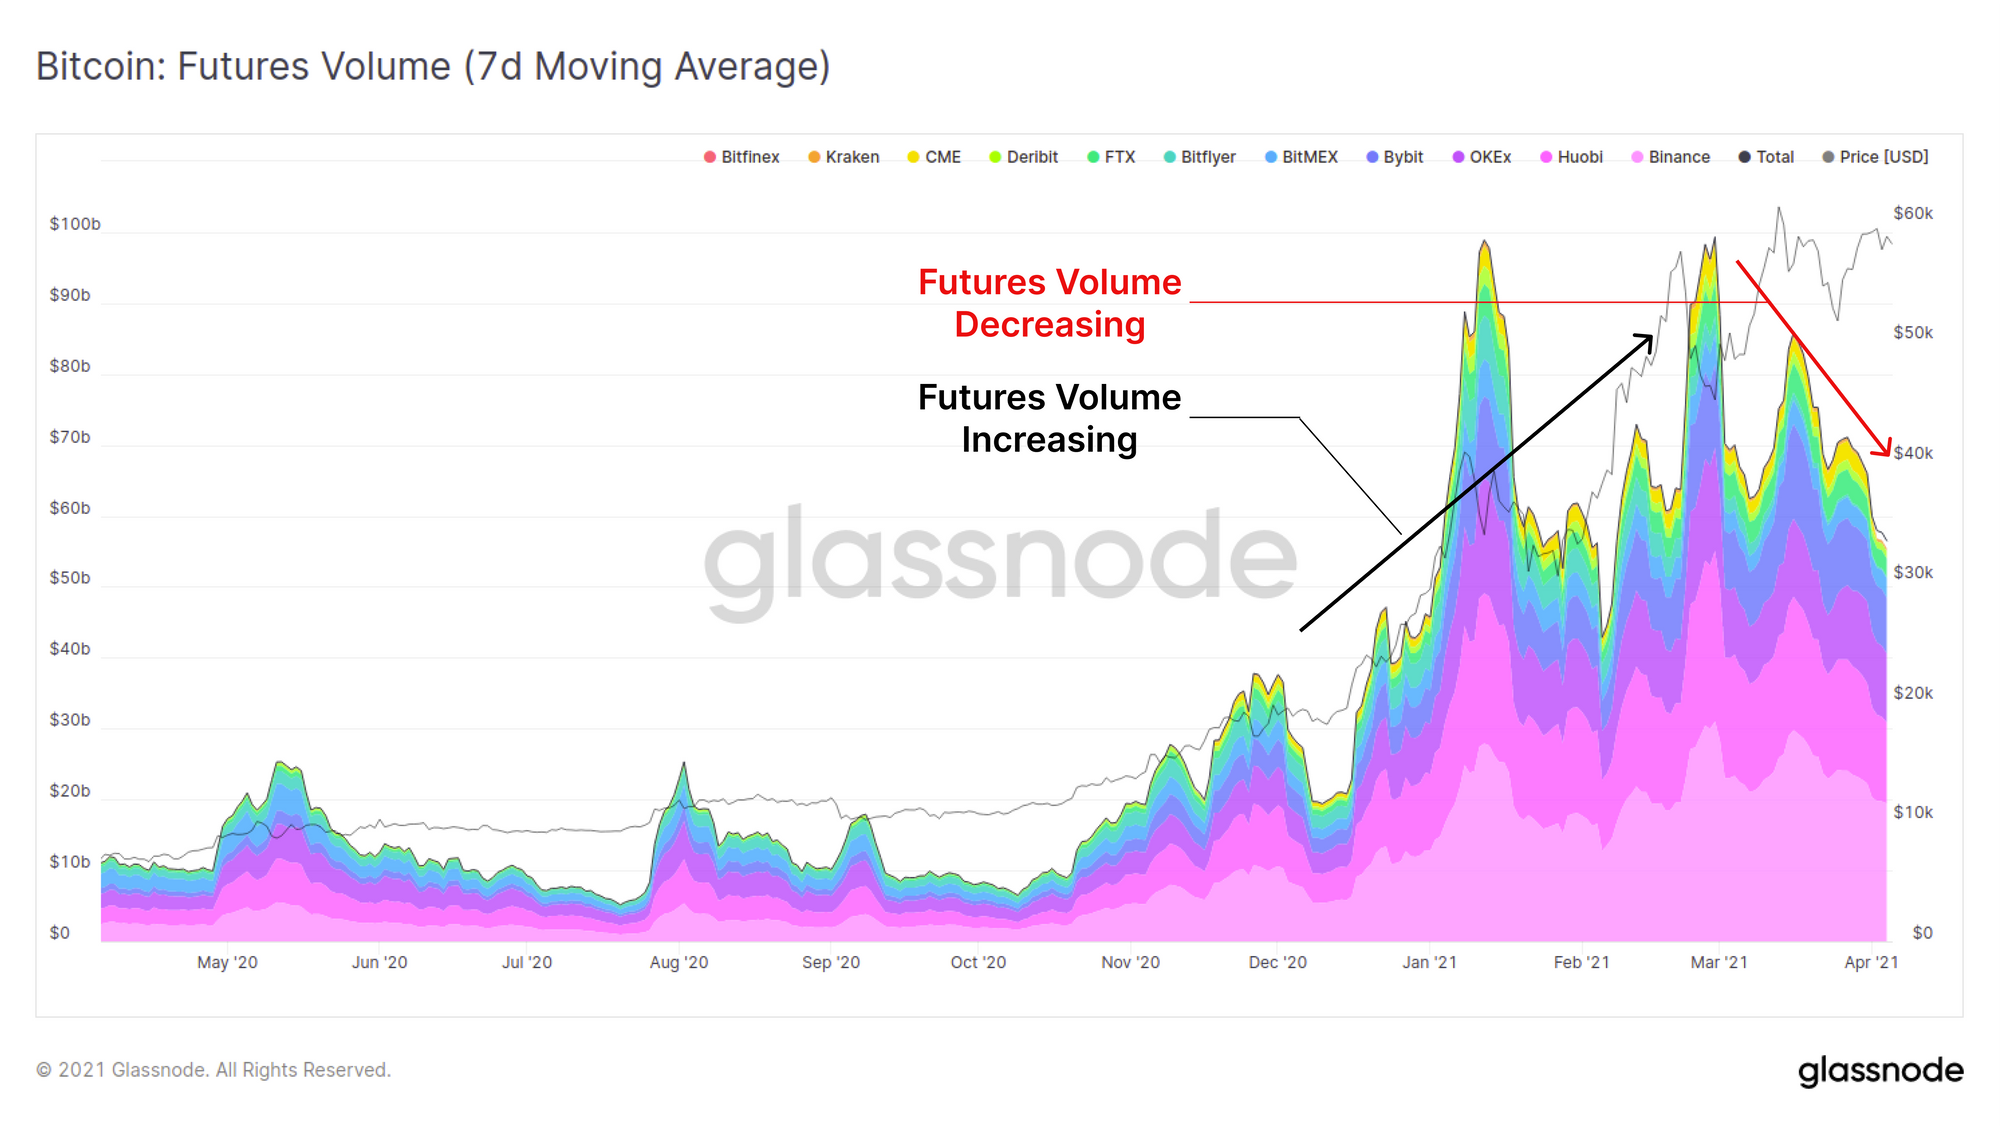
Interestingly, futures volumes have been in steady decline throughout March with this week being particularly quiet relative to volume in previous months.
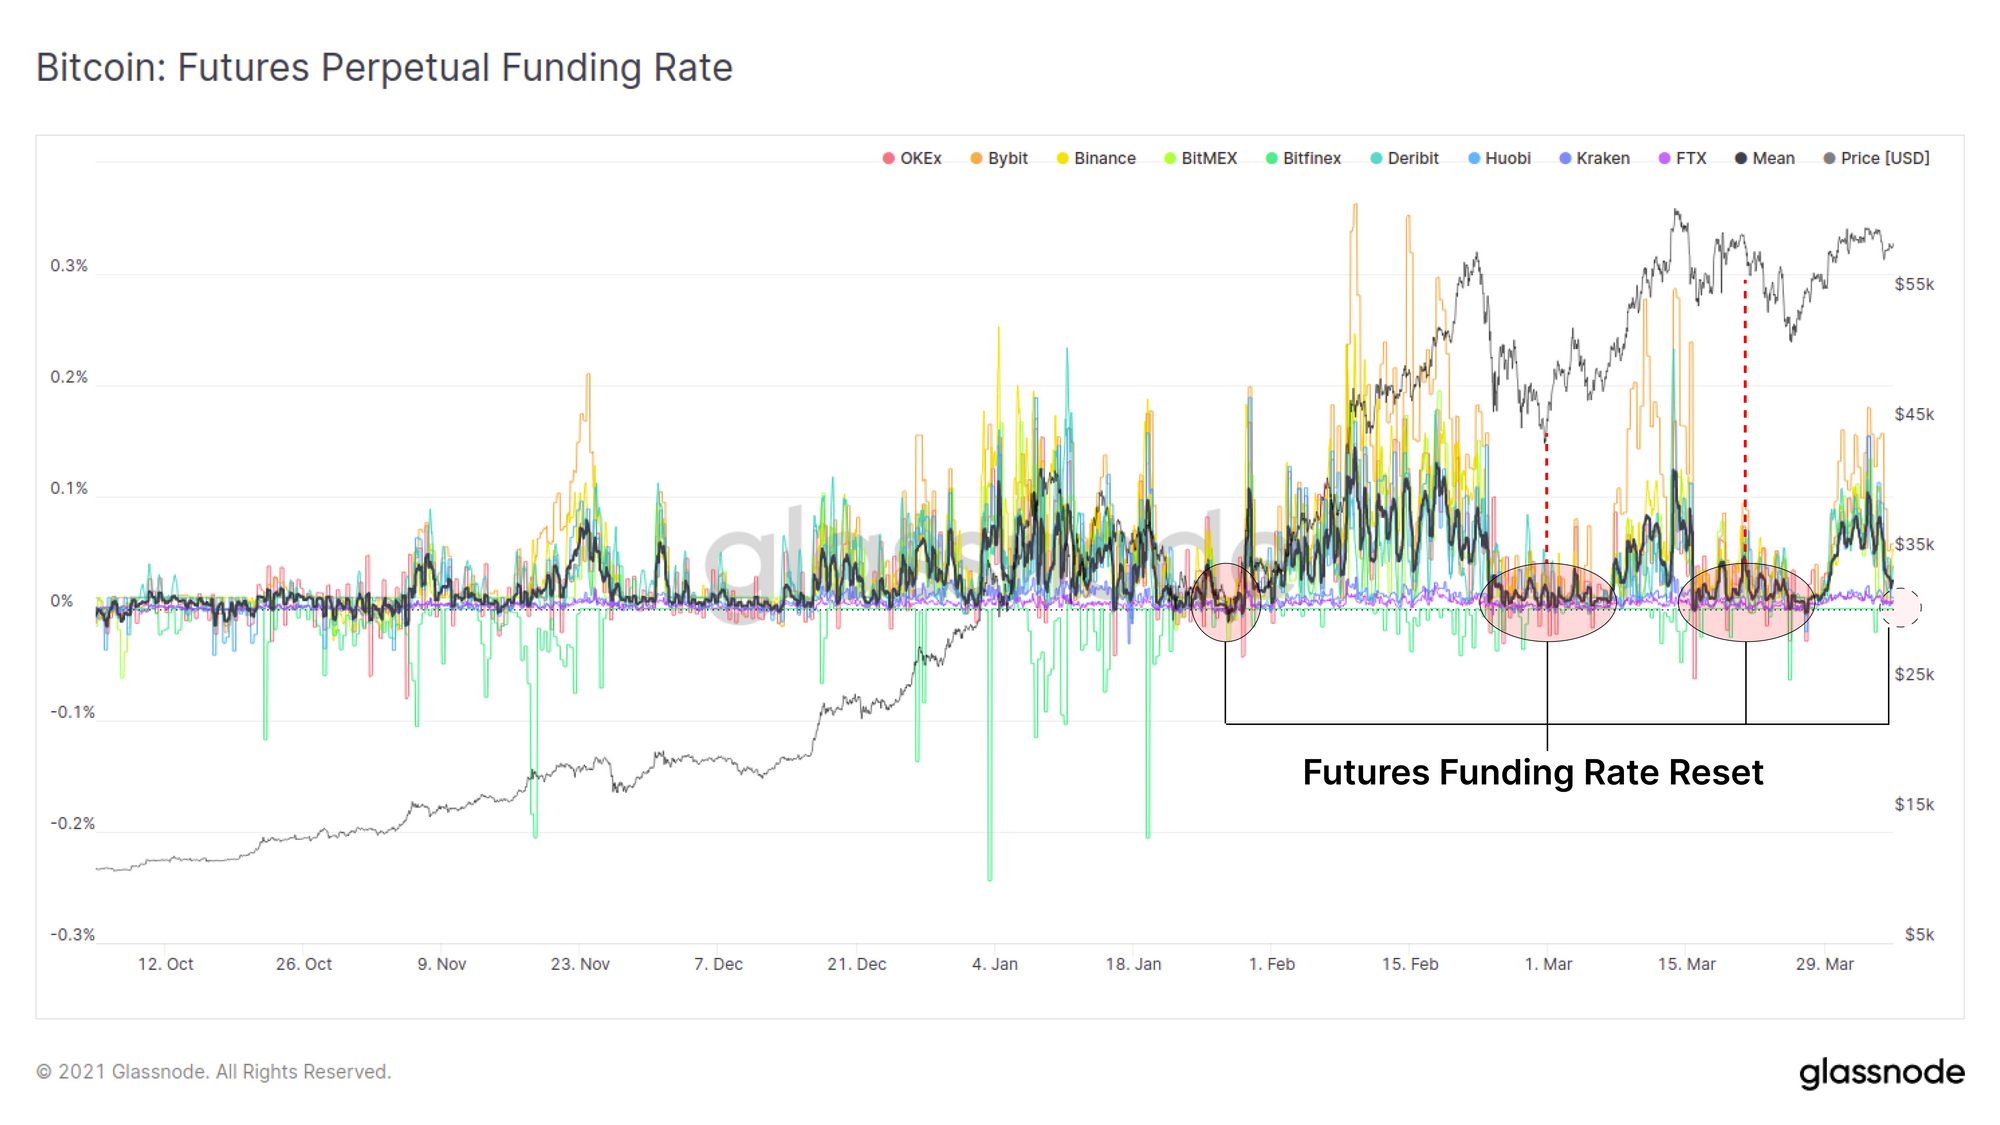
Perpetual futures funding rates have also nearly reset to neutral levels suggesting a reduction in excessive long speculation and/or an increase in short interest to balance out long traders.
Short seller liquidations have also been in decline over the last few months despite new all time highs in open interest. This suggests that short sellers either have exceptional risk management in a bull market, or more likely, many are deploying a risk neutral strategy in a 'cash and carry' trade.
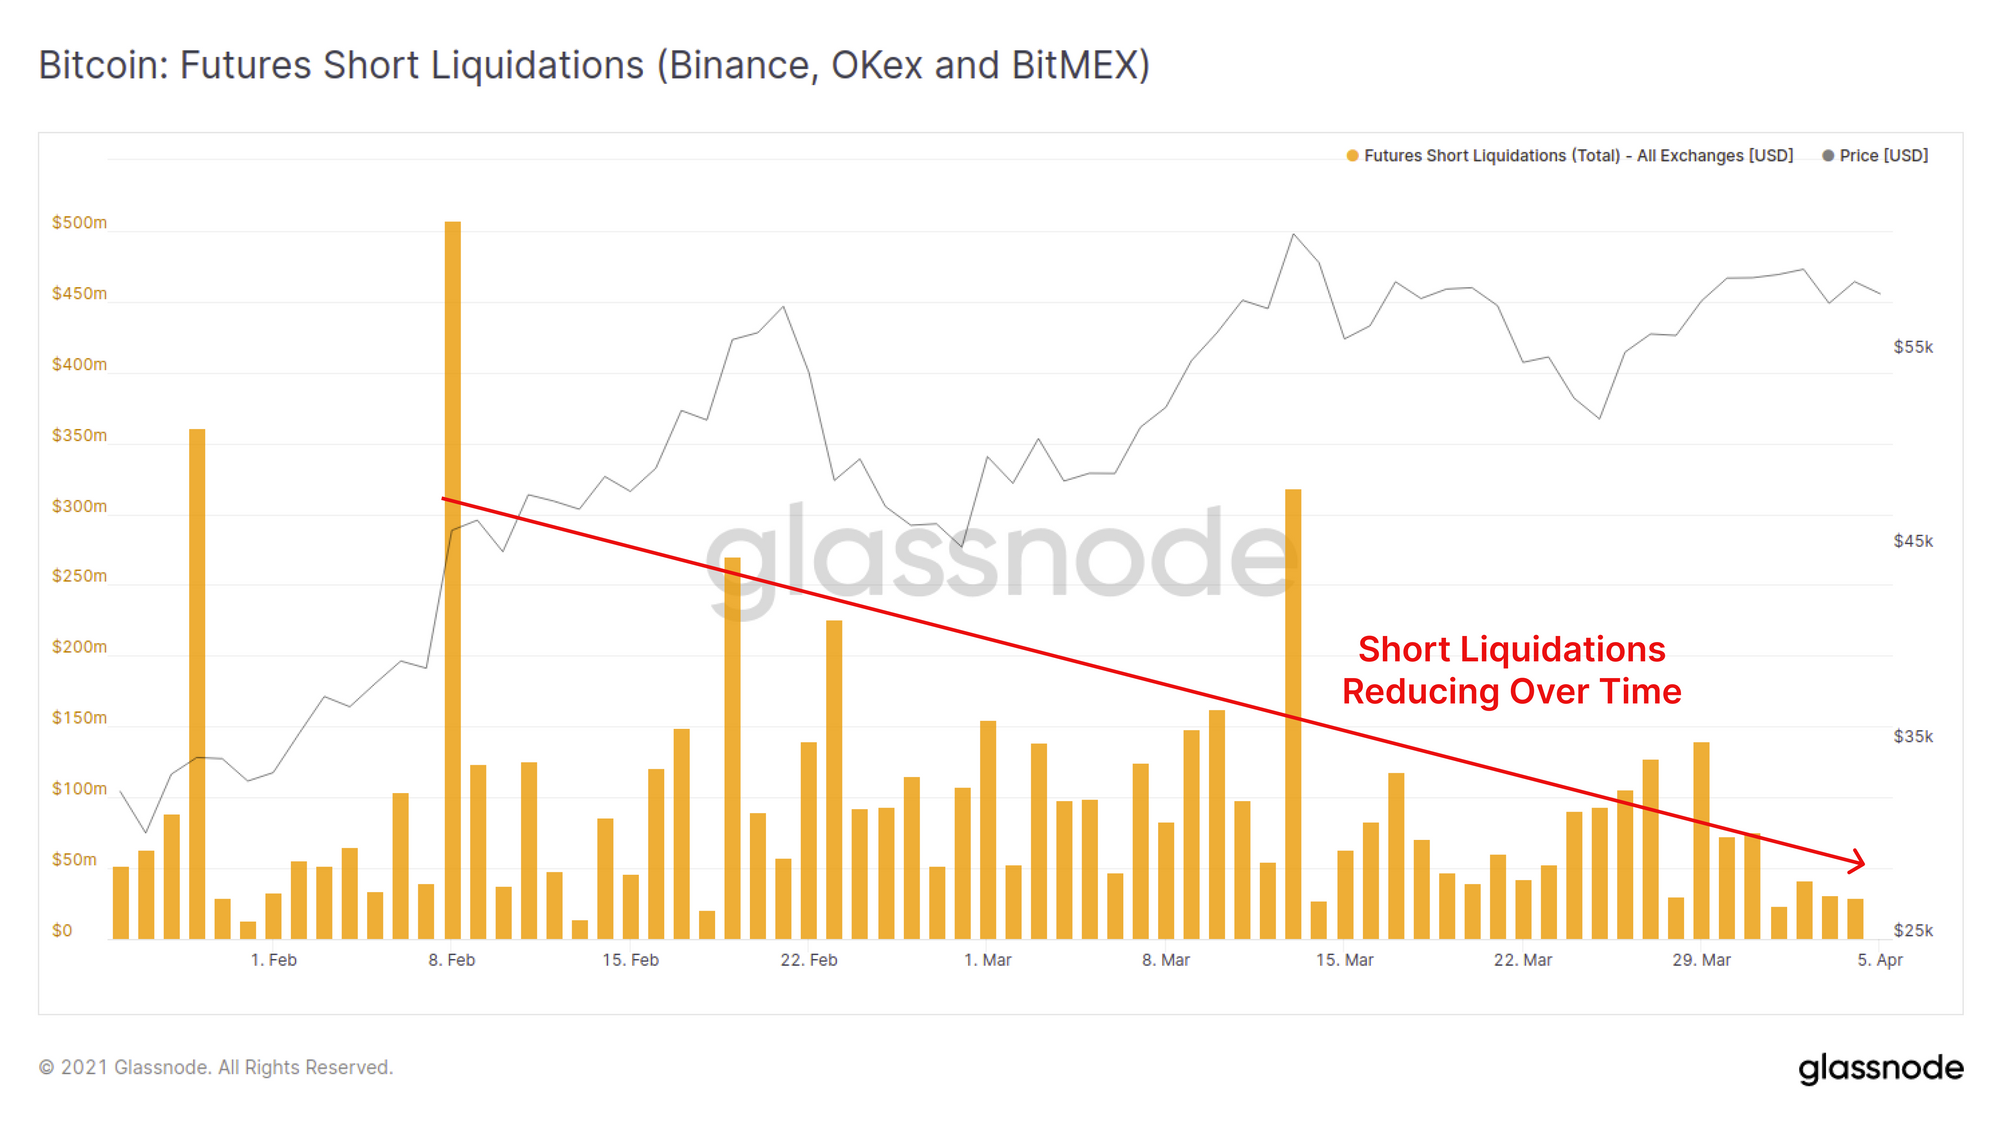
The combination of high open interest, reducing futures volume, few short liquidations and reduced funding rates supports the case that the 'cash and carry' trade is a favoured strategy in current market conditions.
Cash and carry trades allow traders to combine long spot and short futures to lock in the prevailing funding rate/premium whilst remaining risk neutral for price volatility. As more traders take advantage of this arbitrage, open short interest will increase however without corresponding liquidations as traders are net neutral via spot holdings.
Weekly Feature: Compound Token
This week, DeFi tokens have seen renewed interest reflected in both out-performing price appreciation and also in early signs of renewed growth in on-chain activity.
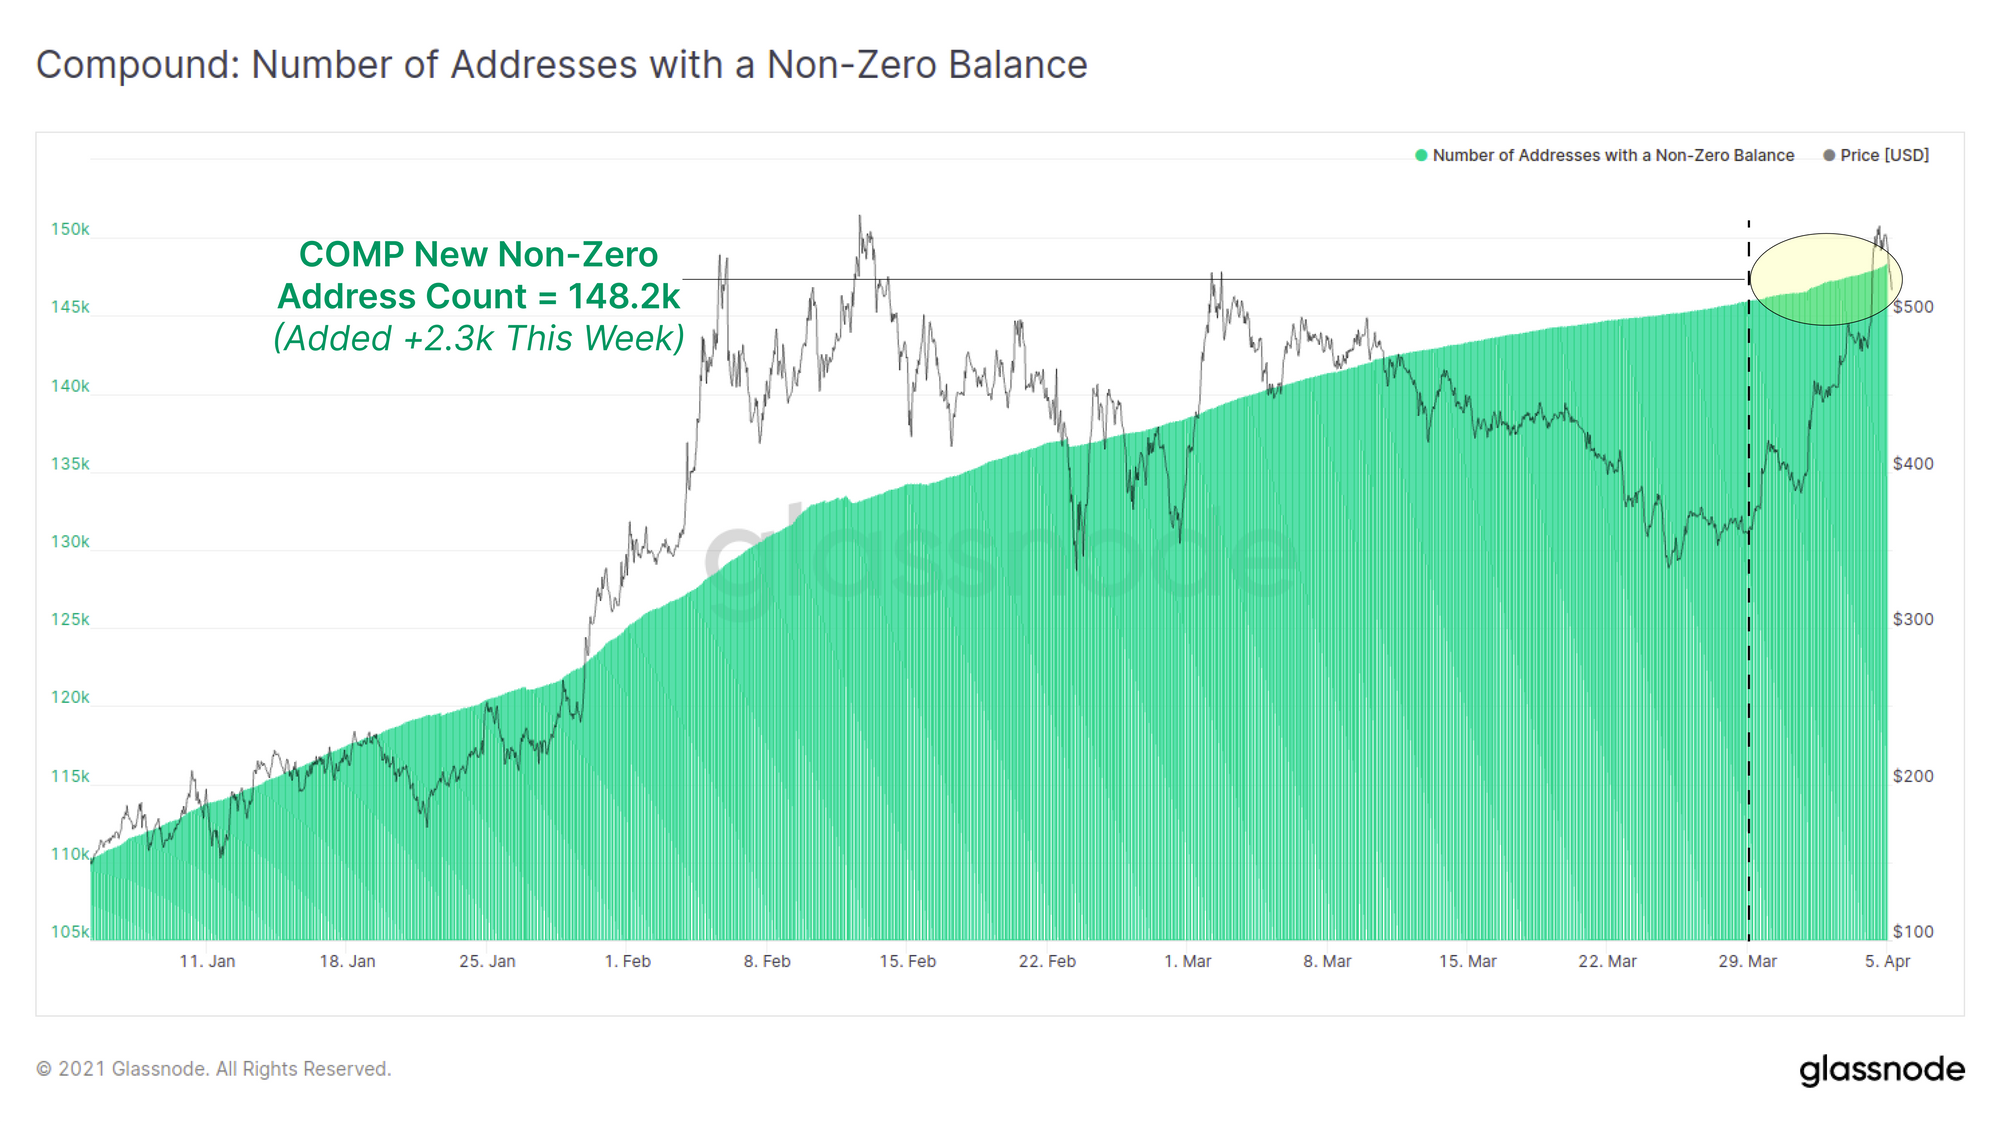
Compound Protocol (COMP) in particular has seen a very strong week as the token price approaches the previous ATH set in early Feb 2021. This week, COMP has added an additional 2.3k new non-zero balance holders bringing the total to over 148k addresses, an increase of 1.5%. Over the same period the COMP token price has more than doubled from $227 to over $540.
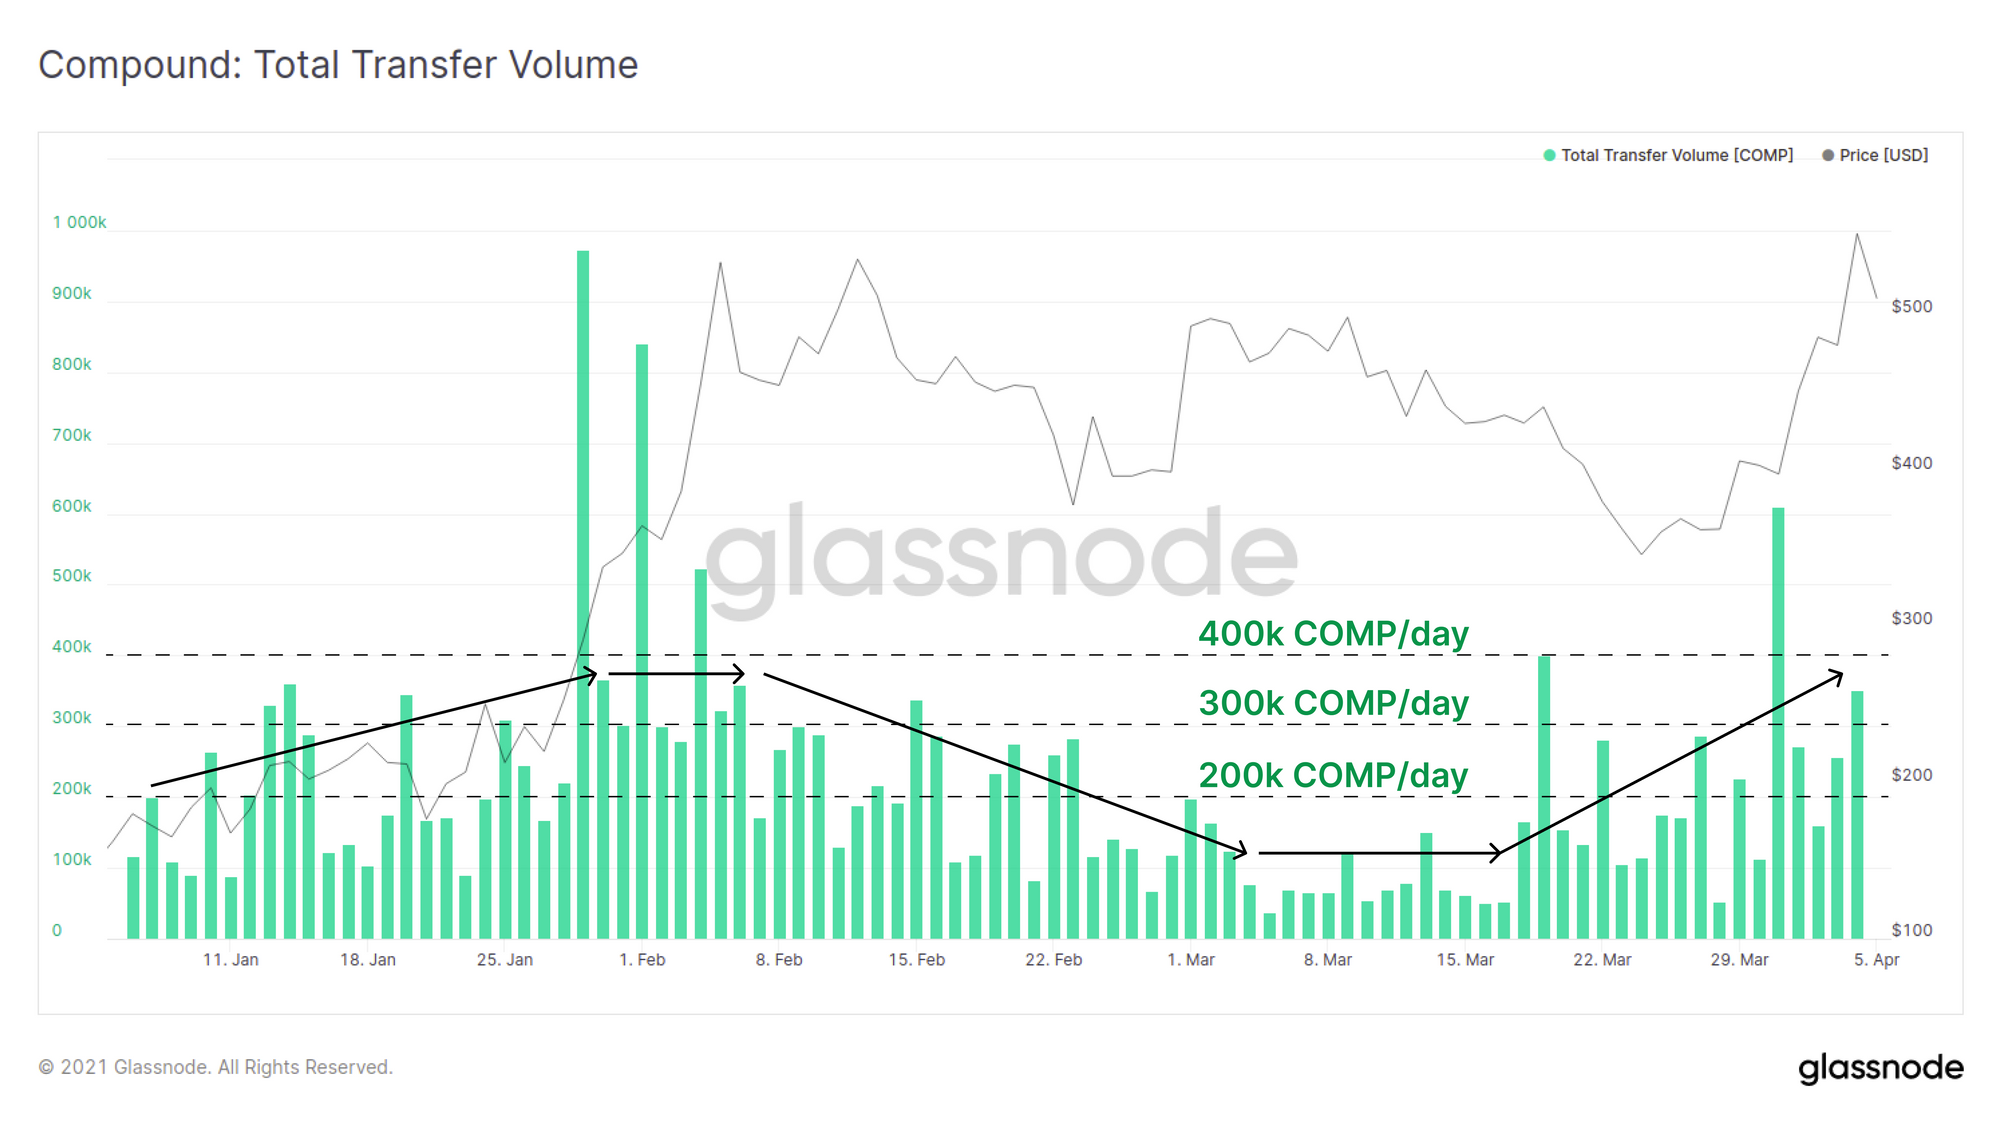
Transaction volumes for COMP have also seen a steady increase over the last two weeks after a lull in on-chain activity through early March. At present, 200k to 300k COMP are transacted daily which is approaching transaction volumes similar to early Feb when COMP was hitting its all-time-high price of $564.81.
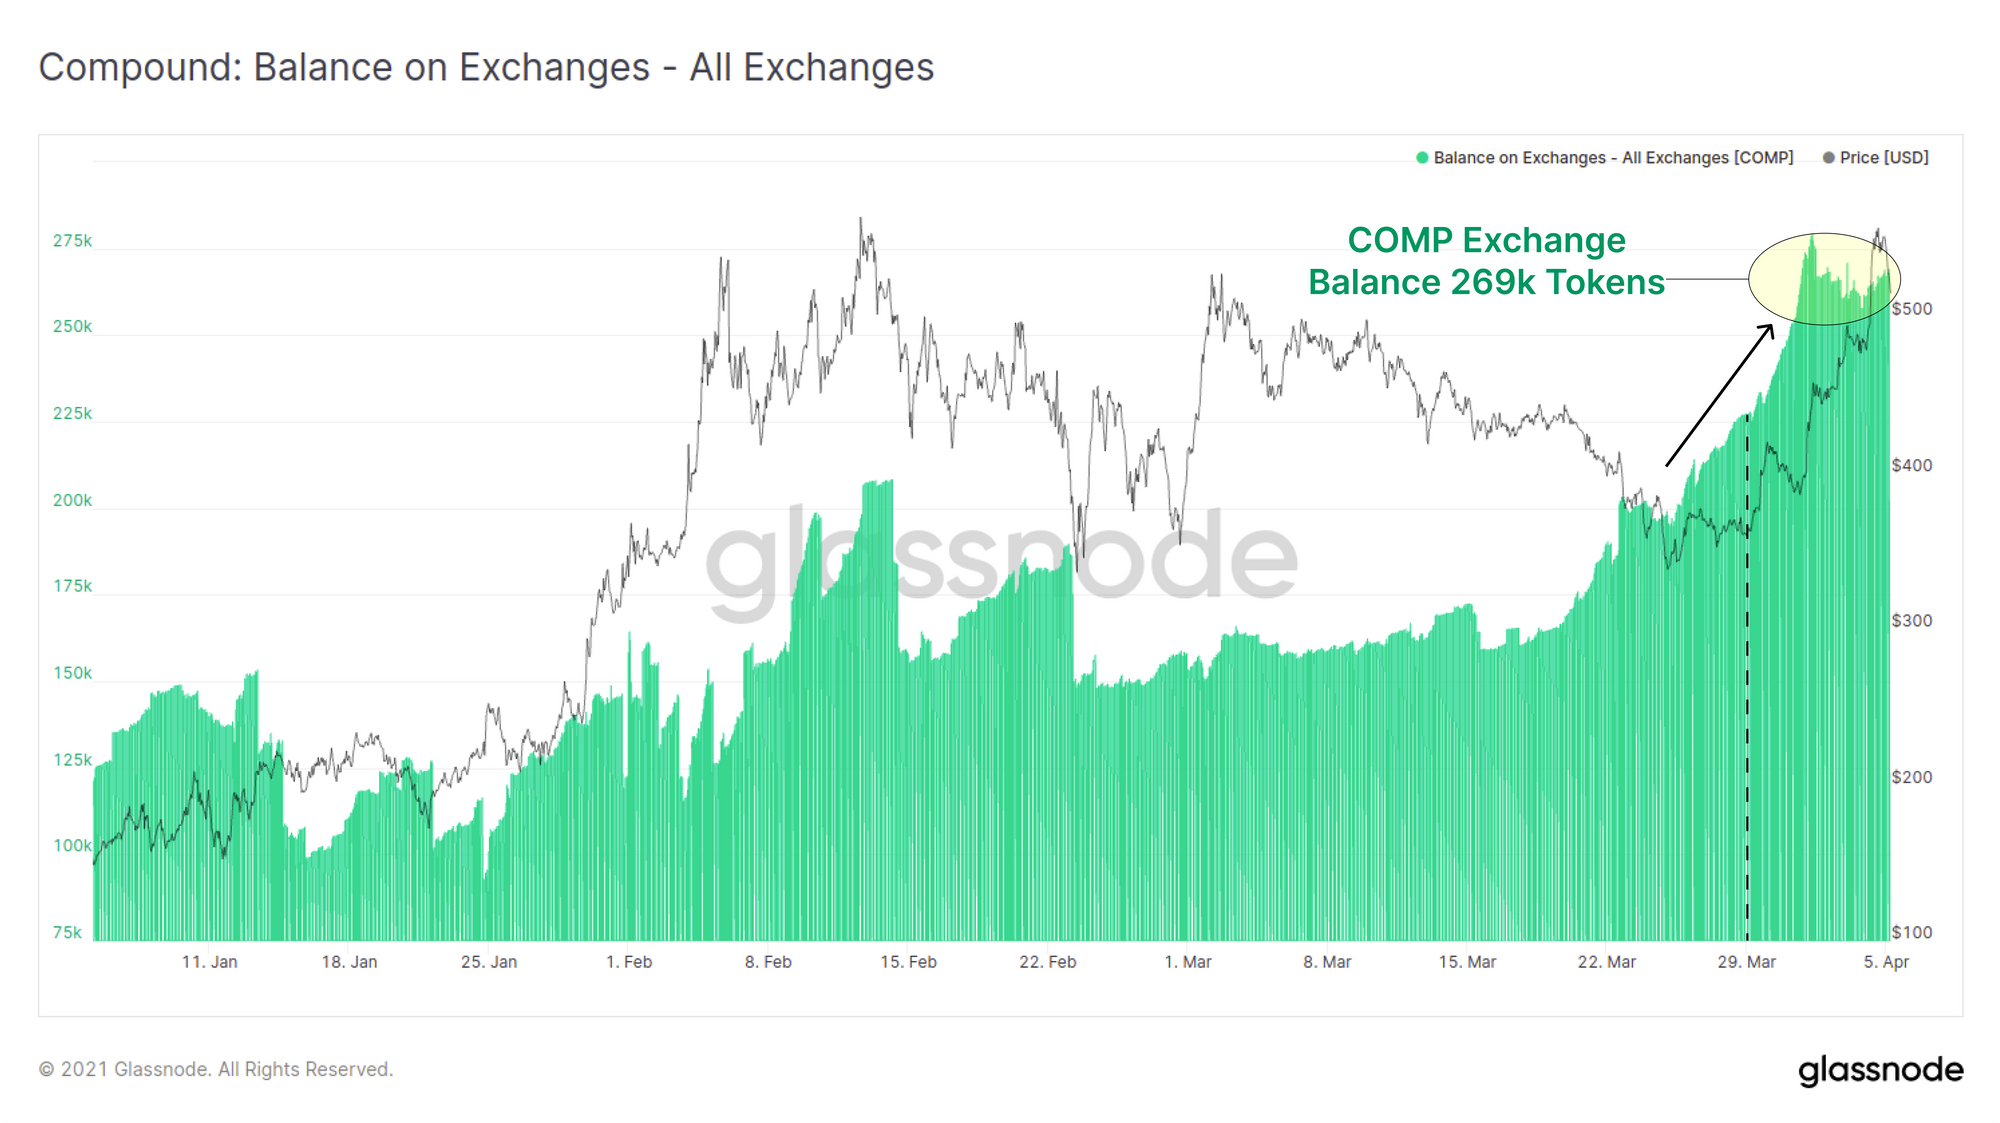
Finally, the balance held on exchanges has also risen alongside token price for the last two weeks. An additional 41.1k COMP have been deposited to exchanges this week representing an increase in exchange balance of around 20%.
New Glassnode Content
Our Latest Newsletter: Uncharted
Check out out bi-weekly newsletter,