The Week On-Chain (Week 28, 2020)
Bitcoin has had another strong week throughout Week 28, with strengthening on-chain fundamentals and a gradual increase in price.


Bitcoin Market Health
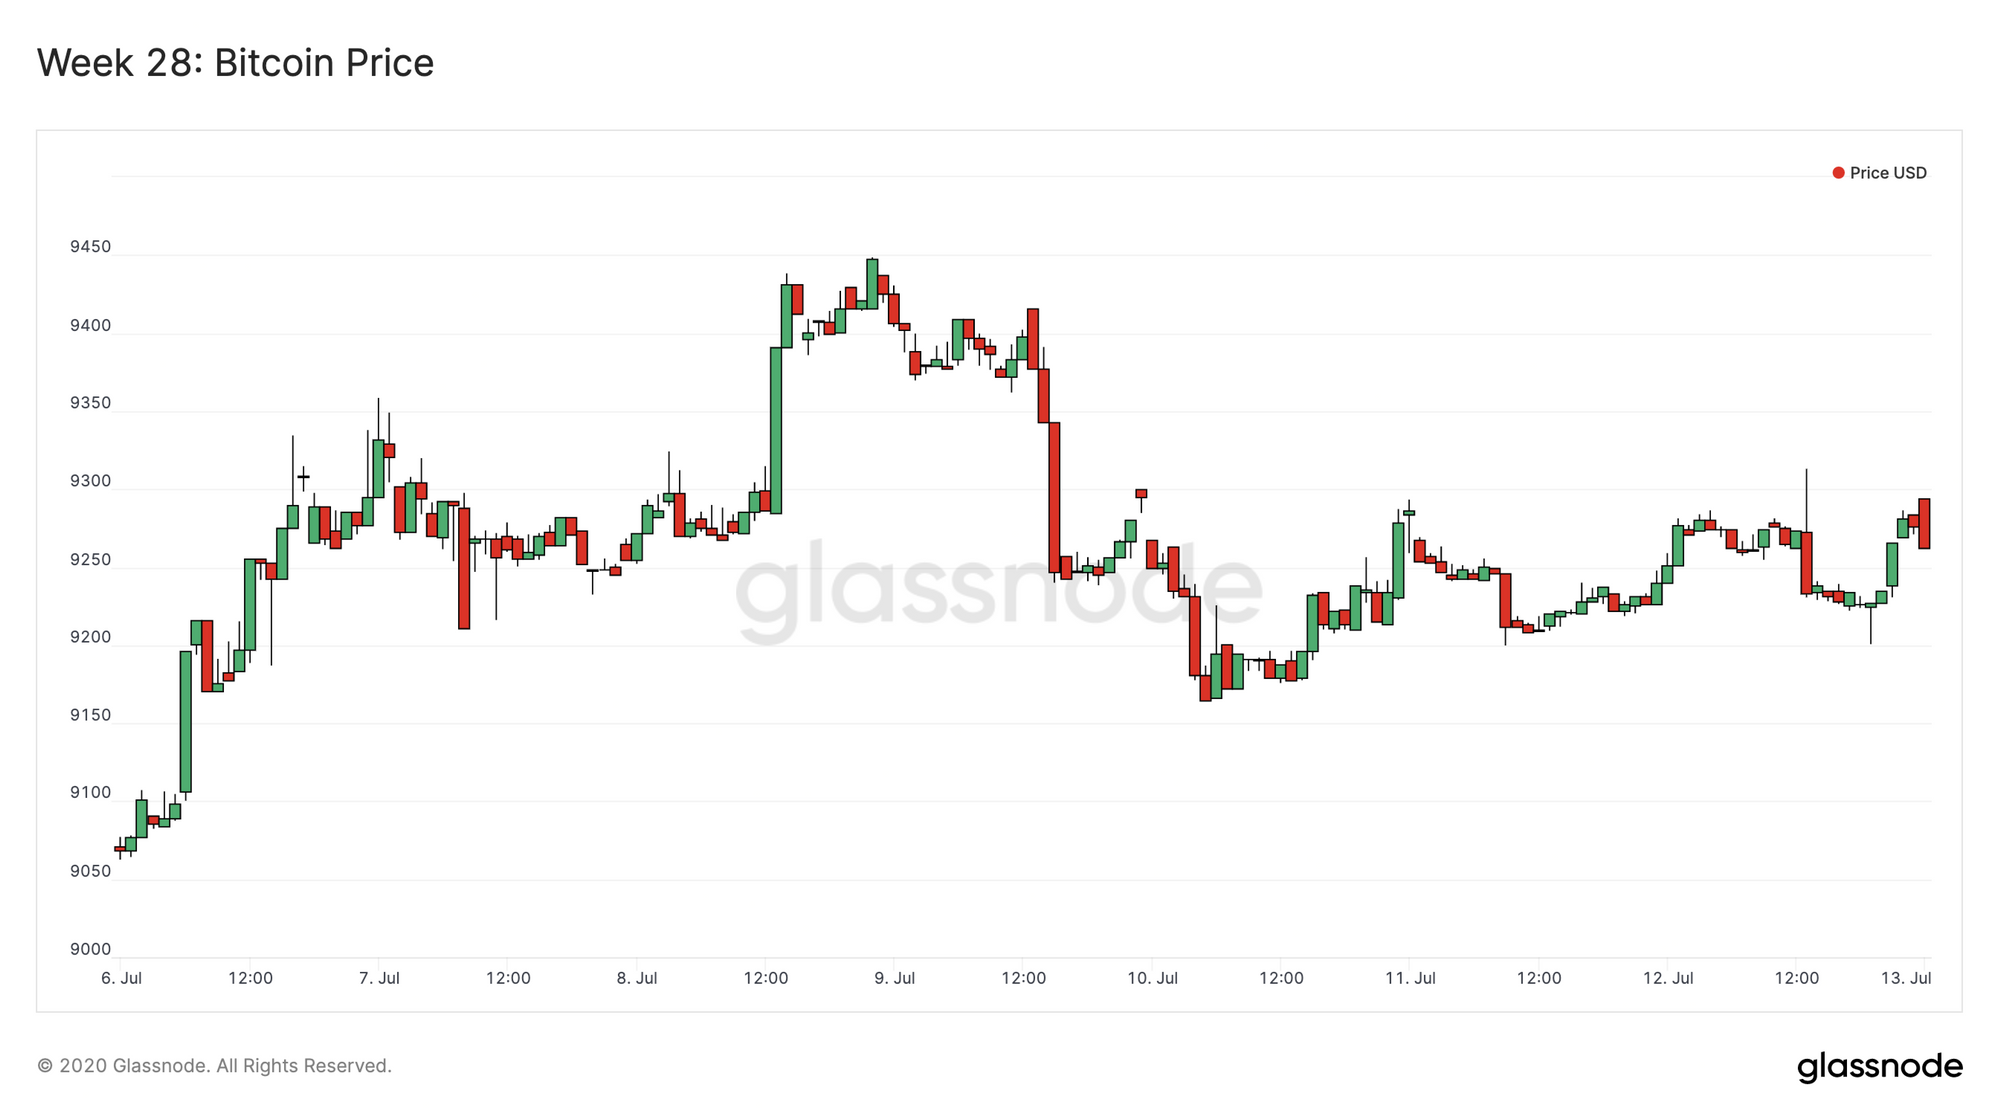
Bitcoin saw some modest gains throughout Week 28, starting the week around $9070 and ending at $9260. Wednesday saw a brief spike above $9400, but this was quickly reversed on Thursday, leaving BTC to once again fluctuate around the $9200 mark.
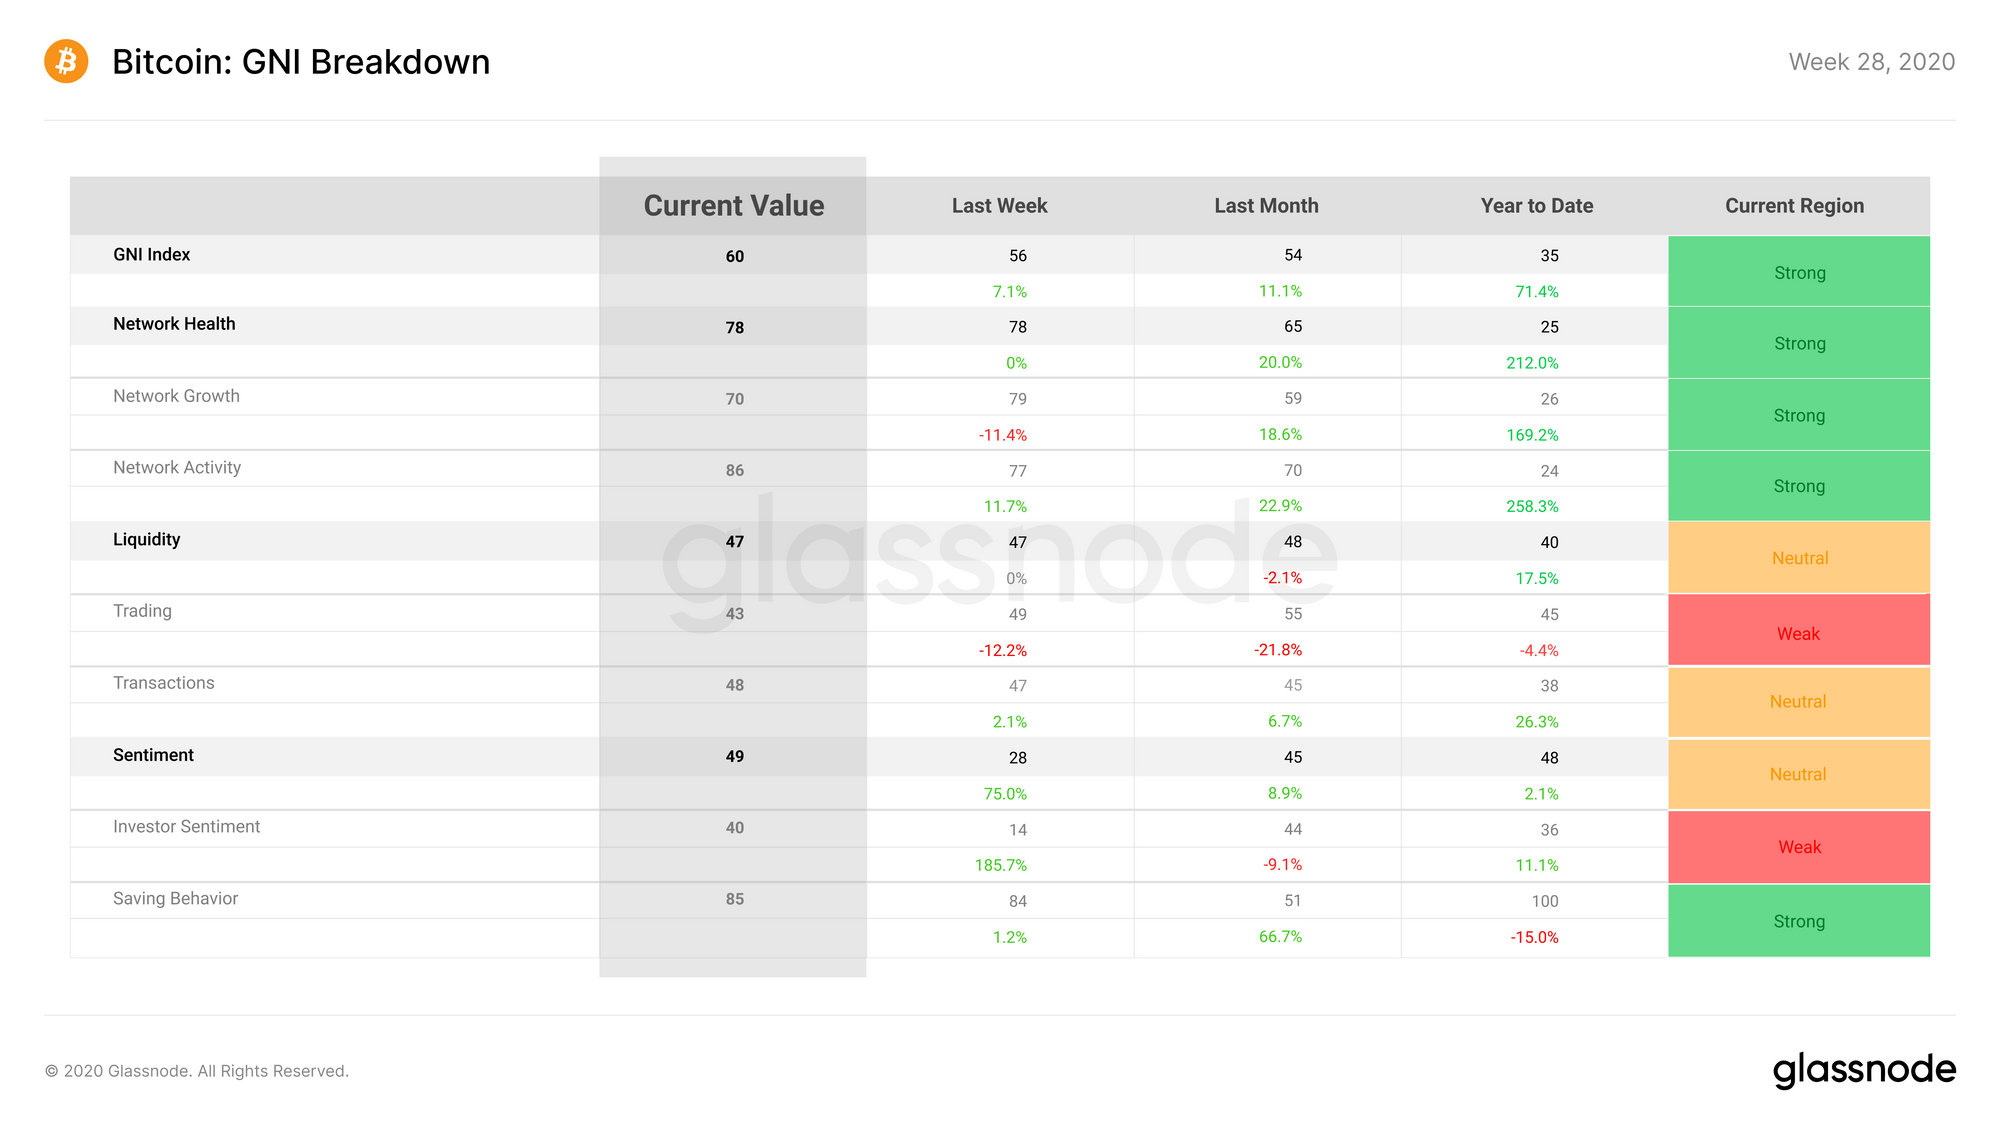
Bitcoin on-chain fundamentals increased over Week 28, with GNI gaining 4 points, bringing it back up to a value of 60. While the Network Health and Liquidity subindices remained static, the increase in GNI was driven by a large jump in the Sentiment subindex.
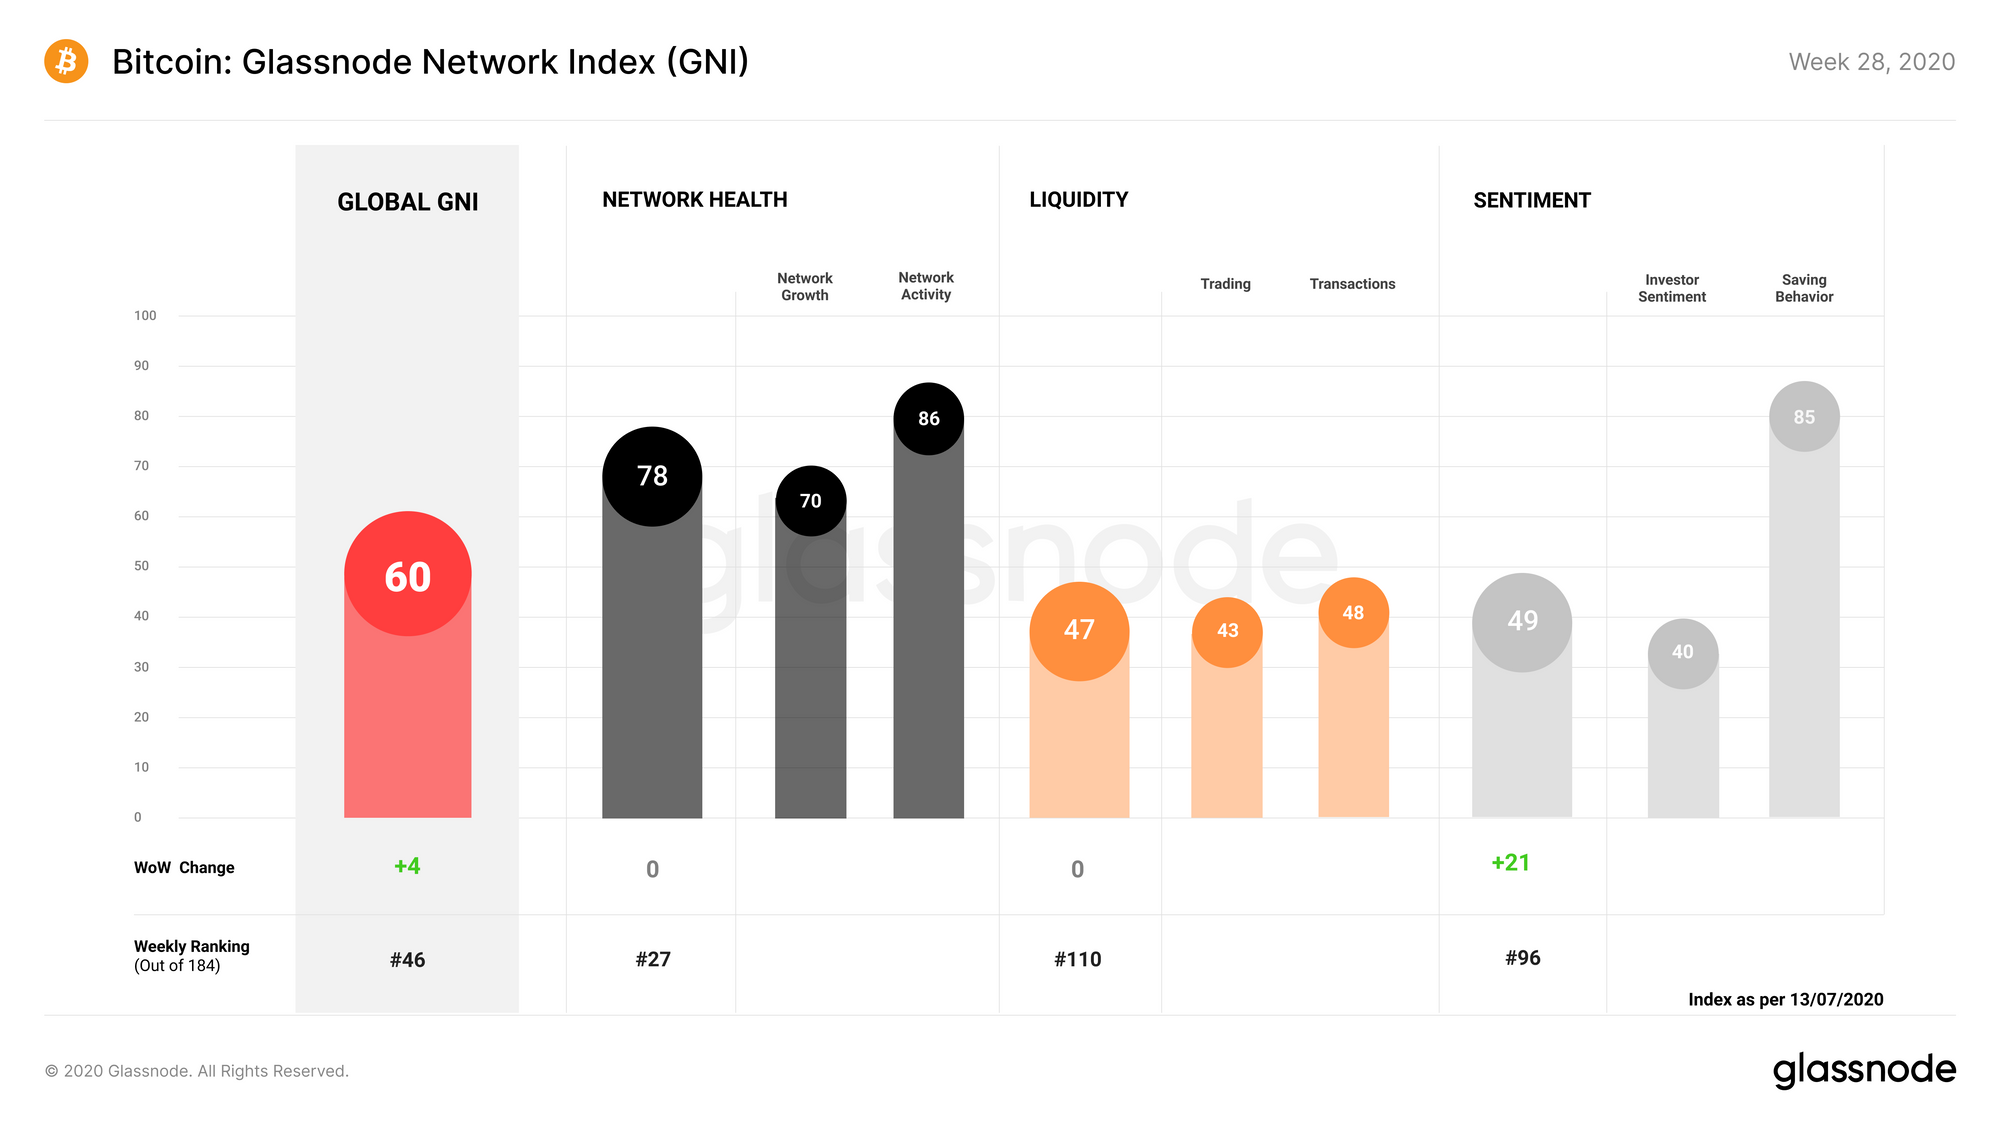
Network Health stayed at 78 points this week. The network growth category lost some traction as adoption slowed slightly, while network activity conversely increased as a result of a higher number of active entities on-chain.
Liquidity also stayed consistent with the previous week, staying at 47 points. While transaction liquidity increased due to higher on-chain activity, trading liquidity decreased as BTC's exchange balance remained low.
Sentiment saw a massive 21 point increase, more than doubling its score and bringing it to 49 points. Saving behavior saw modest increases as hodlers acquired more BTC, but the main increase was in investor sentiment, which saw a 26 point increase as the amount of BTC in profit went up.
Glassnode Compass
During Week 28, the compass saw improvements both in terms of GNI and price performance, setting itself up for its 7th consecutive week in Regime 1.
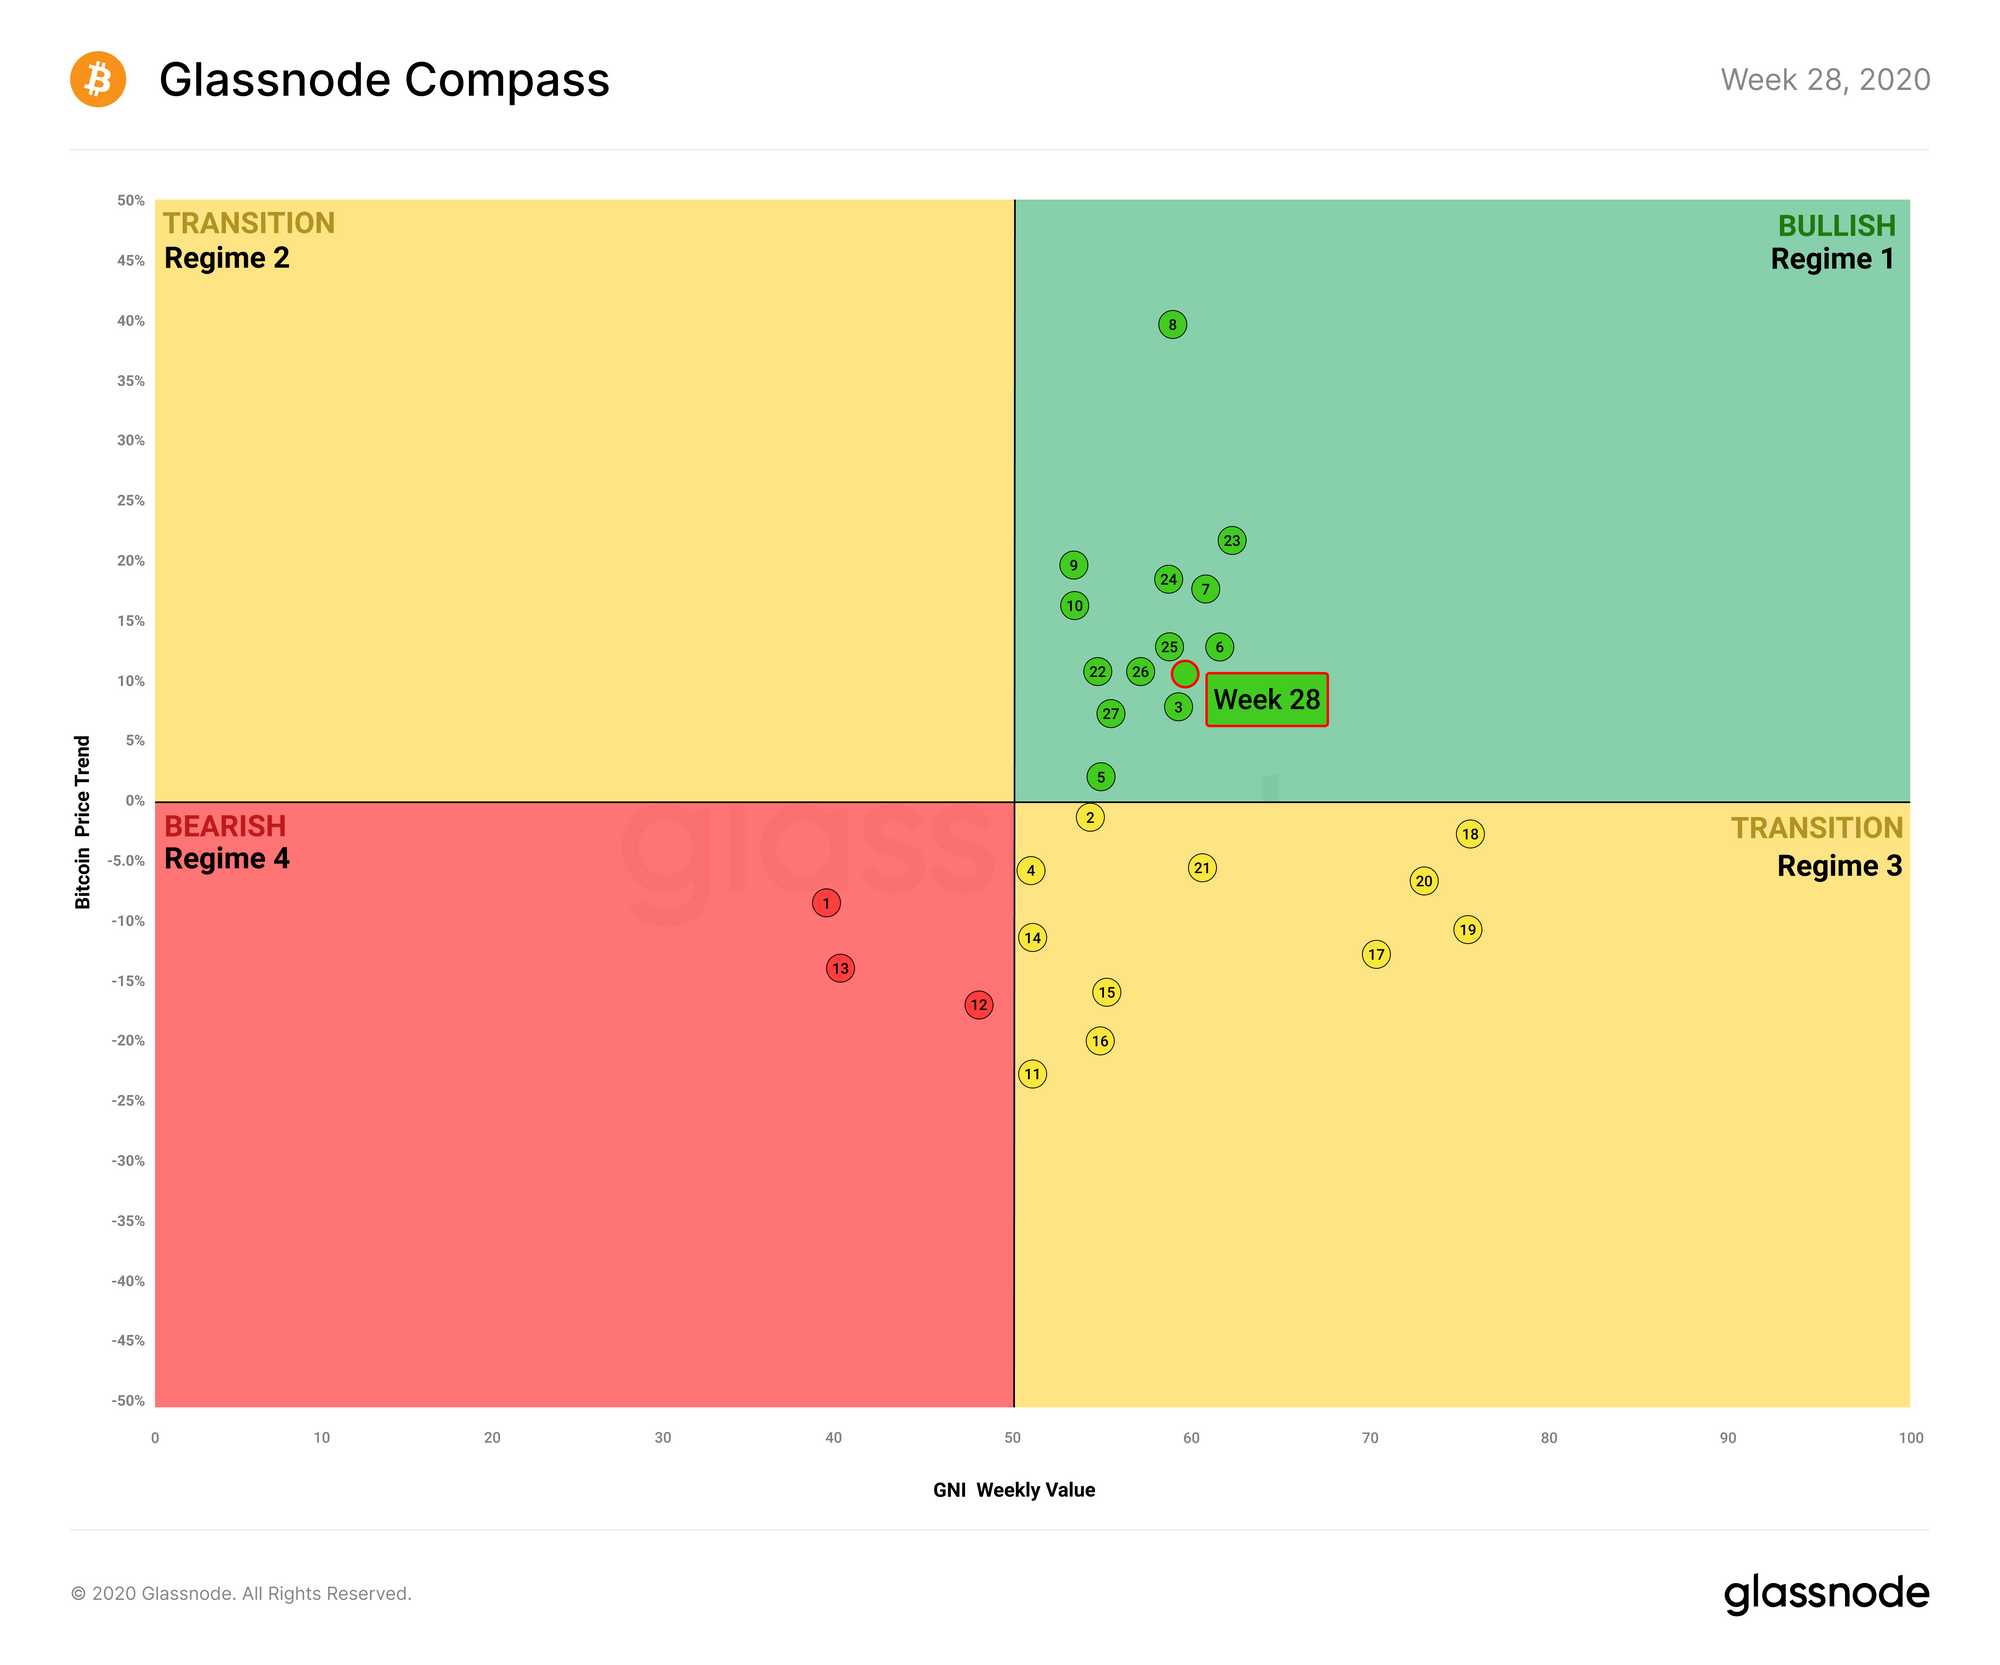
Its continued presence in the bullish green zone is a sign of strong fundamentals for bitcoin. On-chain activity has been consistently high for the past several months, and while BTC's price has stayed uncharacteristically stable, it is still performing positively relative to the beginning of the year.
As noted in last week's issue, external market forces such as systemic uncertainty and unknown correlations with traditional markets may prevent BTC from breaking out at this stage, but signals remain strong nonetheless.
Stablecoin Supply is High Relative to BTC
Bitcoin's Stablecoin Supply Ratio is reaching new lows as more money flows into stablecoins.
This metric - representing the ratio between the supply of money in BTC and the supply of stablecoins - highlights the theoretical readiness of money to flow into BTC. The more money held in stablecoins, the higher the potential for a large inflow of capital into BTC on short notice.
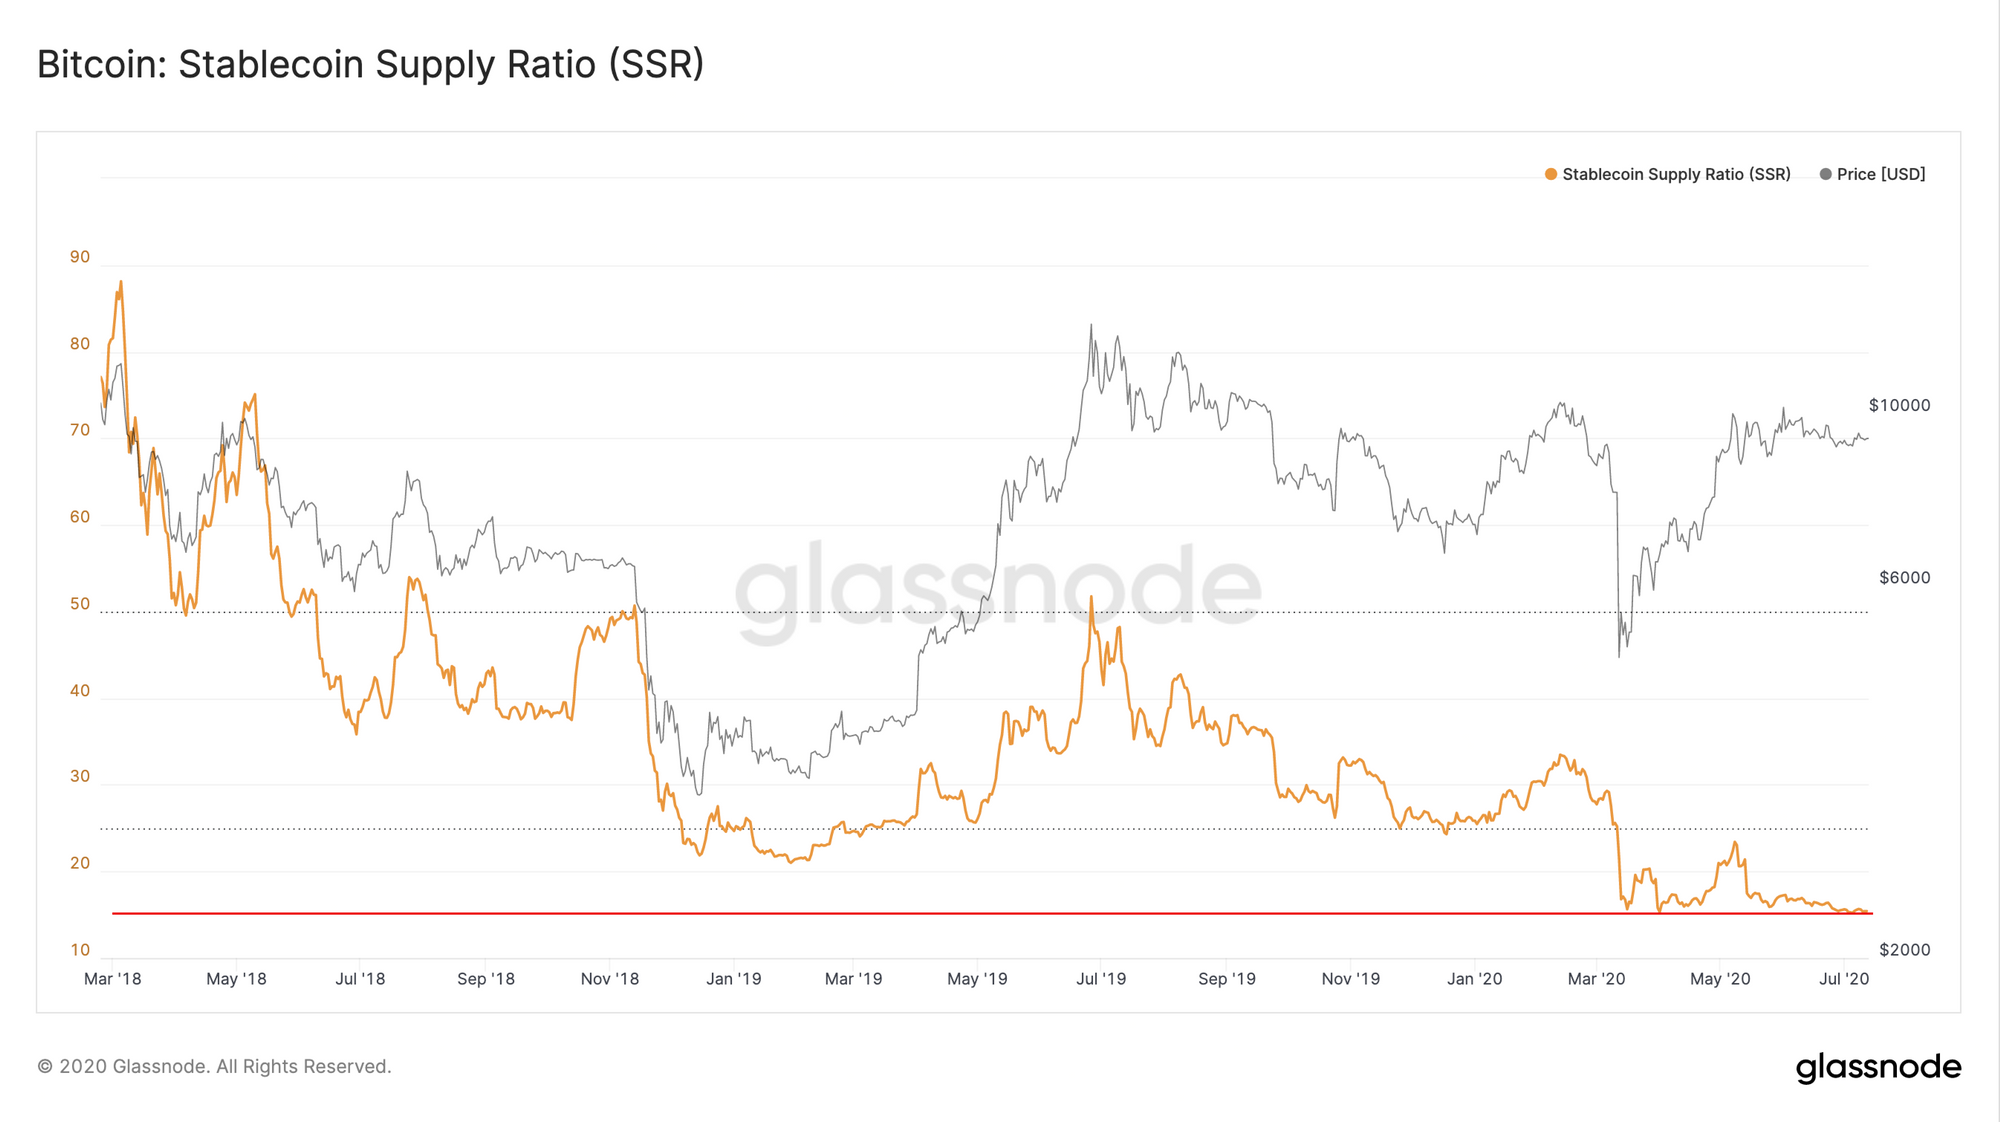
As more money flows into stablecoins, this drives the SSR value down, representing an increased supply of stablecoins theoretically ready to flow into BTC.
Currently, for every dollar in BTC, there are 6.5 cents in stablecoins. This is comparatively high relative to values seen, for example, in early 2018 - when there were only 1.1 cents in stablecoins for every dollar in BTC. Theoretically, if all money in stablecoins were to flow into BTC, it would increase bitcoin's market cap by 6.5% (although in practice this would be more, as the increased demand would drive up the price of BTC).
However, while a low SSR is generally a bullish sign for bitcoin, purchasing BTC is of course not the only use case of stablecoins. With this rise in stablecoin supply, we might be seeing people preparing to buy into BTC en masse, but these funds may also be earmarked for another purpose, such as buying into the altcoin pump.
Or, alternatively, the rise in stablecoin supply might be only tangentially related to the crypto markets. In these uncertain times, we could be seeing the adoption of a new way of storing USD wealth. Bitcoin's price movements in the coming weeks may shed more light on where these stablecoins are heading, if they move at all.

- Follow us and reach out on Twitter
- Join our Telegram channel
- For on–chain metrics and activity graphs, visit Glassnode Studio
- For automated alerts on core on–chain metrics and activity on exchanges, visit our Glassnode Alerts Twitter