The Week On-chain (Week 38, 2021)
Bull market Bitcoin buyers take modest profits this week, whilst exchange balances continue to decline, and miner hash-rate recovery continues.


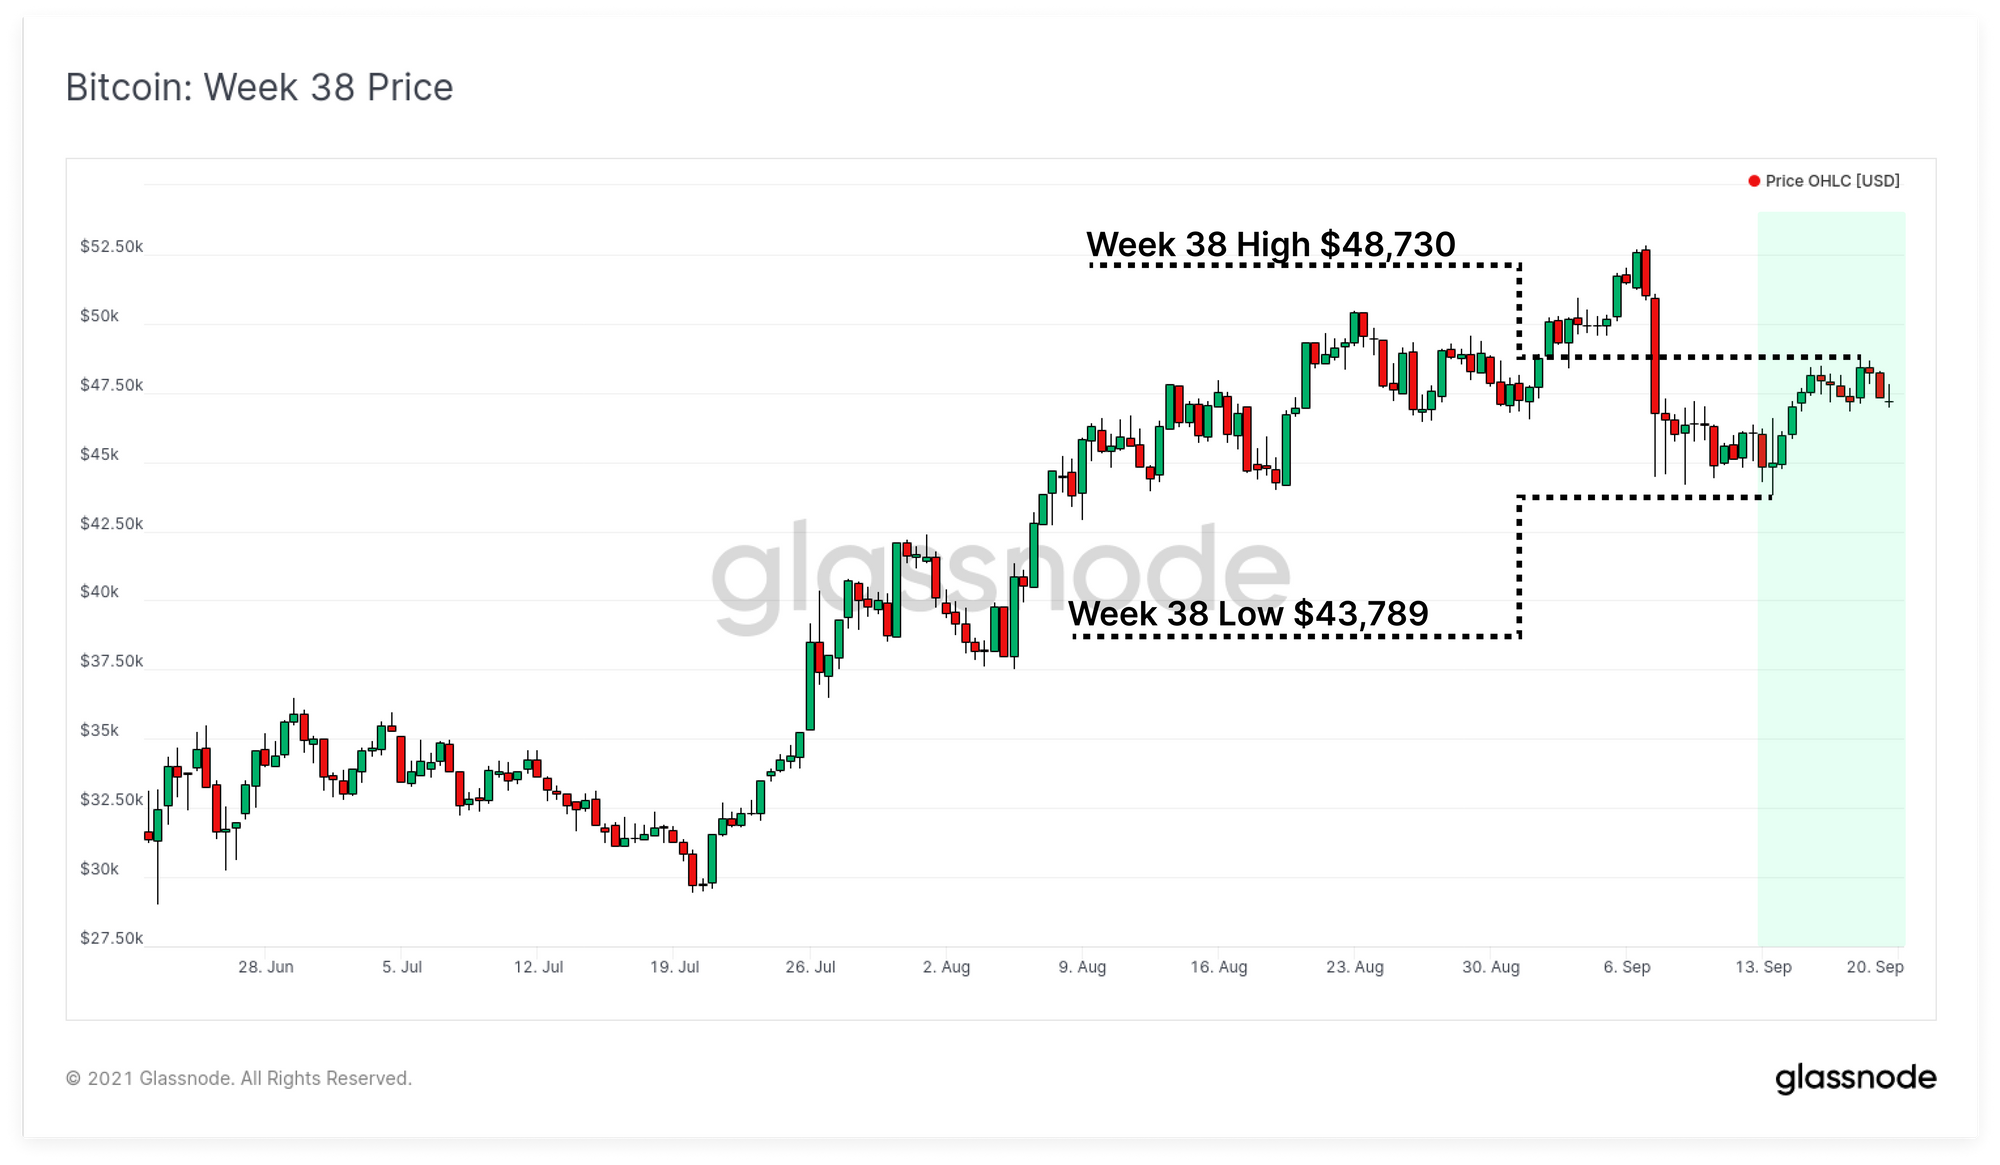
The Bitcoin market traded slightly higher this week, opening at a low of $43,789, and trading up to an intra-day high of $48,730. Prices are forming a consolidation trading range after the volatile sell-off that started off the previous week, clearing $4B in excess leverage in one hour.
The Bitcoin market finds itself amidst a macroeconomic landscape punctuated by growing uncertainties in Chinese credit markets, and downside price action for traditional equities over the week. Despite this backdrop, Bitcoin price action, and on-chain investor responses appear relatively robust. This week, we will assess the continued dominance of coin outflows from exchanges, recovering miner hash-rate, and the realisation of modest profits with the market absorbing the sell-side pressure.
Modest Realisation of Profits
In on-chain analysis, we often build models upon the concept of 'realised value' for a coin, that is the price at which a UTXO, containing some volume of BTC, was created. Another way to consider this is the price at which a coin last moved, thus reflecting the on-chain 'cost basis' for that coin.
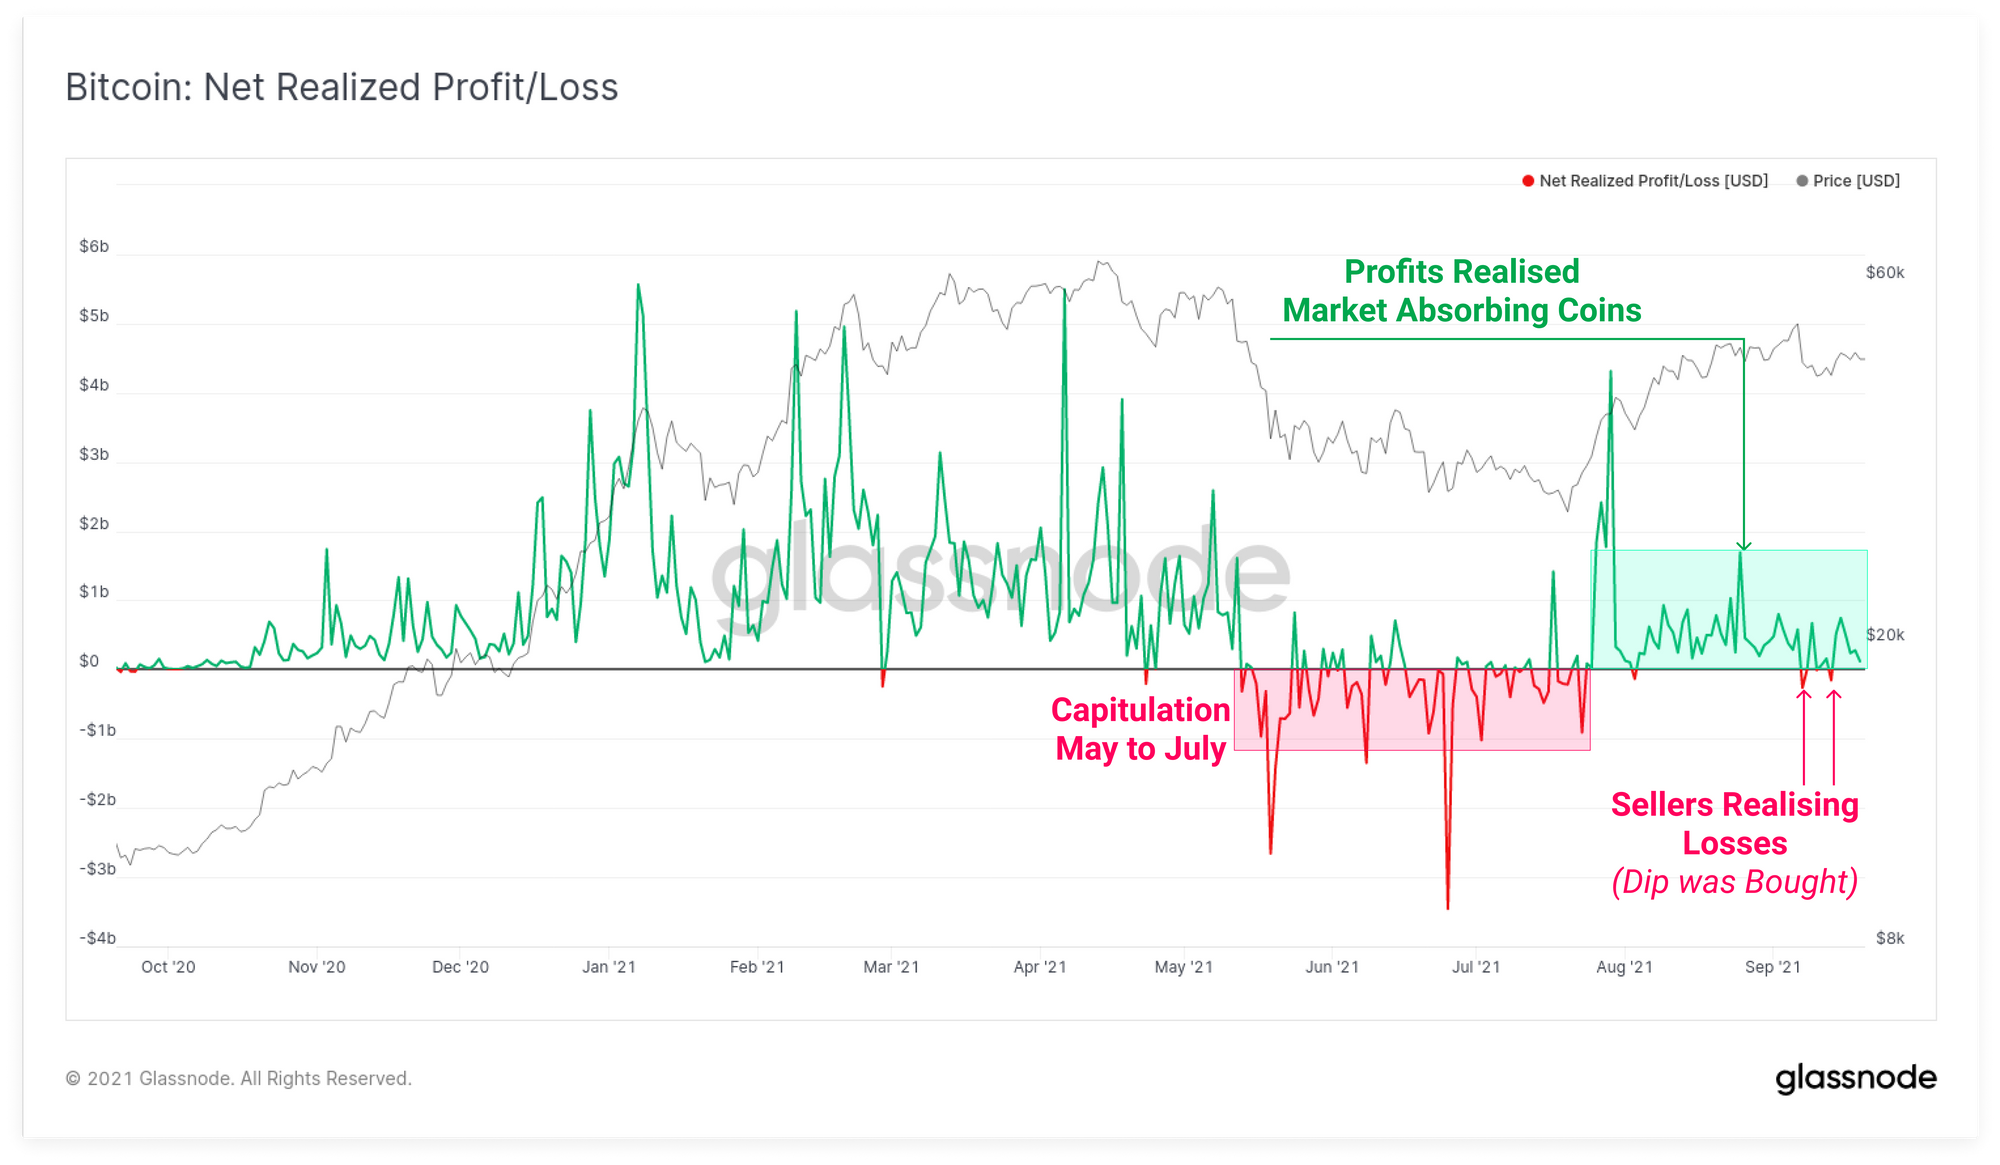
When a coin is spent at a later time, we can assess the difference between the original realised price, and the current spent price to assess if the owner is realising a profit, or a loss. The aggregate value of all coins spent that day the provides an estimate on the volume of capital flowing into the market, as every seller is by definition matched with a buyer.
Since late July, the market has consistently realised net profits on the order of around $1B per day as prices rallied from $31k to over $52k. This suggests a relatively meaningful bid has supported the market on the way up.
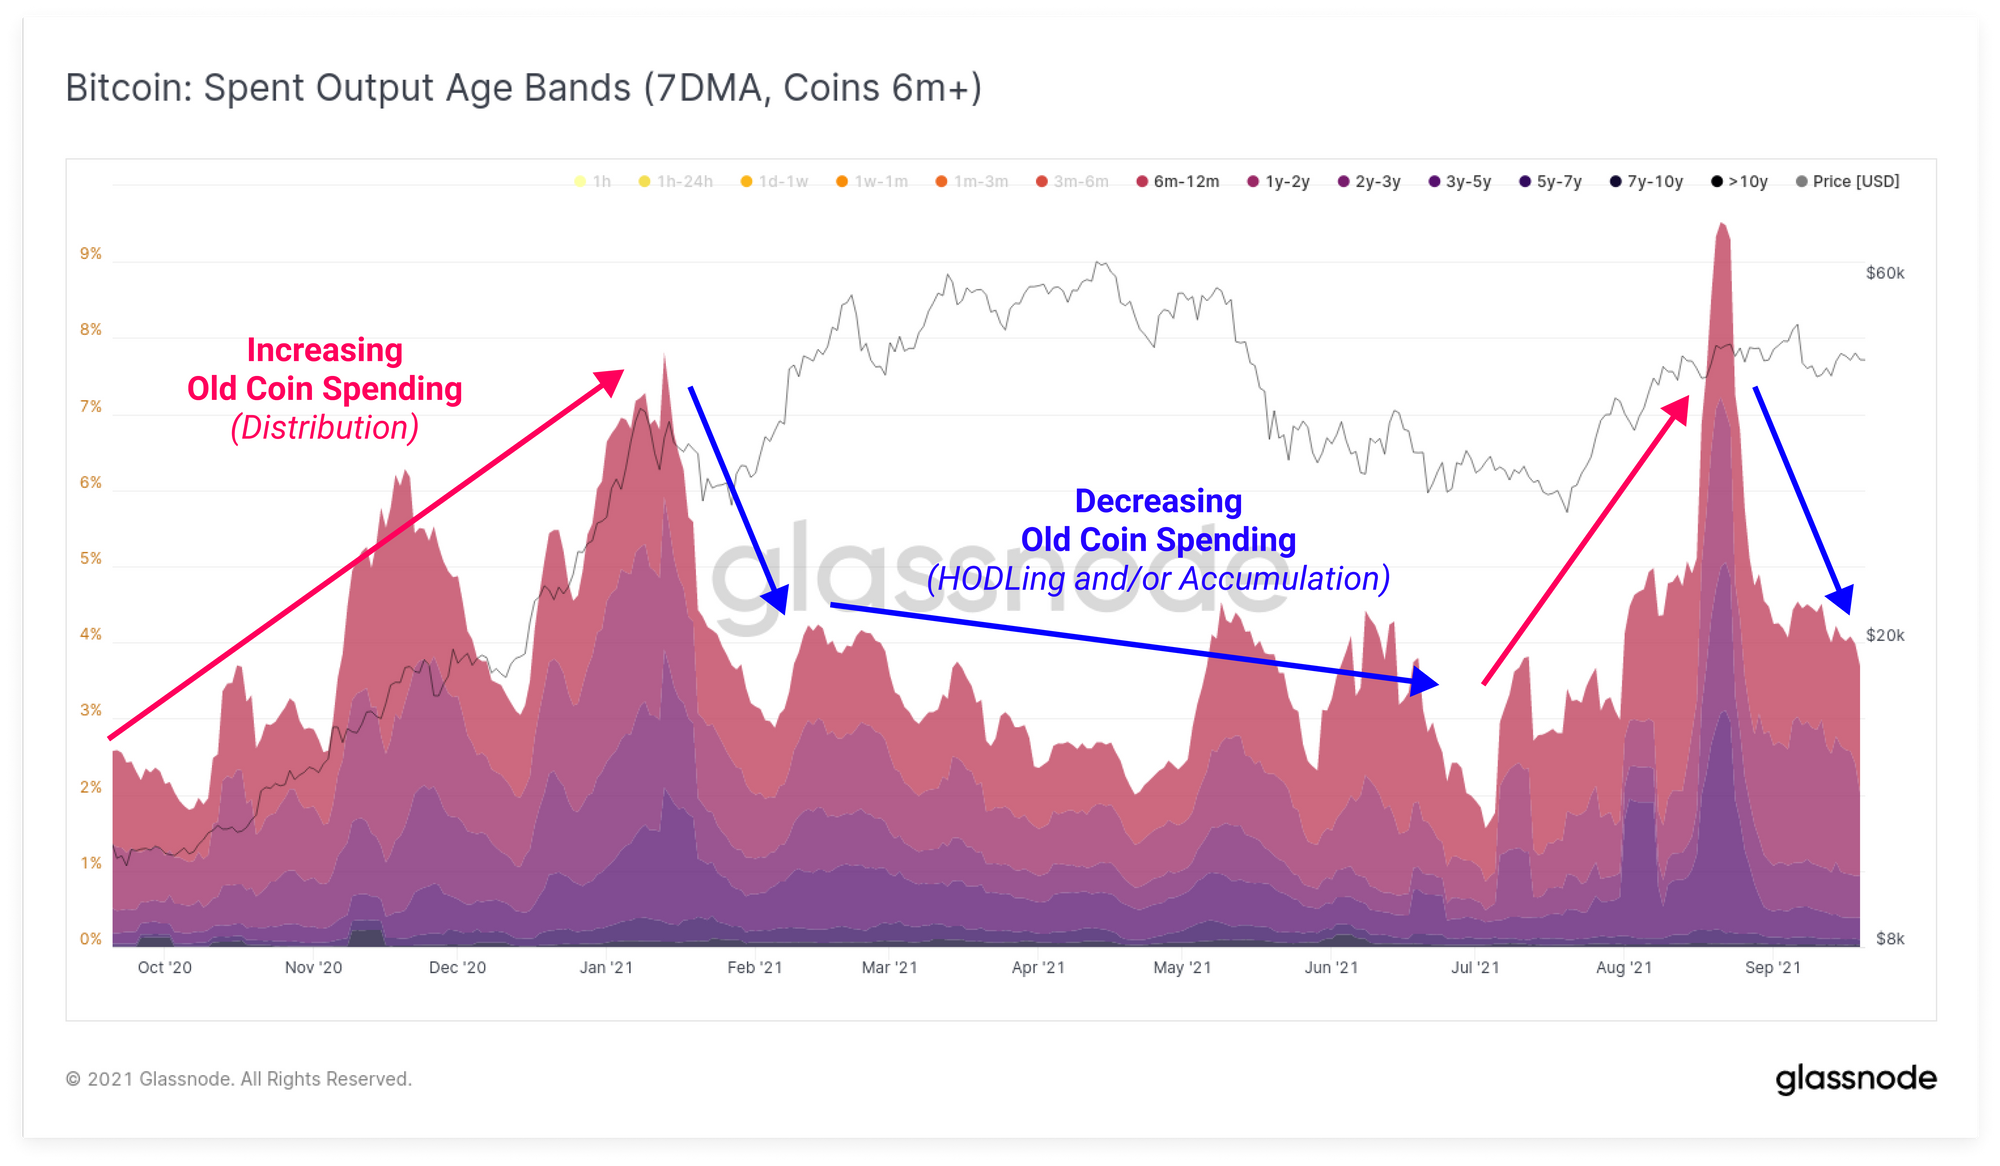
We can assess the Spent Output Age Bands to get a gauge on the cohorts of investors who are spending coins in the current market. For coins older than 6-months, there has been a reasonable uptick in spending behaviour throughout the August rally, however that spending has cooled off through September. The proportion of spent outputs older than 6m+ currently sits at around 4% dominance of all spent coins.
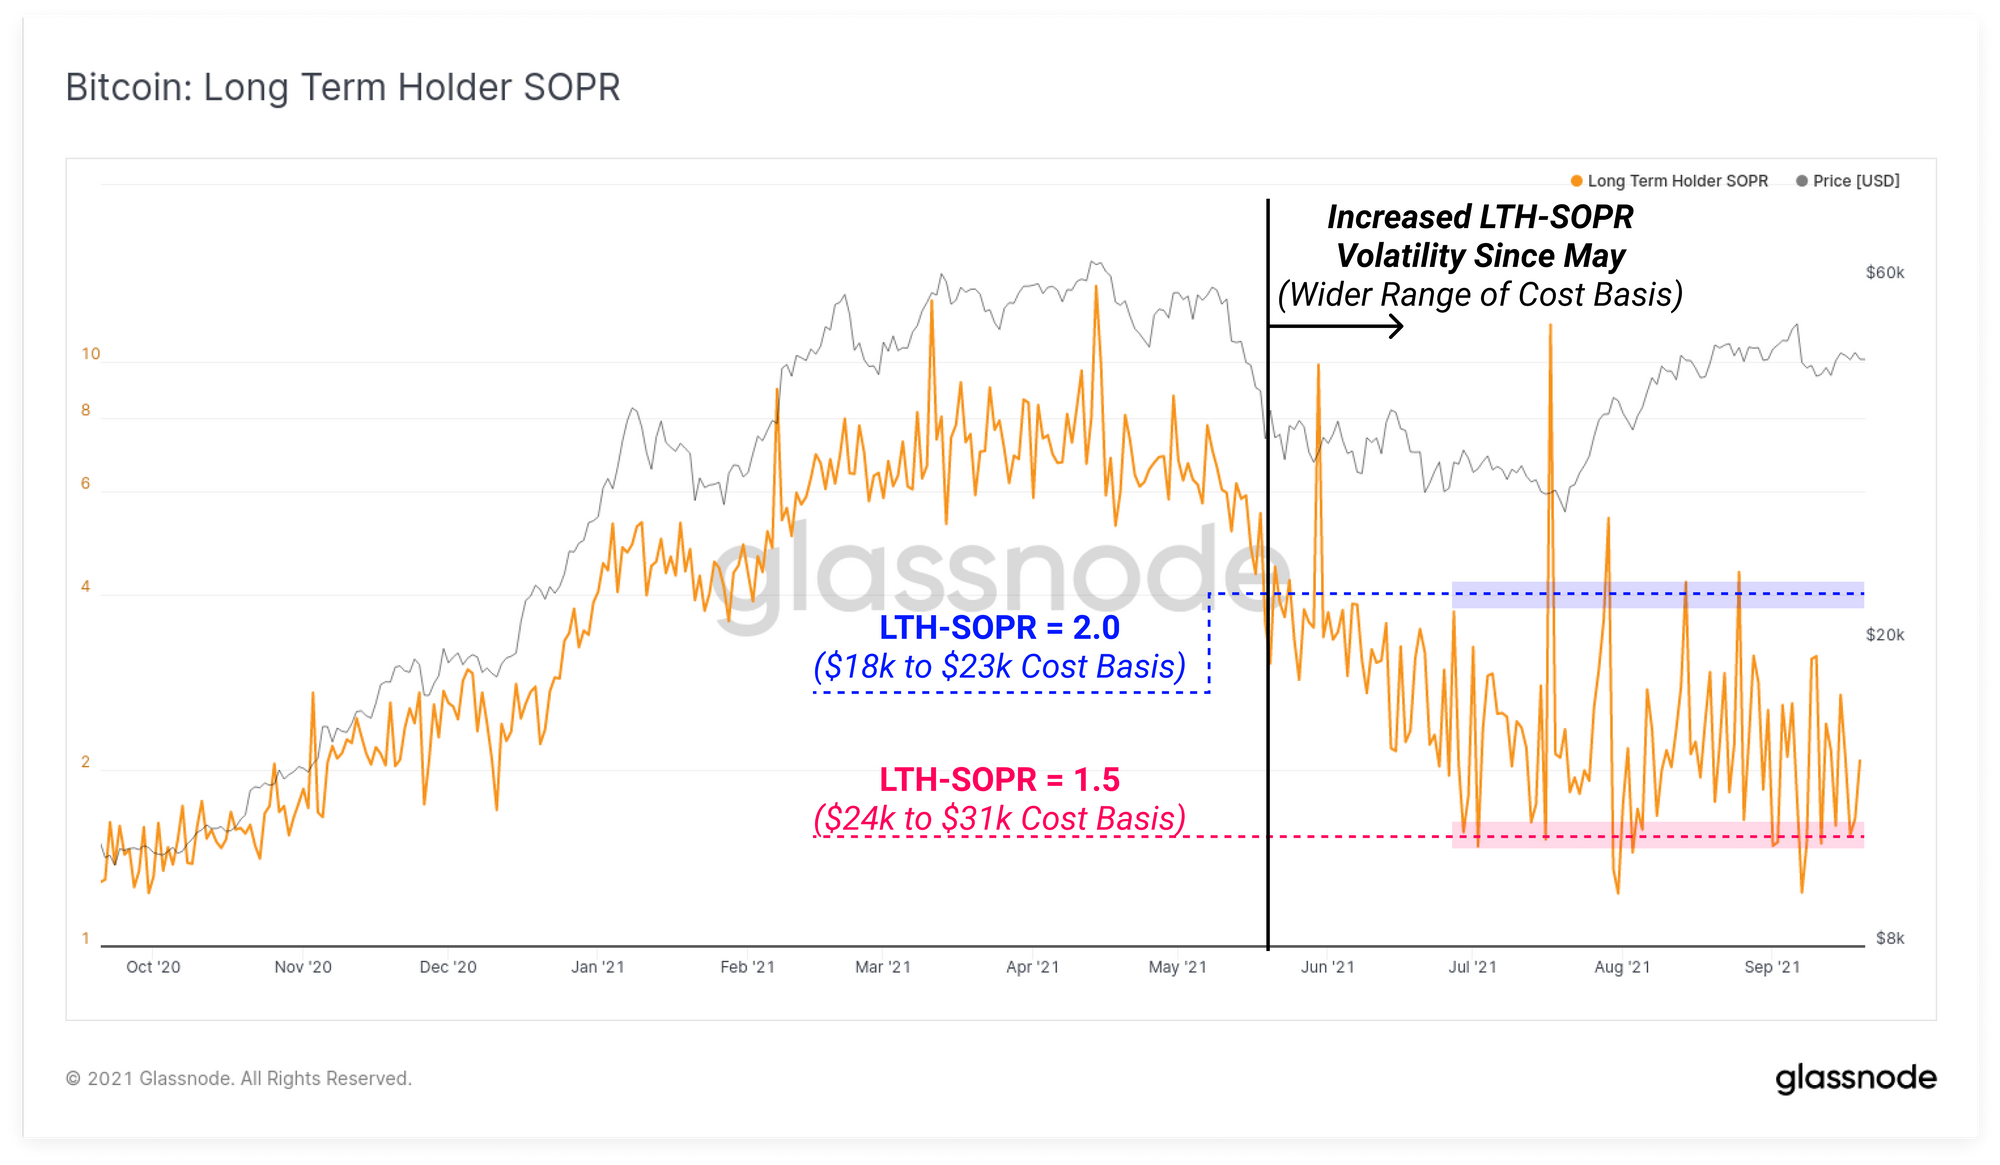
The Long-term Holder SOPR provides another view on this spending behaviour, and it has become increasingly volatile since early July. This indicator tracks the aggregate profit multiple realised by spent coins that were older than around 155-days (~5-months).
A LTH-SOPR value of 2.0 means that on aggregate, LTHs realised a 200% gain on their spent coins that day.
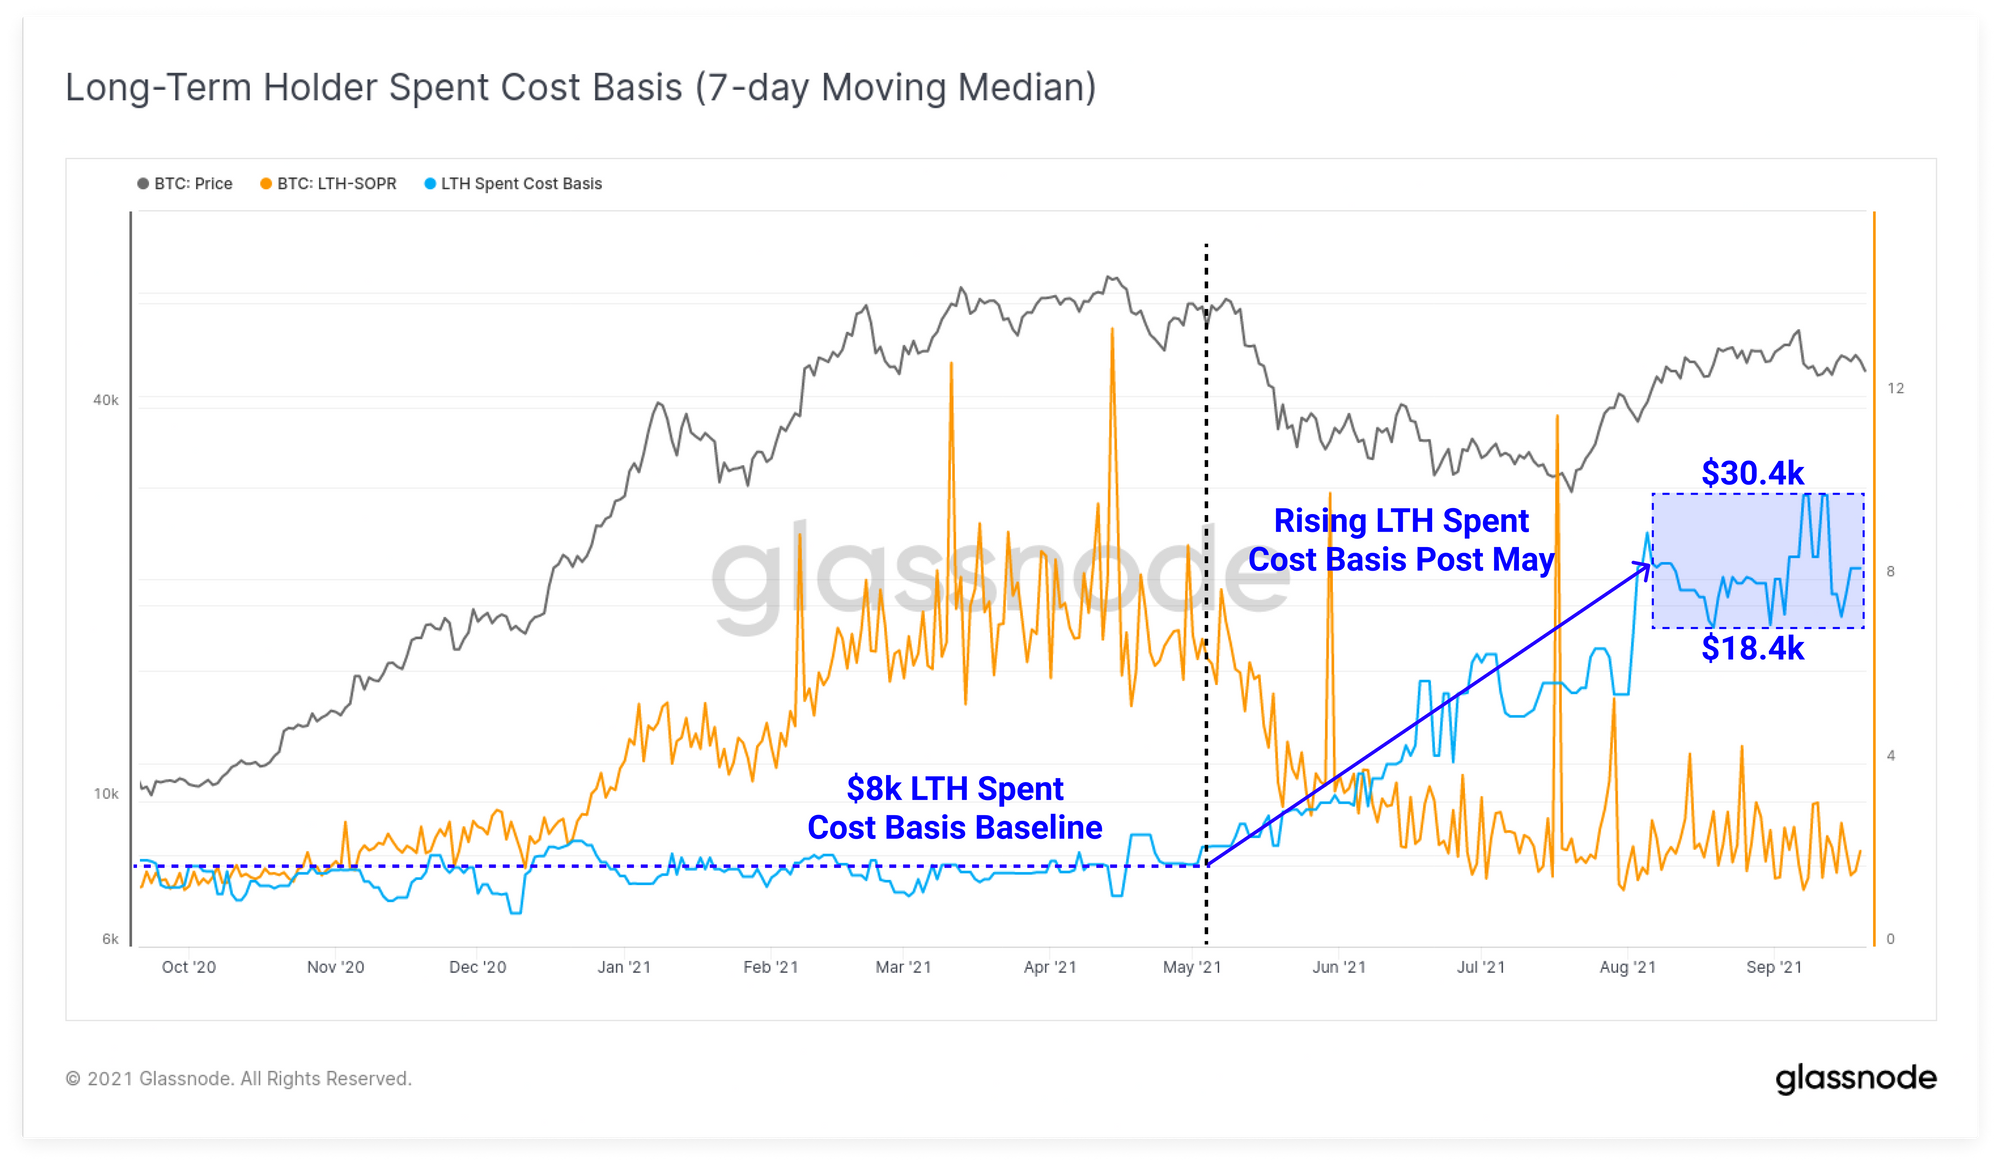
We can also flip this observation around to estimate the aggregate cost basis for LTHs who are spending coins by dividing the BTC price by the LTH-SOPR value.
A LTH-SOPR value of 2.0 at a BTC price of $36k gives an aggregate LTH cost basis of $36k/2.0 = $18k cost basis.
The increased volatility in the LTH-SOPR indicator therefore demonstrates that LTHs are spending coins which were accumulated across an increasingly large range of cost bases:
- Lower Bound LTH-SOPR = 1.5 suggests coins spent have a cost basis between $24k to $31k
- Upper Bound LTH-SOPR = 2.0 suggests coins spent have a cost basis between $18k to $23k
Overall, the range of aggregate cost basis for LTH spent coins since May is therefore between $18k and $31k. Note these are all prices from within the 2020-21 bull market and suggests that perhaps Bitcoin long-term investors are becoming more active traders, taking profits off the table, or perhaps using coin margined derivatives to hedge risk, or speculate to a greater extent than was seen in Q1 and Q2. It may also reflect some uncertainty regarding current market structure as coins with higher cost basis, closer to the current price, are preferentially spent.
To demonstrate this, the chart below shows the estimated LTH spent cost basis (blue, 7-day Median) calculated as Price / LTH-SOPR. We can see that following the sell-off in May, the aggregate cost basis for LTH spent coins rose from the stable baseline of $8k, up to the new range between the $18k and $31k bounds calculated above. This reflects the LTH threshold (155-days) encompassing coins above last cycles $20k ATH, as well as more LTH spending during the volatility since mid-May.
Exchange Balances Continue Outflows
Whilst there is spending behaviour observable amongst the existing cohort of Bitcoin holders, it appears there is even more demand for coins accumulated from exchange balances.
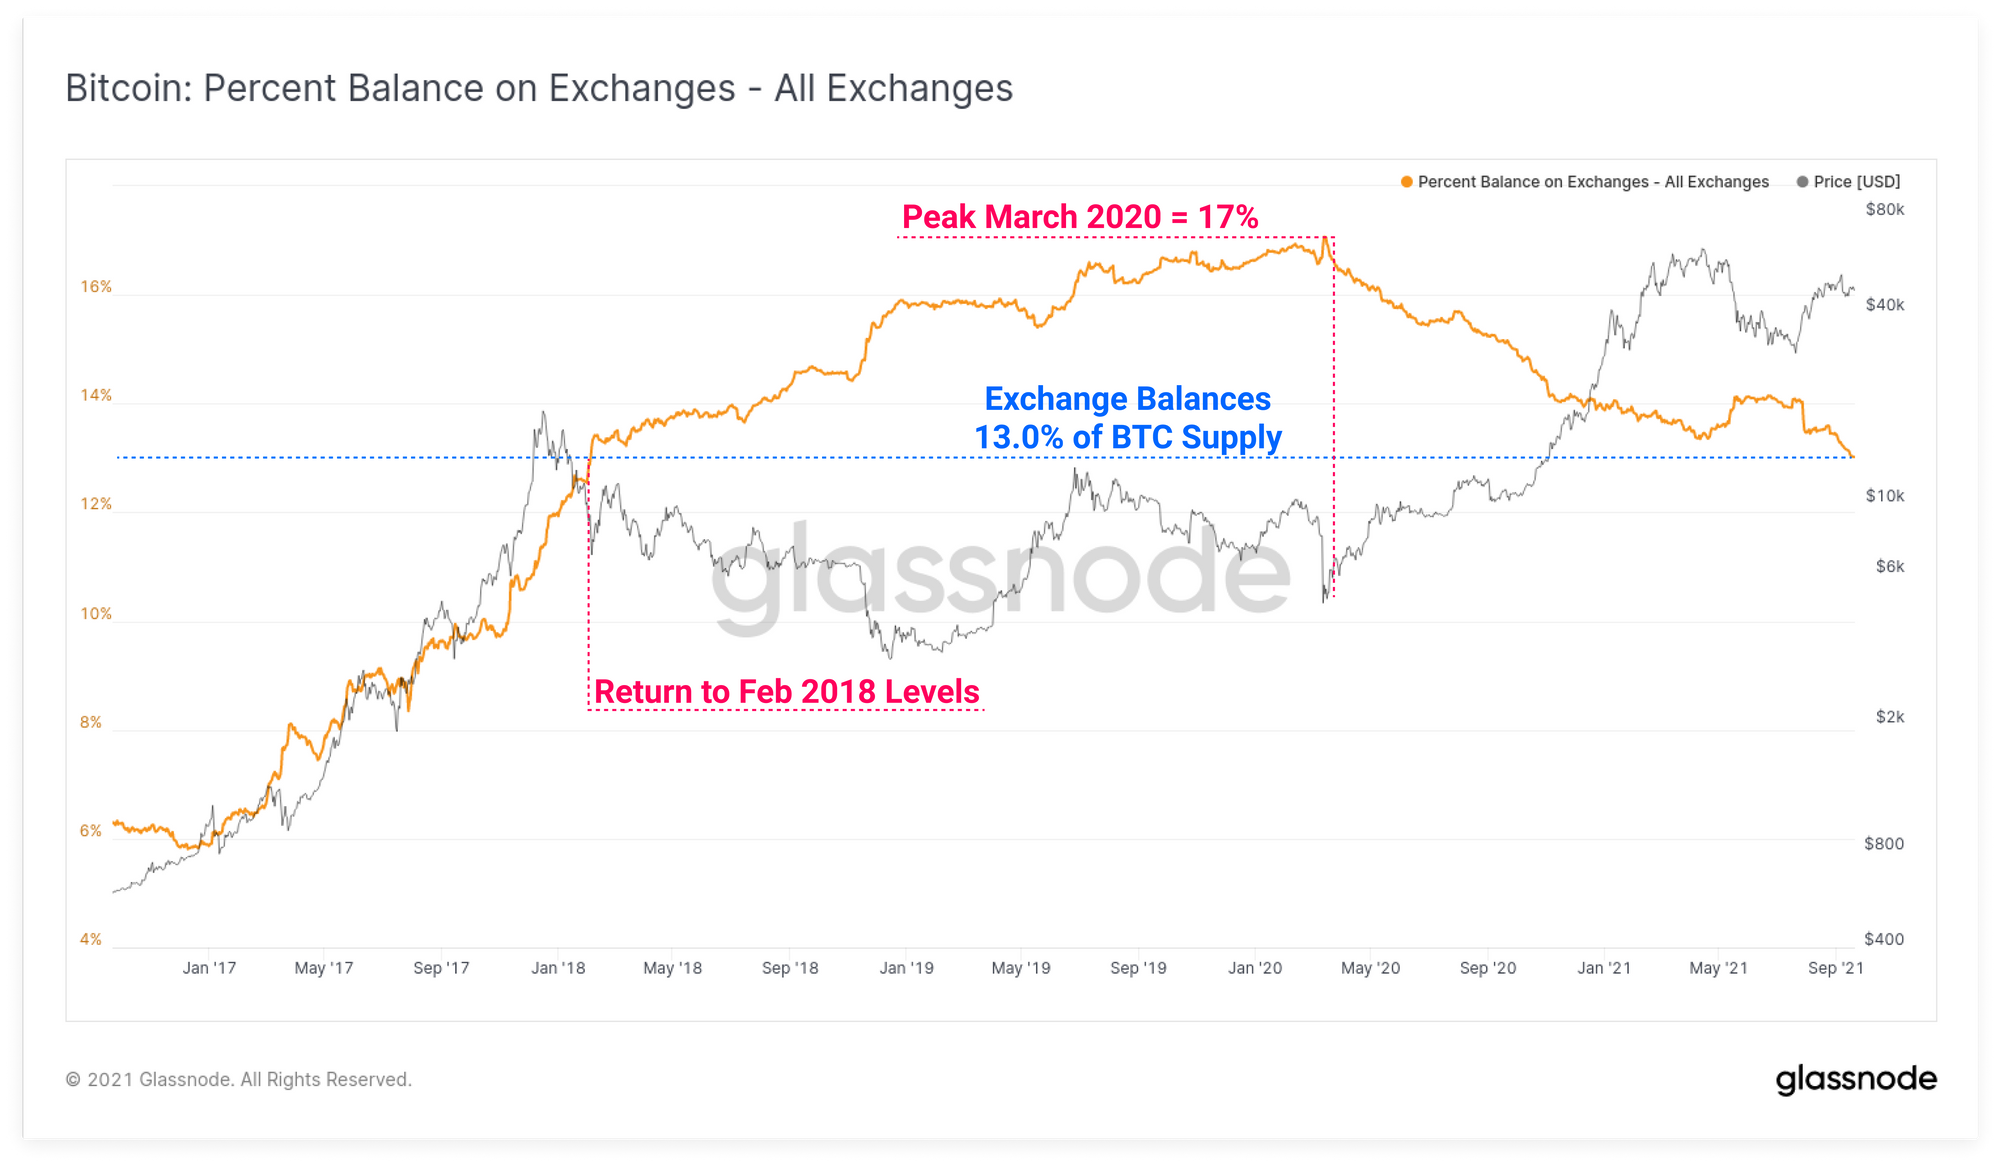
Overall exchange balances have continued to decline this week, reaching a new multi-year low of 13.0% of circulating supply this week. This returns exchange balances to levels last seen in Feb 2018. Keep in mind that prices were trading between $6k and $10k at that time. The accumulation of coins after March 2020, with prices trading up from $3.8k to over $64k in April, reflects the significant growth of capital inflows necessary to withdraw this relative coin volume.
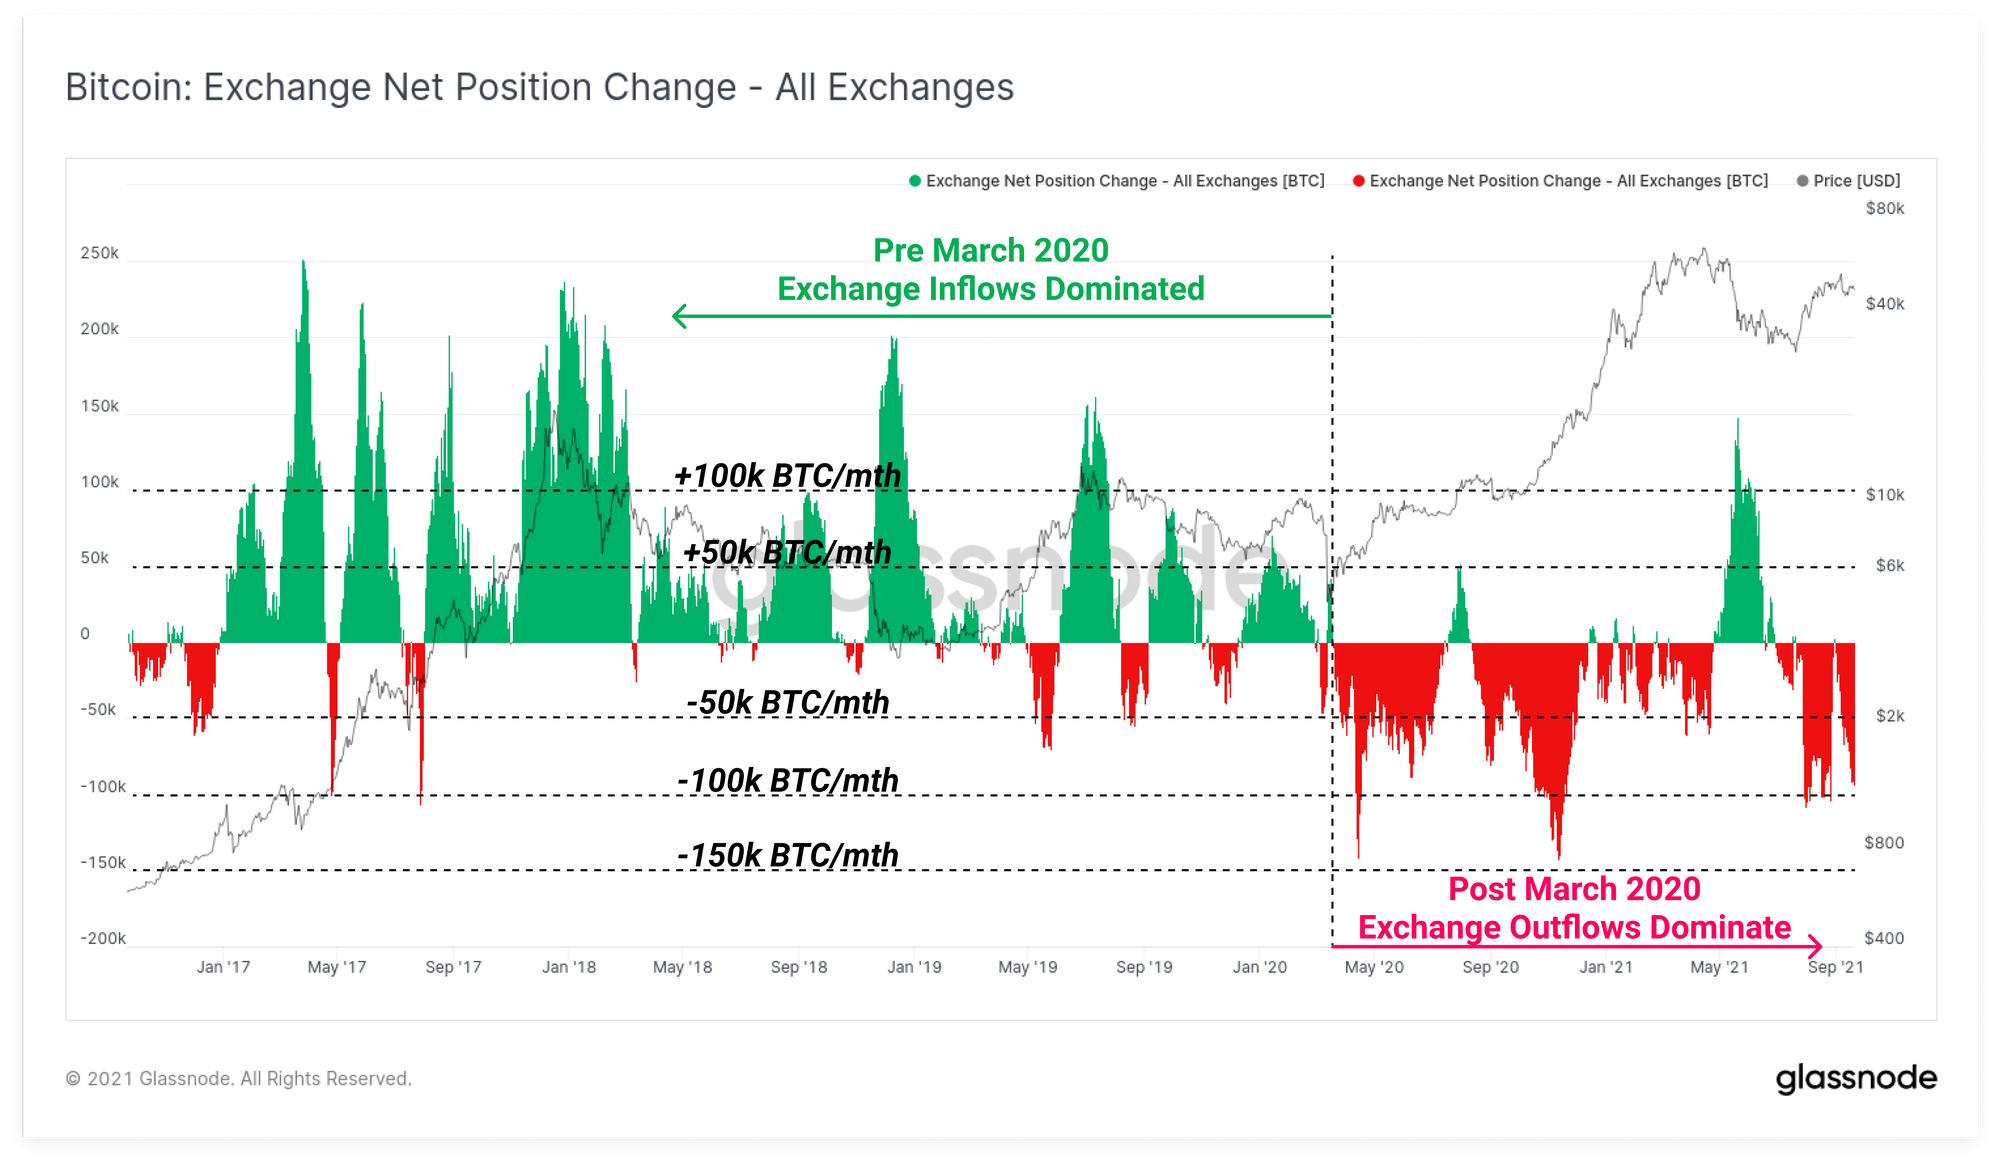
Supporting this observation, is a deeply negative (outflows) exchange net-flow reading this week, with current BTC outflows occurring at a rate of -92k BTC/month. Similar to the exchange balance chart above, the market clearly shifted paradigm after March 2020, from a regime of net exchange inflow dominance, to outflow dominance.
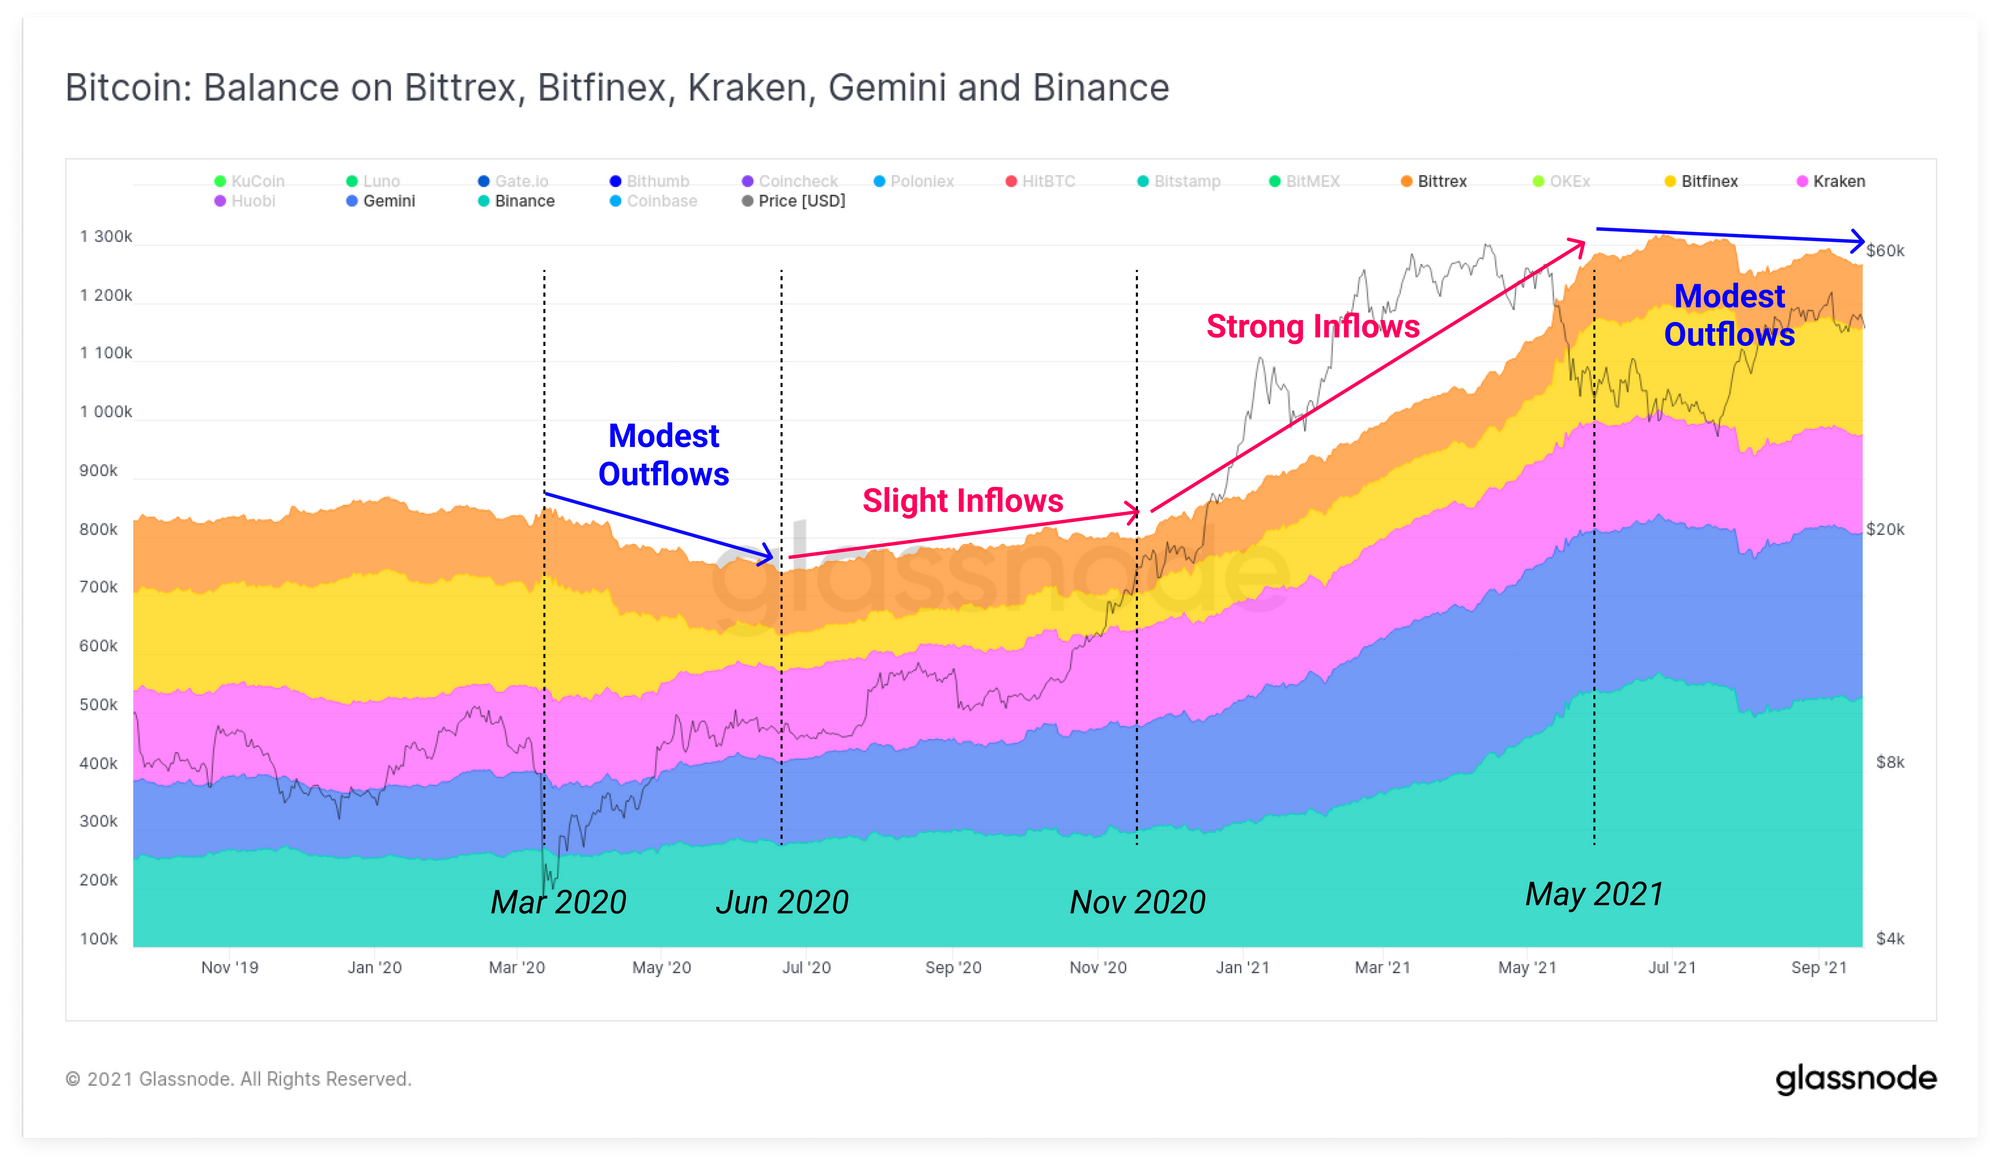
We can also investigate the comparative performance of various groups of exchanges with similar balance flow characteristics. The first cohort of exchanges includes Bittrex, Bitfinex, Kraken, Gemini and Binance.
These exchanges demonstrate a characteristic inflow and balance growth throughout most of 2020 and 2021, reflecting a rising dominance in coin holdings. Binance and Gemini are the primary recipients of this cohort. Since the sell-off in May, balances across this exchange group have plateaued and seen modest coin outflows.
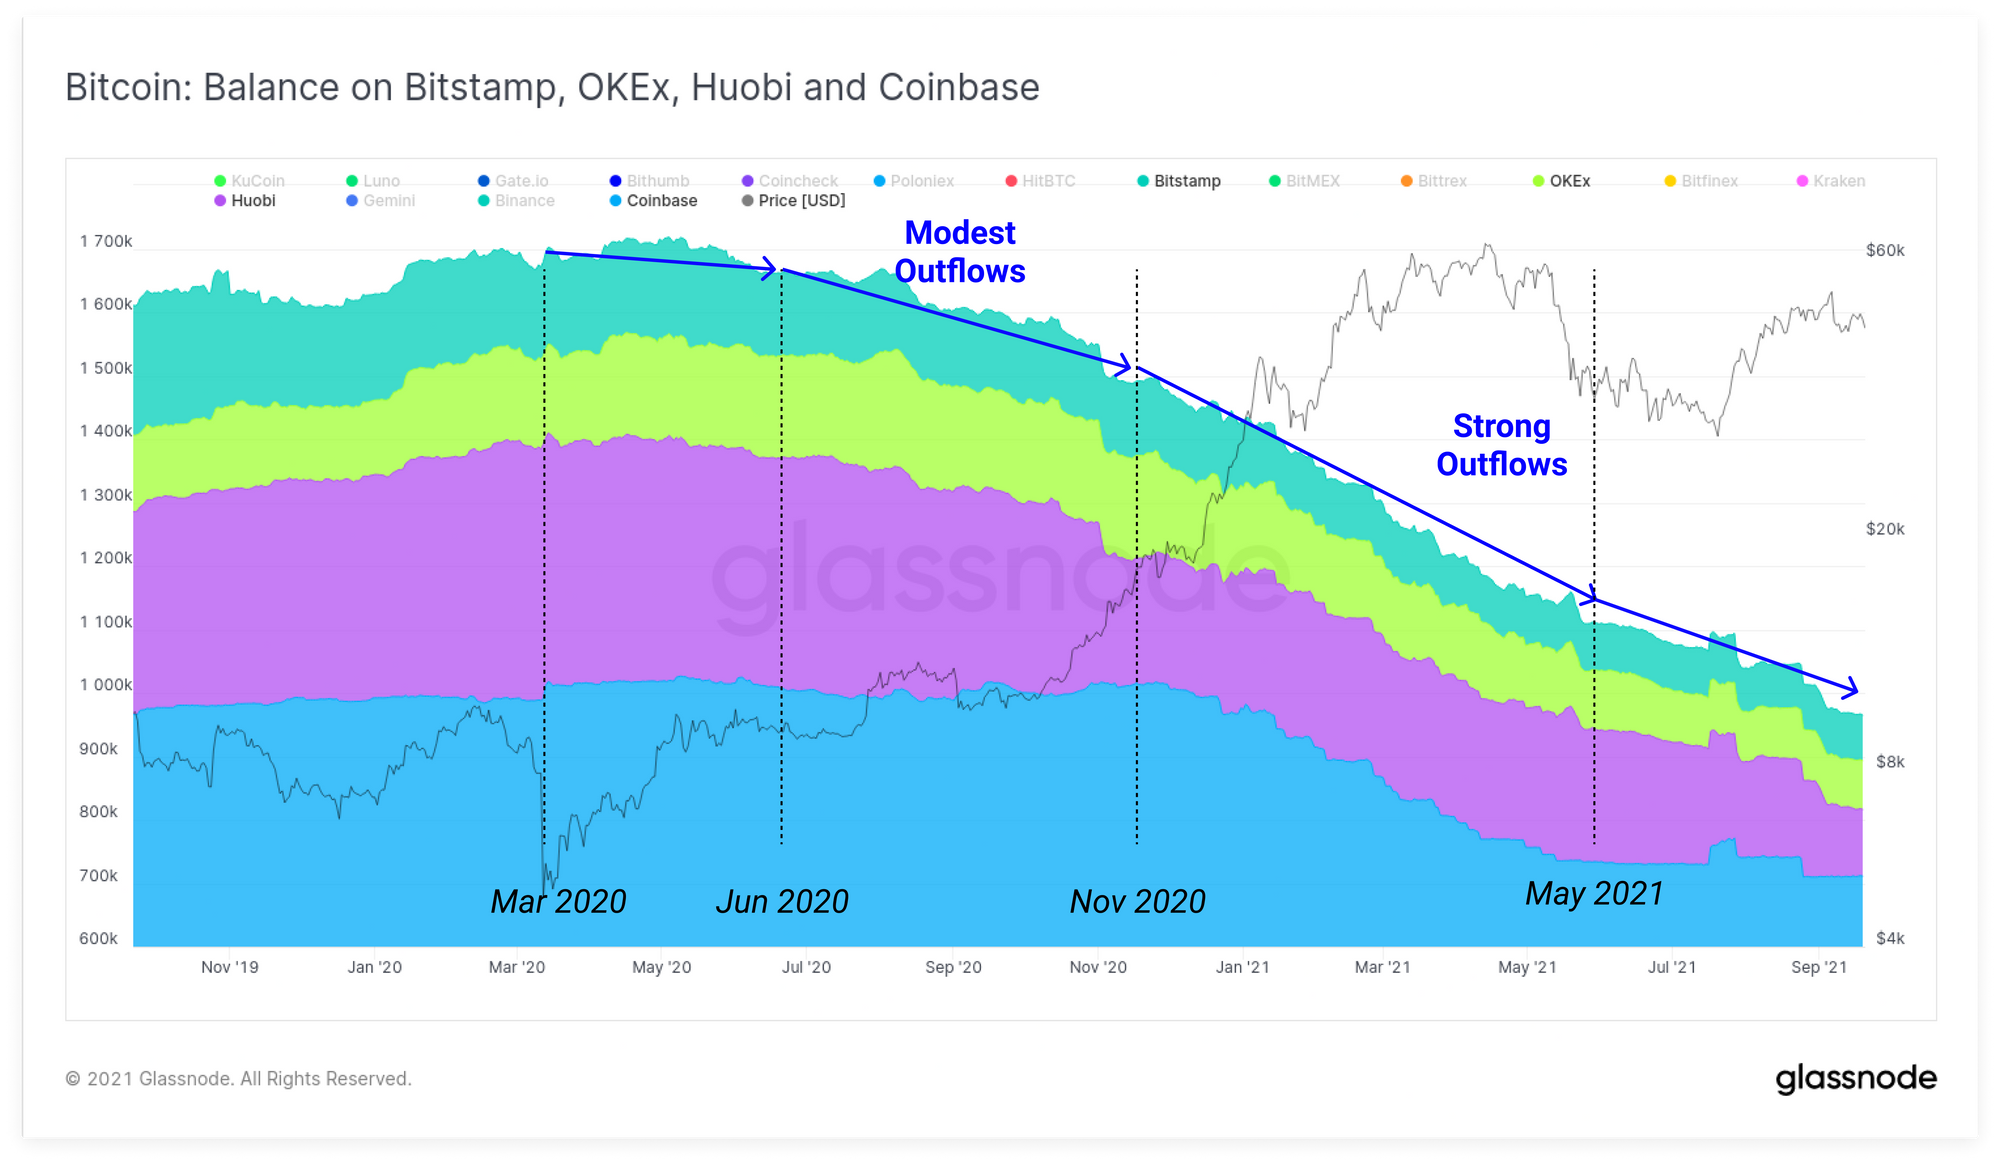
The second cohort of exchange balance characteristics are seen across Bitstamp, OKEx, Huobi and Coinbase. For this cohort, outflows have persisted since March 2020 and have actually accelerated in recent weeks.
Overall, the net balance across exchanges has continued to decline as the inflows observed in May are absorbed by the market and moved to investor wallets.
Bitcoin Miner Recovery and ThermoCap Model
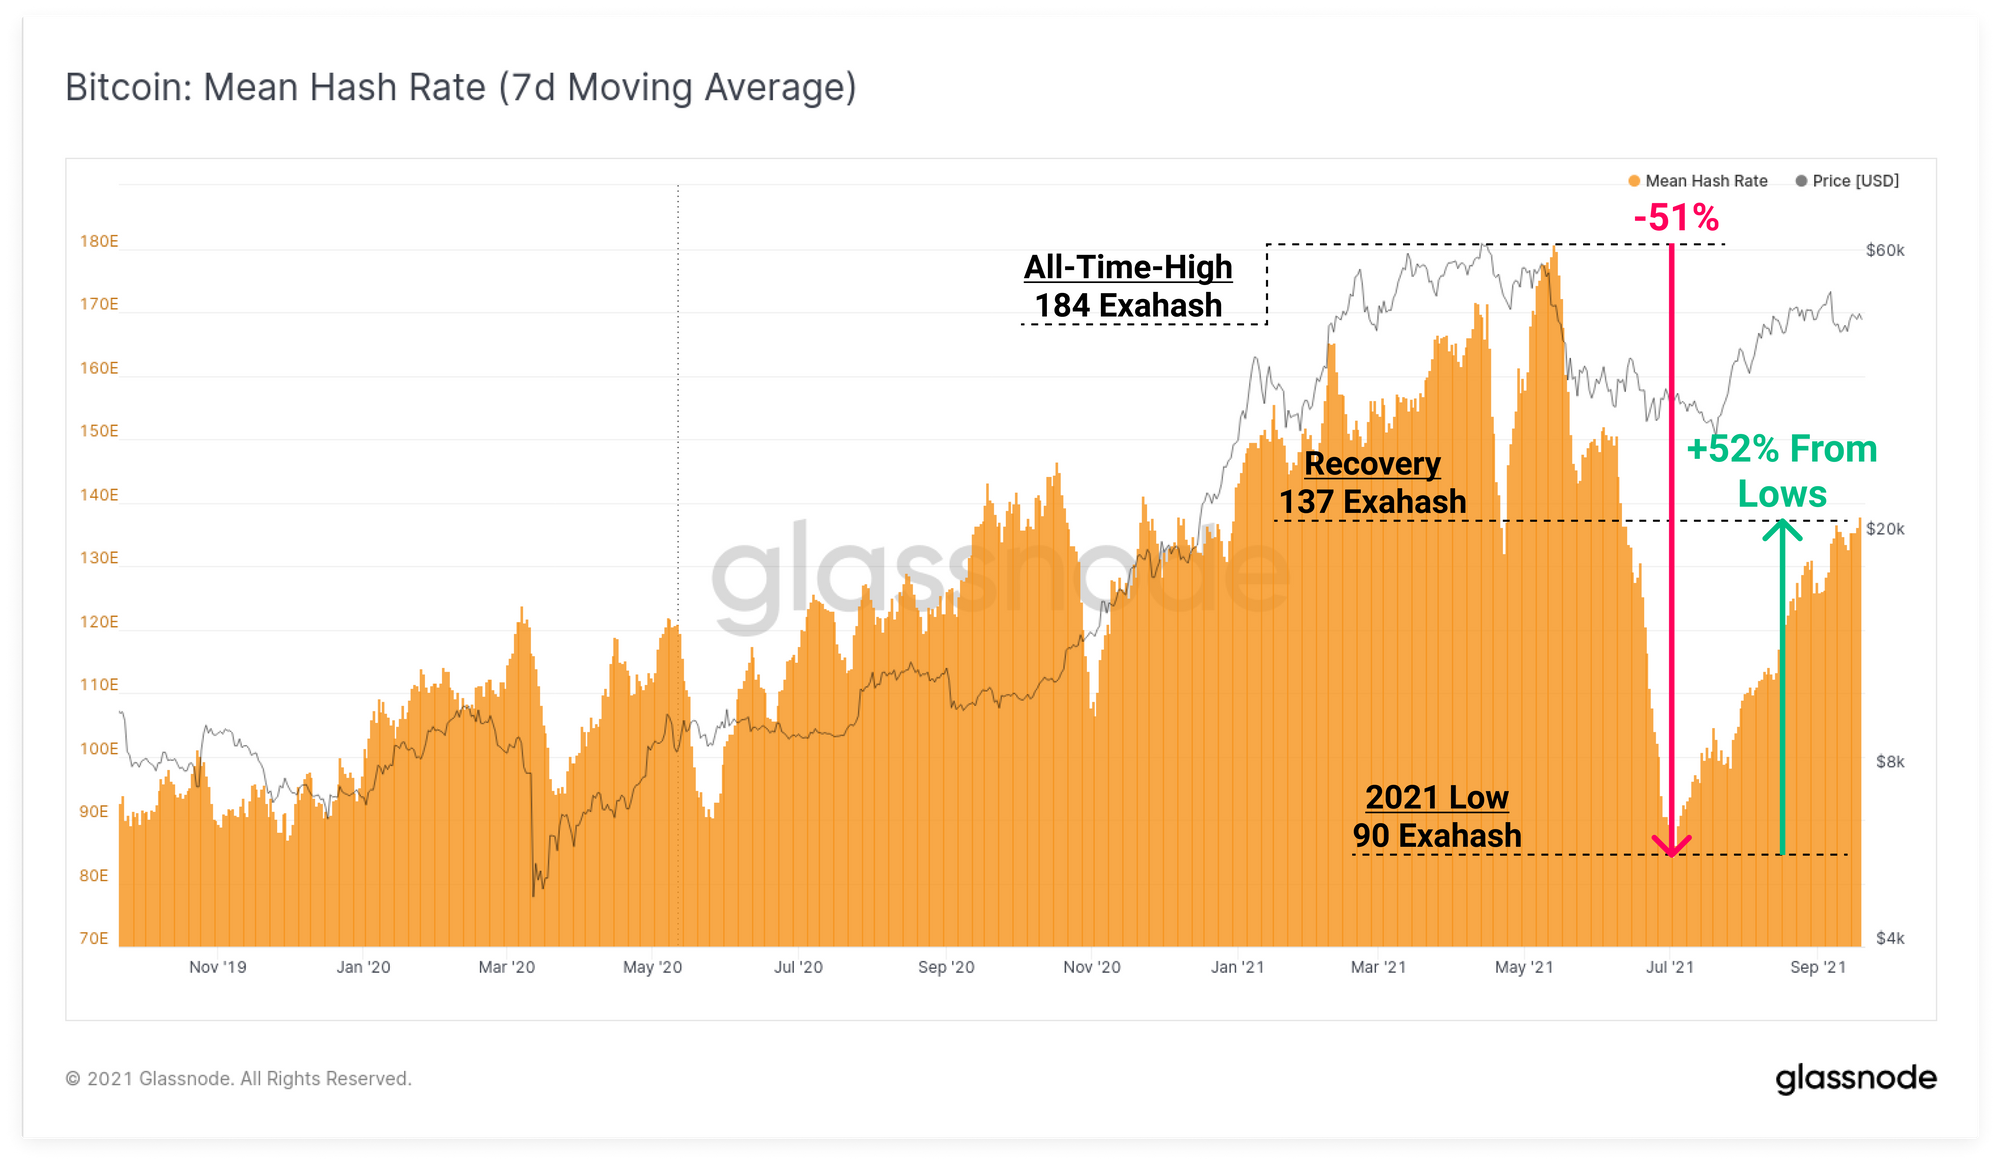
In a continued display of network resilience, Bitcoin hash-rate has climbed again this week, reaching approximately 137 Exahash on a 7-day MA basis. Given the total decline from the all-time-high represented around half the hash-power network, this ~52% recovery means that less than a quarter of the peak network hash remains offline.
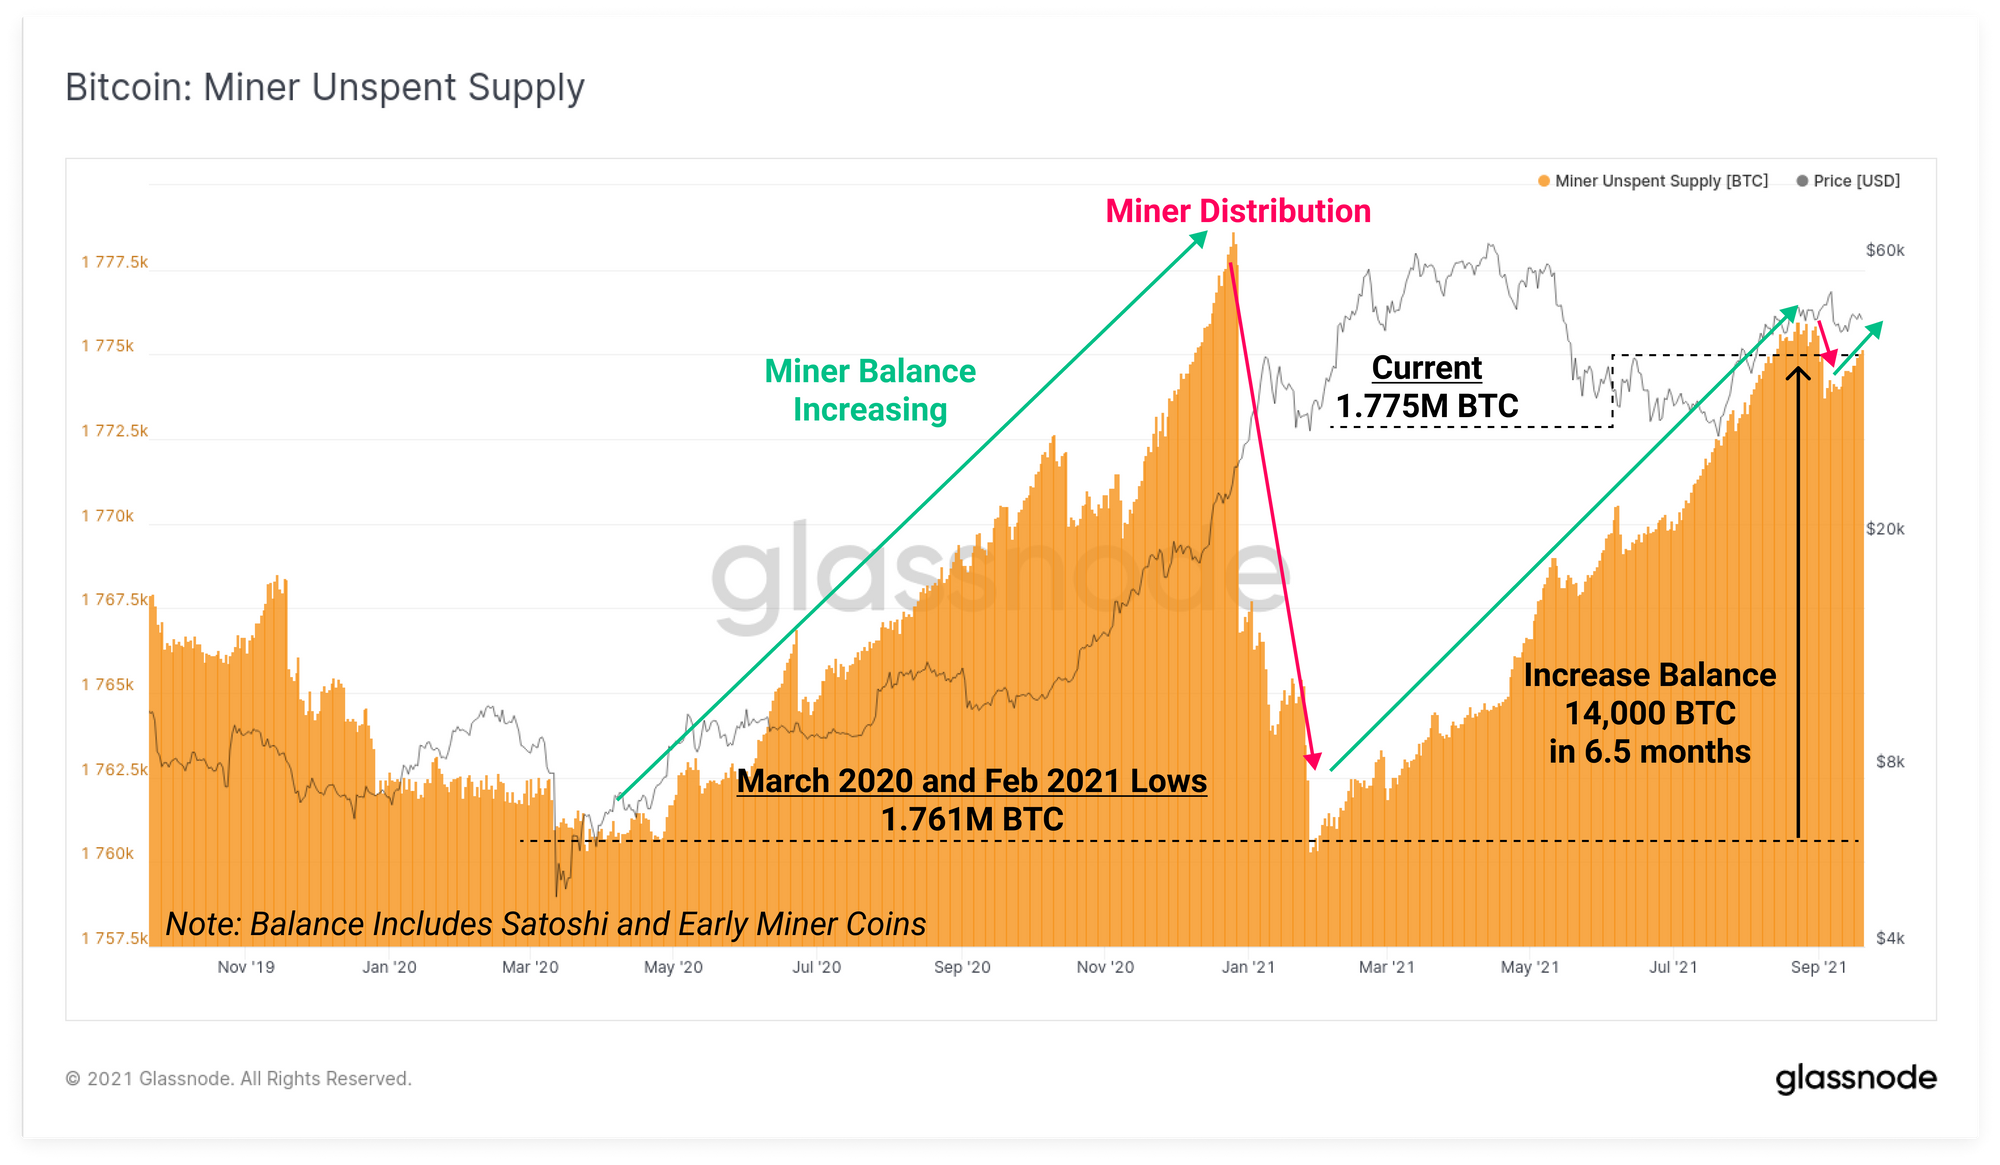
Throughout 2020 and 2021, miners have demonstrated an increased trend of HODLing a larger proportion of mined coins than in previous market cycles.
After a significant miner distribution that occurred in Jan-Feb 2021, miners have accumulated 14,000 BTC in unspent coinbase rewards over a 6.5 month period. A moderate spend of around 1,360 BTC occurred in late August, however the uptrend in miner unspent supply appears to be back in play.
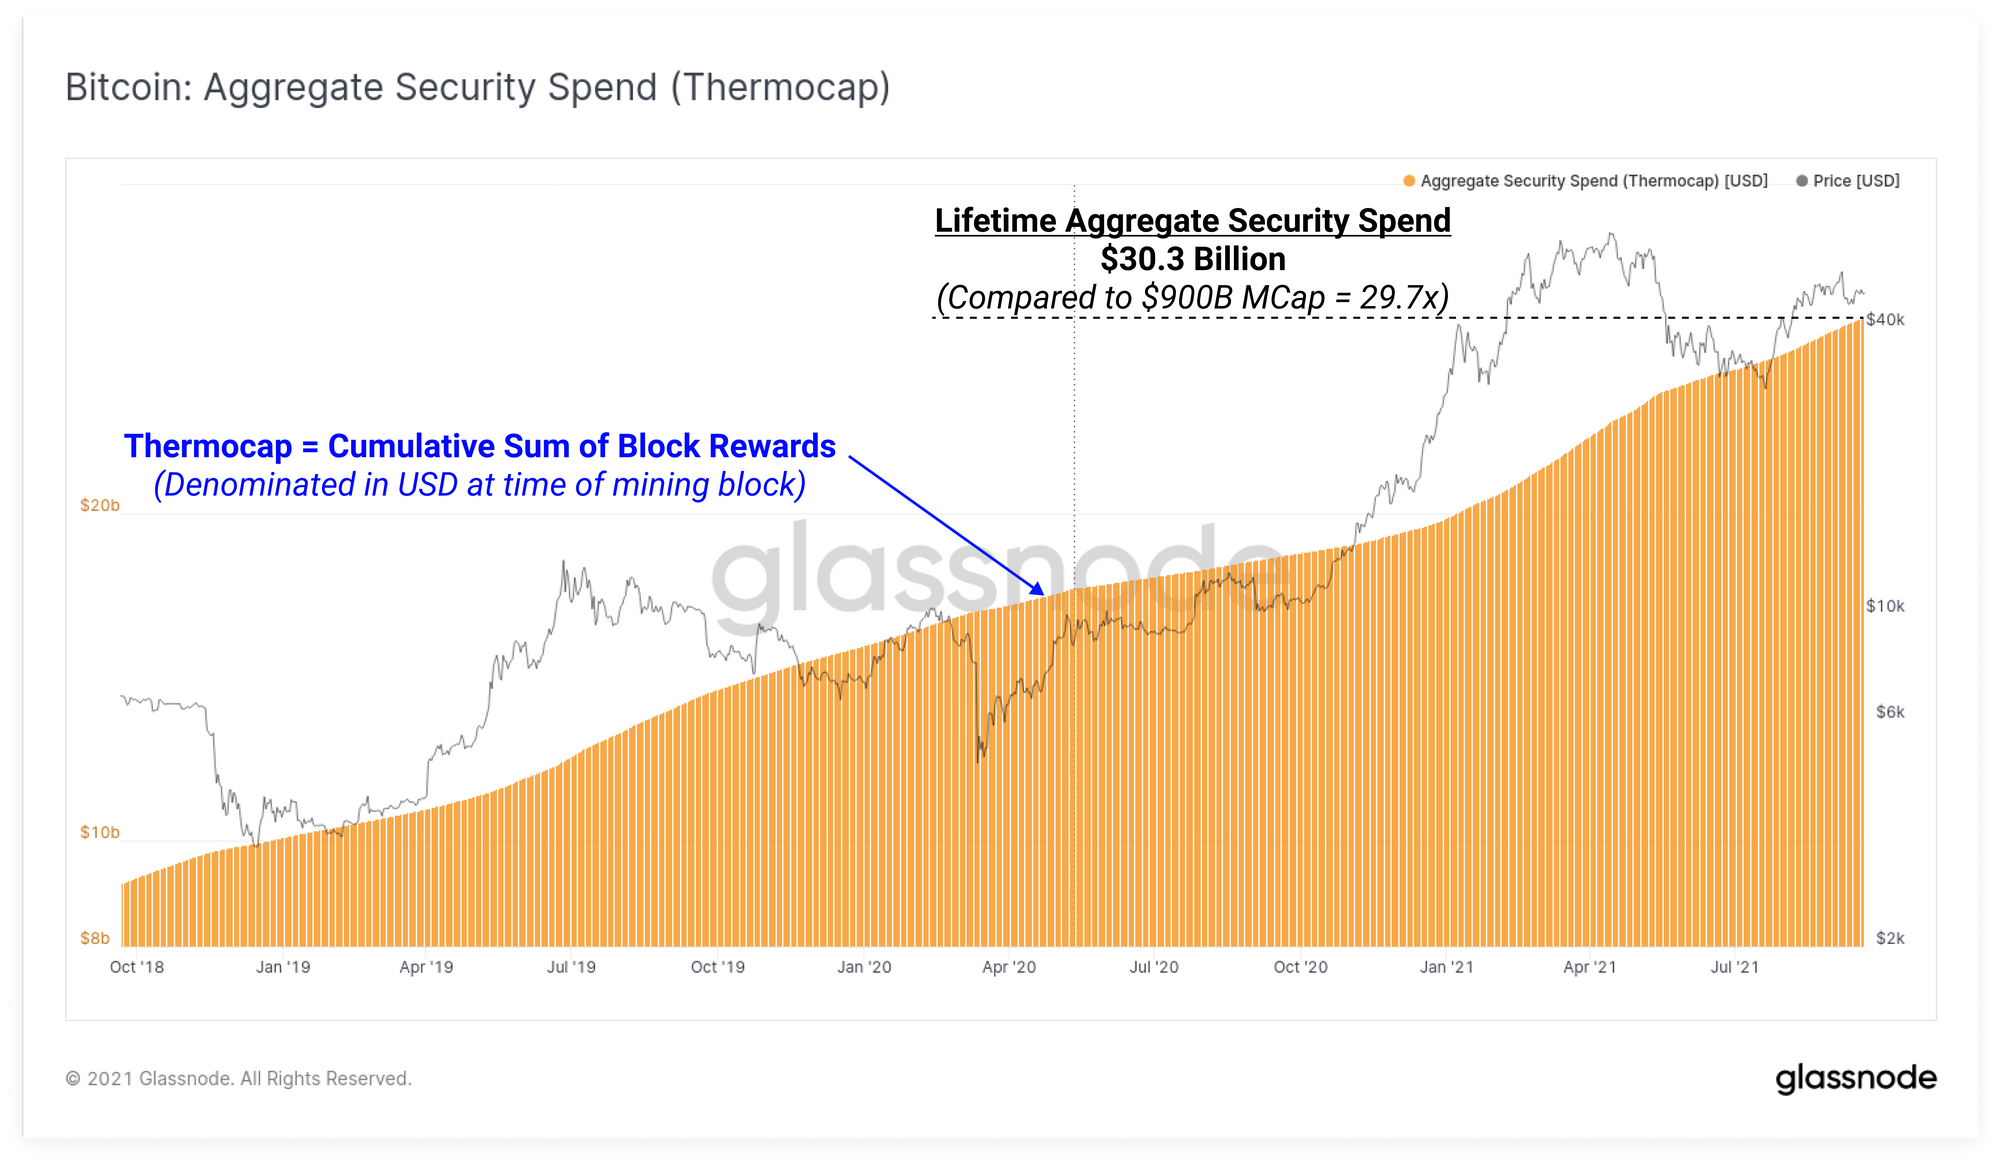
Lastly we will look at the Thermocap, which is a fundamental valuation model for Bitcoin representing the aggregate security spend to date. It is calculated as the cumulative sum of all block rewards paid to miners, as valued in USD, at the time of block production.
Another way to think about this metric, is that it reflects the cumulative value offered by the Bitcoin protocol as a reward for miners. As such, it can also be considered an upper bound on the cost of production for all circulating BTC, assuming miners are rational profit motivated actors. If $1B in total block reward is offered, we can expect miners to spend and compete with up to $1B worth of investment to earn that reward.
The Thermocap is currently sitting at $30.3B whilst the Bitcoin market cap is at $900B. If we consider the thermocap as the 'maximum aggregate cost of BTC production', Bitcoin is currently trading at a multiple of 29.7x above production cost. This is a 2,870% premium to lifetime aggregate miner input costs!
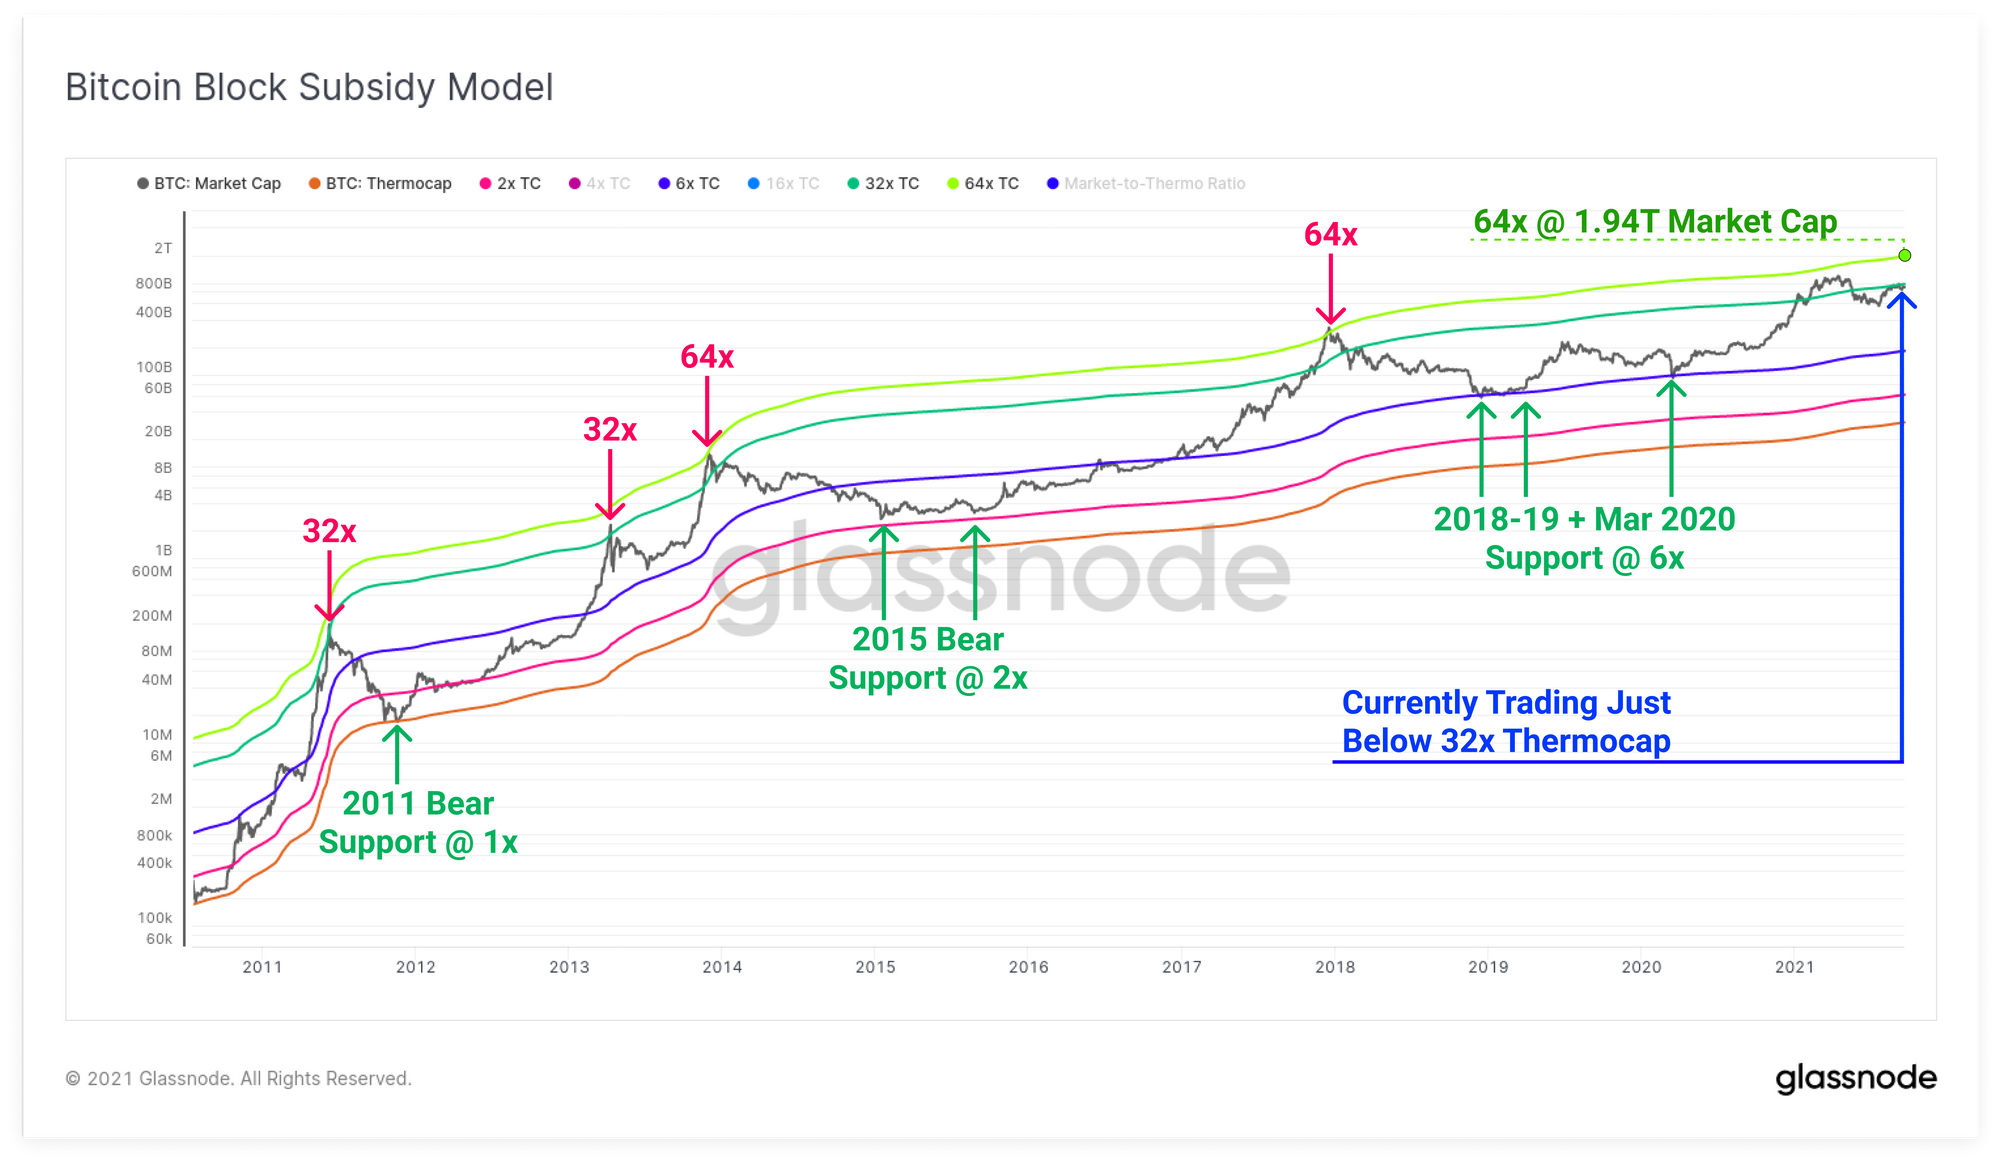
We can take this concept one step further using the Workbench tool, to construct Bitcoin's block subsidy model (originally developed by the newest addition to the Glassnode analyst team, @permabullnino).
Here we calculate multiples on the Thermocap (2x, 6x, 32x and 64x) to reflect a growing monetary premium of the Bitcoin network above its aggregate cost of production. We can spot some interesting behaviours:
- Each cycle adds to the minimum monetary premium at the end of bear markets. The raw Thermocap (1x) caught the 2011 bear bottom, 2x Thermocap caught the 2015 market, and 6x Thermocap provided support for 2018-19 and March 2020.
- Bull cycle tops have generally peaked between 32x and 64x as the market gets overextended and exceeds the cost of production by large multiples.
At the current prices, the topping model of 64x Thermocap reflects a Bitcoin market cap of $1.94 Trillion ($103k BTC price). Bitcoin is currently trading just slightly under the 32x Thermocap model, which is located at $969B.
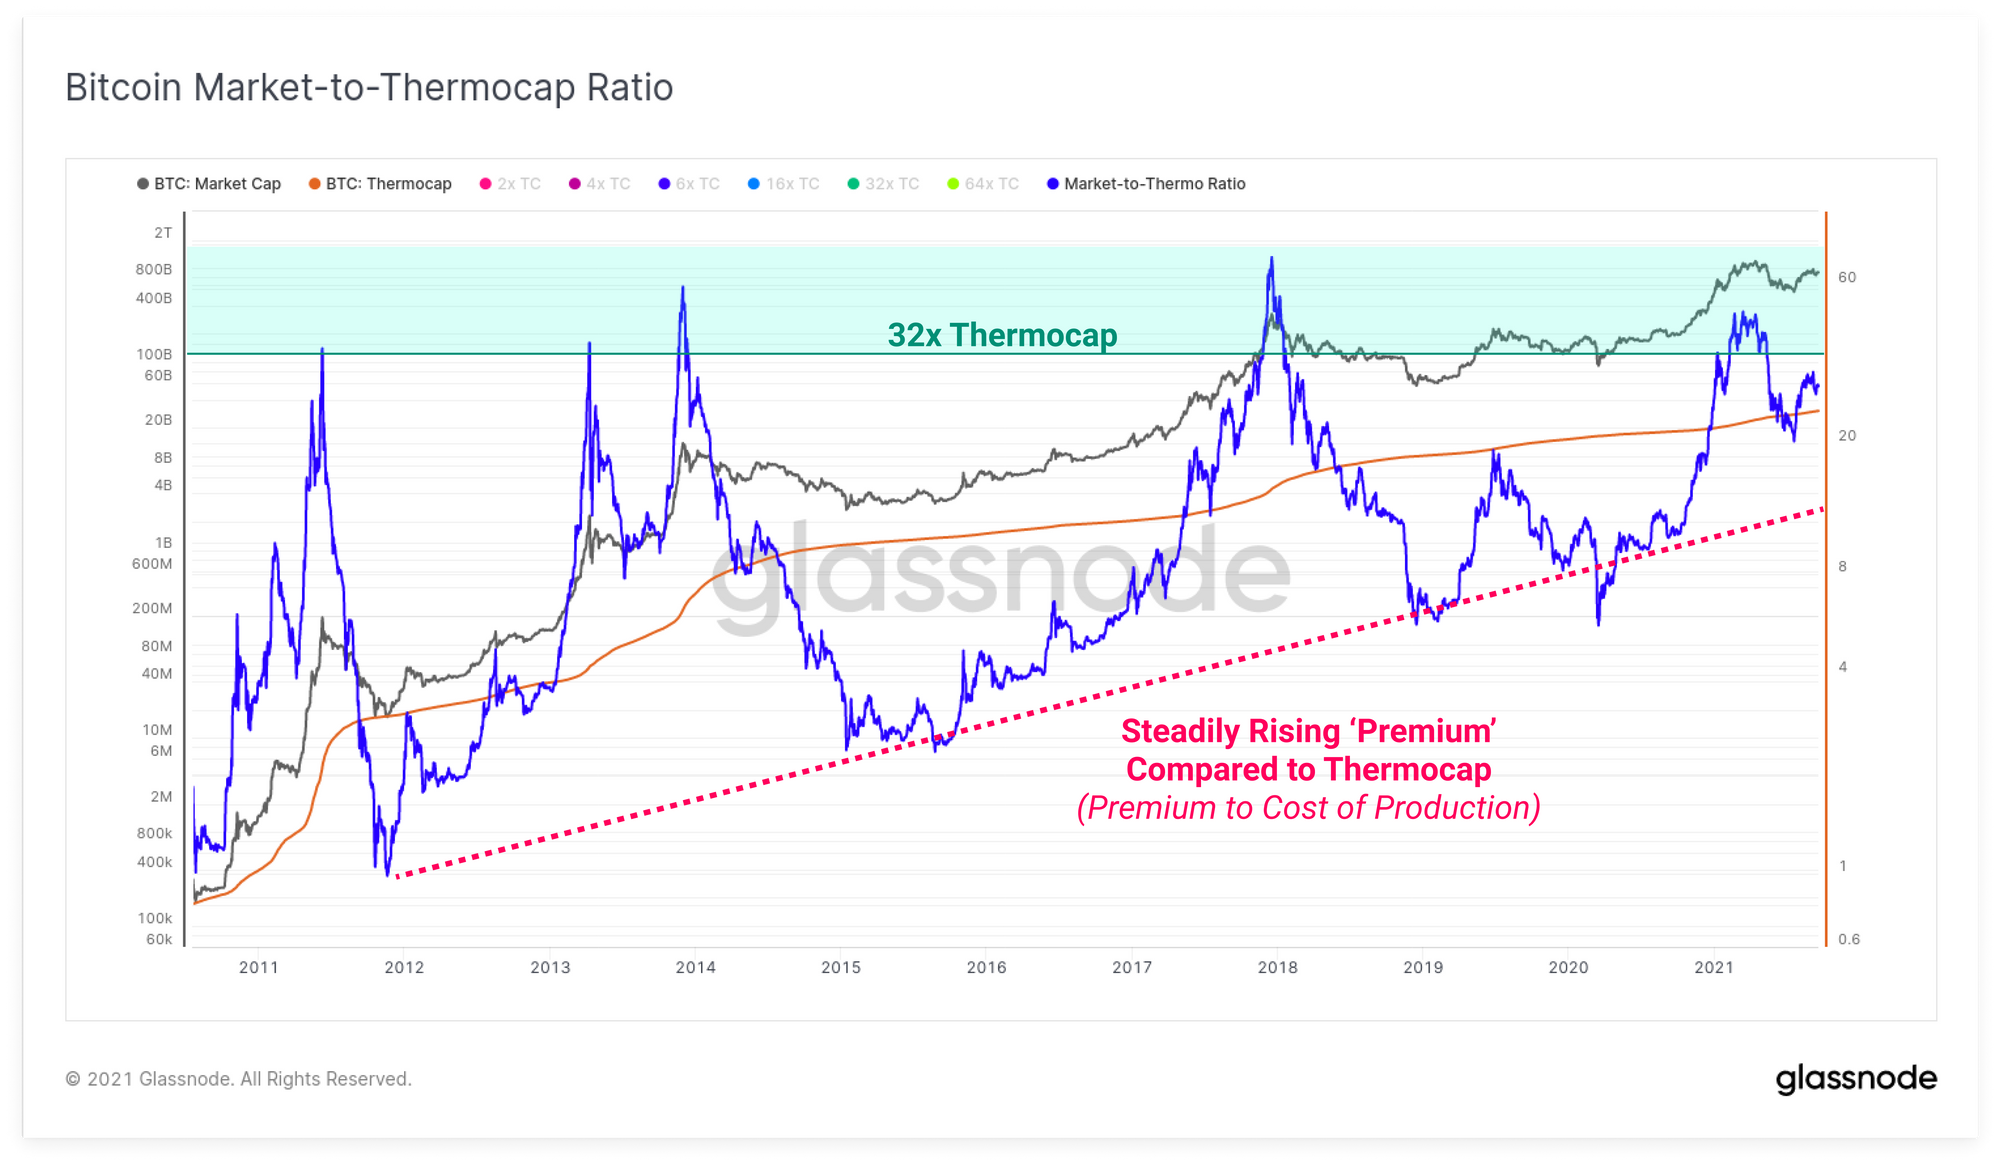
Finally, we can observe this phenomena by taking the ratio between the market cap and the Thermocap. This oscillator reflects the changing magnitude of Bitcoins monetary premium relative to its aggregate cost of production.
We can see the aforementioned steadily rising floor value, or 'minimum monetary premium' reached at the lows of each market cycle. The peak of bullish market cycles can also be seen to top out at relatively consistent levels exceeding 32x the Thermocap model.
Product Updates
Metrics and Assets
- Released tutorial video for Workbench.
- Released Futures Annualized Rolling Basis (3M)
- Additional Workbench functions added
cumsum(m1, since)

- Lesen Sie diesen Artikel jetzt auf Deutsch bei unserem offiziellen Partner Bitcoin2Go
- Follow us and reach out on Twitter
- Join our Telegram channel
- For on–chain metrics and activity graphs, visit Glassnode Studio
- For automated alerts on core on–chain metrics and activity on exchanges, visit our Glassnode Alerts Twitter