The Week On-Chain (Week 39, 2020)
BTC has mostly recovered after dropping rapidly on Monday in response to the stock market. While its fundamentals remain strong, its correlation with traditional markets is limiting price growth.


Bitcoin Market Health
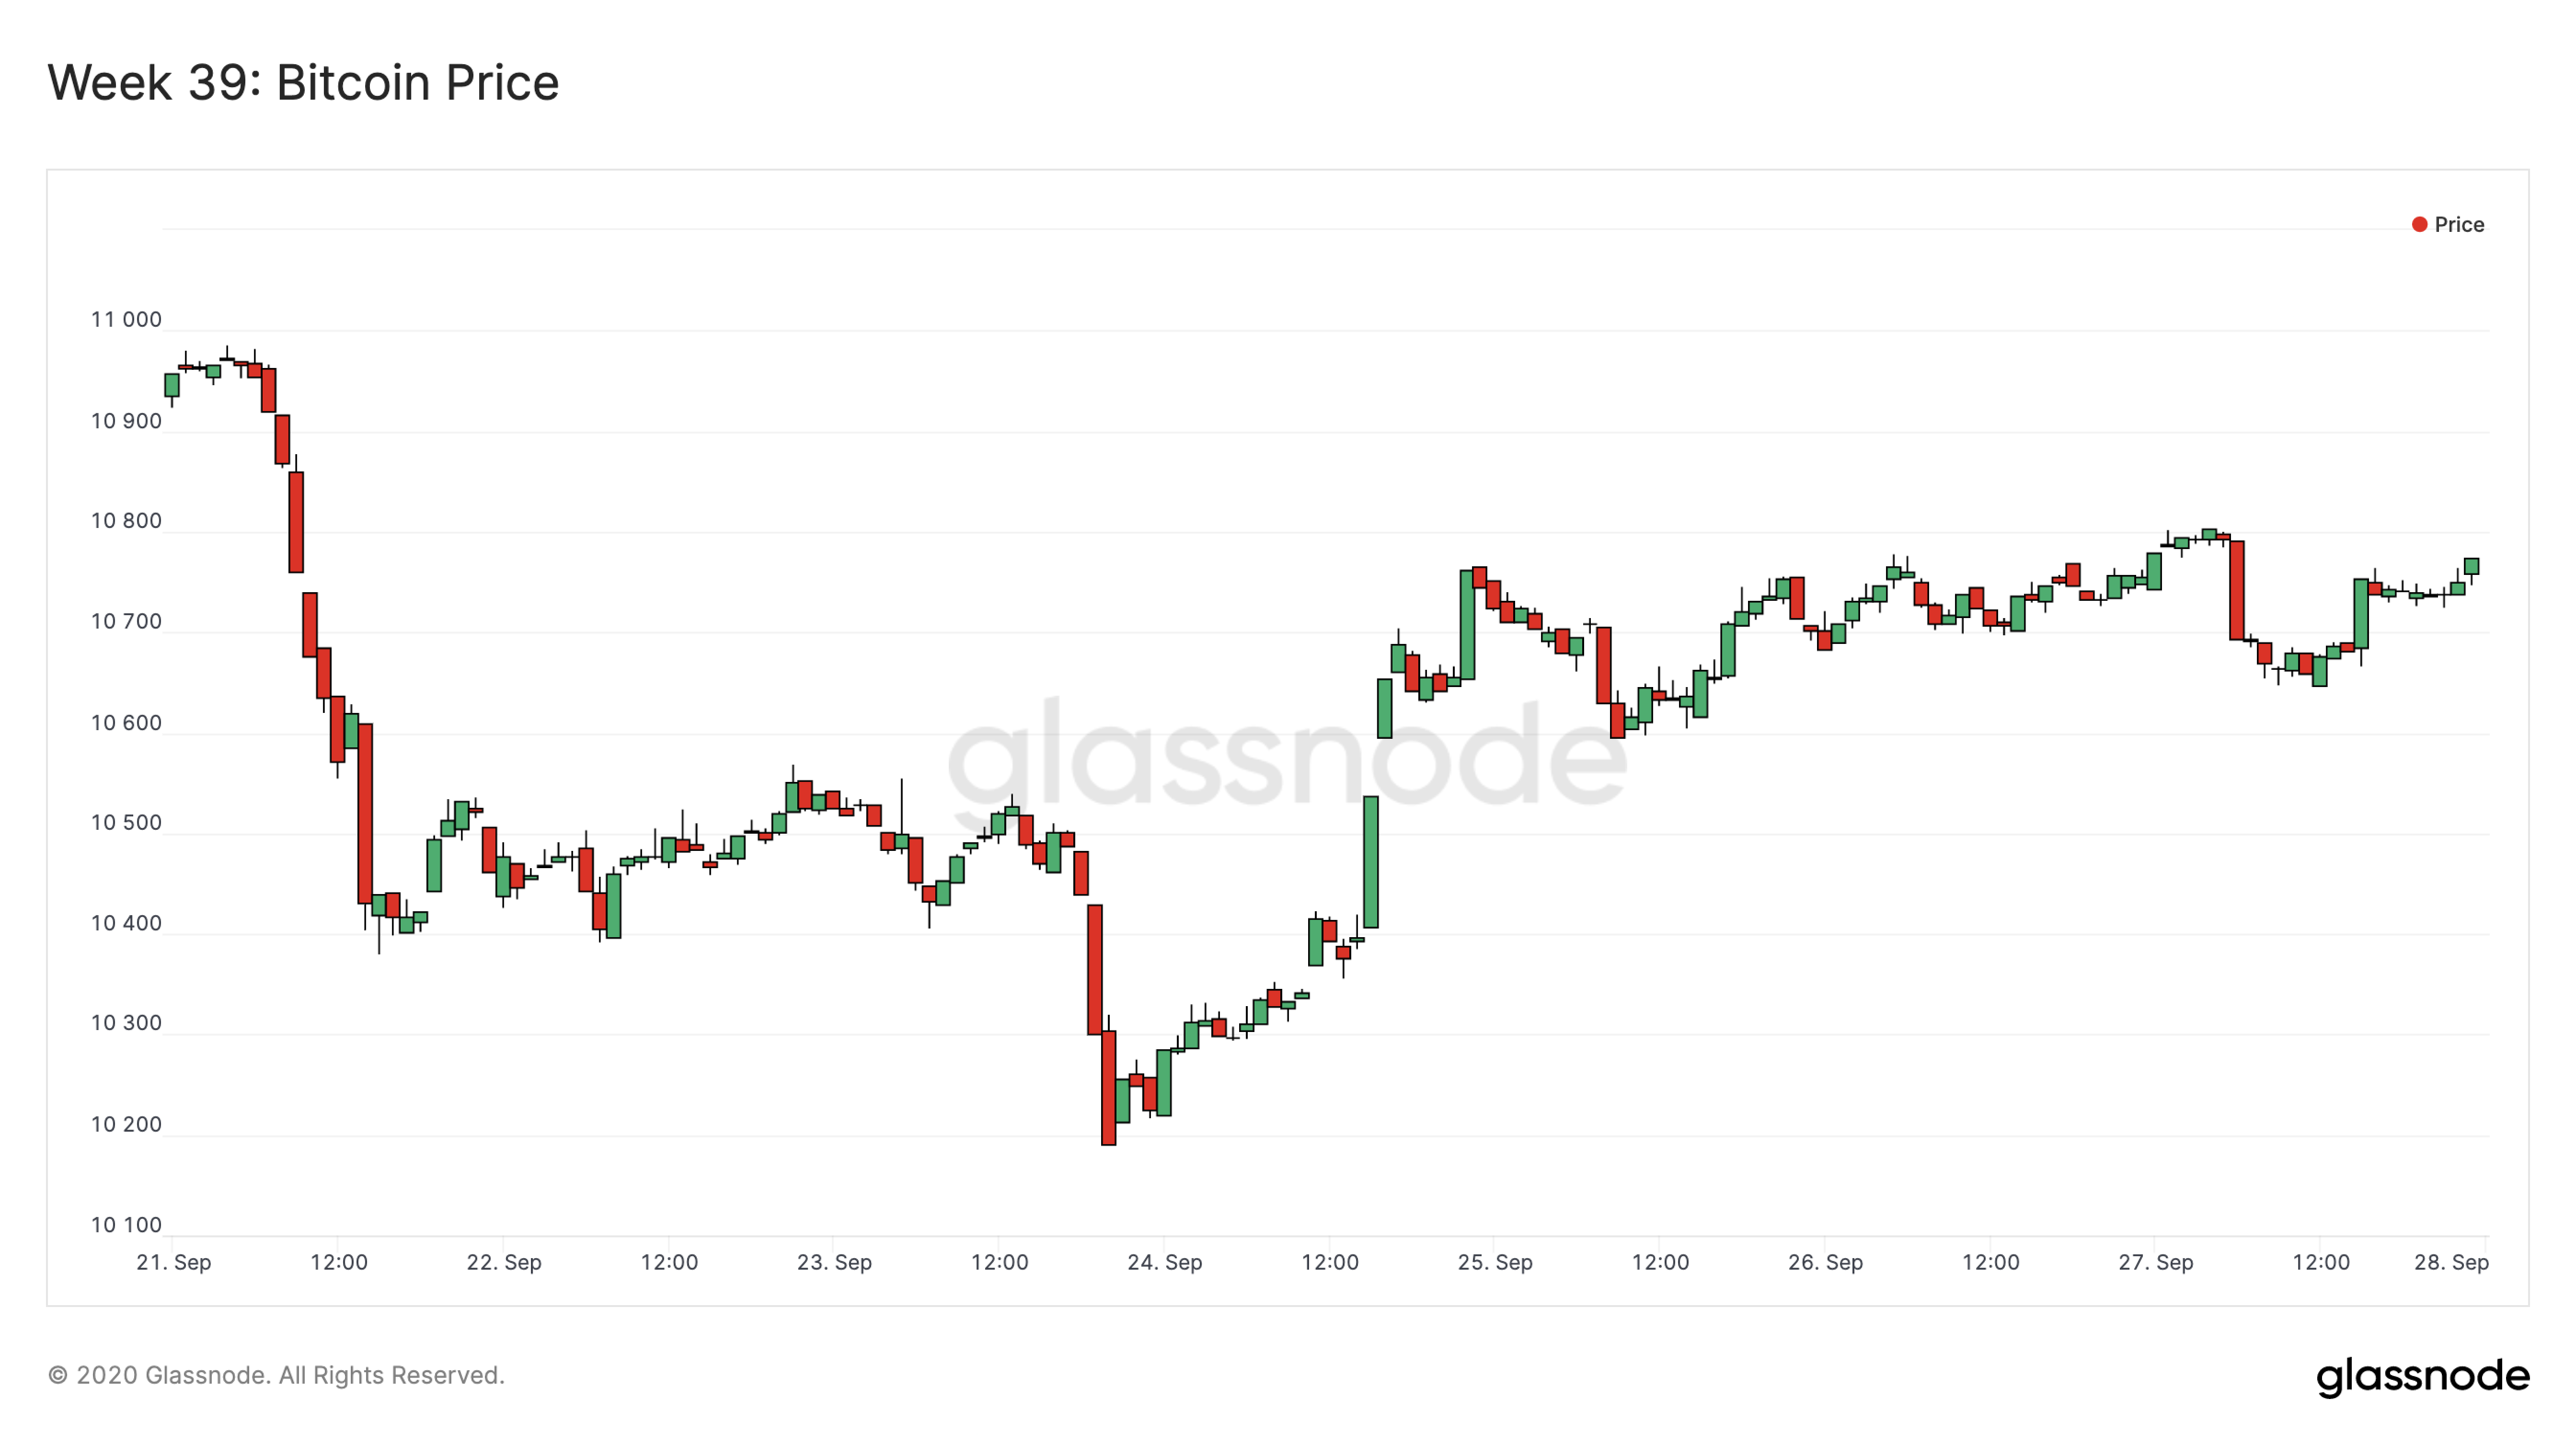
Bitcoin started Week 39 at a price of $10,895, but dropped rapidly on Monday morning - along with the rest of the crypto market - in response to a decline in stock prices. However, it recovered later in the week, ending at a price of $10,740.
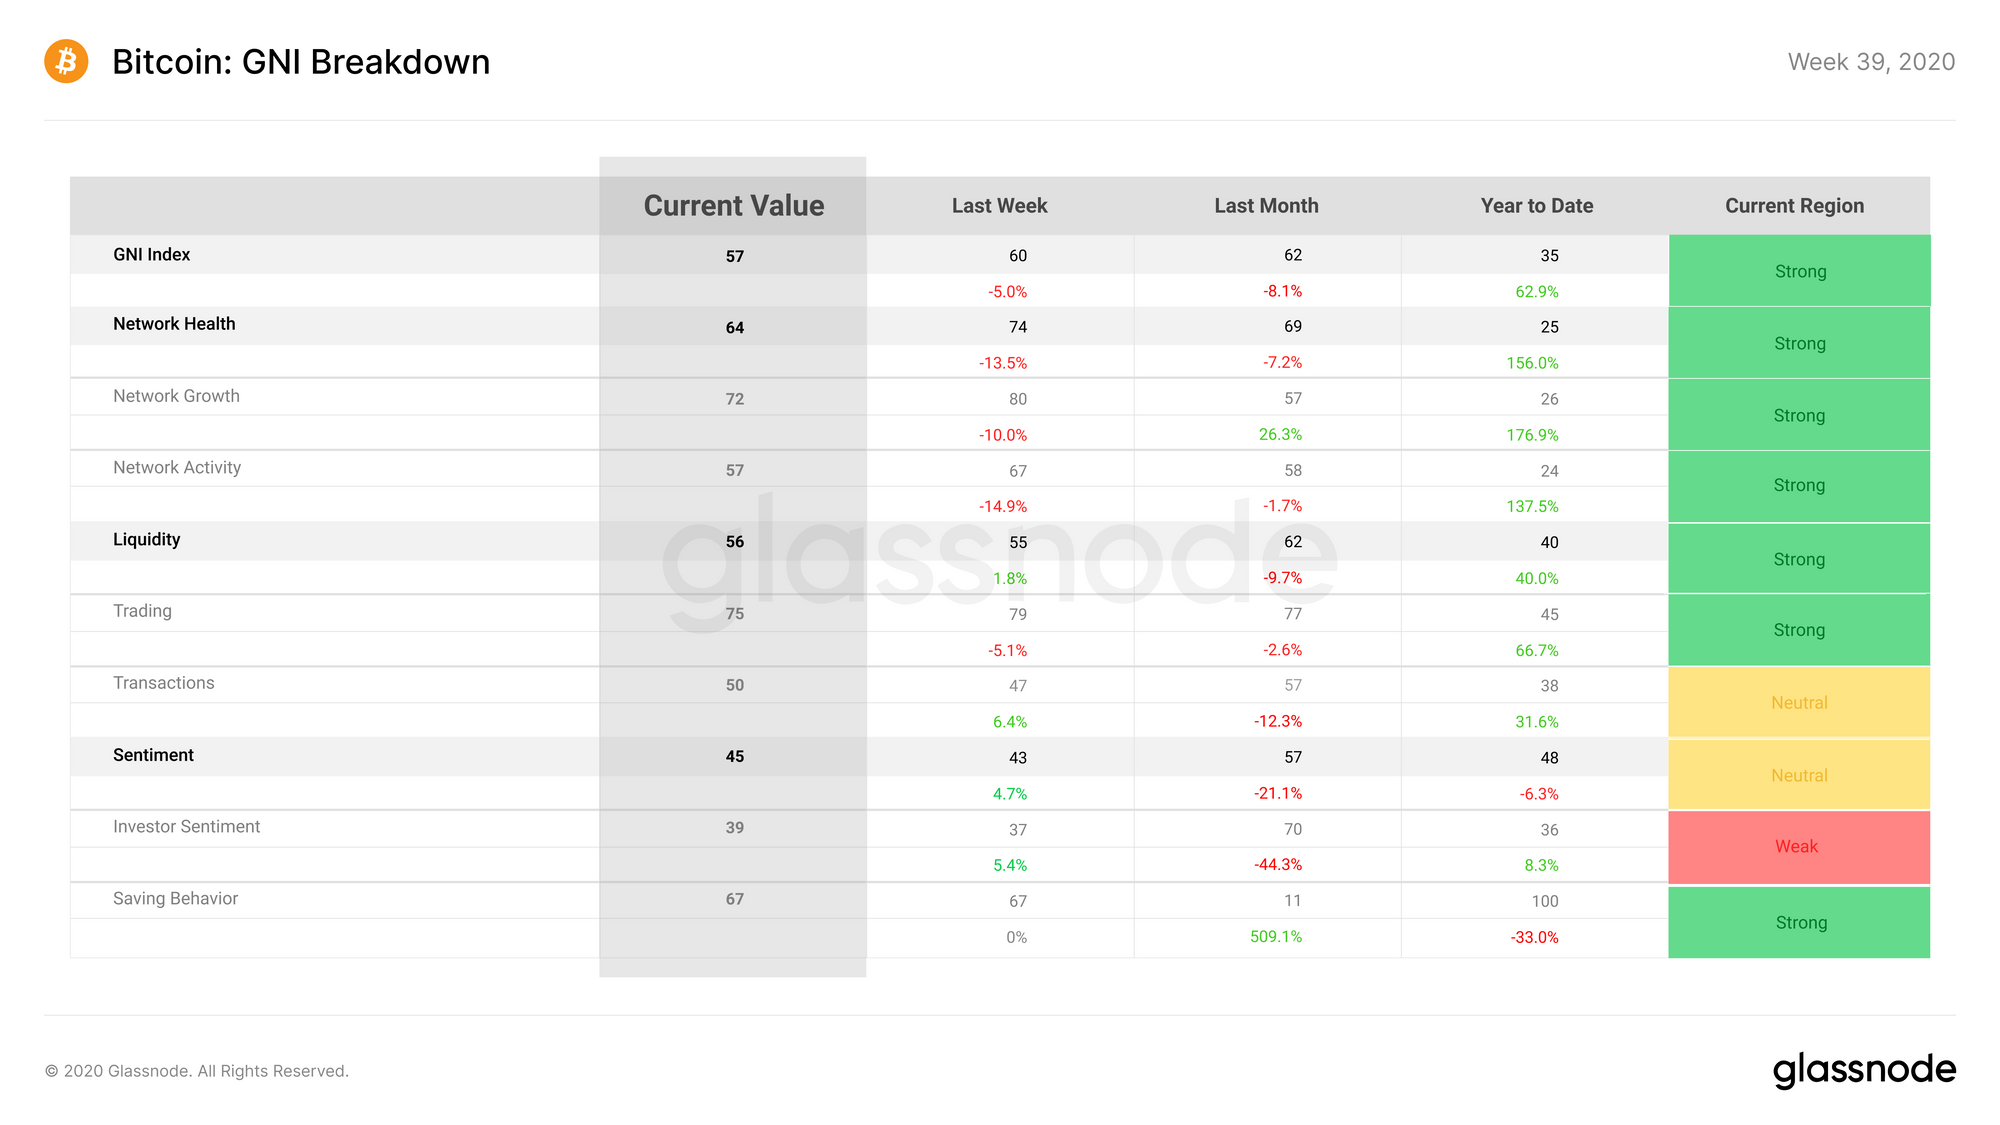
Bitcoin on-chain fundamentals decreased slightly during Week 39. GNI lost 3 points, ending the week at a score of 57. The main reason for this drop was a decline in the Network Health subindex, which lost 10 points over the week, while Liquidity and Sentiment both saw modest gains.
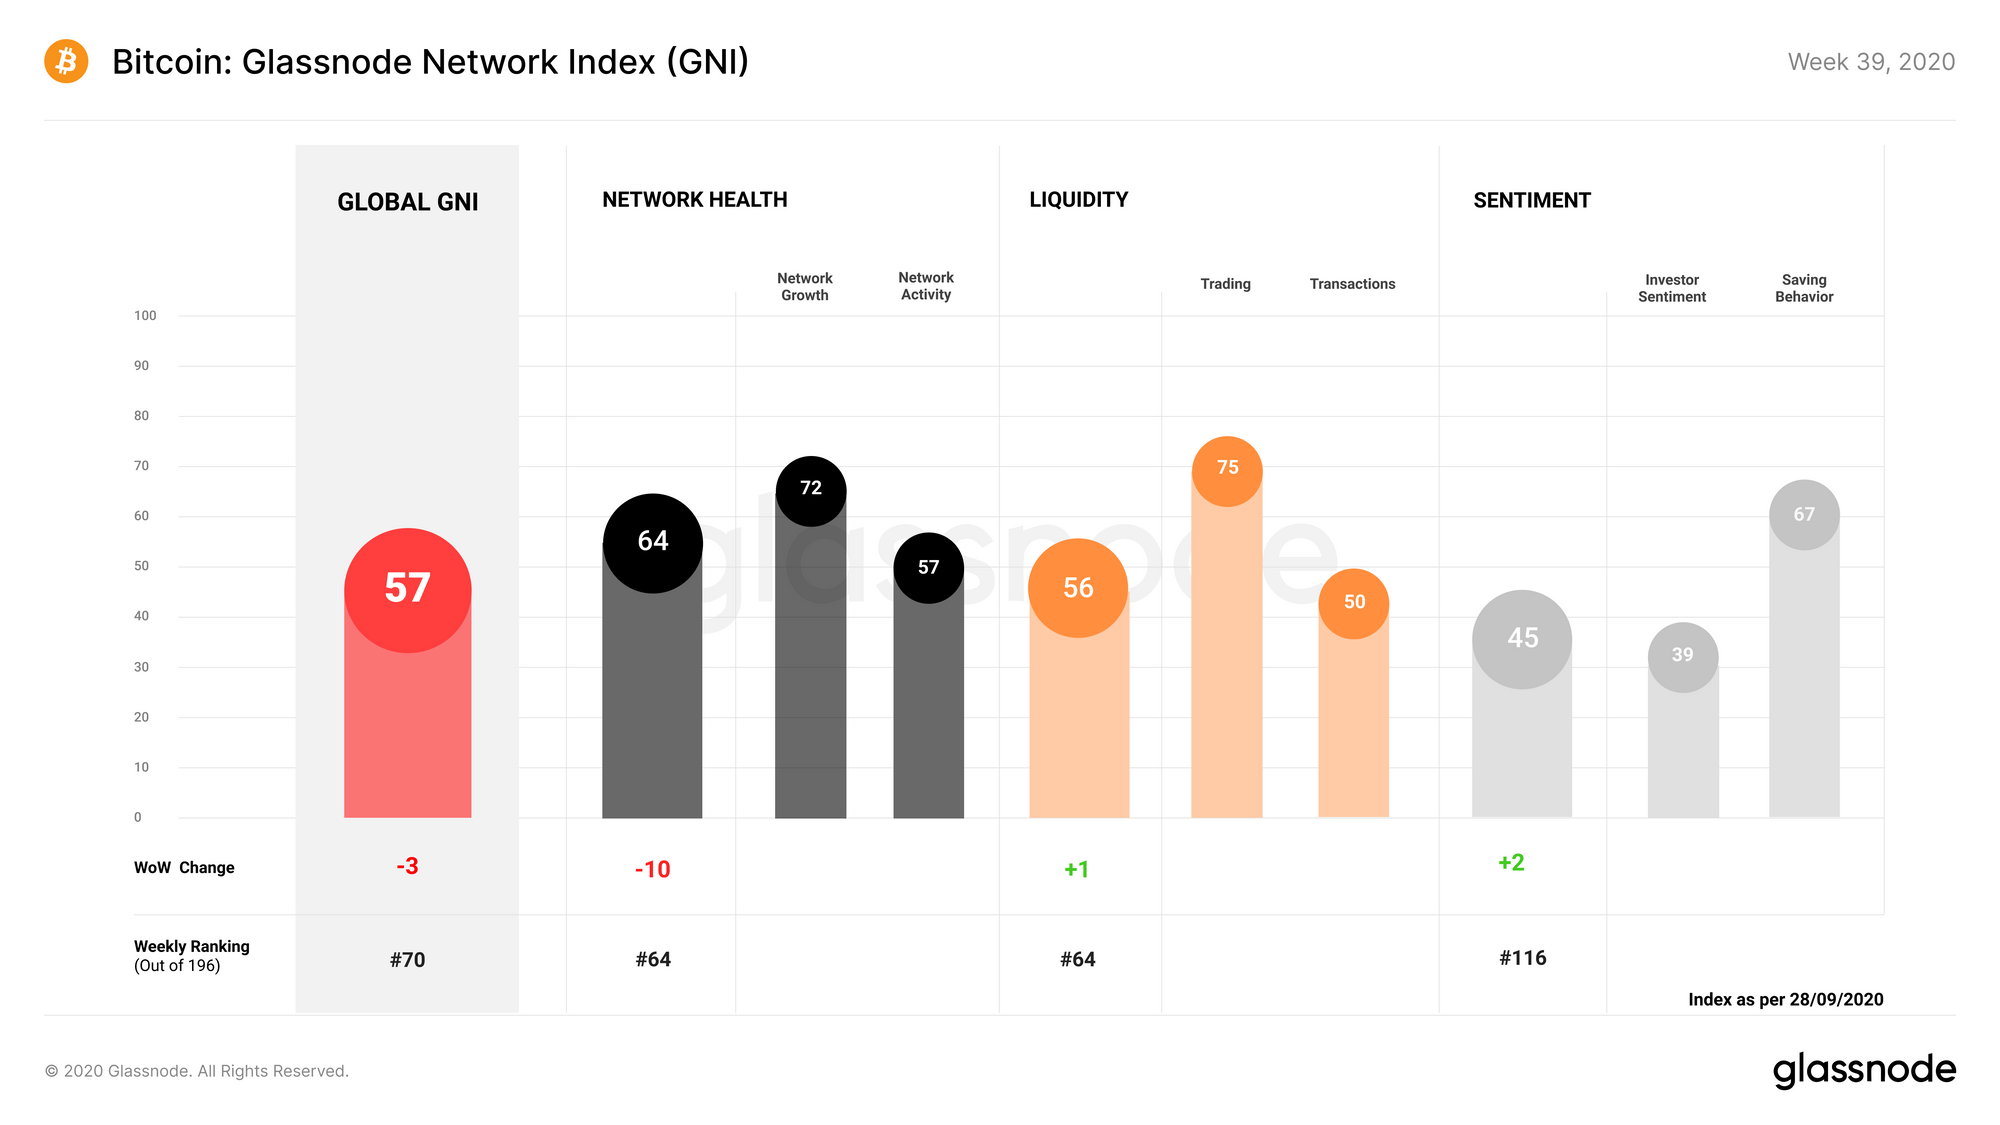
Network Health dropped from a score of 74 to 64 points over Week 39, decreasing by 13.5%. The network growth subcategory lost 8 points due to a decline in the number of new users joining the Bitcoin network. Meanwhile, network activity dropped by 10 points as the number of BTC transactions also fell.
Liquidity increased slightly throughout the week, gaining 1 point and re-entering the strong zone at 56 points. While trading liquidity decreased due to lower exchange deposits, transaction liquidity rose due to an increase in the volume of BTC transferred on-chain.
Sentiment saw a 2 point increase for Week 39, bringing it to a total of 45 points. This was driven by a rise in the investor sentiment subcategory, which itself rose due to an increase in bitcoin's MVRV ratio and STH-SOPR. In other words, on average, short-term BTC holders sold at a profit toward the end of the week, whereas at the beginning of the week they were selling at a loss.
Glassnode Compass
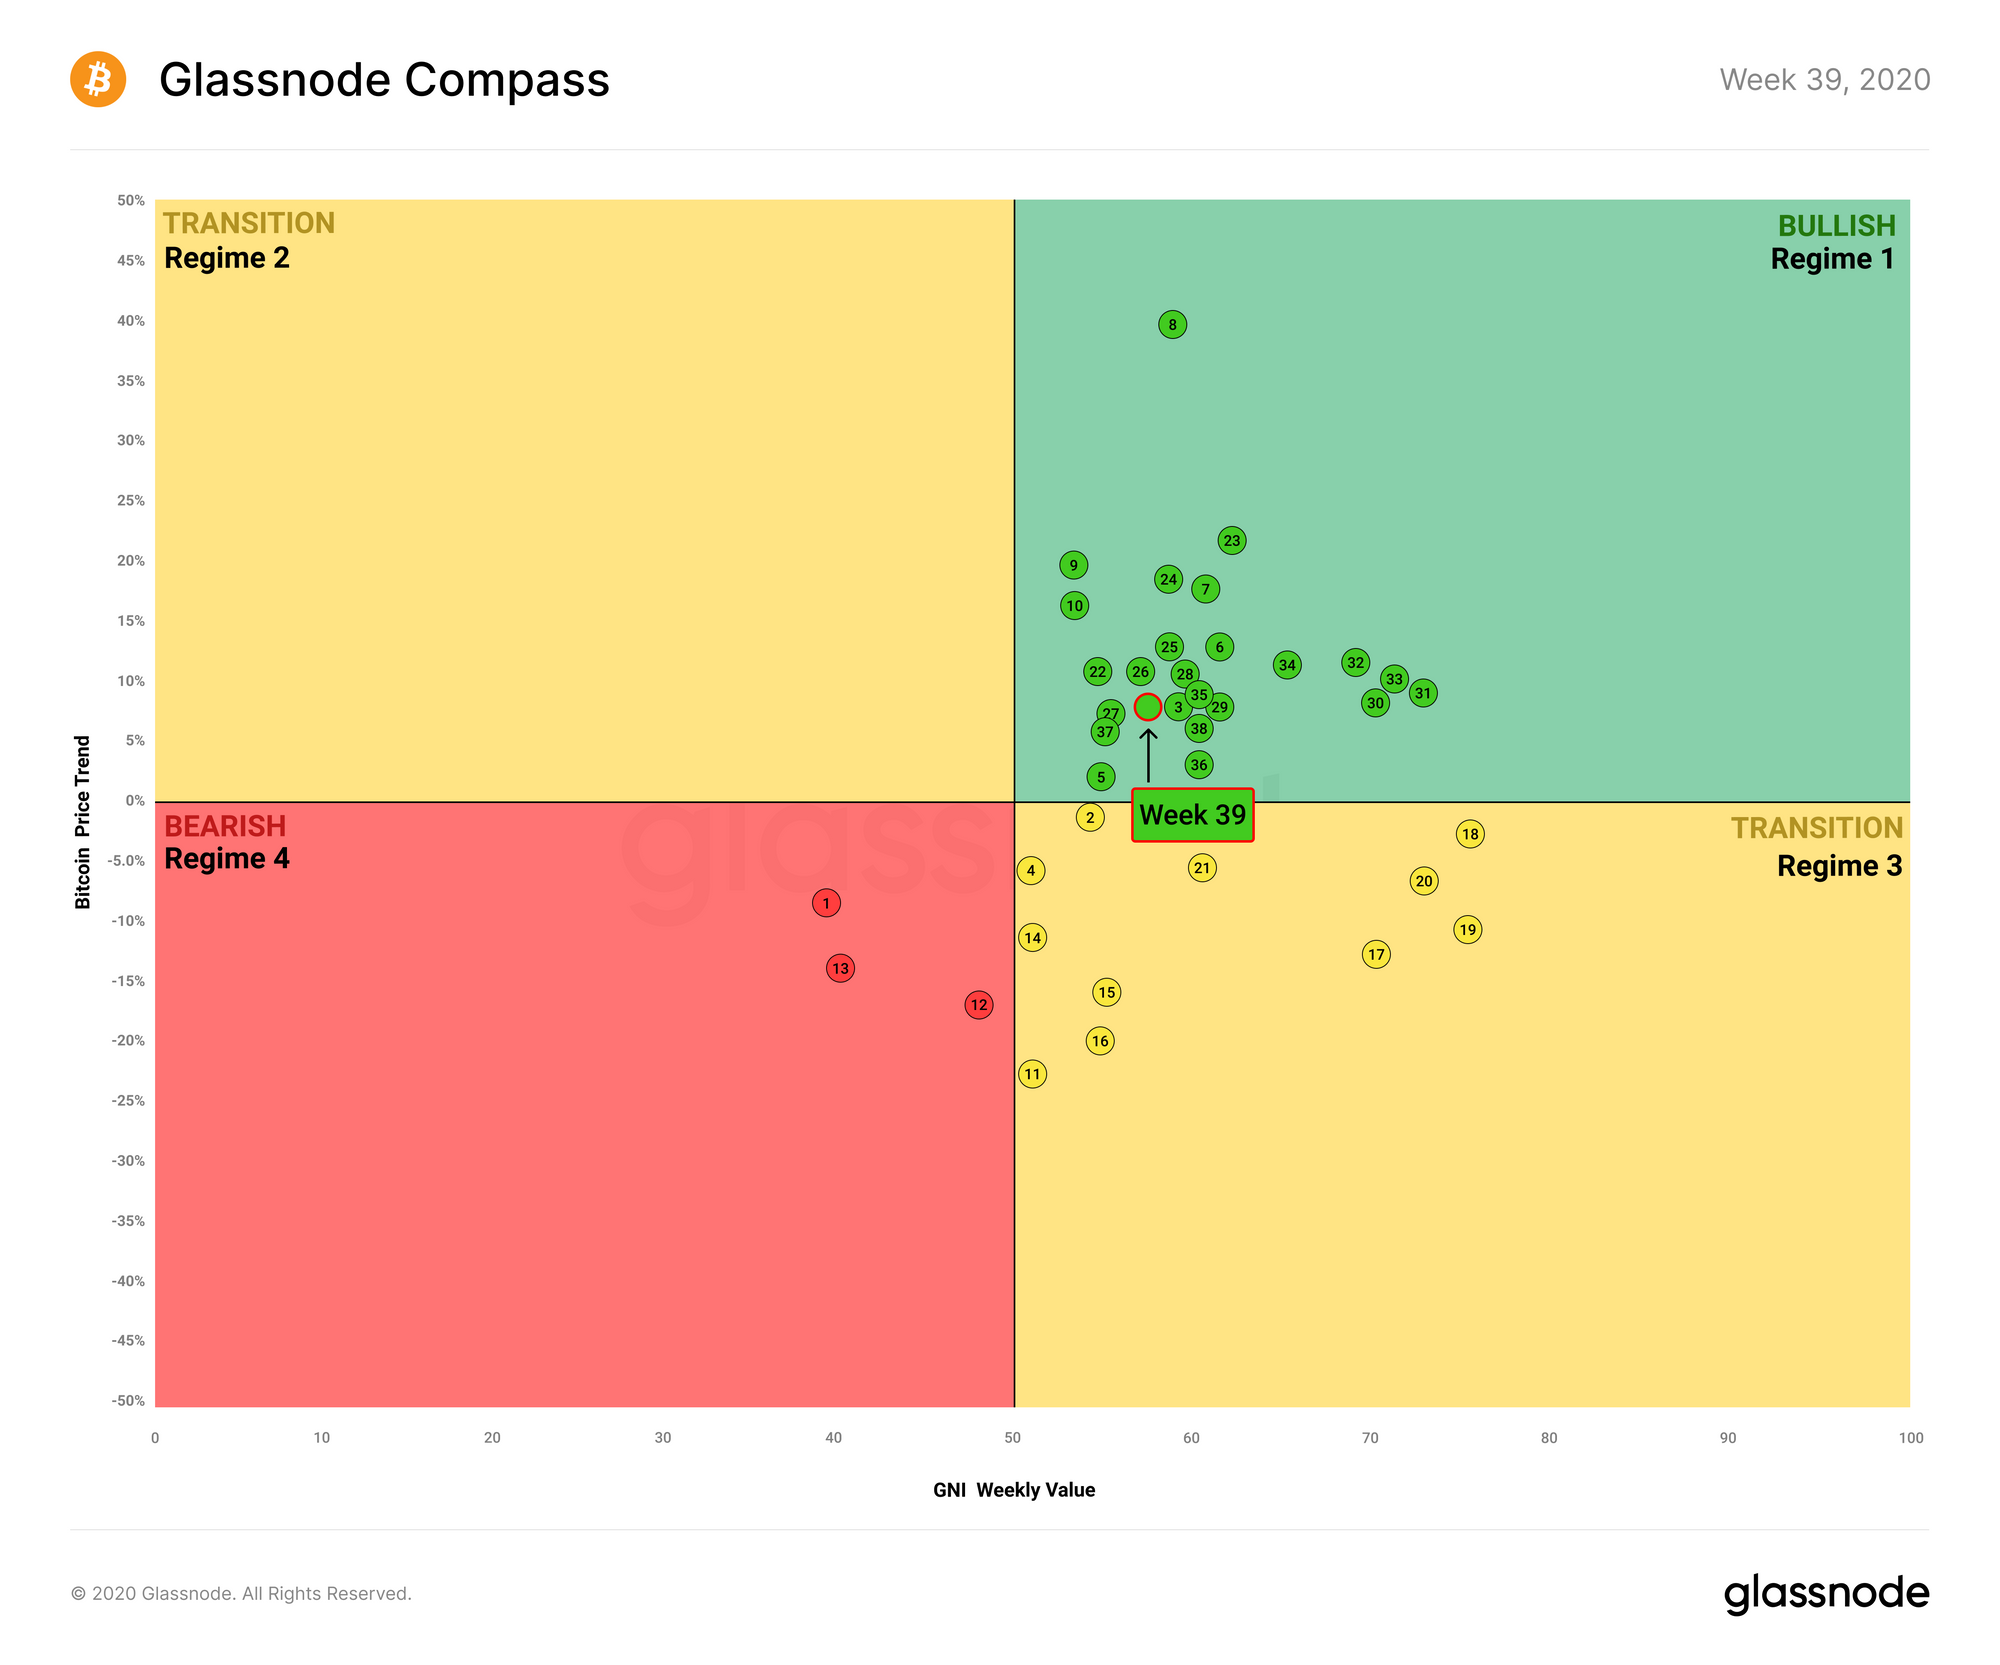
Yet again, the bitcoin compass stayed in the bullish Regime 1, marking its 18th consecutive week in the green zone and indicating healthy fundamentals despite the languishing price of BTC.
Bitcoin's recovery after the rapid price drop last Monday tracked the performance of the S&P 500 and other major stock market indices, which also recovered after dropping on Monday.
As we have mentioned in previous issues of this newsletter, BTC and other cryptoassets have seen continued correlation with stocks throughout 2020, with Week 39 following this same trend once again.
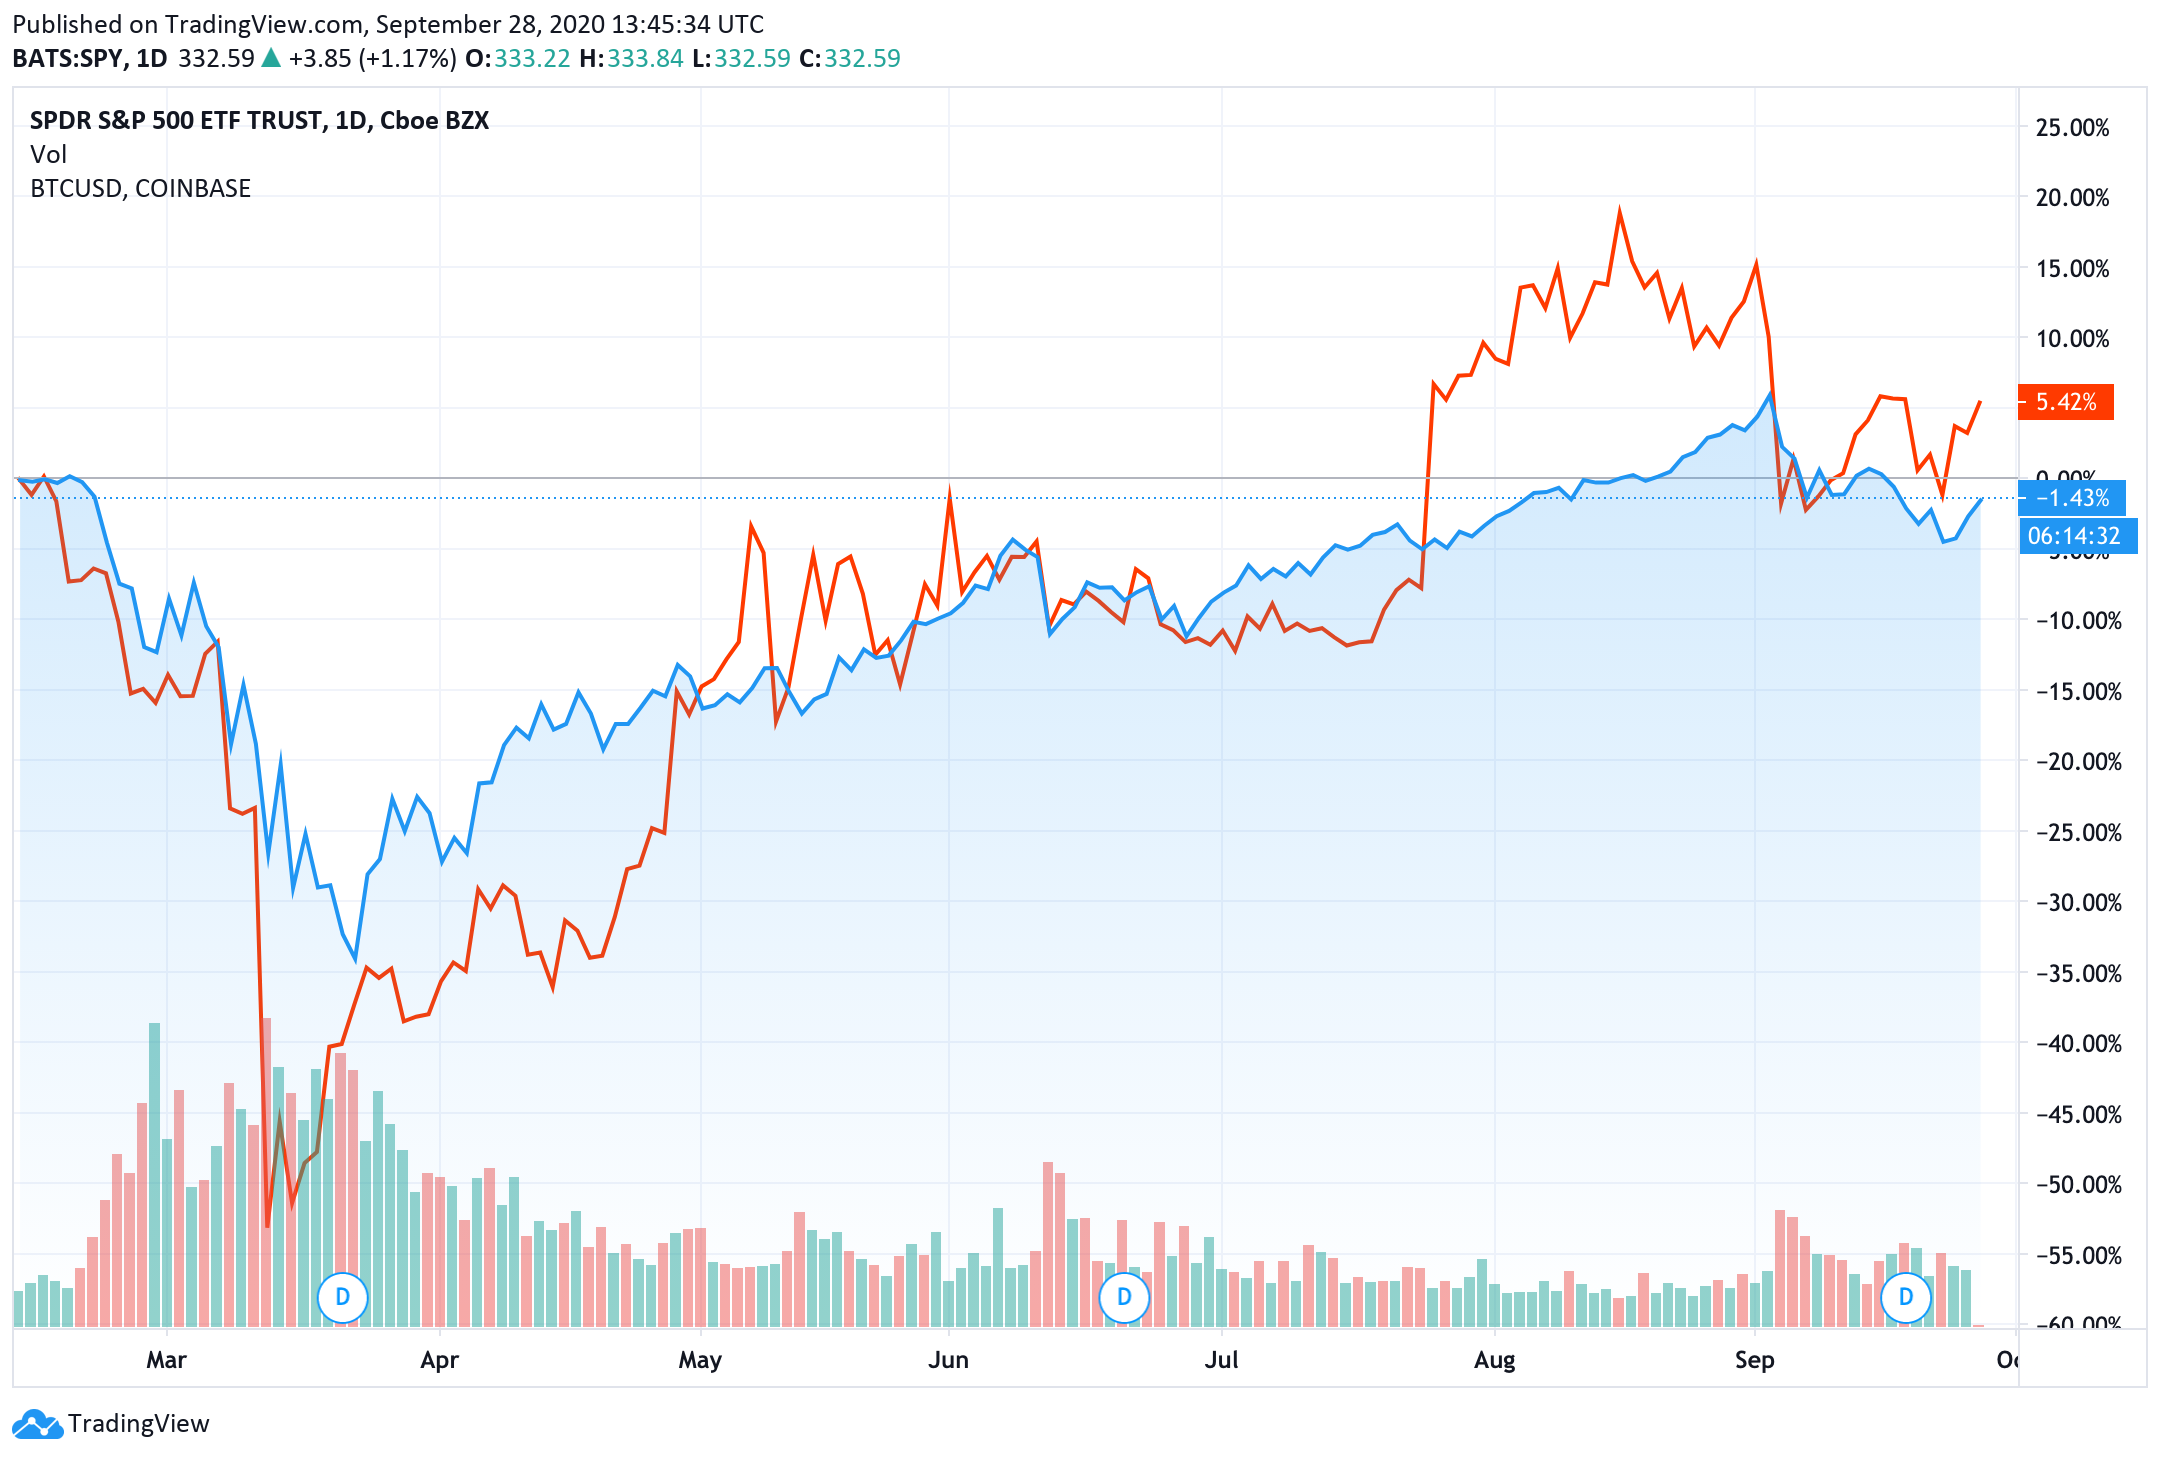
This correlation can be explained by BTC's increasing popularity among "traditional" investors, including large-scale institutions. Bitcoin's trend toward becoming a more mainstream asset partially explains its failure to sustainably break out above $11,000 despite strong on-chain fundamentals.
However, as demand from the traditional financial world continues to grow, BTC's limited supply should act in its favor, driving the price gradually higher.
Altcoin Digest
Performance against BTC
The top altcoins saw mixed performance against BTC throughout Week 39. LINK moved ahead by 11.1% after losing significant value during the previous couple of weeks. BNB also gained value next to BTC, pushing it to the the rank of the 6th most valuable cryptoasset.
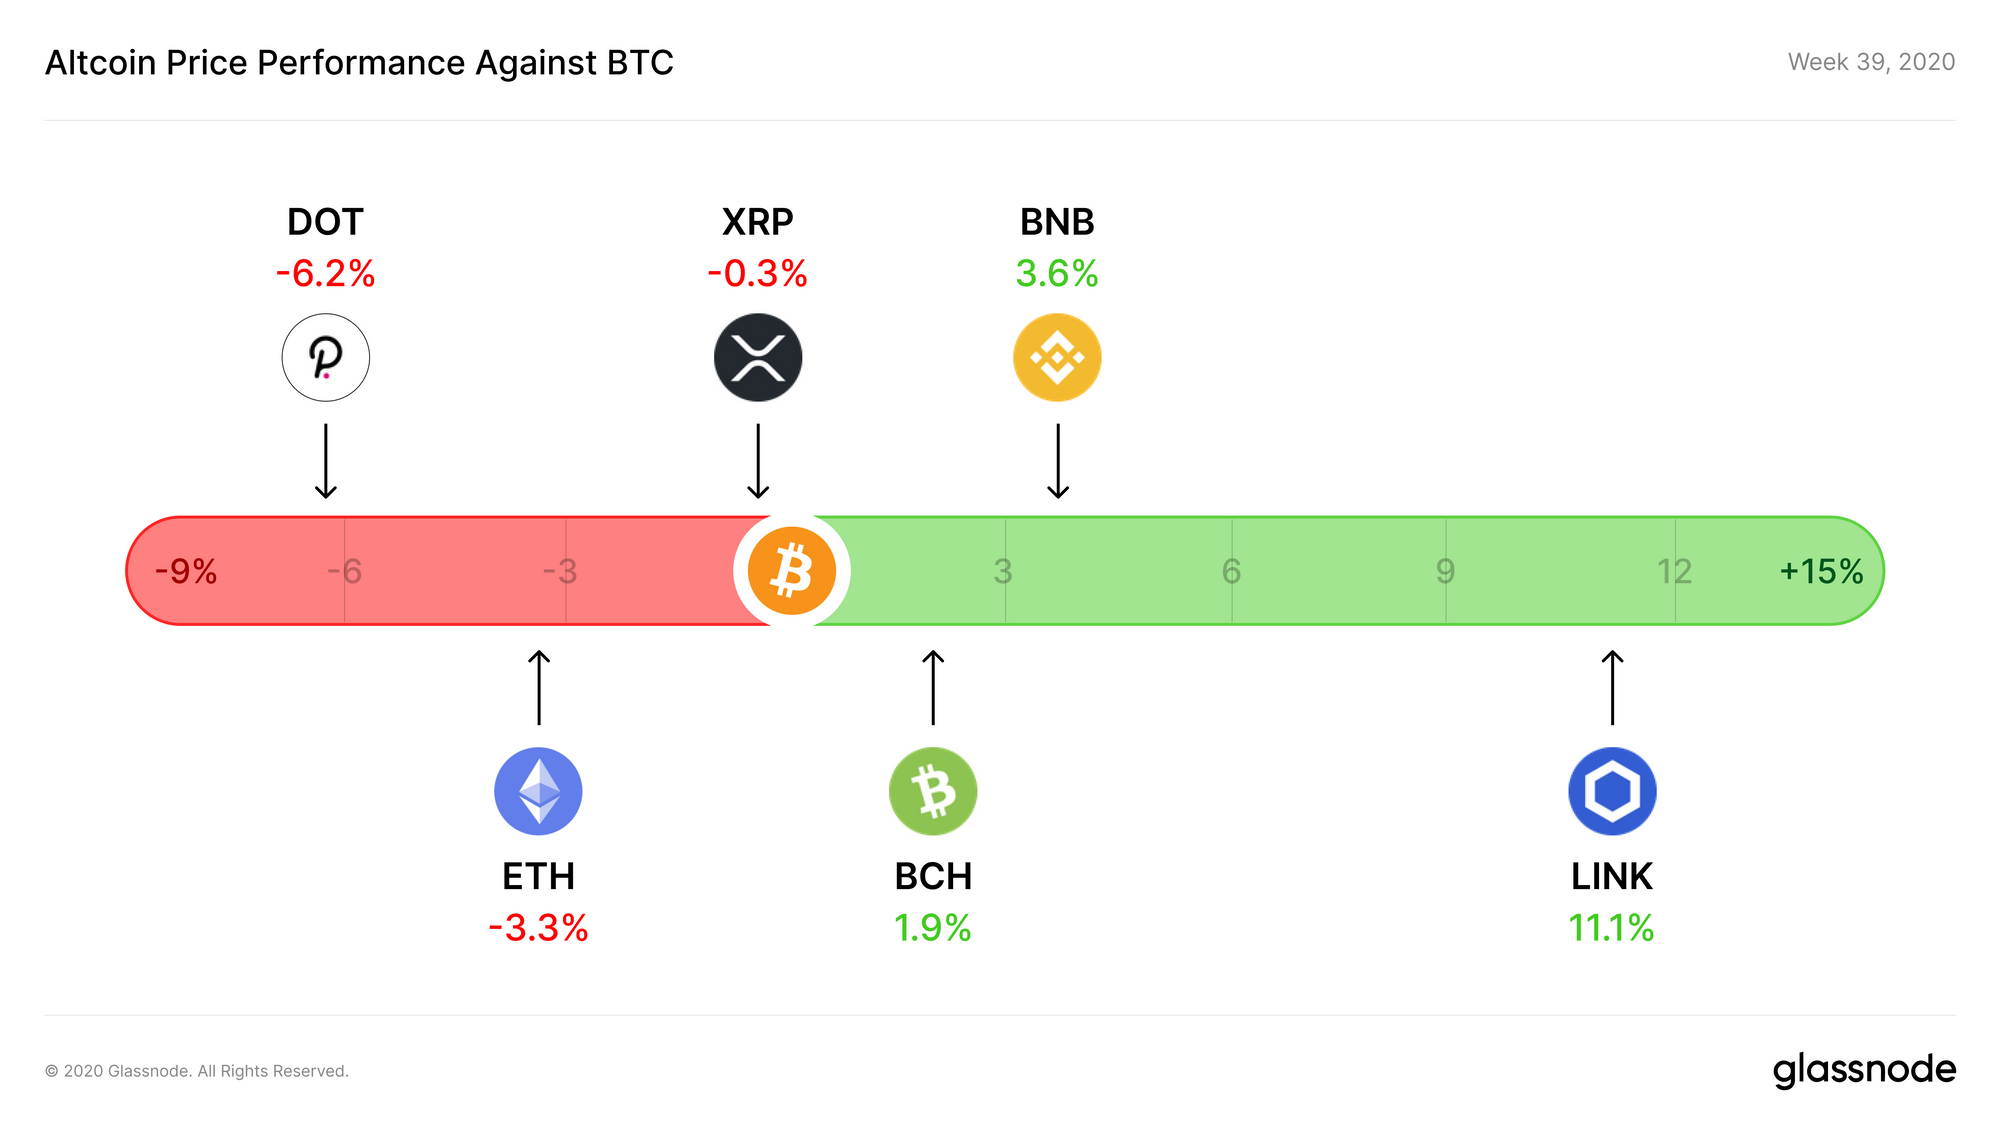
Meanwhile, DOT lost 6.2% of its value next to BTC, and ETH lost 3.3%, recovering from Monday's drop more slowly than bitcoin.
Performance against USD
Despite last Monday's sudden dip, the top coins didn't perform too badly for the week, mostly recovering from the drop. Unfortunately for Litecoin, the rise of BNB, ADA and BSV pushed LTC into 12th place, removing it from our weekly chart.
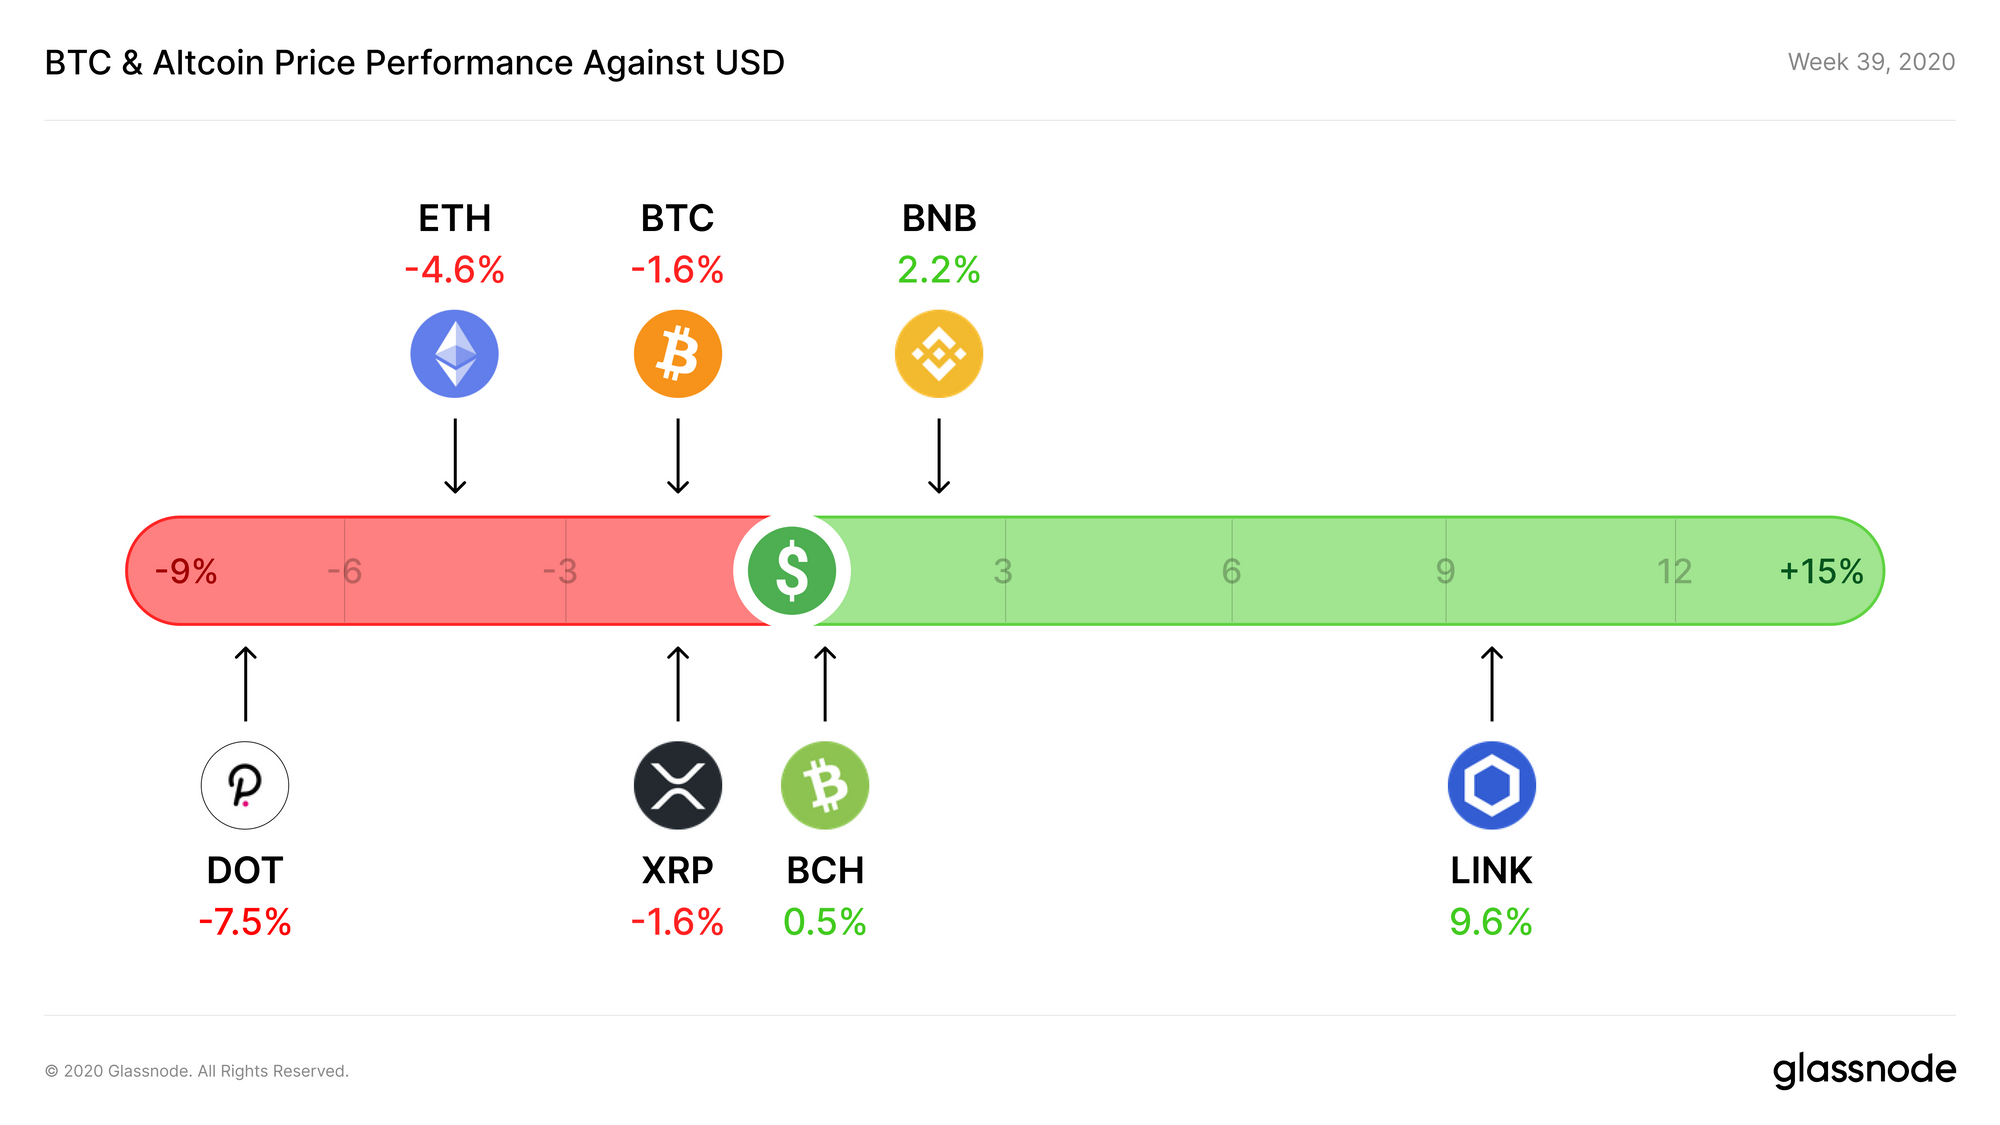
Similarly, DOT slipped significantly in the rankings, losing 7.5% of its value and dropping from its earlier position of 5th/6th down to 8th. At the same time, BNB overtook LINK to become the 6th most valuable cryptoasset.
Which altcoins would you like to see us cover in future editions of The Week On-Chain? Let us know on Twitter.
Active Entities on Bitcoin Network Poised to Reach All-Time High
The number of Active Entities on the Bitcoin network has steadily increased since its drop-off after the 2017/2018 bull market, and looks poised to overtake its previous all-time high in the near future.
Bitcoin's 90-day moving average of Active Entities has already overtaken its previous ATH, signaling a trend toward increasing adoption.
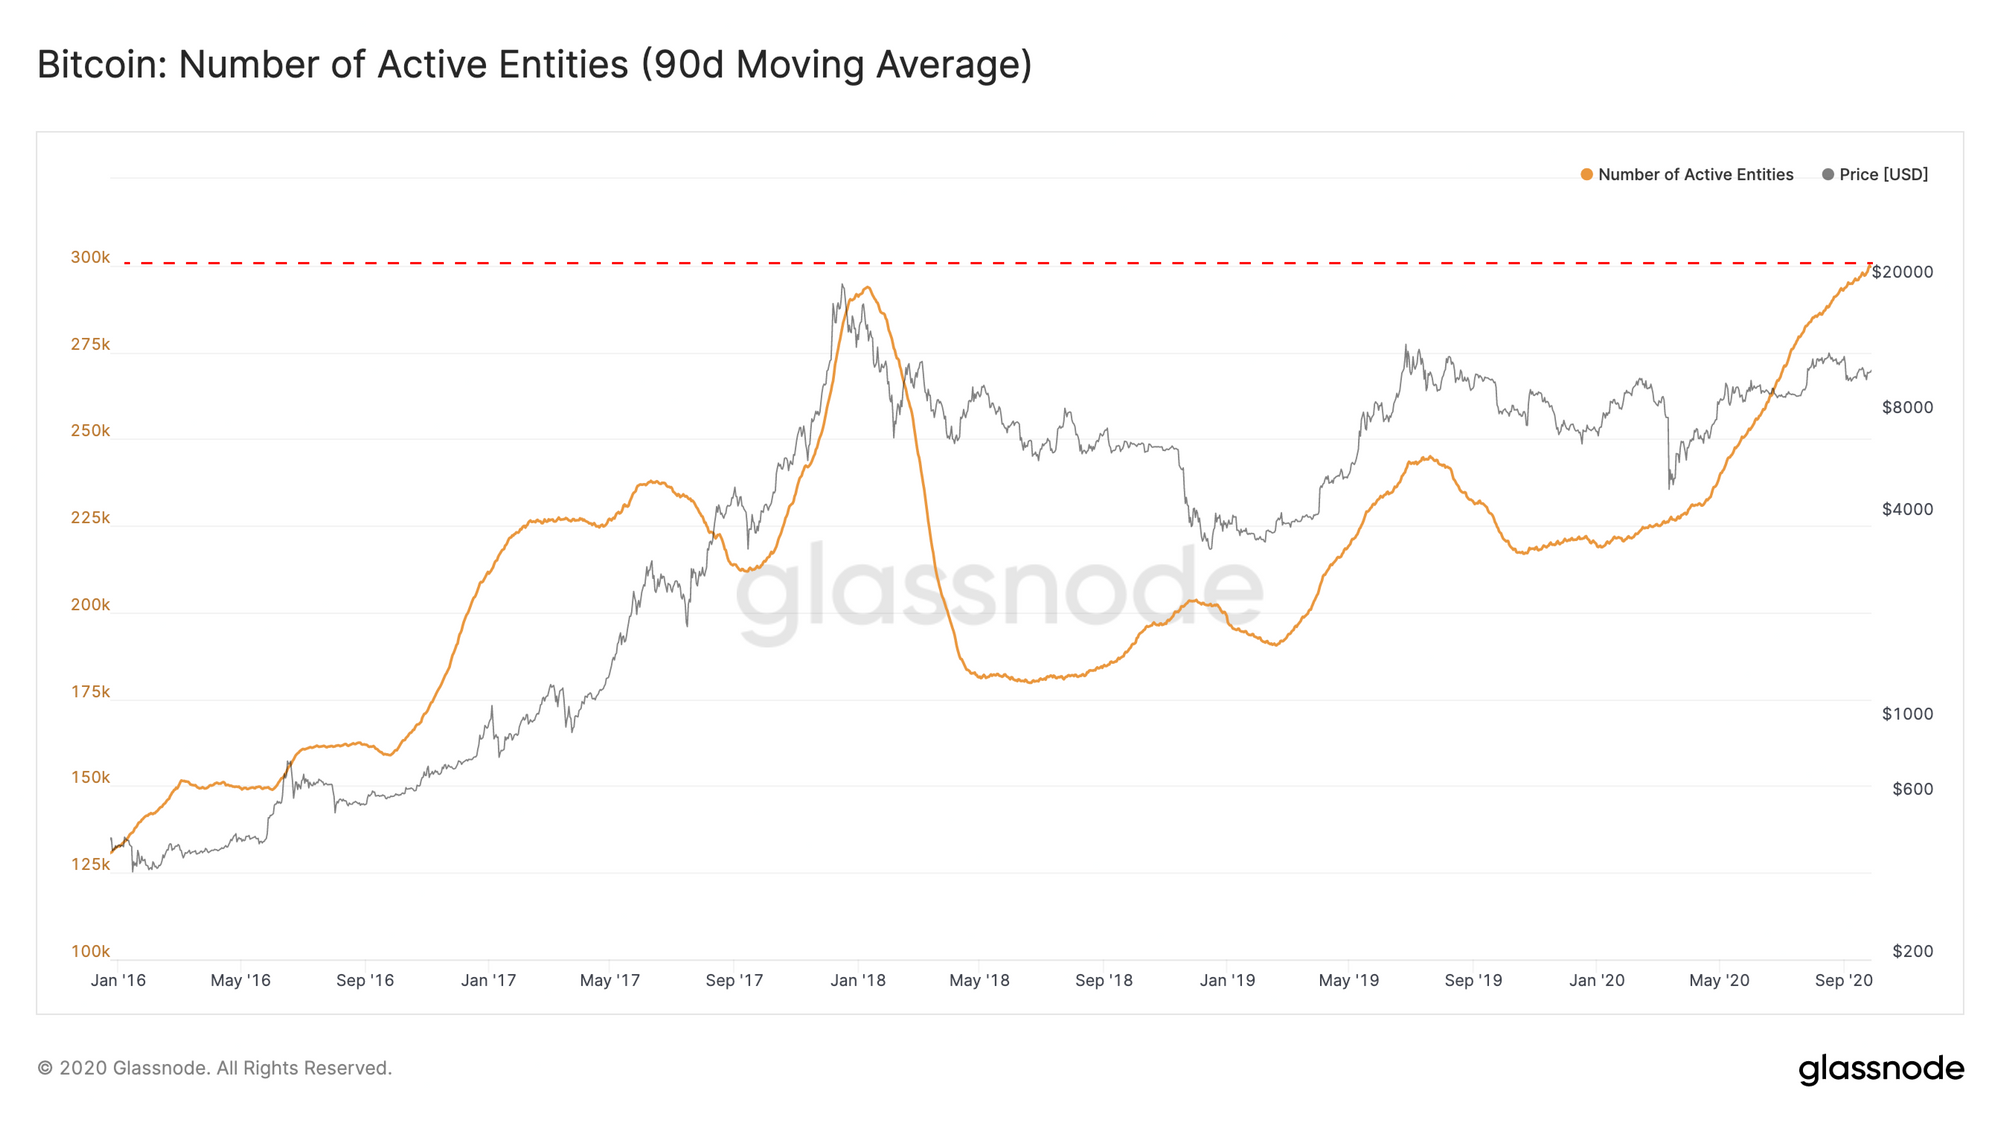
As BTC sees sustained growth in adoption, its limited supply should place upward pressure on price. According to on-chain analyst Willy Woo, this organic growth will also be the driving force behind an eventual decoupling of BTC from the stock markets. If and when this decoupling occurs, bitcoin's strong on-chain fundamentals and large community of dedicated HODLers will finally be reflected in its price.
Product Updates
Metrics and Assets
- Number of Addresses Depositing to Exchanges (BTC, ETH, ERC-20) - The number of unique addresses that appeared as a sender in a transaction sending funds to exchanges.
- Number of Addresses Withdrawing from Exchanges (BTC, ETH, ERC-20) - The number of unique addresses that appeared as a receiver in a transaction receiving funds from an exchanges.

- Follow us and reach out on Twitter
- Join our Telegram channel
- For on–chain metrics and activity graphs, visit Glassnode Studio
- For automated alerts on core on–chain metrics and activity on exchanges, visit our Glassnode Alerts Twitter