Profiling the Sell-Off
The digital asset market has encountered tumultuous waters in recent weeks, with investors experiencing sharp price falls, and locking in substantial losses. The Altcoin space was the worst hit, with a significant decline in valuations. In this report, we analyze the severity of the sell-off.


Executive Summary:
- Bitcoin investors have realized large losses during the downturn, with BTC prices falling as far as $93k.
- When we normalize these losses into a BTC denomination however, the severity of the damage does appear to be in line with other local corrections.
- The majority of the locked in losses originate from the Short-Term Holder cohort, as local top buyers experience a rapid decline in their profitability.
- The Altcoin sector took the heaviest relative losses during the downturn, with the global altcoin market cap experiencing one of its biggest devaluations on record.
A Major Devaluation
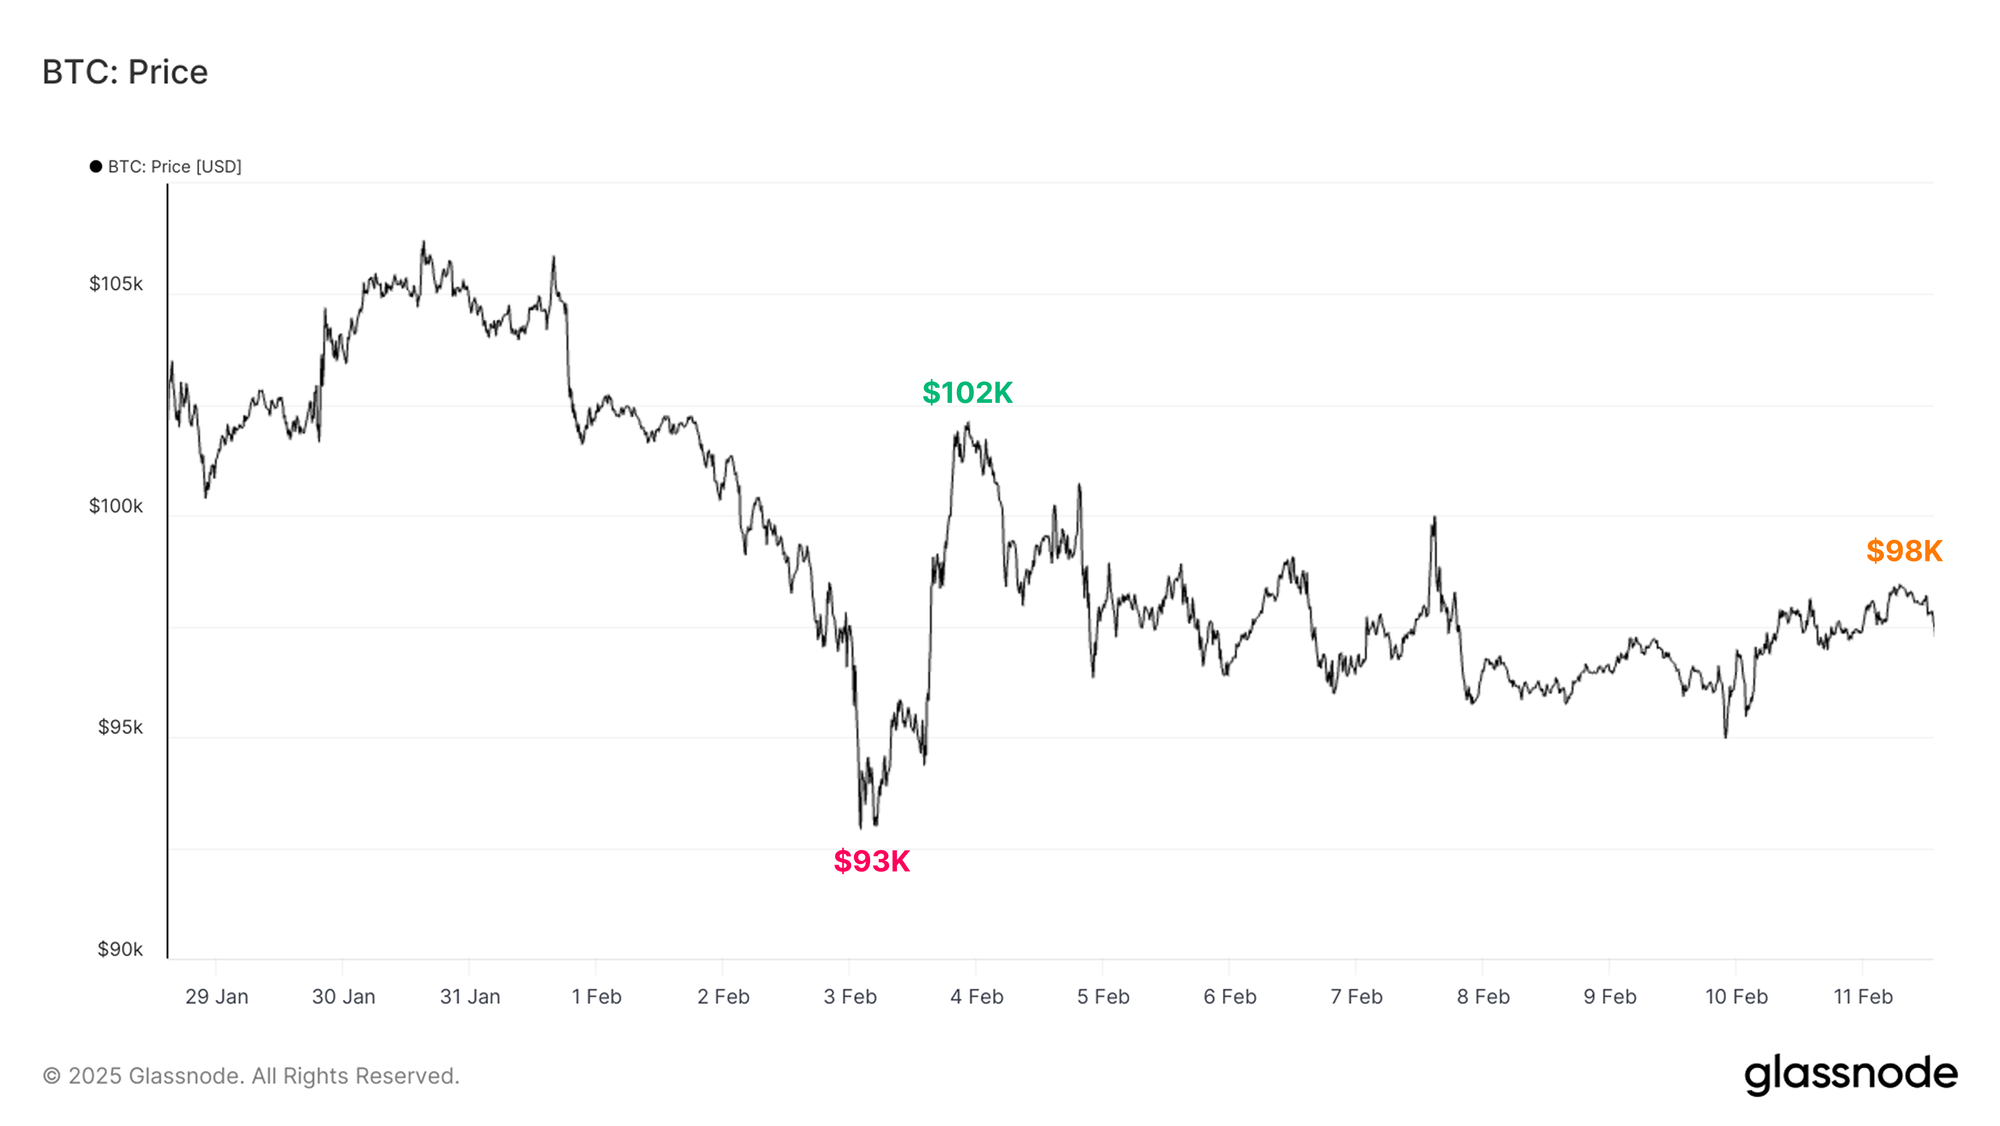
Last week, Bitcoin investors experienced an intense whipsaw in price action. BTC prices initially fell to a low of $93k, followed by a brief recovery to $102k, and are now trading closer to $98k. The indecisive price action is largely in response to President Trump’s threat of tariffs applied to Canada, Mexico and China, providing an uncertain macro backdrop for investors. Alongside this, persistent strength in the US dollar has contributed to a marginally stressed liquidity environment.
Whilst the price of Bitcoin has fluctuated wildly over recent weeks, it has not moved very far from its starting position over this period, as the prevailing regime of choppy and generally sideways movement continues.
In the previous edition of The Week On-chain, we evaluated how the composition of Bitcoin investors has evolved this cycle. Bitcoin has seen a substantial uptick in liquidity entering the asset, and larger capital flows are balancing the inertia of an increasingly large asset. Additionally, the growing presence of a more resilient and patient holders has contributed to the stability of BTC prices, even amidst a relatively unstable macro backdrop.
On the other hand, the Altcoin sector has experienced significant sell-side pressure, with many assets struggling to achieve widespread adoption or product-market fit, making for a more challenged market environment. This has culminated in a wide-scale collapse of token prices, with all altcoin sub-sectors under-performing Bitcoin in recent weeks.

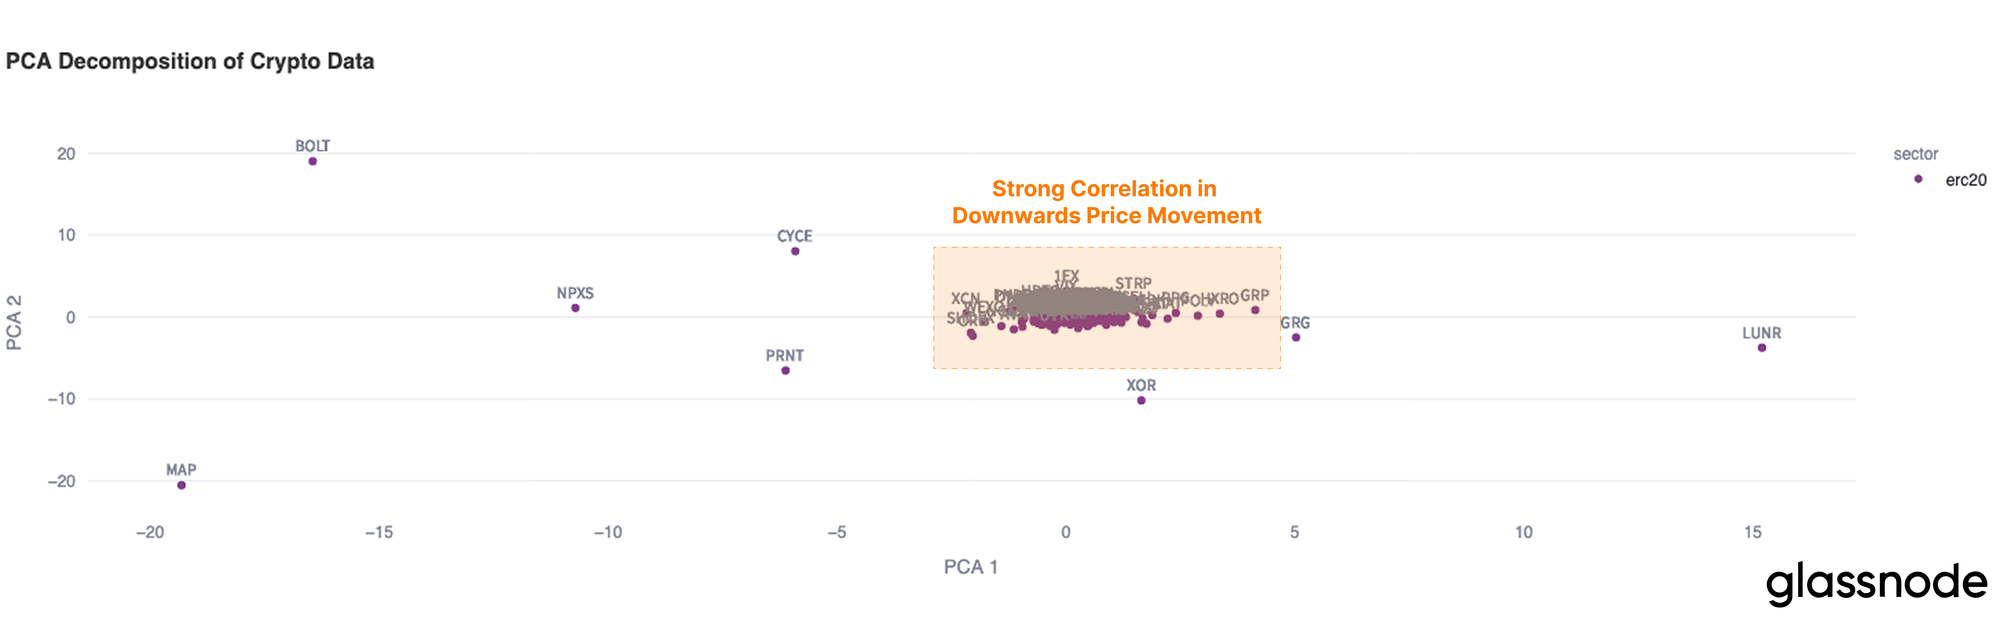
To explore the downside price action across the altcoin space, we can utilize Principal Component Analysis (PCA), which projects the correlation of token returns into a two-dimensional space. This visualization helps identify tokens that tend to behave similarly (clustered together) or differently (far apart) based on their return behaviors.
We can observe that the majority of ERC-20 tokens are densely clustered, highlighting that a wide swathe of altcoins experienced the same broad-based sell-off, with a distinct lack of idiosyncratic behavior between different sectors.
In other words, very few tokens managed to shrug off this weeks downside volatility, and they largely all moved lower together.
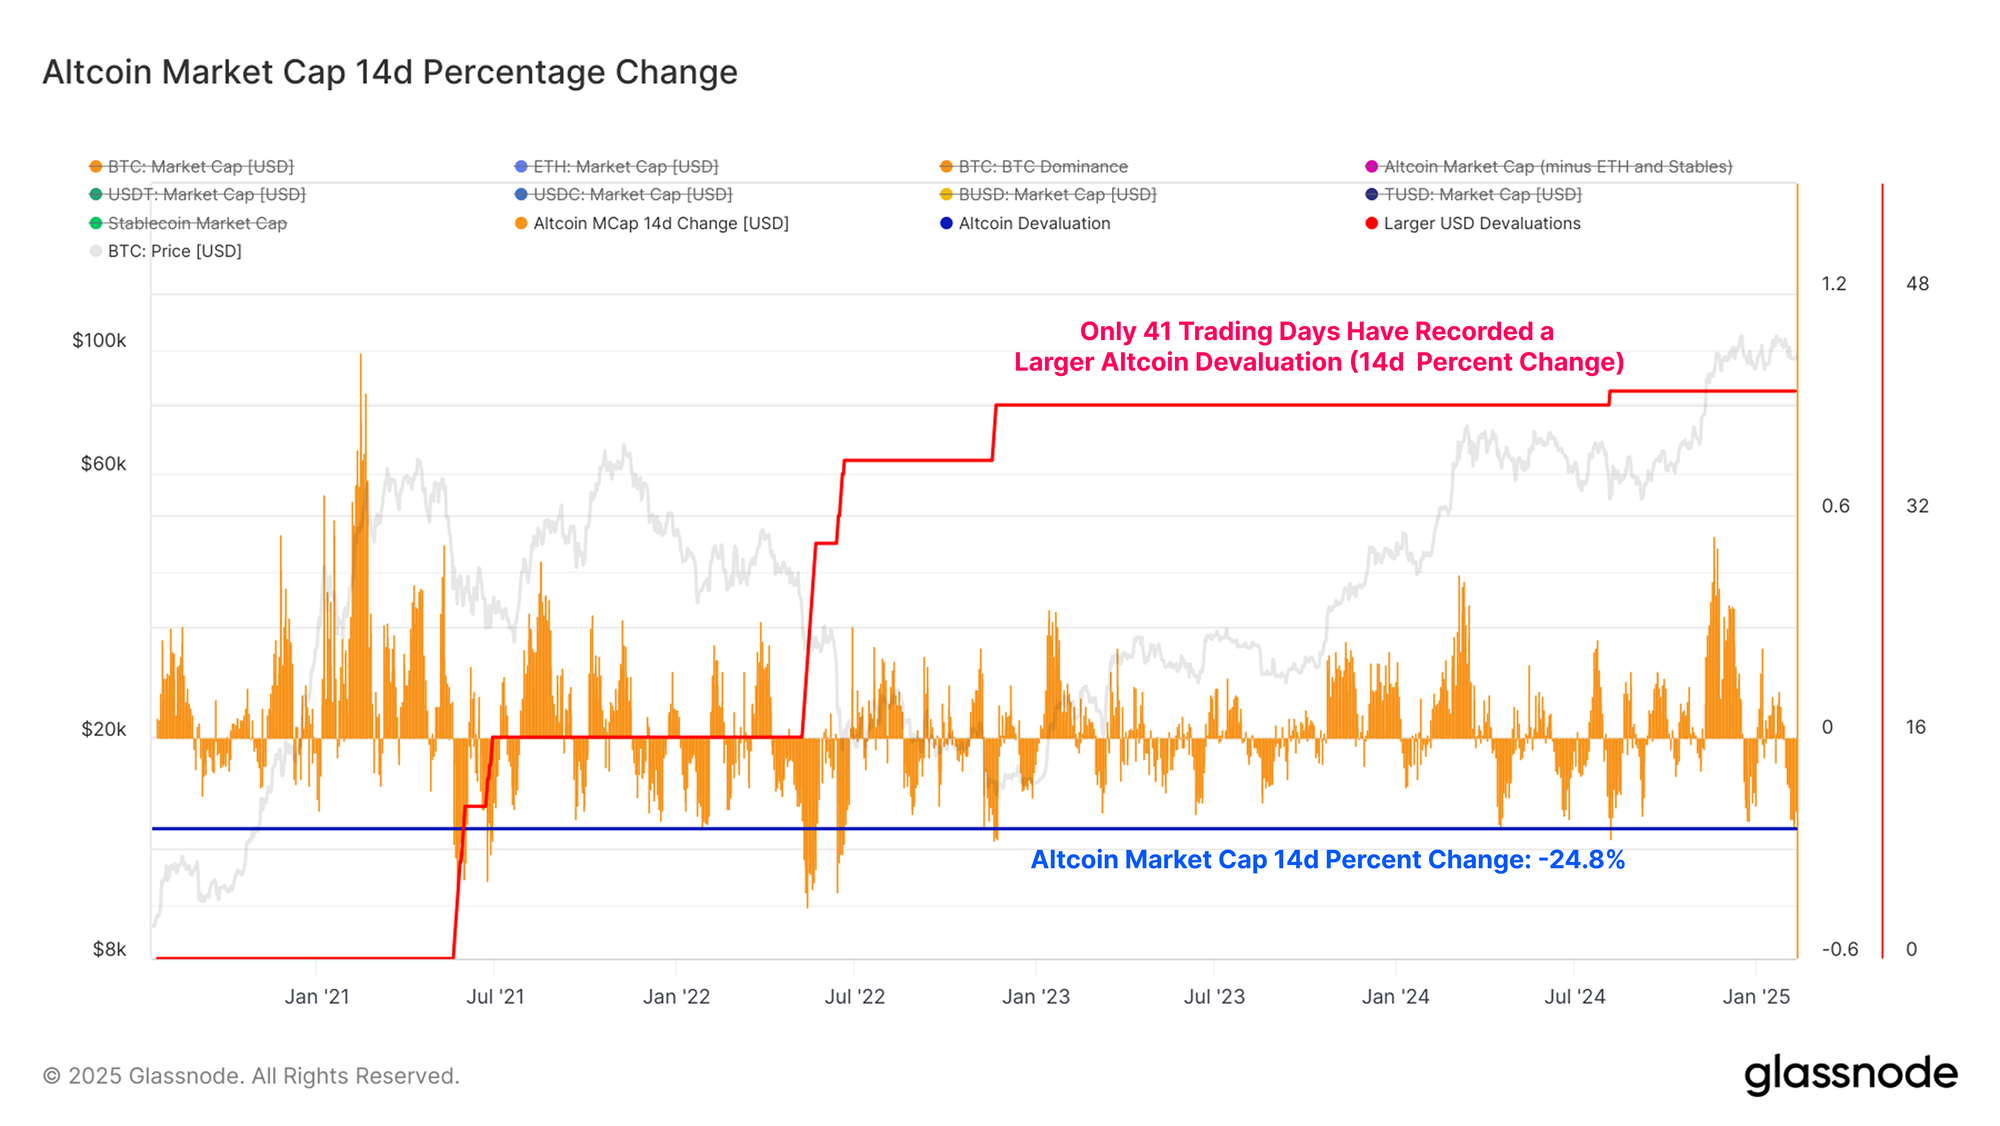
We can evaluate the magnitude of the drawdown by assessing the 14d change in the global altcoin market cap. Over the last fortnight, the altcoin market cap declined by $234B, with a small handful of events days recording a larger absolute drawdown.
The severity of this drawdown underscores the scale of the capitulation event and can be reasonably considered to be an event within a bear market within the altcoin sector.
This is quite interesting as Bitcoin does not appear to display the same relative weakness, suggesting a divergence is opening up between BTC and the rest of the digital asset landscape.
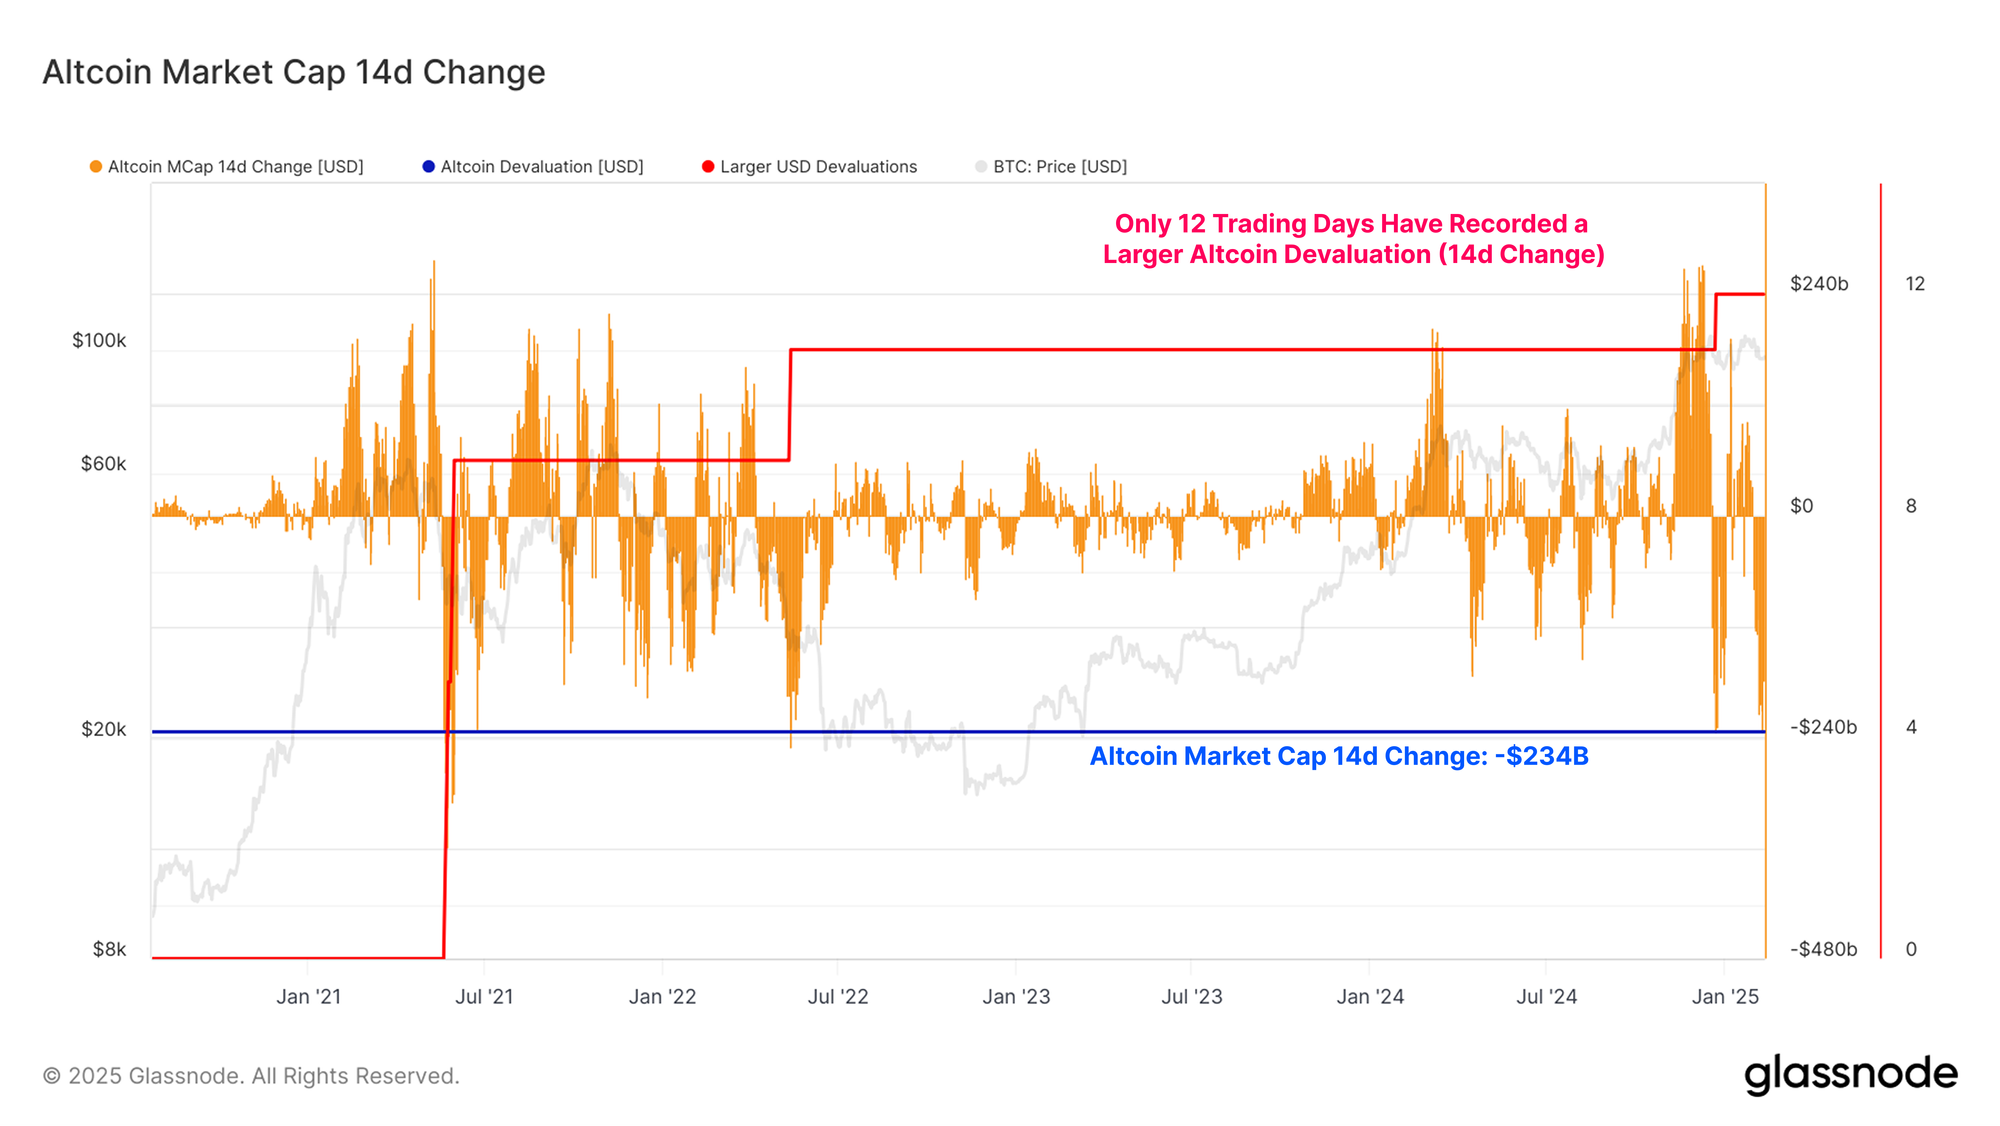
If we look at this metric in percentage terms, the altcoin drawdown is still significant, with only 41 / 1662 trading days recording a larger drawdown. However, in this relative scale, it does remain more in line with previous drawdown events experienced throughout 2024.
The present drawdown is also substantially less aggressive when compared to the sell-off in May 2021 (the Great Miner Migration) and in late 2022 when LUNA/UST and 3AC collapsed.
Inspecting Bitcoin Losses
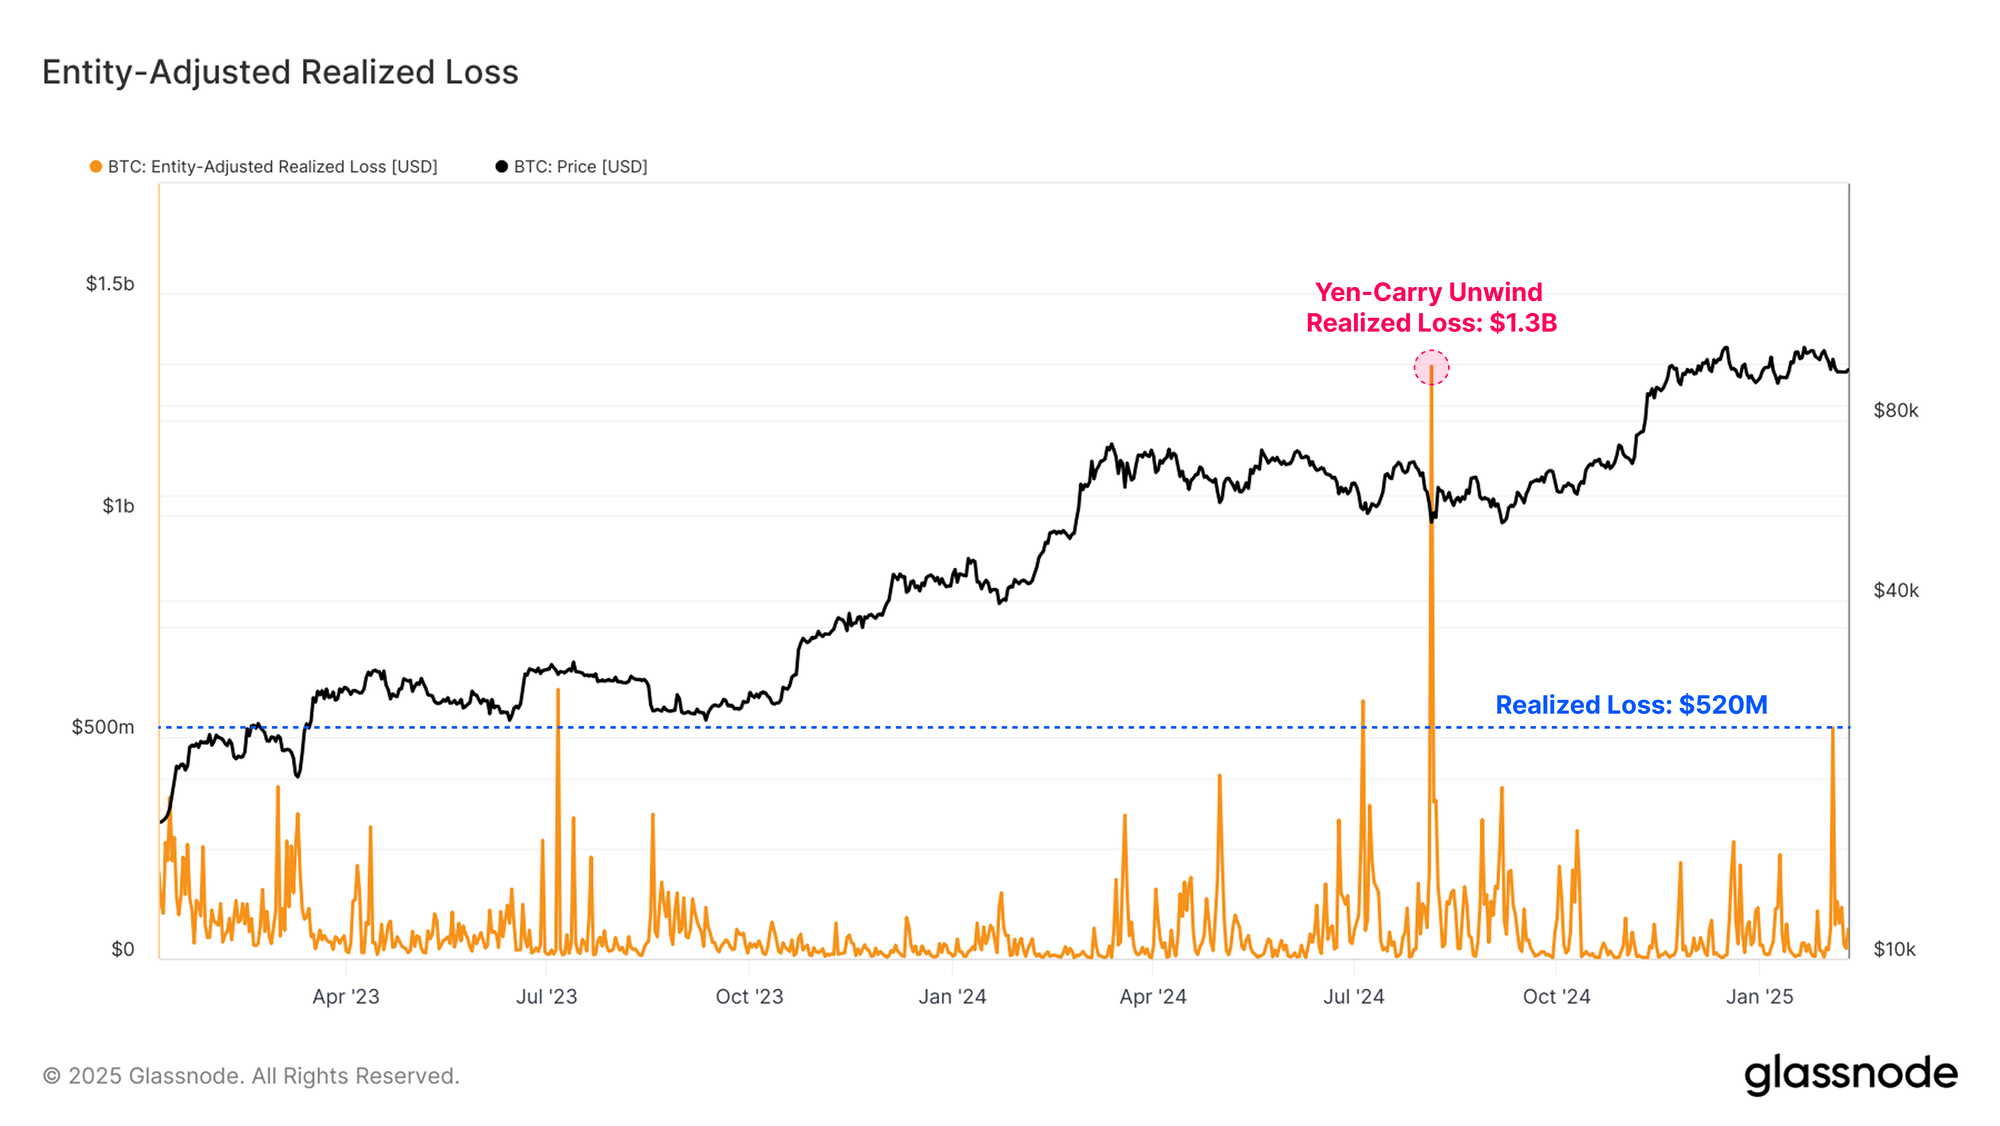
Despite Bitcoin price being relatively flat over the week, the realized losses locked in by Bitcoin investors during the choppy swings in price action were one of the largest of the current bull market cycle. Investors locked in around $520M in losses as the market sold off to $93k, being one of the largest local capitulation events so far.
Therefore, we can consider this as a meaningful capitulation event within the context of a macro scale bull market uptrend. Only the losses locked in on 5-August-2023, during the yen-carry trade unwind, stand out as a larger one-day loss (seeing -$1.3B in realized loss).
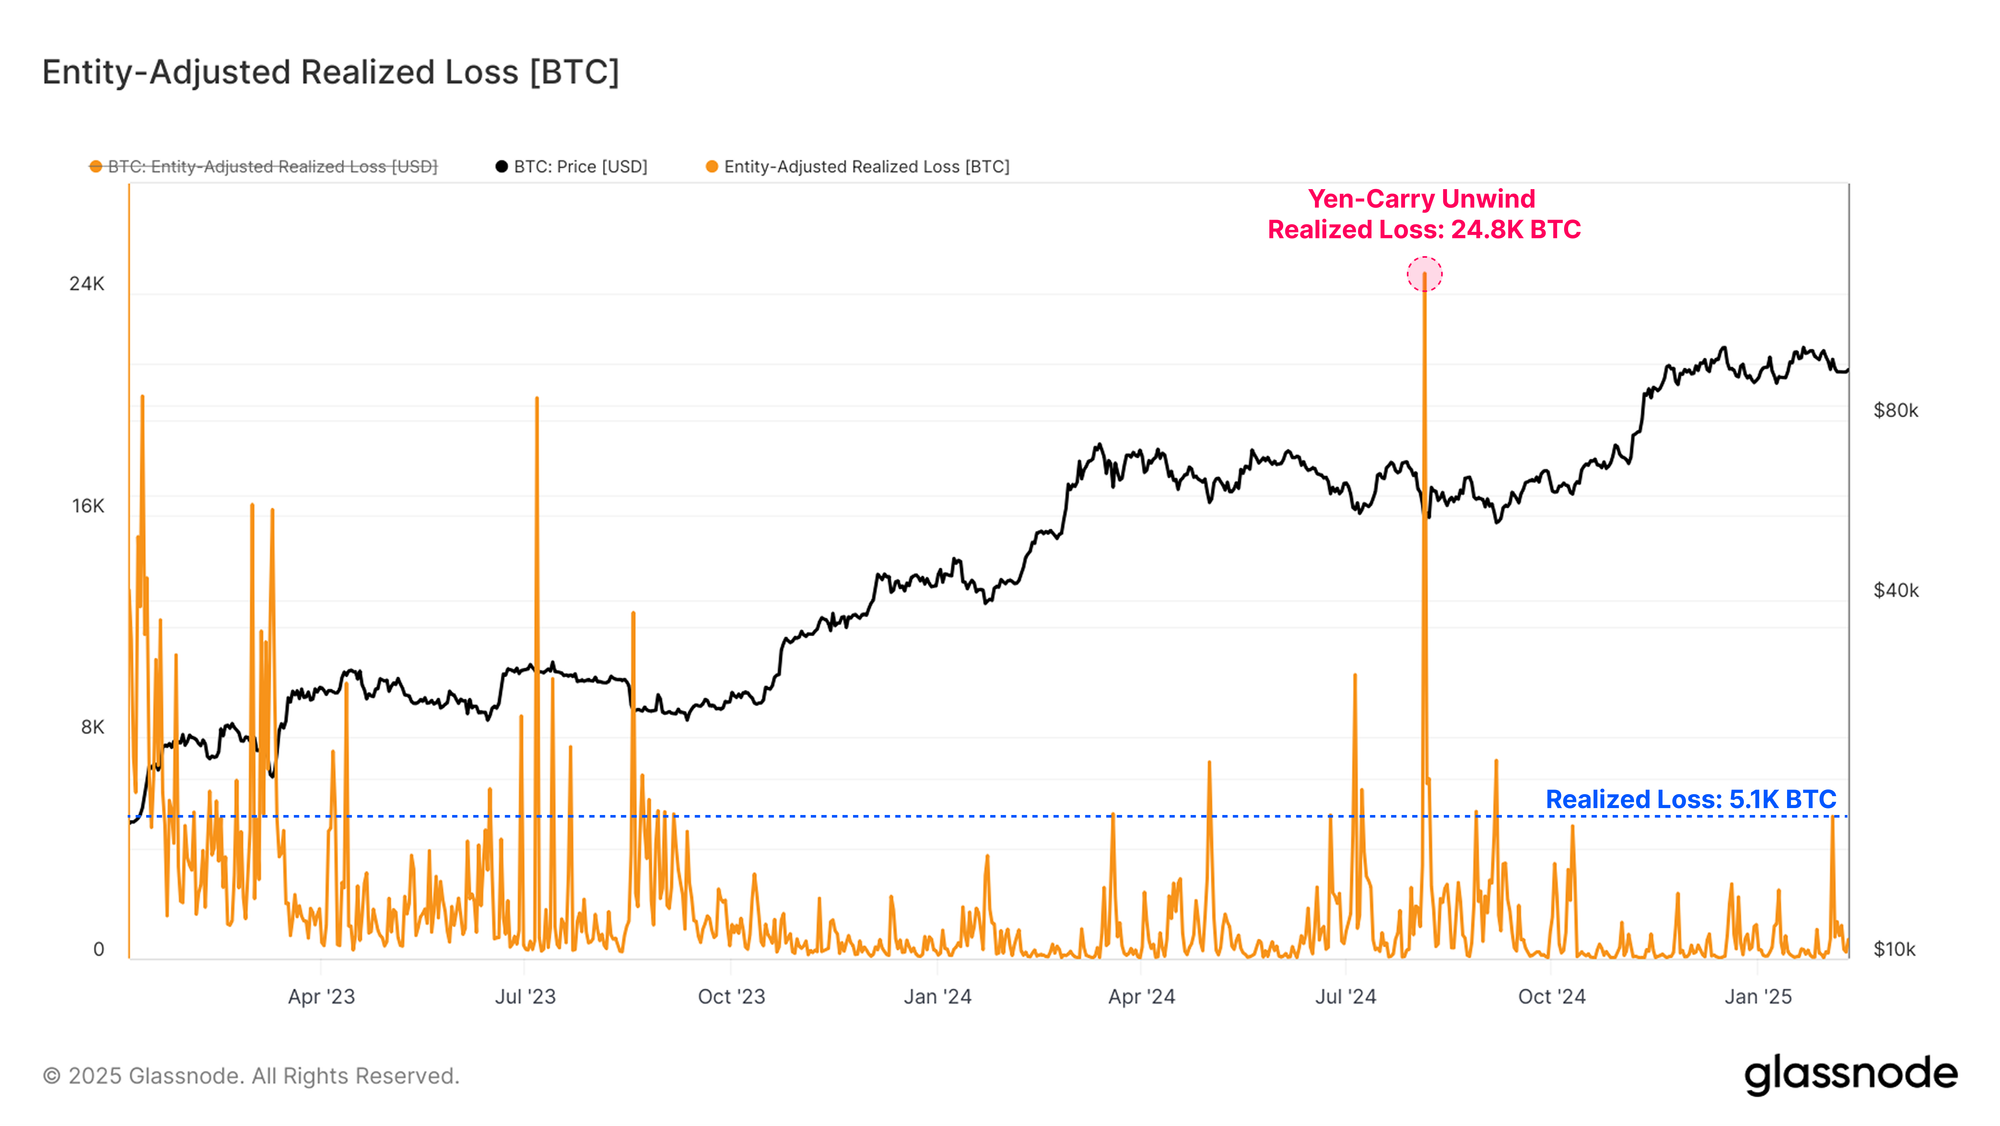
As Bitcoin grows in size, we must also consider that absolute measures of realized loss may become misleading when we compare it to previous price ranges. When assessing these losses in a BTC denomination, which effectively normalizes for market size, the severity of the losses starts to look more ‘typical’.
This surge in losses is of a similar magnitude to previous local capitulation events throughout 2024, suggesting this may still be considered a normal event for a bull market correction/consolidation period.
Profiling The Losses
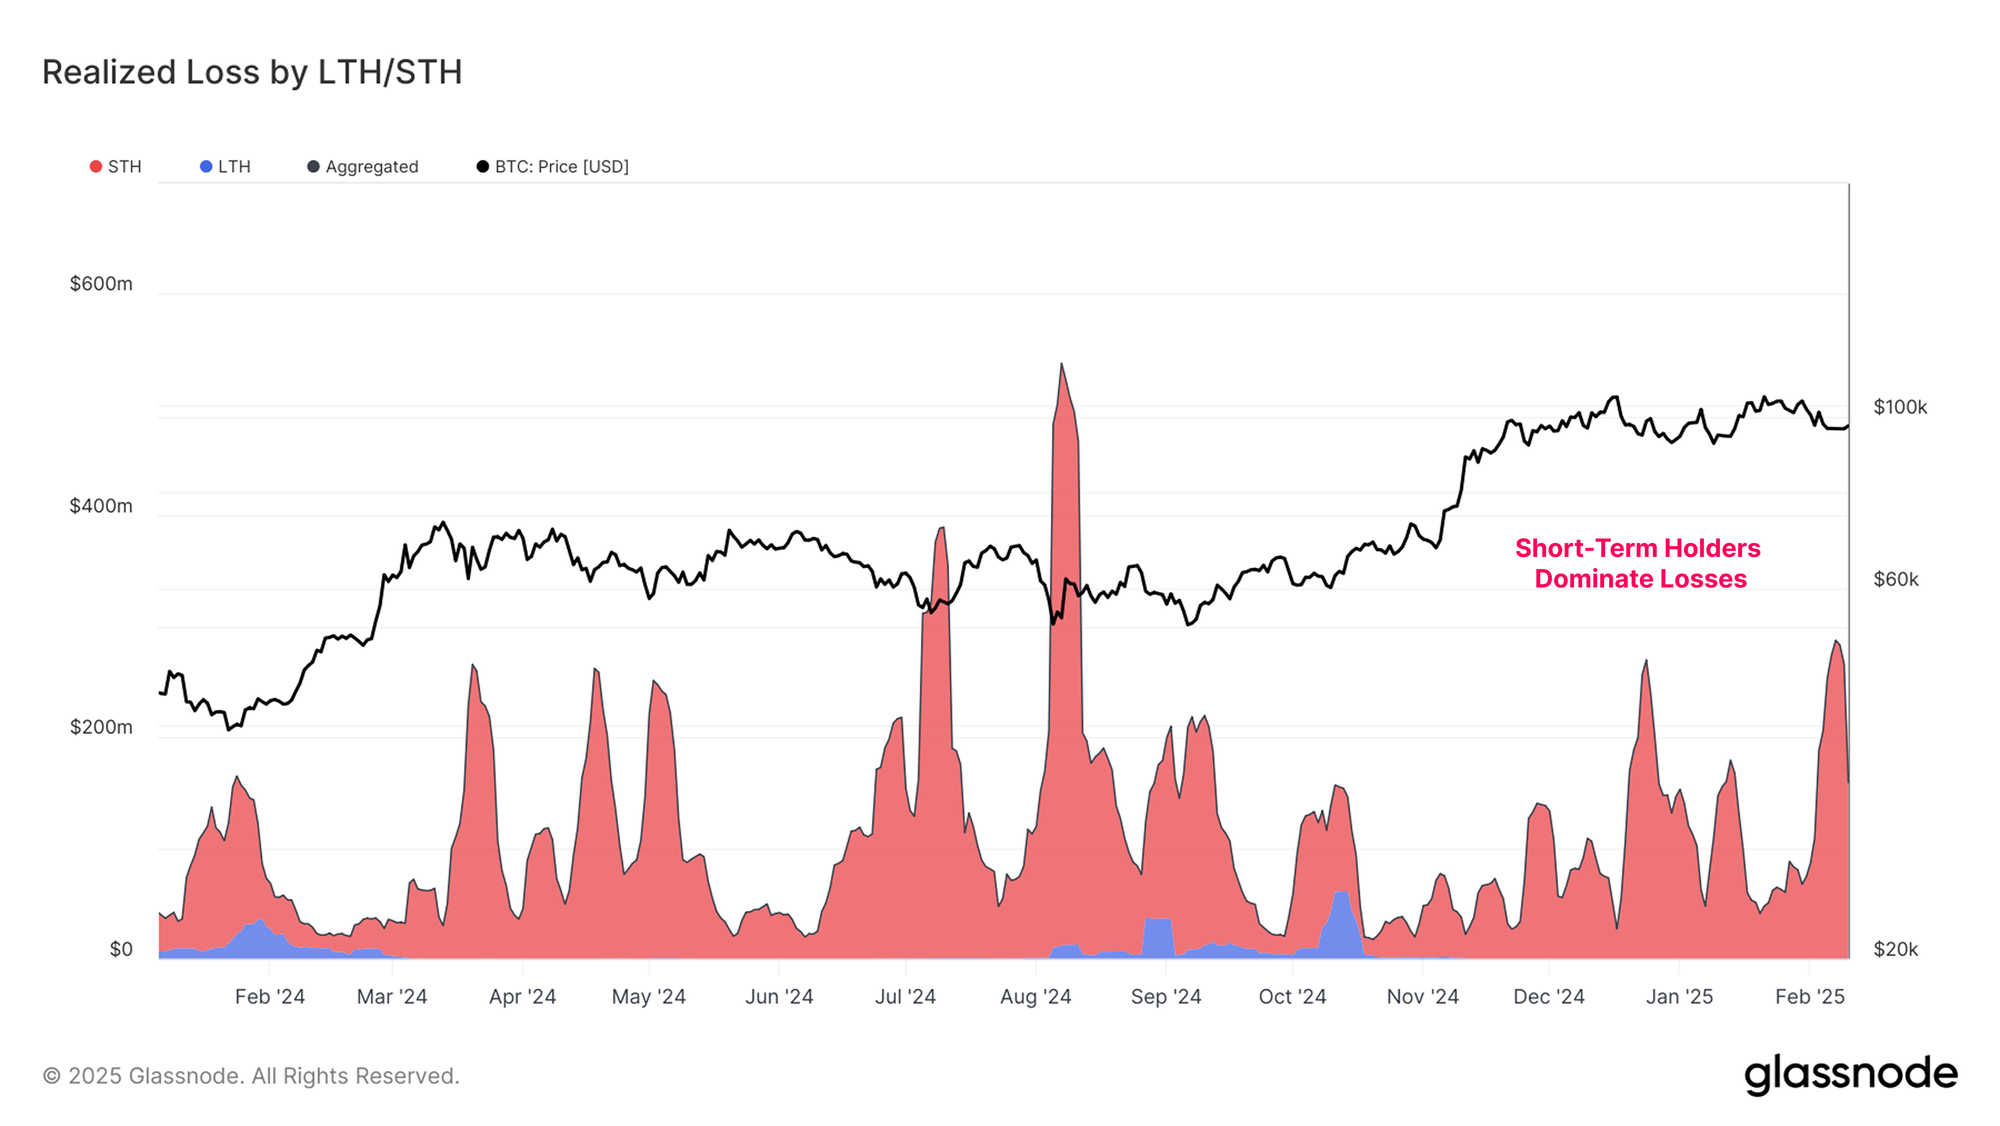
During a bull market regime, long-term investors are generally highly profitable. Therefore, the dominant source of realized loss originates from the Short-Term Holder cohort, which accounts for the pool of recent investors who have the highest average cost basis.
Typically, Long-Term holder losses are absent during the bull market. Loss-taking for the LTH cohort usually begins as the cycle transitions from a bull market into a bear market and accelerates as the market drawdown intensifies. This ends with a final flush out, often peaking near the macro cycle low.
Alternatively, the comparatively price-sensitive Short-Term Holders tend to realize heavy losses during drawdowns within both bull and bear markets. Short-Term Holder entity-adjusted realized losses totalled $520M this week, which is a similar magnitude to pullbacks throughout the 2024-25 cycle thus far.
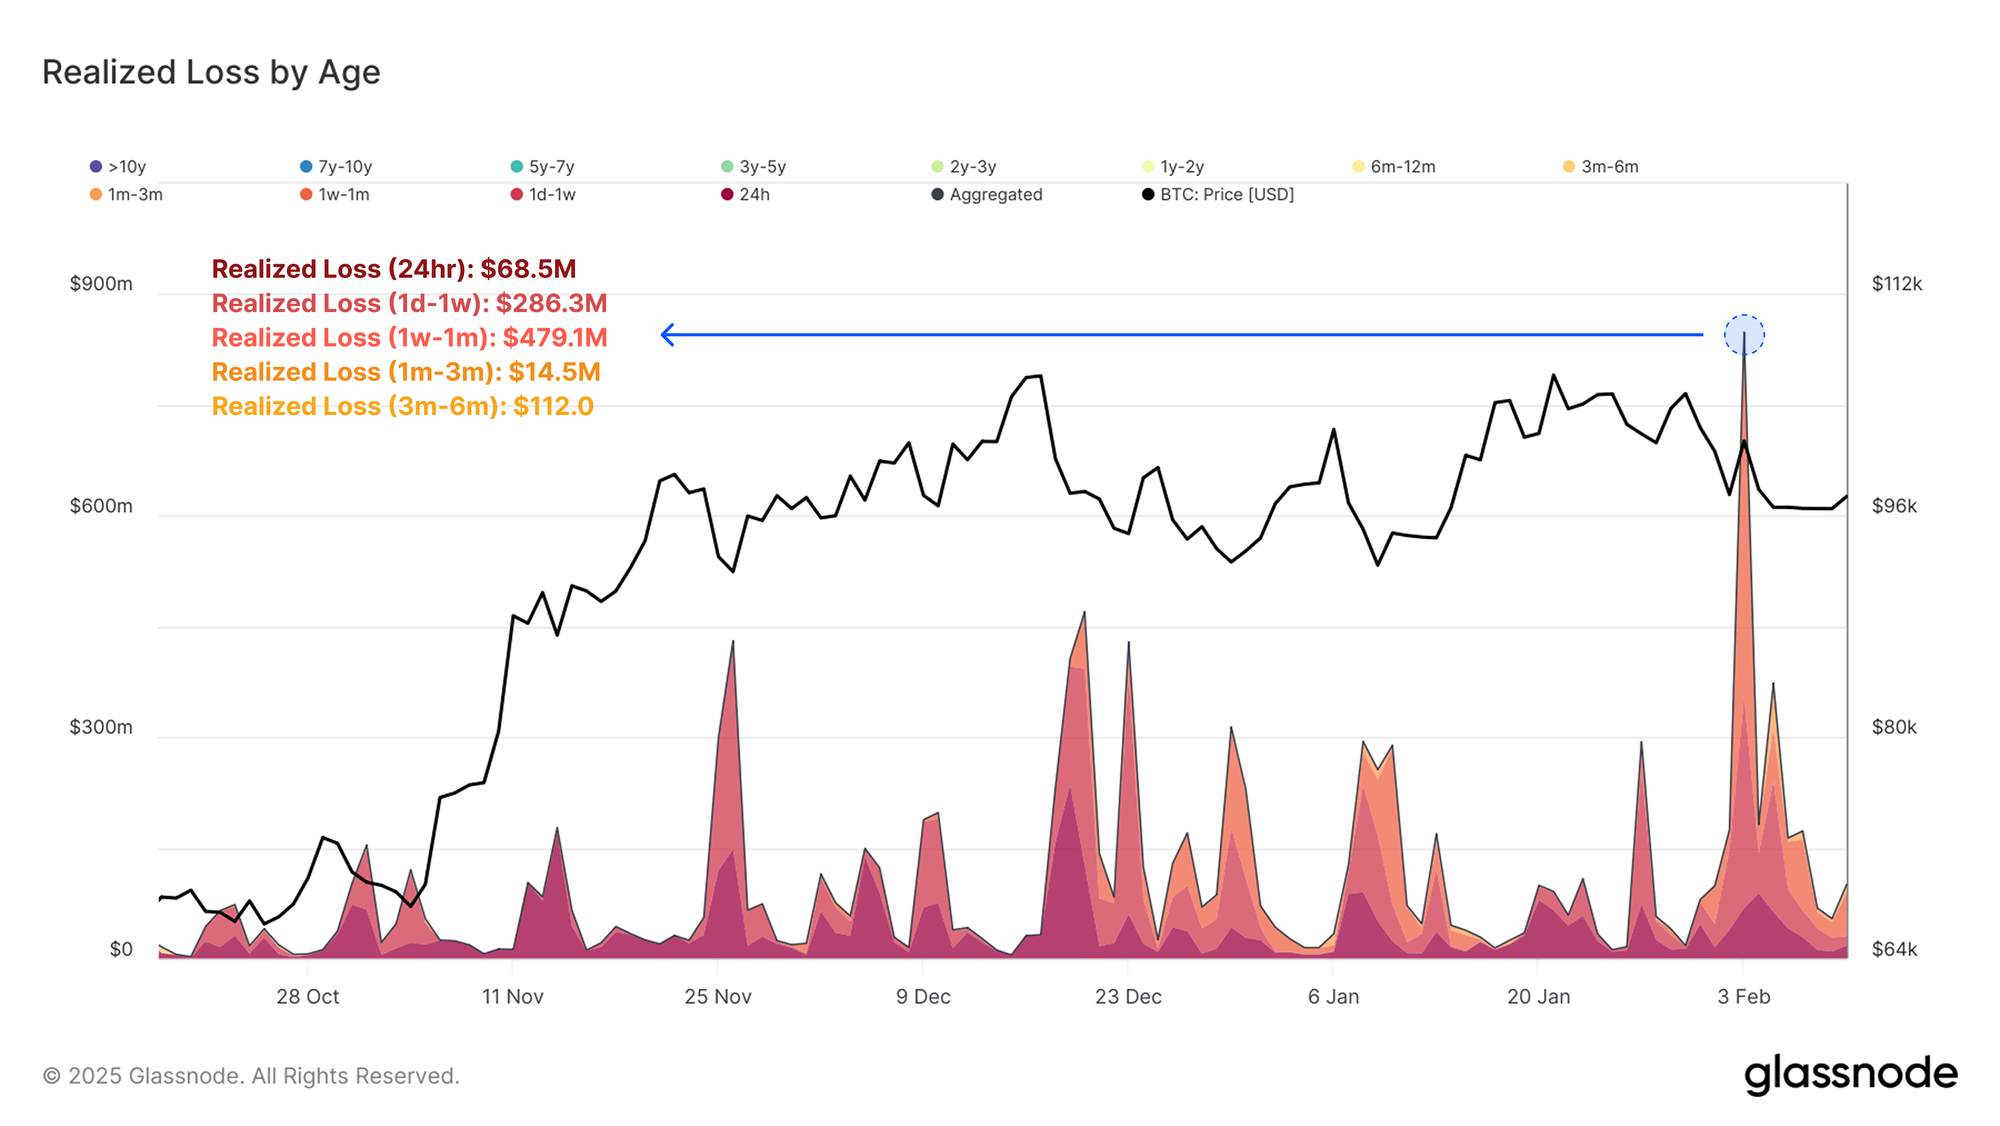
If we increase the granularity of our profile for Short-Term Holder losses, we can see that the majority of losses were associated with investors who had only acquired their coins within the last 1-month. The age-based breakdown is as follows:
- 24hr Realized Loss: $68.5M
- 1d-1w Realized Loss: $286.3M
- 1w-1m Realized Loss: $479.1M
- 1m-3m Realized Loss: $14.5M
- 3m-6m Realized Loss: $112.0
This reinforces the notion where the majority of onchain volume, and realized losses tend to be linked with investors who have most recently entered the market, and are thus the most sensitive to volatility and price fluctuations.
Looking Forward
As prices whipsaw around, we can employ a suite of onchain-derived pricing levels to explore some potential pathways and thresholds for price on the road ahead.
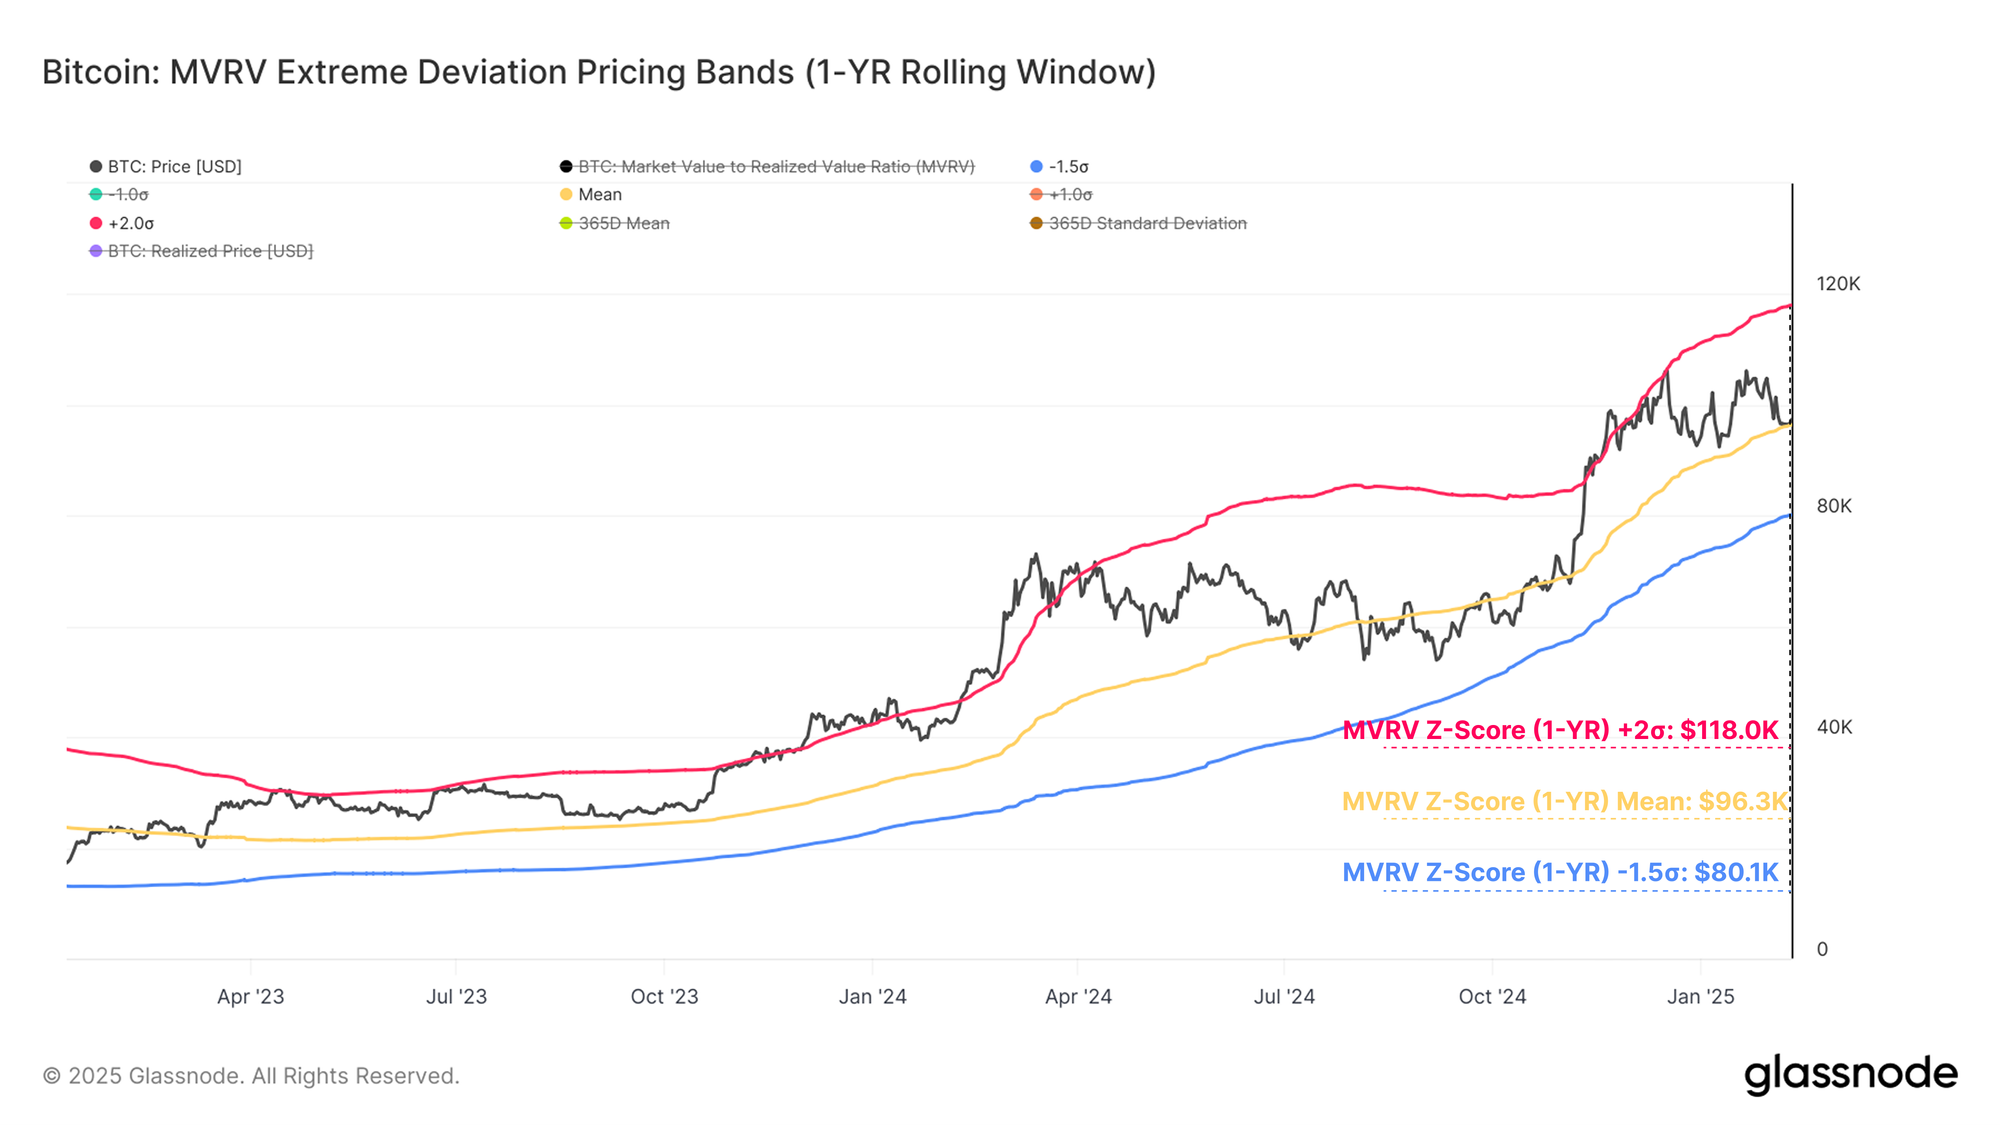
To assess areas of critical support, we can utilize the MVRV Z-Score on a 1yr rolling window. This specific transformation provides a clearer representation of near-term market dynamics, with the model capturing only recent market behaviour.
- 🔴 +2σ: $118.0k
- 🟡 Mean: $96.3k
- 🔵 -1.5σ: $80.1k
At the moment, the price has found strong support near the Mean level. Should prices break lower, the -1σ may mark a key threshold for the bulls' next major line of defensive support. Conversely, the +1σ level may act as resistance, as investors come into a meaningful amount of unrealized paper profit and may seek to realize them into market strength.
Since we have identified that the majority of losses originate from the Short-Term Holder cohort, it becomes prudent to highlight their investment positioning as the market trades around this middle MVRV support range.
The average Short-Term Holder cost basis has also historically acted as a strong support level during a bull market uptrend. This pricing model currently trades at around $92.2k, and is a key region to hold for the market to avoid further downside.
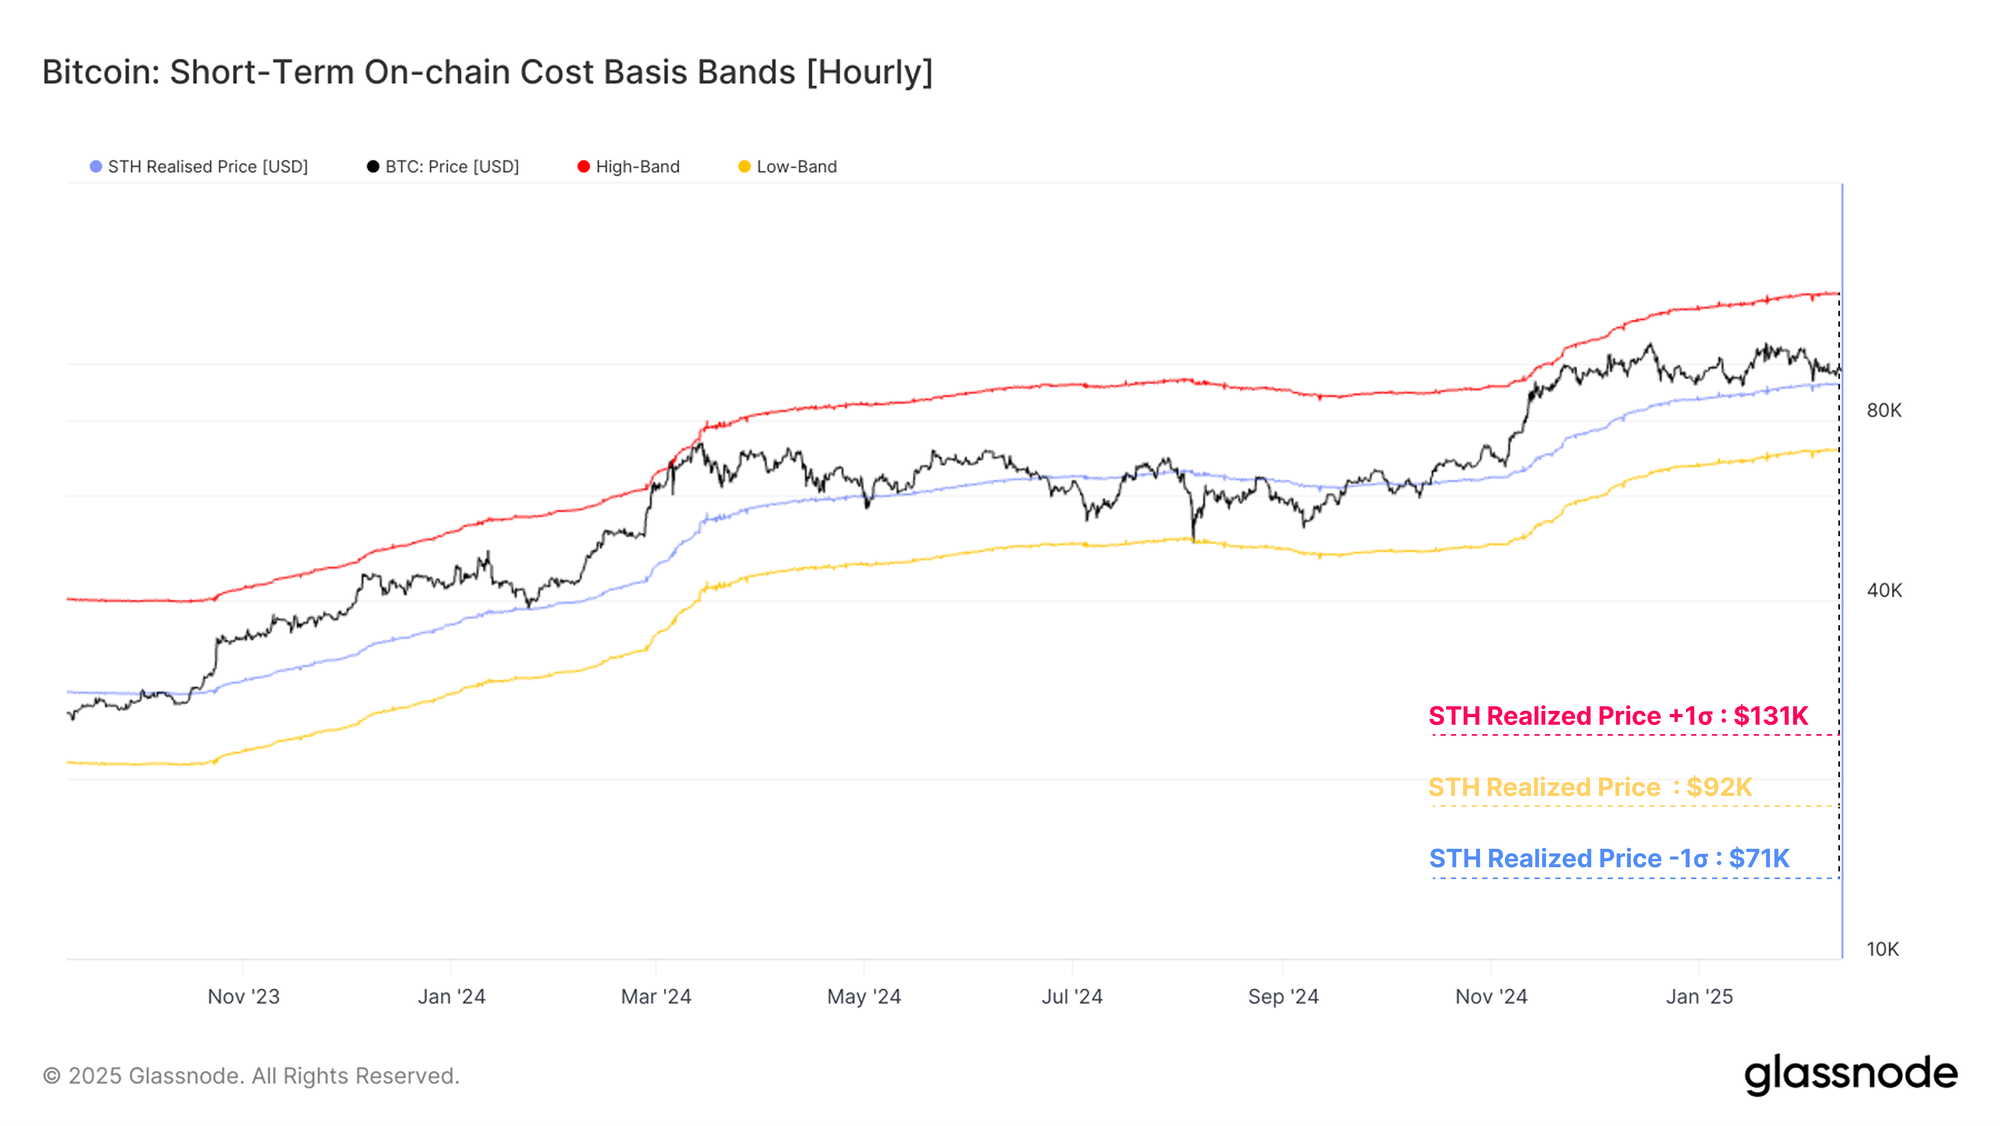
We can similarly employ the ±1σ bands based on a full lookback Z-Score transformation, to assess the typical upper and lower bounds for price action.
- Short-Term Holder Cost-Basis +1σ: $131k
- Short-Term Holder Cost-Basis -1σ: $71k
Right now, the spot price is trading in between the upper and lower bands, and is hovering above the STH cost basis. This suggests that the bulls are still in control, but price is nearing their first lines of defence, and almost tested the STH cost basis during the recent sell-off event.
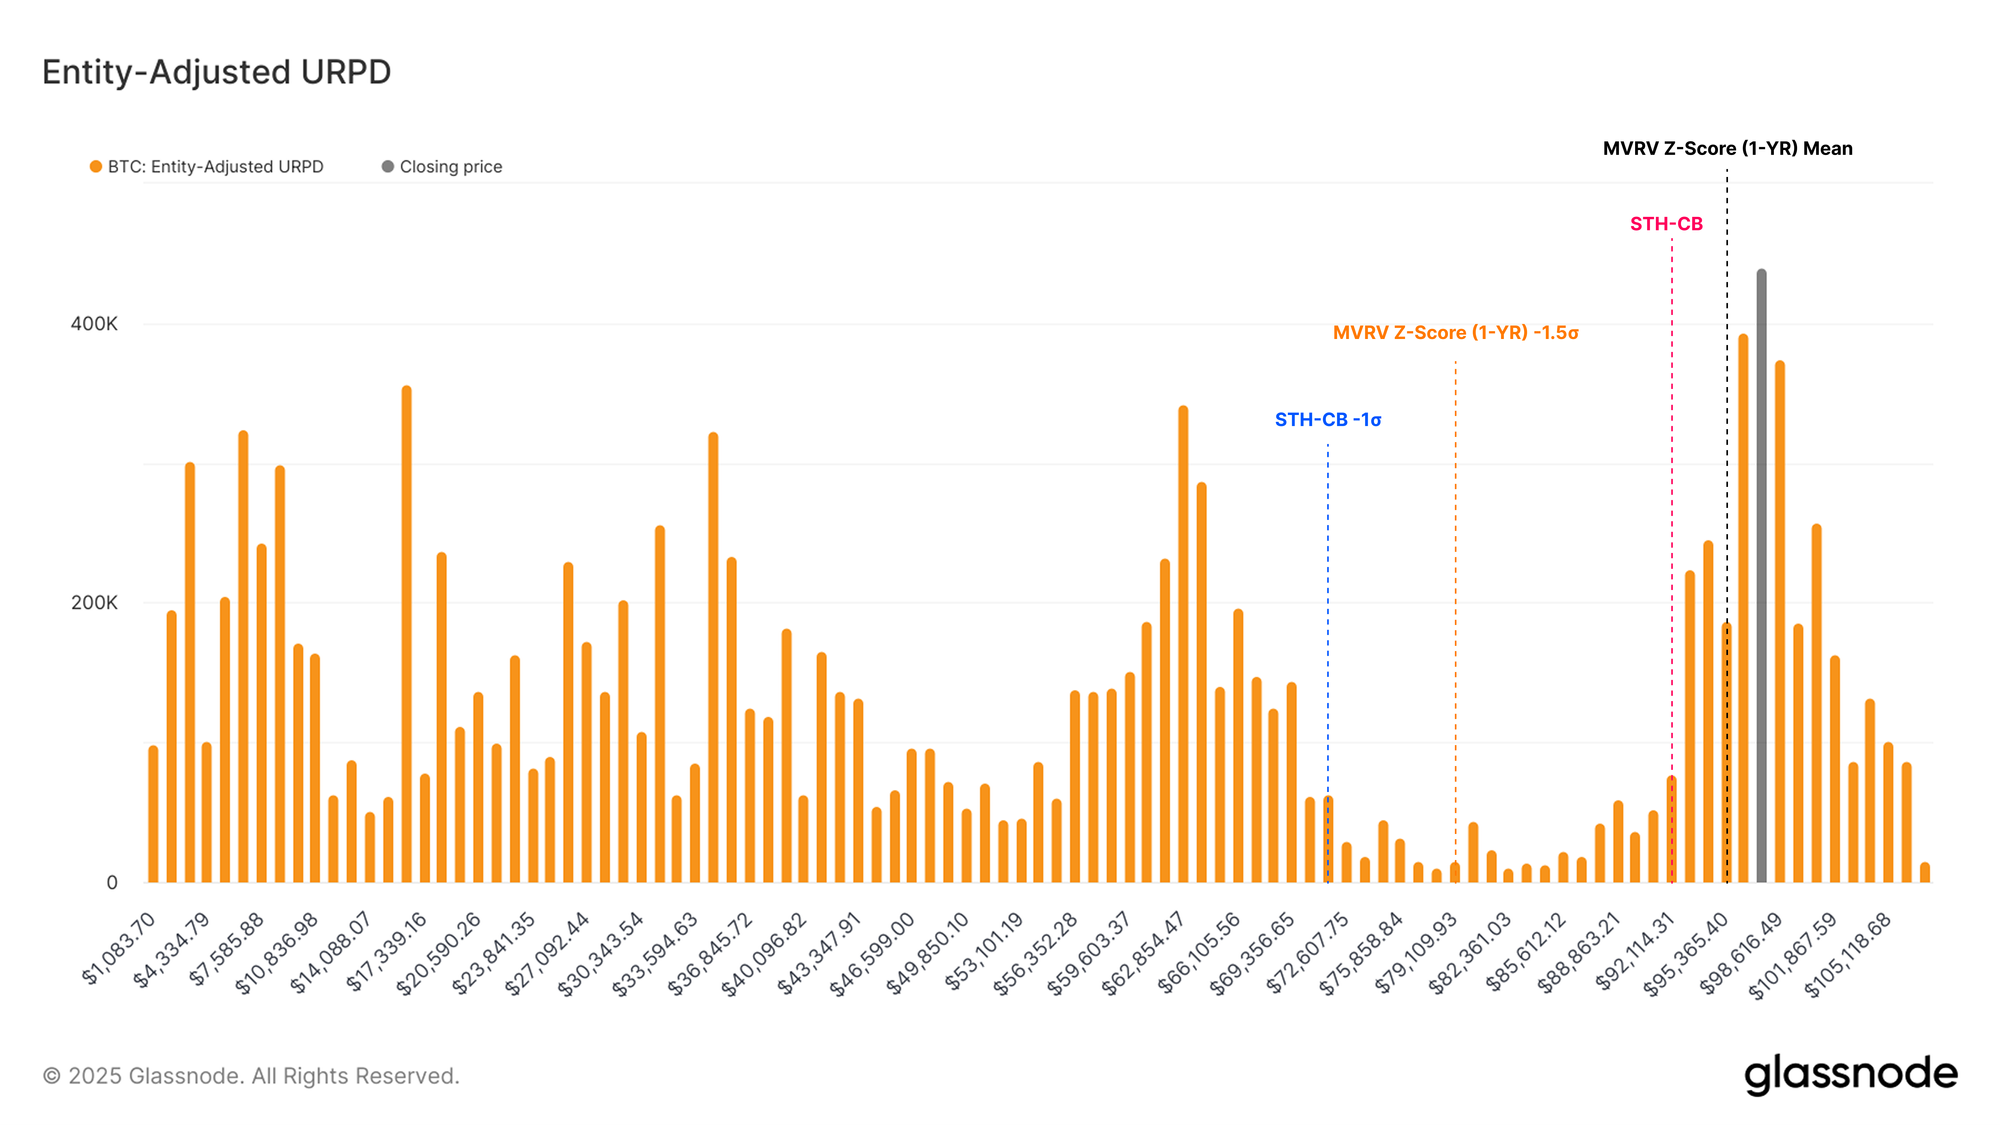
The importance of defending the STH cost basis and the MVRV 1Yr Z-Score pricing regions becomes increasingly apparent when overlaying the price traces onto the URPD volume profile. A significant volume air-pocket can be seen below these levels, where very few coins changed hands in that price range.
Additionally, the -1σ band for the STH cost basis resides at the upper bound of this volume gap, suggesting this may be a relatively sensitive area should prices fall that far.
Summary and Conclusions
The Bitcoin price has been both wildly volatile and ultimately flat over the last few weeks. It has traded up to a high of $105k, down to a low of $93k, and yet ended the week where it started around $98k.
This unstable price action resulted in a substantial loss event totalling $520M, one of the largest of the cycle when priced in USD. However, when assessing the severity of the drawdown through a normalized measure, the sell-off remains broadly in line with other local corrections.
In contrast, the Altcoin sector has undergone a broad sell-off and failed to find firm footing. The majority of tokens have experienced a highly correlated downside sell-off, with few sectors spared from the damage.
This has led to one of the largest Altcoin devaluations on record and highlights a notable dislocation between Bitcoin and the typical rotation of capital prior market cycles have seen towards the altcoin landscape.
Disclaimer: This report does not provide any investment advice. All data is provided for information and educational purposes only. No investment decision shall be based on the information provided here and you are solely responsible for your own investment decisions.
Exchange balances presented are derived from Glassnode’s comprehensive database of address labels, which are amassed through both officially published exchange information and proprietary clustering algorithms. While we strive to ensure the utmost accuracy in representing exchange balances, it is important to note that these figures might not always encapsulate the entirety of an exchange’s reserves, particularly when exchanges refrain from disclosing their official addresses. We urge users to exercise caution and discretion when utilizing these metrics. Glassnode shall not be held responsible for any discrepancies or potential inaccuracies. Please read our Transparency Notice when using exchange data.
- Join our Telegram channel.
- For on-chain metrics, dashboards, and alerts, visit Glassnode Studio.