Mean Reversion
Bitcoin has surged back to $94.7k amid optimism surrounding tariff relief, with the market reclaiming key levels and sparking profit-taking. Short-term holders have taken profits, traders shorted the rally, and ETF inflows hit $1.54B – signalling an important sentiment shift behind the move.


Executive Summary
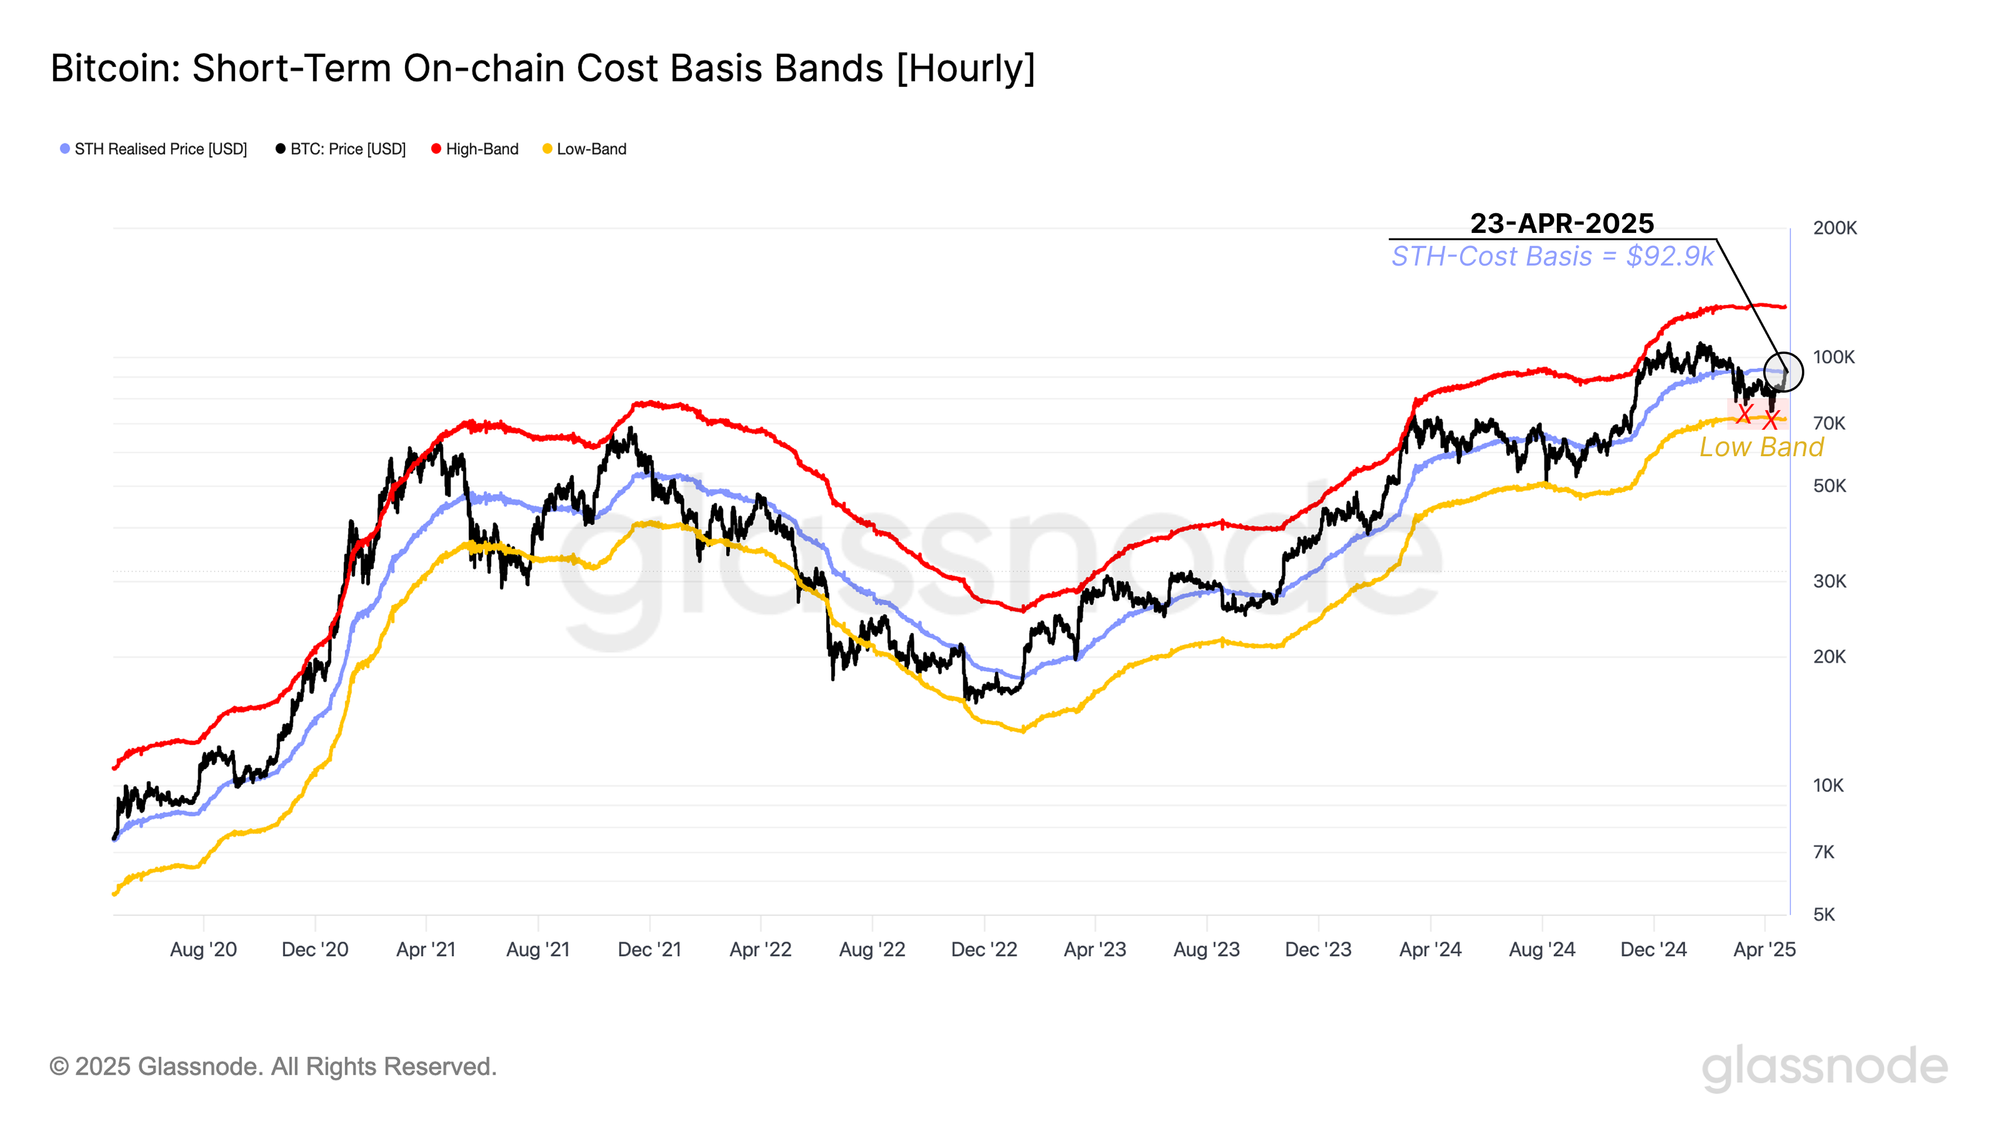
- Bitcoin has surged to $94.7k following optimism around the potential easing of U.S.–China tariff tensions. The price briefly reclaimed the Short-Term Holder Cost Basis ($92.9k), which is a critical mid-point separating bearish and bullish market phases.
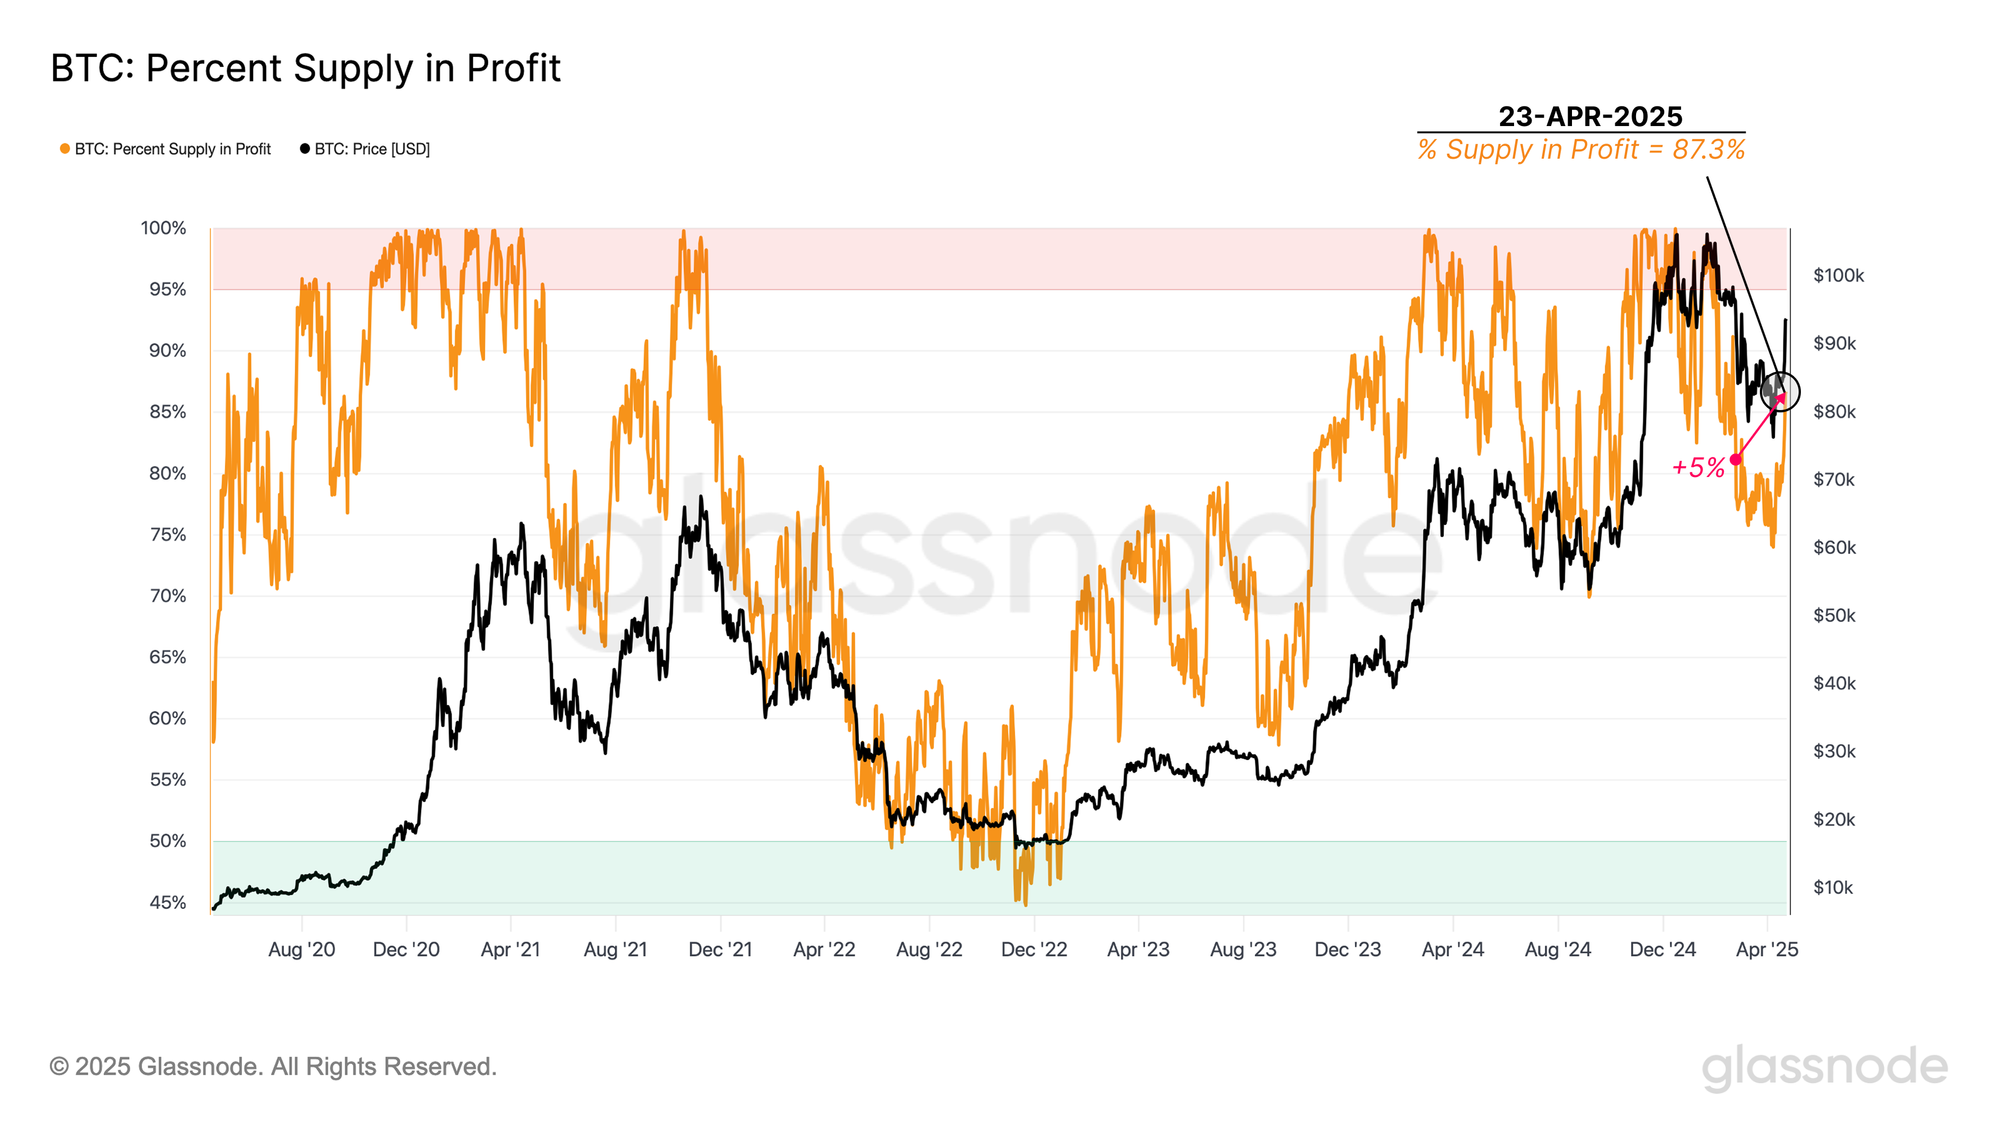
- The Percent Supply in Profit climbed to 87.3%, up from 82.7% when BTC last traded at similar price levels. This indicates that nearly 5% of the supply changed hands during the recent correction.
- The STH Profit/Loss Ratio hit 1.0, signalling many recent buyers are at break-even, a level often associated with exit risk. Realized profit has also spiked, driven largely by short-term investors locking in gains.
- Futures open interest has increased by 15.6%. However, funding rates turned negative, showing rising short interest, despite the market trading higher.
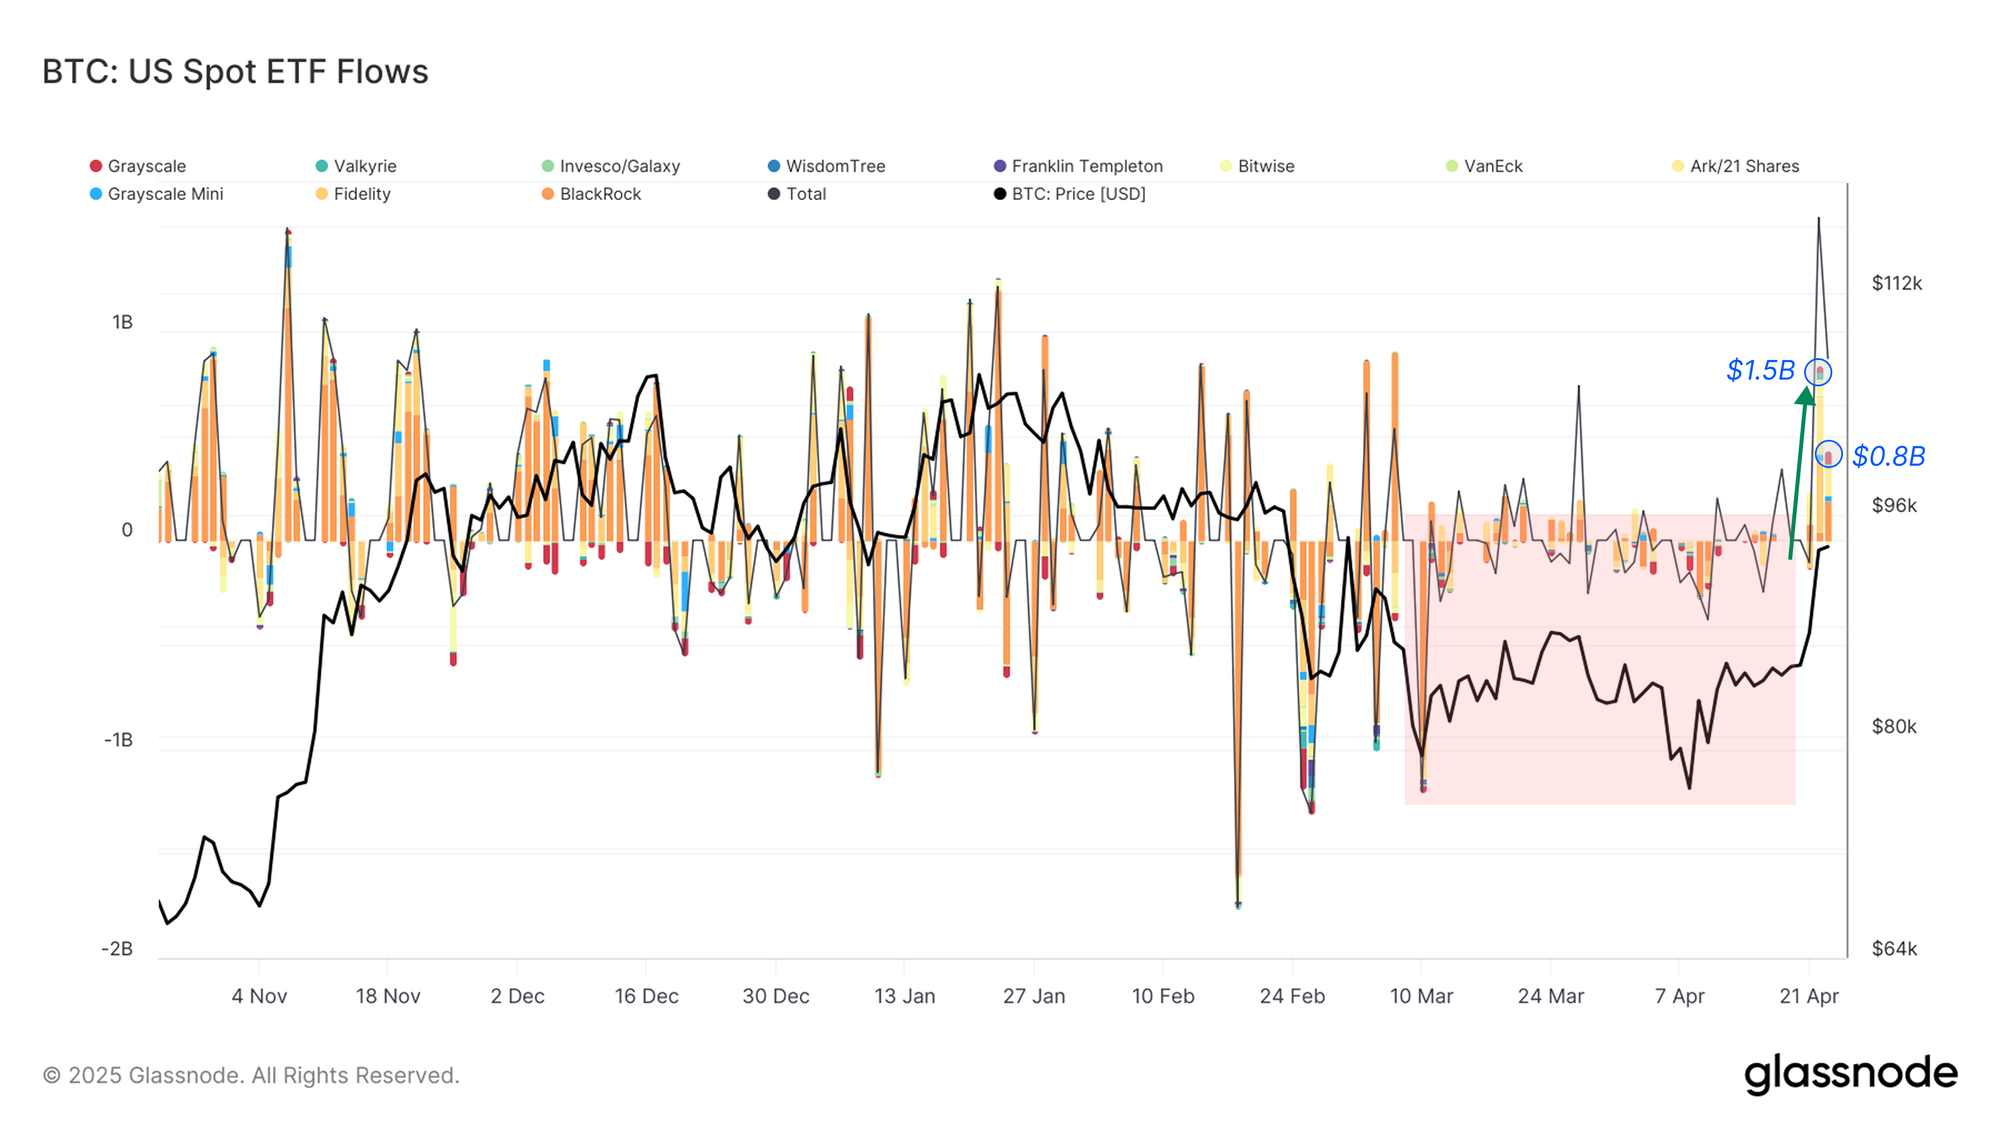
- On 22-April, U.S. spot Bitcoin ETFs saw a record $1.54B in net inflows, showing a substantial influx of institutional demand. Normalized flow data shows BTC demand has far outpaced ETH demand via the ETFs, helping explain Ethereum’s relative underperformance.
After weeks of subdued activity and lower liquidity conditions, the market has finally responded positively to a broader macro catalyst. Following optimistic signals from the U.S. administration regarding tariff relief on Chinese imports, both equities and crypto markets have rallied higher.
In Bitcoin’s case, this rally has briefly broken above a crucial on-chain threshold: the Short-Term Holder (STH) Cost Basis, currently at $92.9k. This model reflects the average acquisition price of market participants who recently acquired their coins, and often acts as a key pivot level. Historically, a sustained break above this price model has marked the transition between periods of bearish corrections and renewed bullish sentiment during recoveries.
However, much like the July–September 2024 period, this move has thus far only resulted in a momentary reclaim of the STH-Cost Basis. This indicates an initial spark of optimism, but has not yet confirmed a complete regime shift back into bullish territory. Sustained strength above this level is likely to improve market confidence, as more investors move back into a meaningful unrealized profit.
The market’s latest push to $94.3k has been accompanied by a noticeable recovery in unrealized profit held by investors. The Percent Supply in Profit metric has risen to 87.3%, marking a sharp rebound from the lows seen in March.
When Bitcoin last traded at ~$94k, only 82.7% of the supply was in profit. This means that since early March, nearly 5% of the circulating supply has changed hands at lower prices as the market chopped sideways and lower.
Historically, a typical euphoria phase tends to follow this metric stabilizing above 90% for an extended period, signalling widespread profitability and elevated investor confidence.
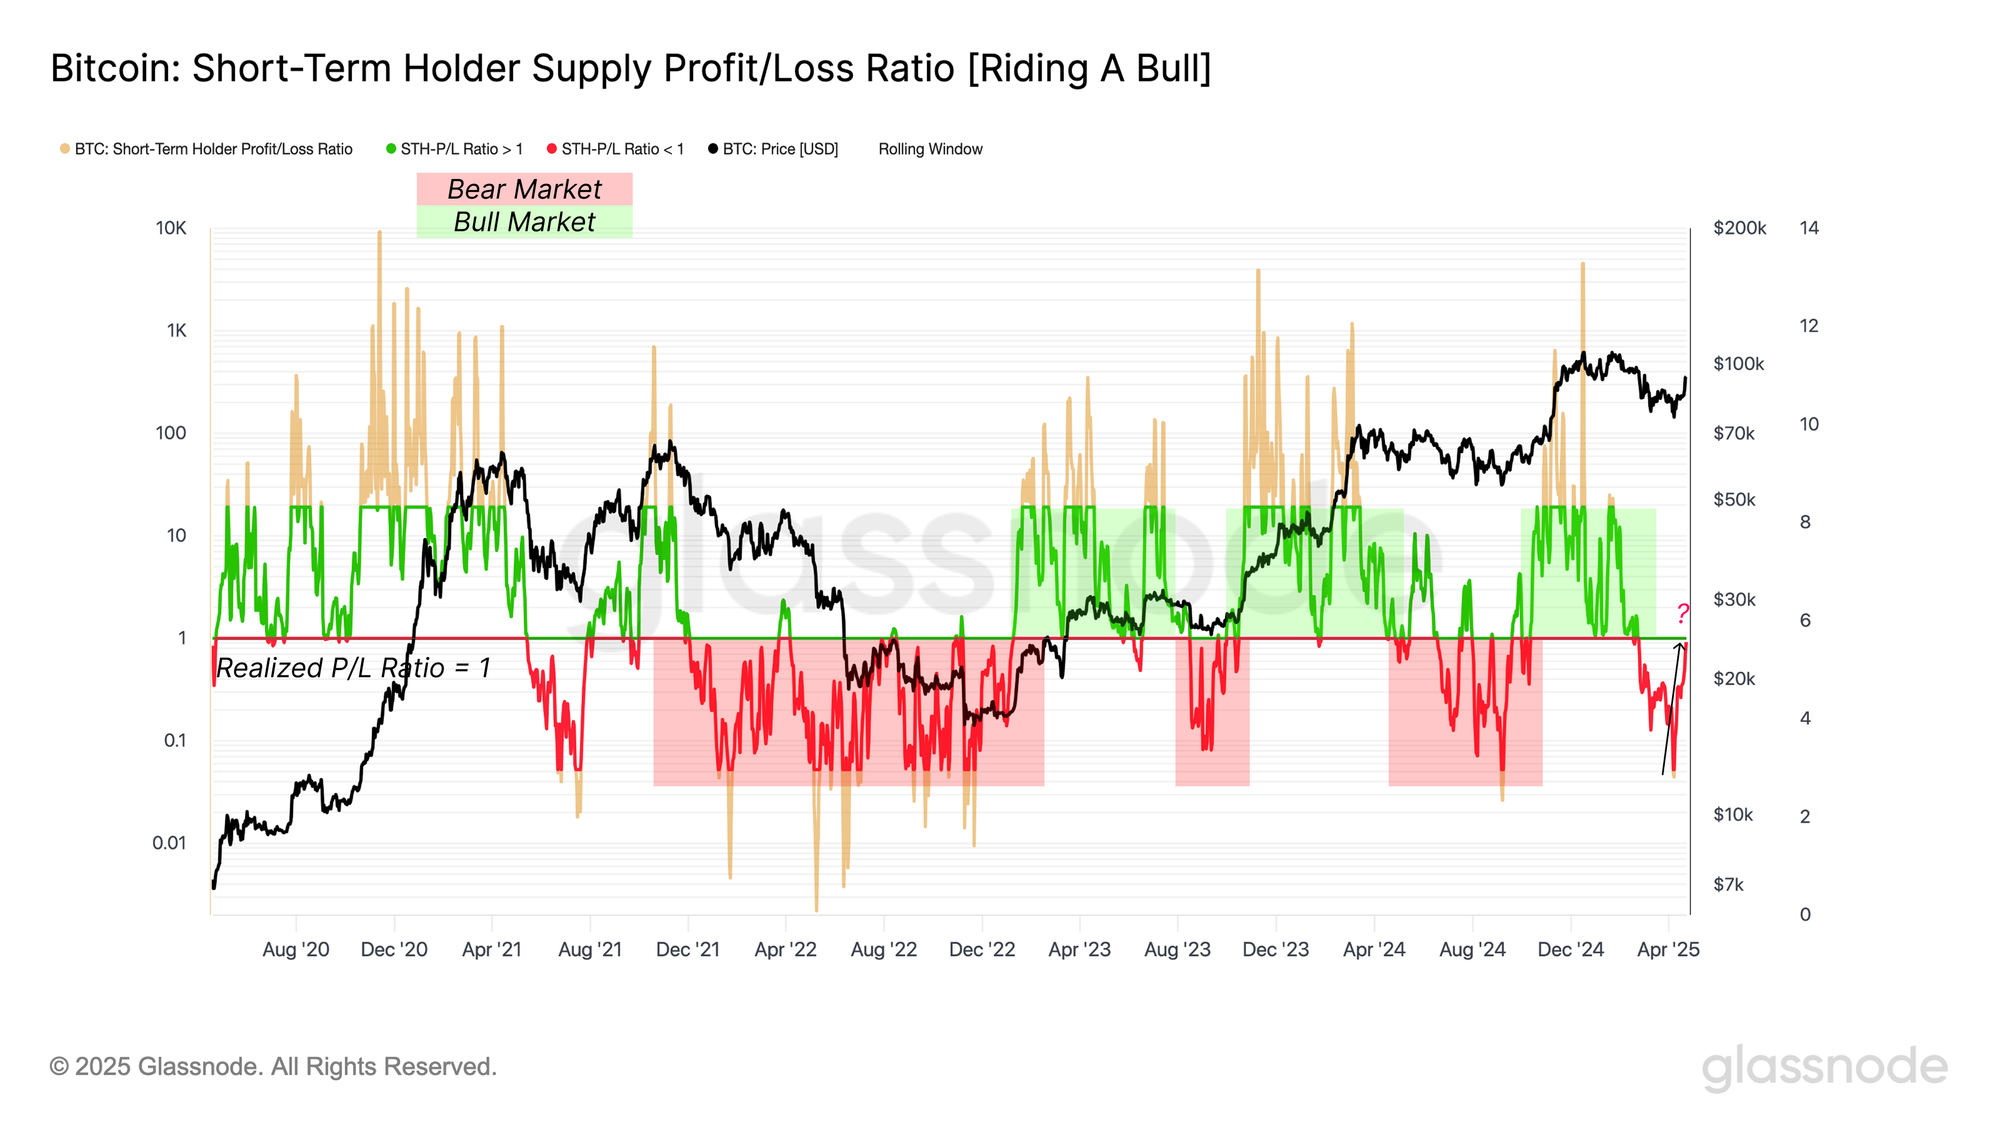
Another indicator that Bitcoin has returned to an important decision zone is the STH Supply Profit/Loss Ratio, which has recently surged back to its neutral level near 1.0. This suggests that short-term supply is more evenly split between coins in profit and loss, making this a point of balanced sentiment for this cohort.
This structure is significant, and prior bear markets have seen the STH-P/L Ratio trading well below 1, with that level acting as a resistance ceiling. Whenever this metric returns to retest 1.0 from below, it tends to correlate with the formation of a local top, as investors start to exit positions and dampen momentum.
If the market can convincingly reclaim this level and trade above 1.0, it would be a signal of a more robust recovery. Monitoring how this ratio trades over the coming weeks, especially alongside realized profit-taking behaviour, can help navigate whether the market is re-establishing a more constructive recovery out of this correction.
Profit-Taking Pressure Test
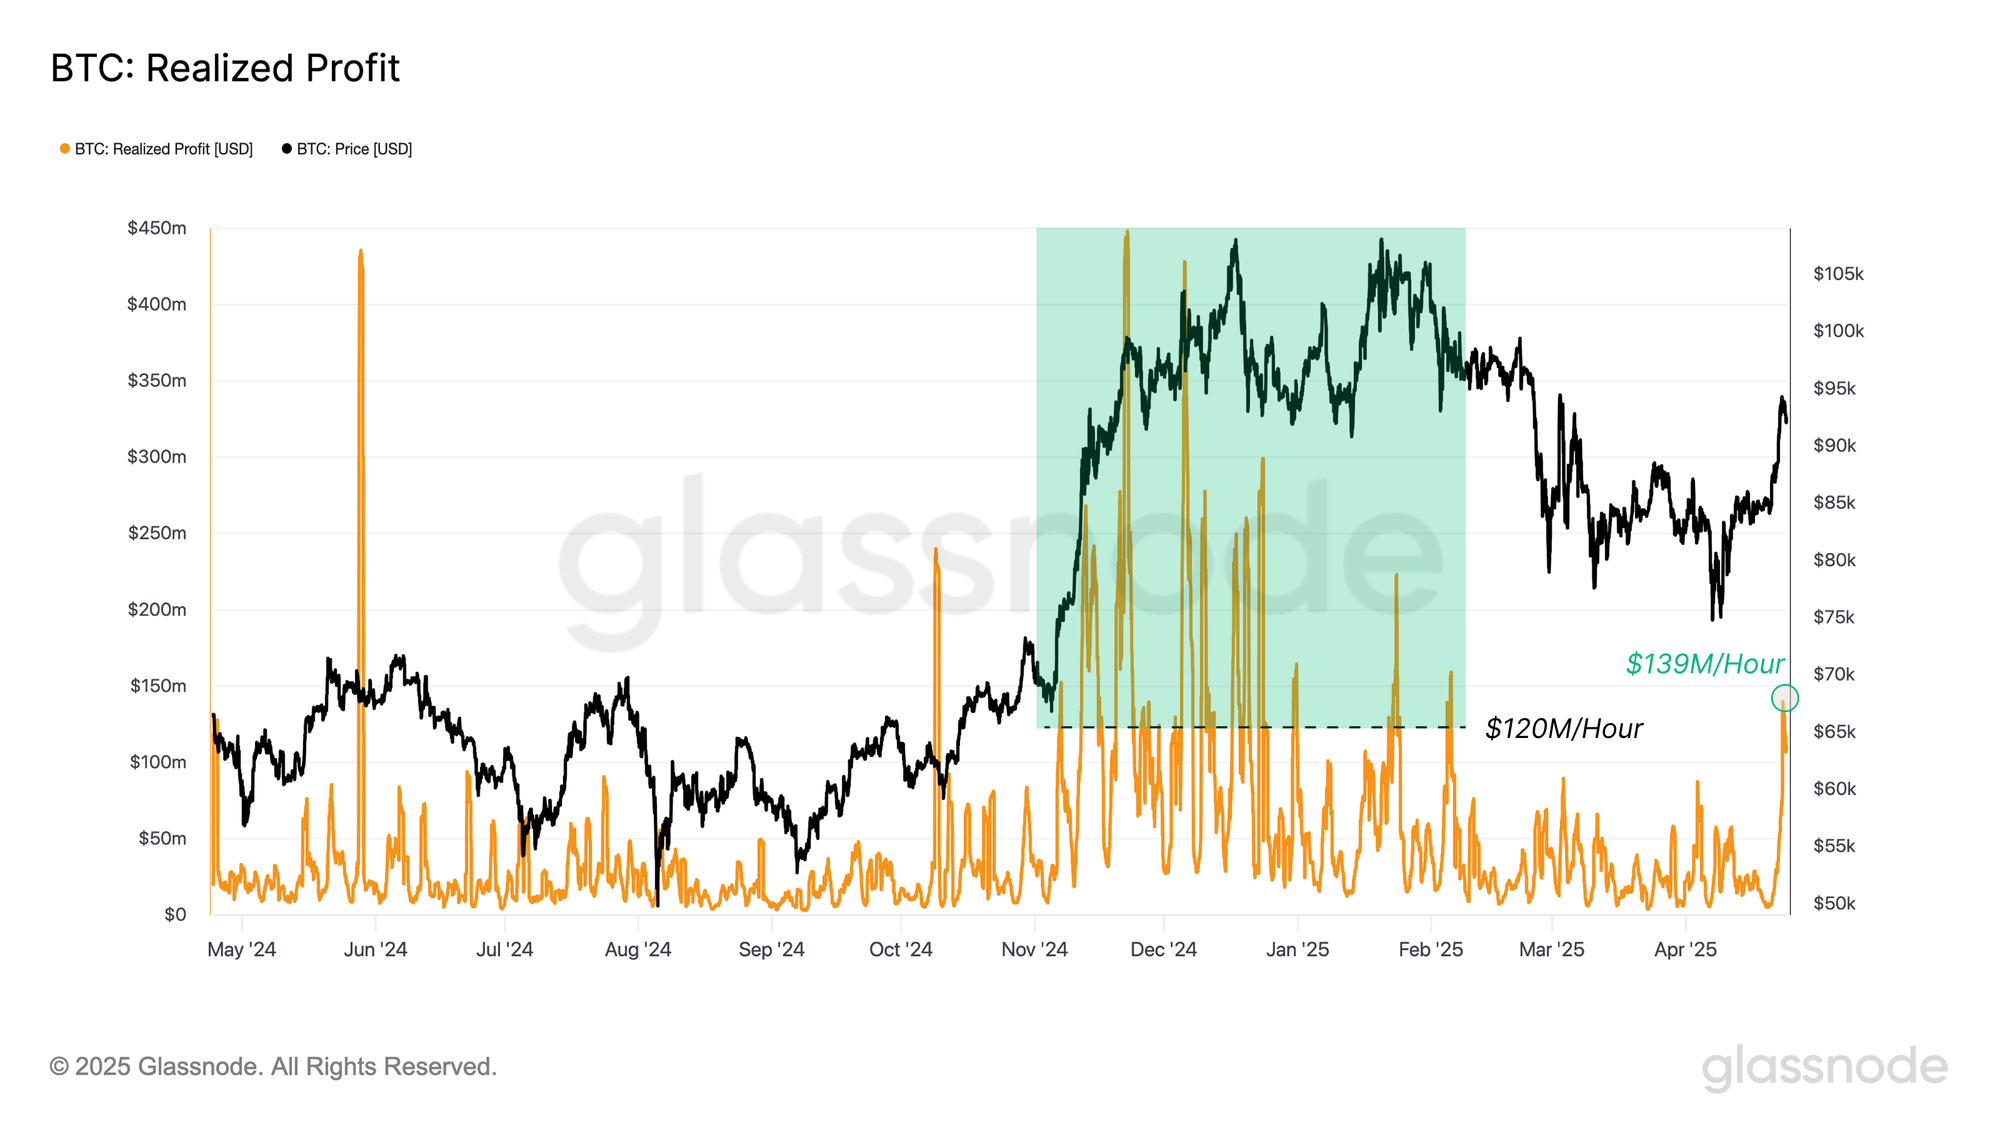
Now that we have a framework for a market which is at a decision point, profit-taking behaviour becomes a critical signal to monitor. Currently, the total Realized Profit on an hourly resolution has surged to $139.9M/hour, which is roughly 17% above its baseline of $120M/hour.
This uptick suggests that many market participants are using this rally to lock in gains. If the market can absorb this selling pressure without breaking down, it paints a more constructive picture on the road ahead.
Conversely, failure to hold these levels, under heavy profit realization, could mark this move as another dead cat bounce, which would be consistent with prior relief rallies that faded under similar conditions.
Who’s Taking Profit?
Beyond just the volume of realized gains, understanding which cohorts are realizing profit offers deeper insight into market sentiment. For this, we turn to the Spent Output Profit Ratio (SOPR) — a metric that compares the sale price of coins to their original cost basis, offering a lens into the average profit or loss multiple locked in by investors.
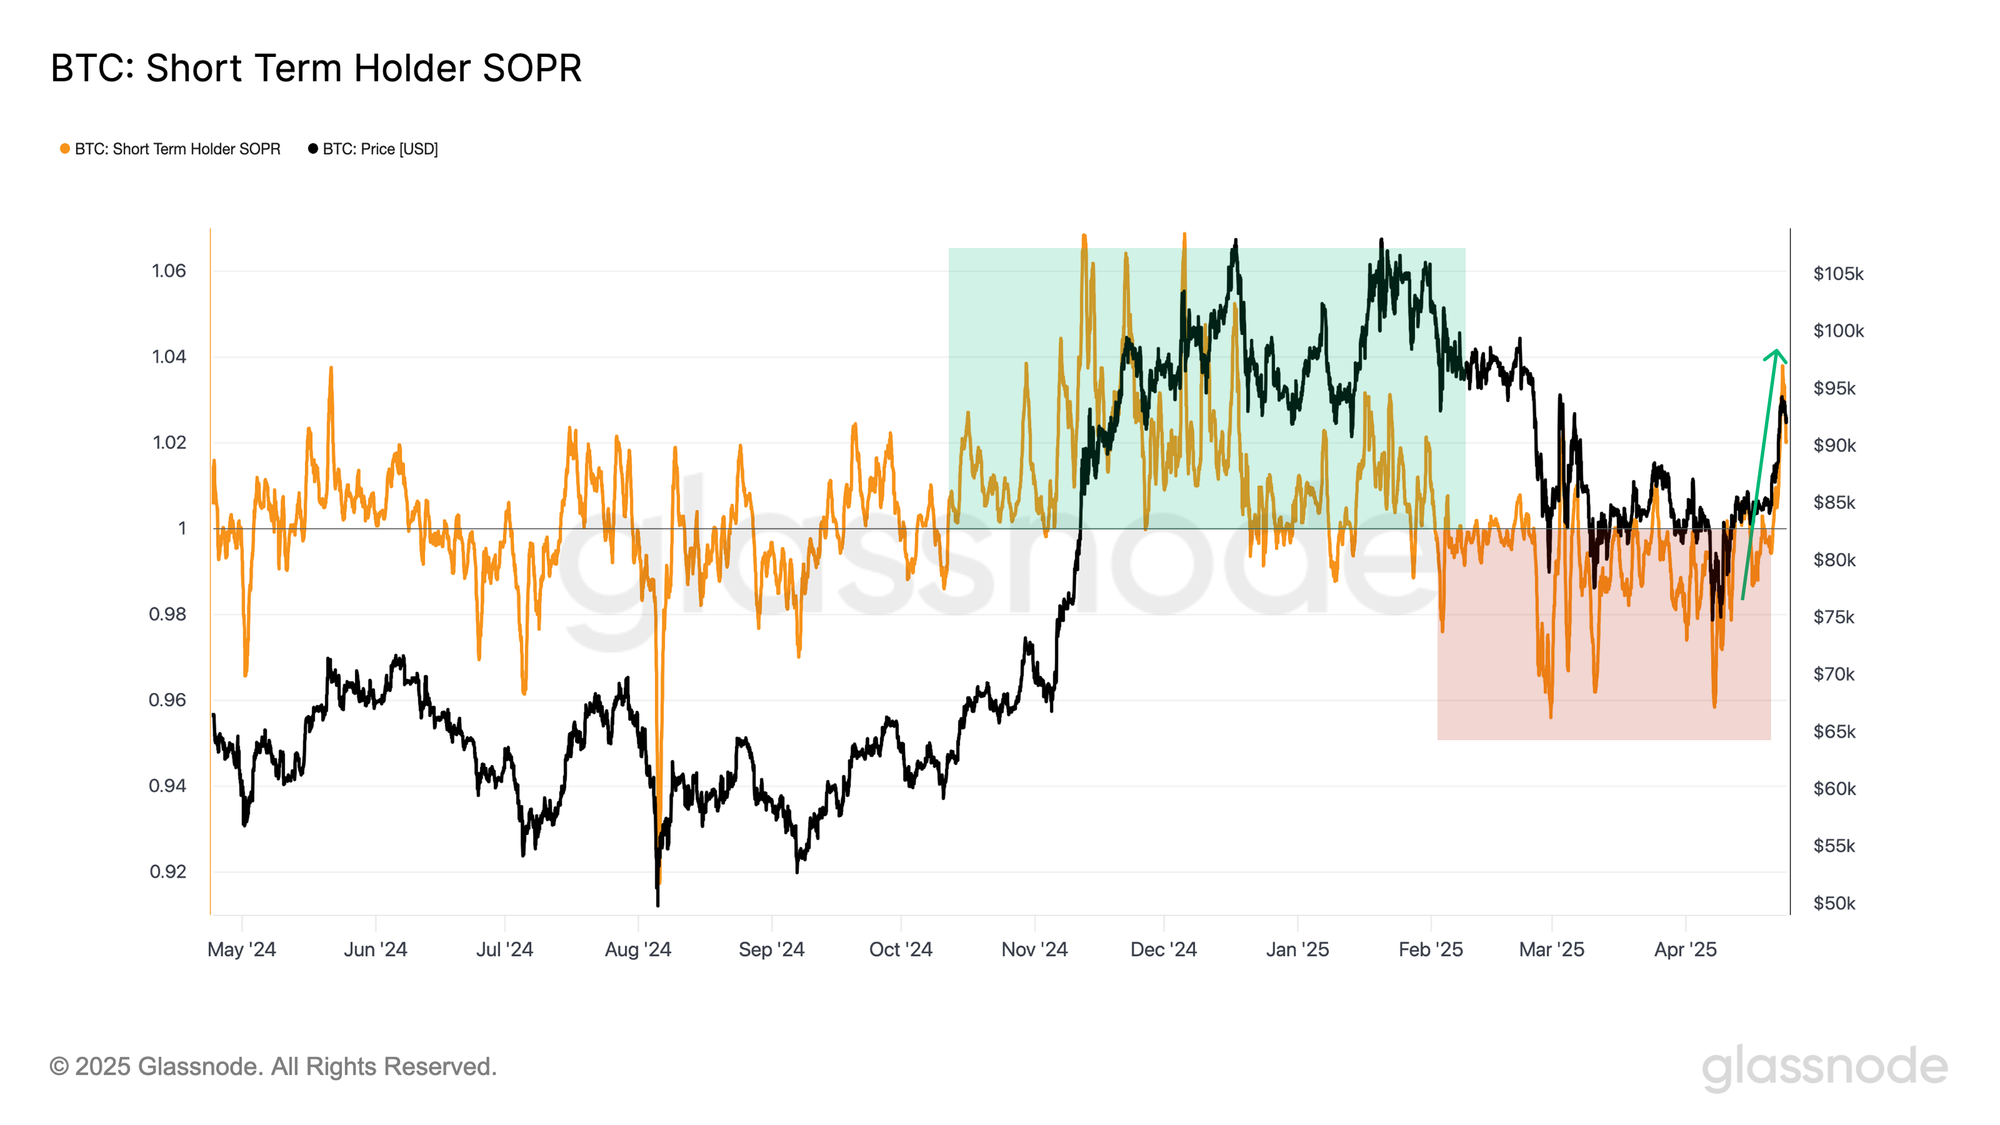
SOPR for Short-Term Holders (STH-SOPR) shows that during the recent surge, recent buyers are the primary cohort who are locking in profits.
This is the first significant break of STH-SOPR above the break-even level of 1.0 since late February, and is another relatively constructive sign of investors returning to a profitable position. Generally speaking, STH-SOPR trading consistently above 1.0 is a characteristic of bullish uptrends.
Short Side Perps
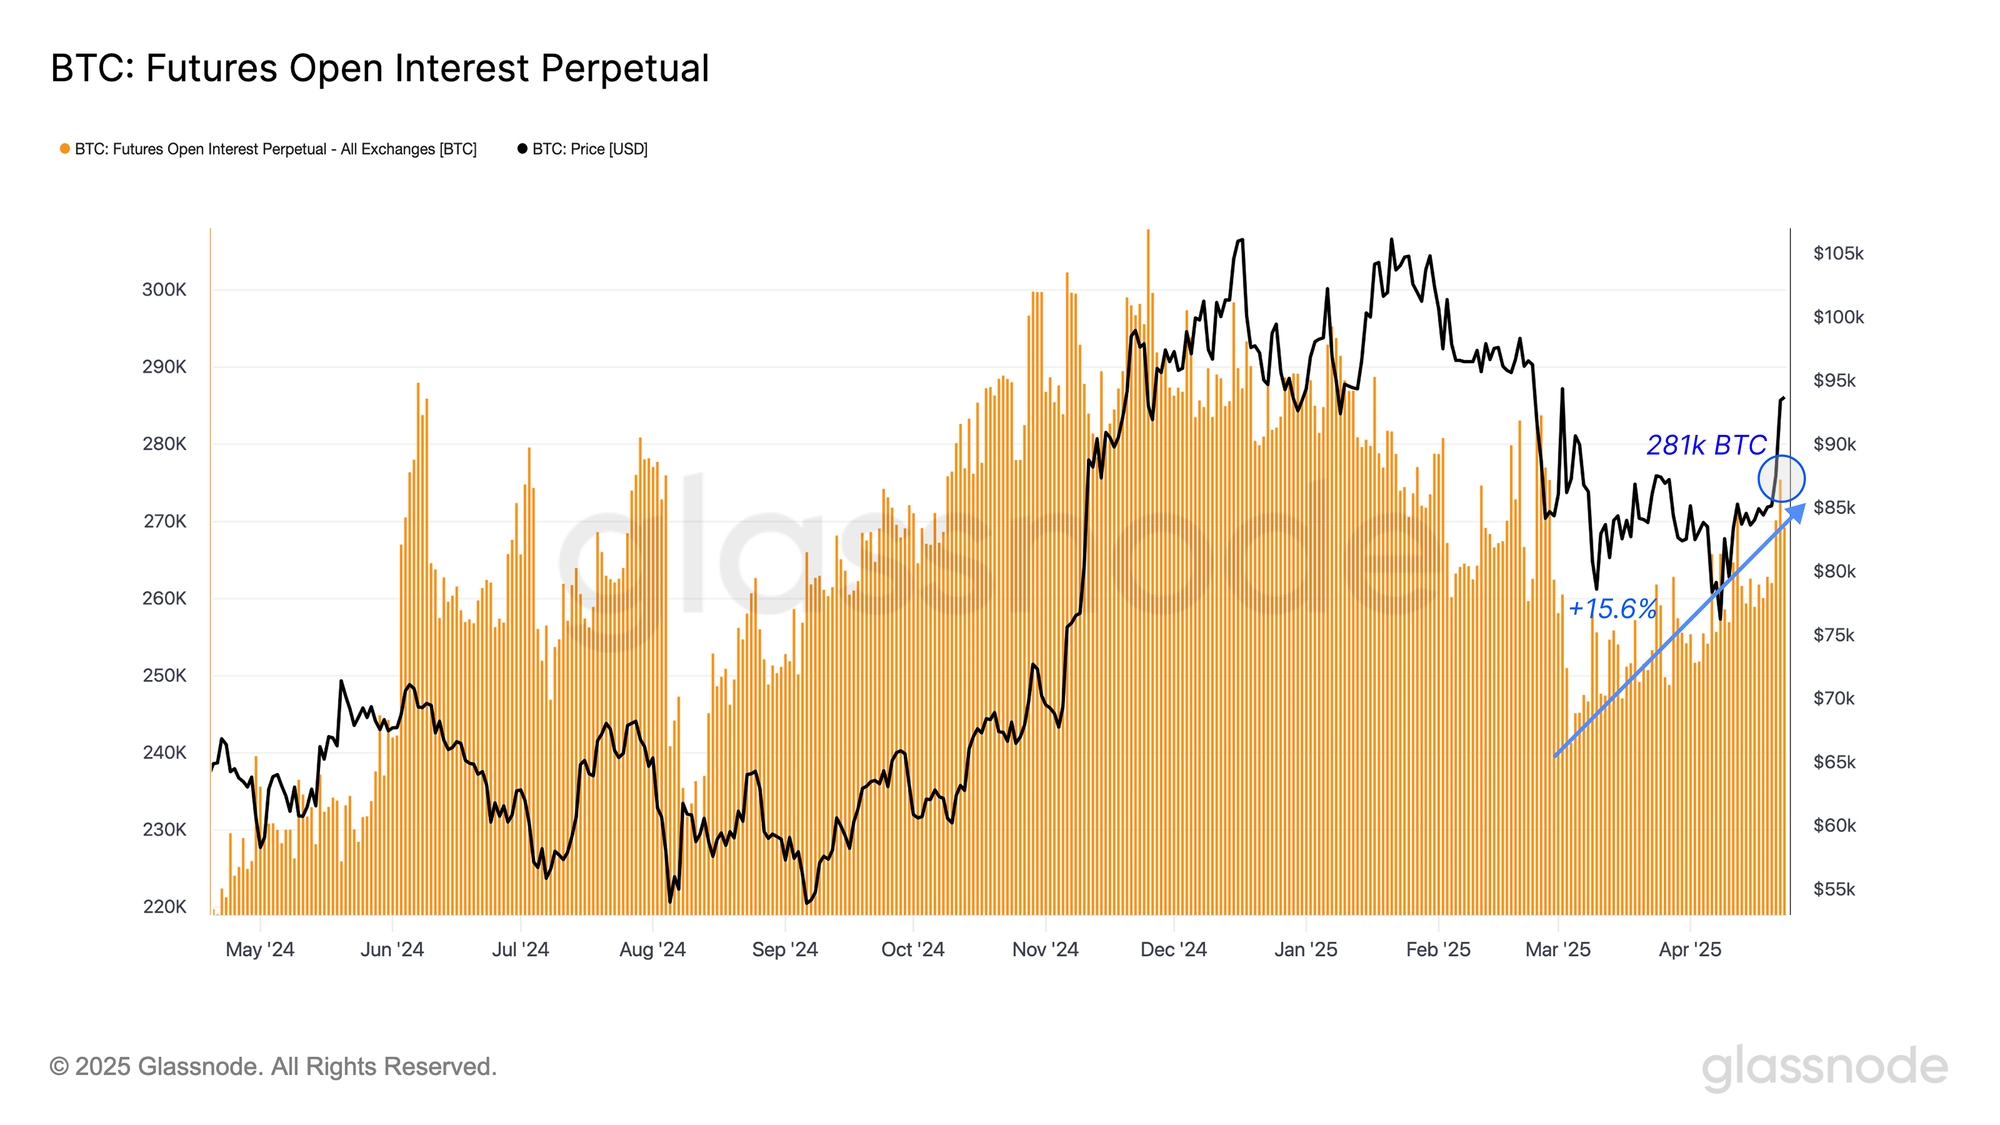
While some spot holders appear to be locking in profits, traders of perpetual swaps are tending to lean on the short side into the rally. The Open Interest of perpetual swaps has climbed sharply to 281k BTC, up ~15.6% since the low of 243k BTC set in early March.
This reflects an uptick in leverage within the derivatives markets, which can often amplify market swings if prices start to hit traders' stop-loss or liquidation zones.
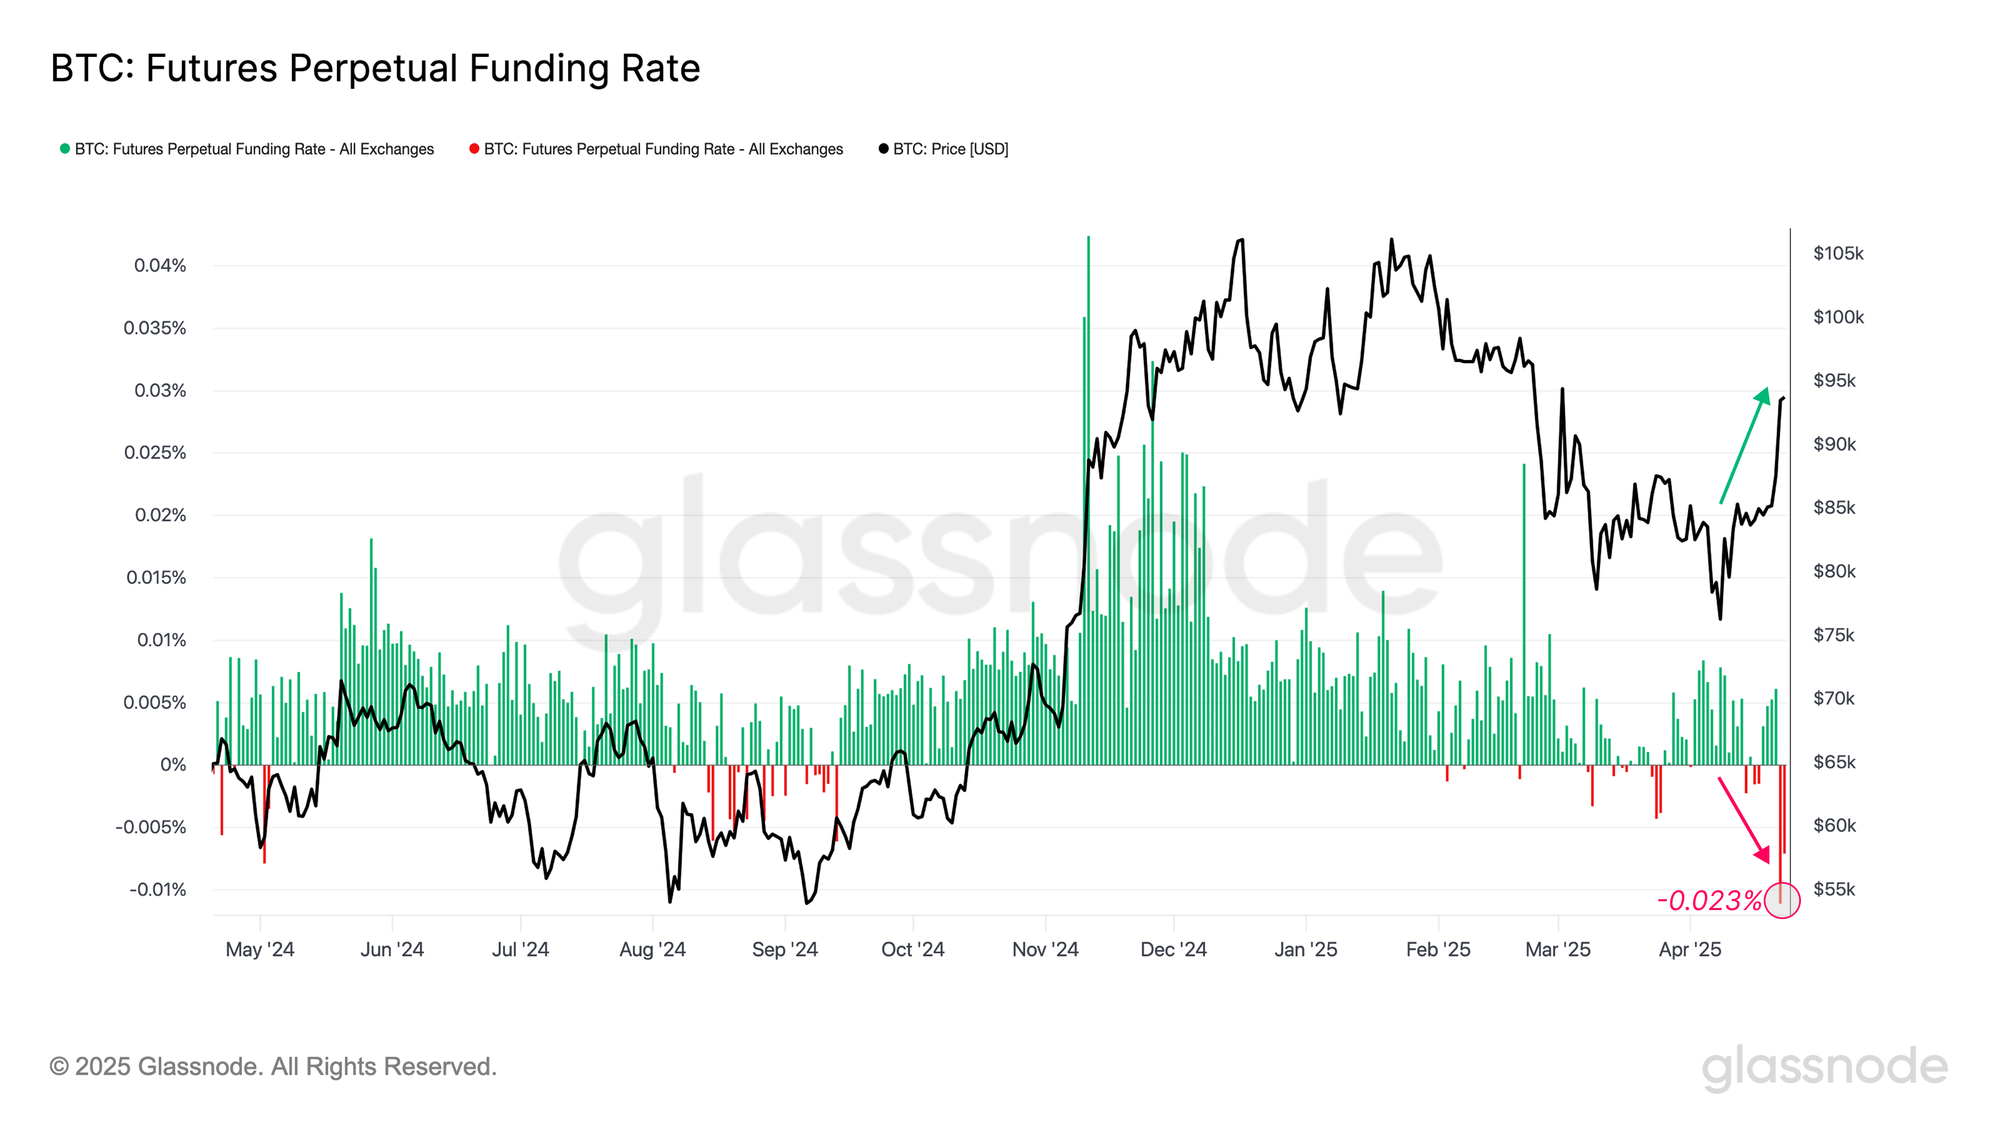
Interestingly, this surge in open interest aligns with a decline in average funding rates, which plunged to -0.023%. This indicates a growing bias toward short-side positioning, suggesting that many traders are betting against the rally, potentially viewing the recent move as overextended.
This divergence between rising open interest and negative funding sets the stage for a possible short squeeze scenario if upward momentum continues.
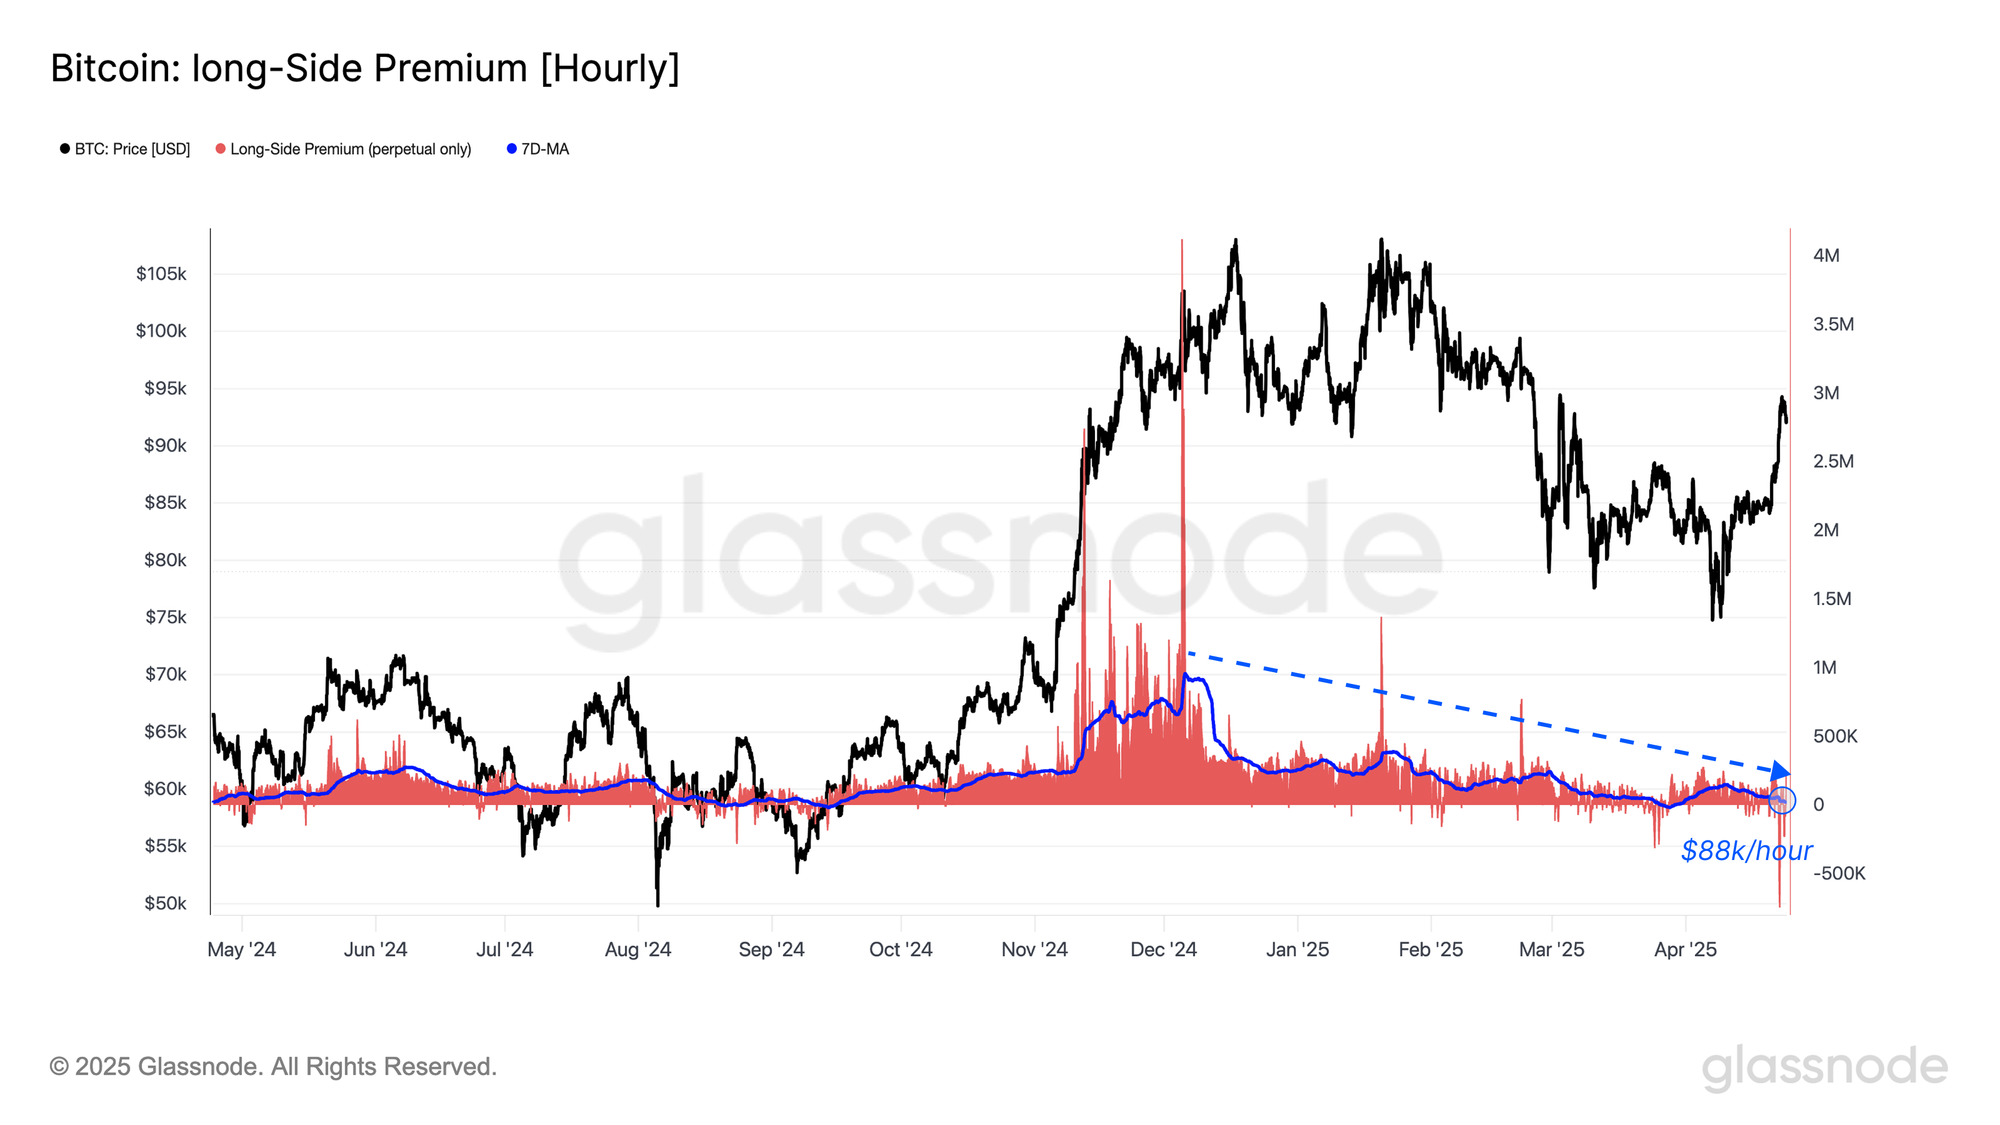
However, when zooming out to assess longer-term sentiment among perpetual swap traders, the picture turns more cautious. The 7-day moving average of long-side funding paid per hour has declined steadily, now sitting at $88k/hour and still trending lower.
This metric serves as an indicator of the appetite for sustained long exposure, reflecting the dollar value paid by traders who are on the ‘consensus’ side of the market. The current downtrend in premium signals that the majority of positions are indeed shifting towards the short side, which creates an incentive for market makers to take the long side to collect the funding rate interest.
Institutional Interest
ETF flows have become an important proxy for gauging institutional investor sentiment and demand this cycle. Tracking the flows in and out of the ETF products offers a unique lens into the conviction and participation of larger capital allocators.
During Bitcoin’s recent leg up to $94k, the U.S. spot Bitcoin ETFs recorded a staggering $1.54B in net inflows in a single day, one of the highest daily figures since their inception. This influx sends a powerful signal that demand for Bitcoin may be starting to come back online.
Is It Still Bitcoin Season?
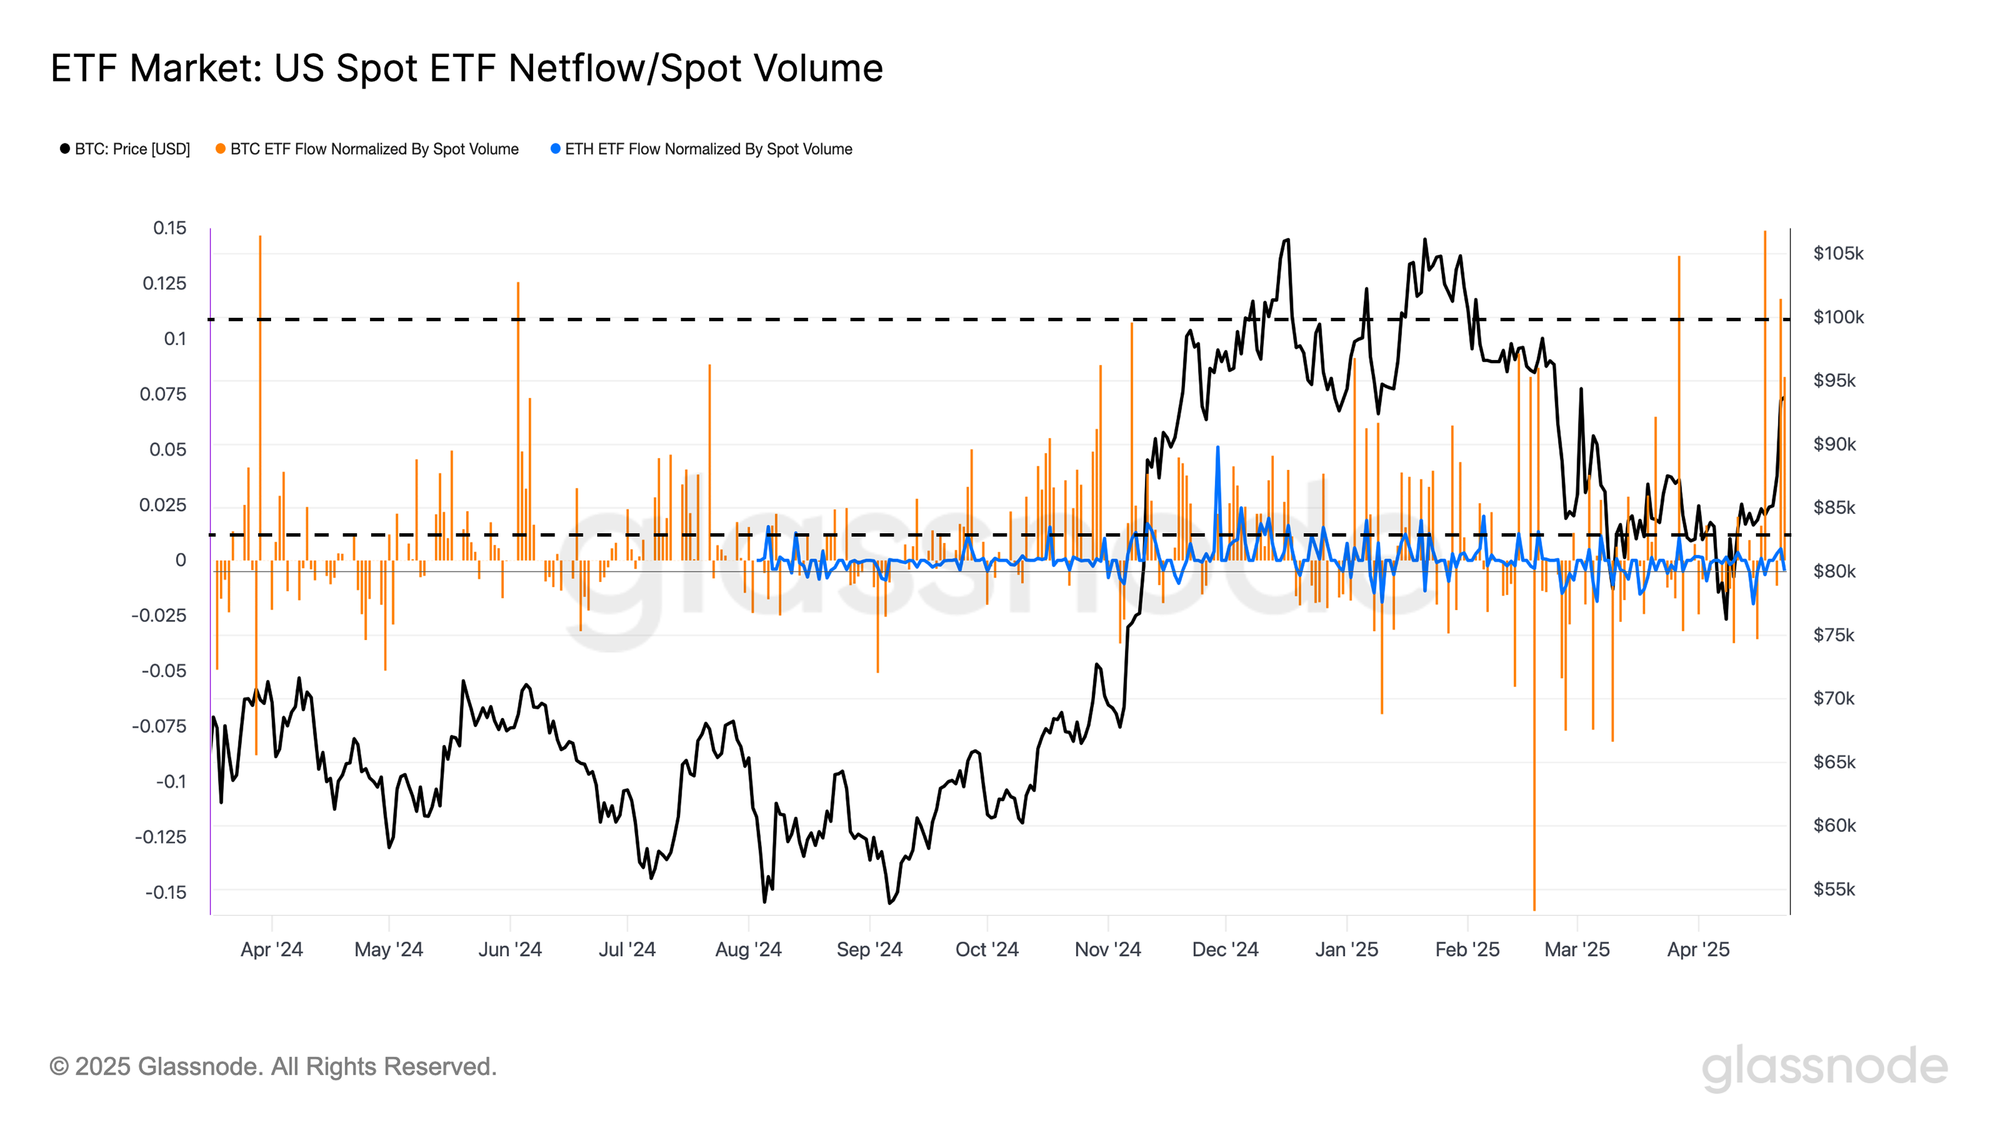
Whilst Bitcoin has seen a strong price rebound, many have questioned why Ethereum hasn’t followed suit to the same extent. One answer lies in a comparison of ETF flows, where we normalize and adjust by each asset’s relative spot volume.
Over the past two weeks, the Bitcoin ETFs have seen two distinct inflow waves, each exceeding 10% of BTC’s spot volume, and underscoring a relatively robust institutional demand profile.
By contrast, Ethereum ETF flows have remained quite subdued, with inflows of below 1% of ETH’s spot volume. This stark divergence highlights the disparity in institutional demand between the two assets, which paints a likely reason why ETH continues to lag behind BTC’s recent performance.
Conclusion & Discussion
Bitcoin’s surge back above $94k reflects a mix of macro optimism and shifting investor sentiment. Positive signals around U.S.–China tariffs triggered a rally that reclaimed the Short-Term Holder Cost Basis, and lifted the Percent Supply in Profit to 87.3%. Several metrics allude to a constructive recovery being underway for Bitcoin, with an added element of a short squeeze brewing in futures markets.
Institutional demand may be returning for Bitcoin, with the ETFs seeing $1.54B in net inflows in a single day. The market is very much at a decision point, and the key level to watch is the Short—Term Holder cost basis, which often delineates bullish and bearish market structure. The bulls need to drive the market above this price model, and keep it there.
Disclaimer: This report does not provide any investment advice. All data is provided for informational, and educational purposes only. No investment decision shall be based on the information provided here and you are solely responsible for your own investment decisions.
Exchange balances presented are derived from Glassnode’s comprehensive database of address labels, which are amassed through both officially published exchange information and proprietary clustering algorithms. While we strive to ensure the utmost accuracy in representing exchange balances, it is important to note that these figures might not always encapsulate the entirety of an exchange’s reserves, particularly when exchanges refrain from disclosing their official addresses. We urge users to exercise caution and discretion when utilizing these metrics. Glassnode shall not be held responsible for any discrepancies or potential inaccuracies.
Please read our Transparency Notice when using exchange data.
- Join our Telegram channel.
- For on-chain metrics, dashboards, and alerts, visit Glassnode Studio.