The Fourth Halving
The fourth Bitcoin Halving has occurred, leading to a 50% reduction in supply inflation and an inherent increase in issuance scarcity. In this edition, we explore the evolution of the Bitcoin network across Epochs with respect to price performance, and fundamental network metrics.


Executive Summary
- The Fourth Bitcoin Halving has occurred, reducing the annualized inflation rate of the Bitcoin Supply by 50%, and decisively surpassing Gold in terms of issuance scarcity.
- When measuring across Halving Epochs, diminishing growth rates are noted across multiple network statistics, whilst the absolute value of these measures continues to climb to new ATHs.
- Investor profitability has been bolstered by a rising spot price and a decisive ATH break, which has dampened the 50% reduction in revenue for miners relative to the start of the year.
A Disinflationary Supply
The Bitcoin supply curve is deterministic due to the ingenious mining algorithm called the Difficulty Adjustment. This protocol adjusts the difficulty of the Bitcoin mining process such that no matter how few, or how many mining rigs are applied, the average block interval remains anchored at around 600-seconds (10mins).
Every 210,000 blocks (roughly a 4 year time period), a pre-determined reduction in issuance occurs, reducing the newly minted BTC coins by 50%. The fourth Bitcoin Halving took place over the weekend, seeing the block subsidy decline from 6.25BTC to 3.125BTC per block, or an approximate issuance of 450 BTC per day (for 144 blocks mined).
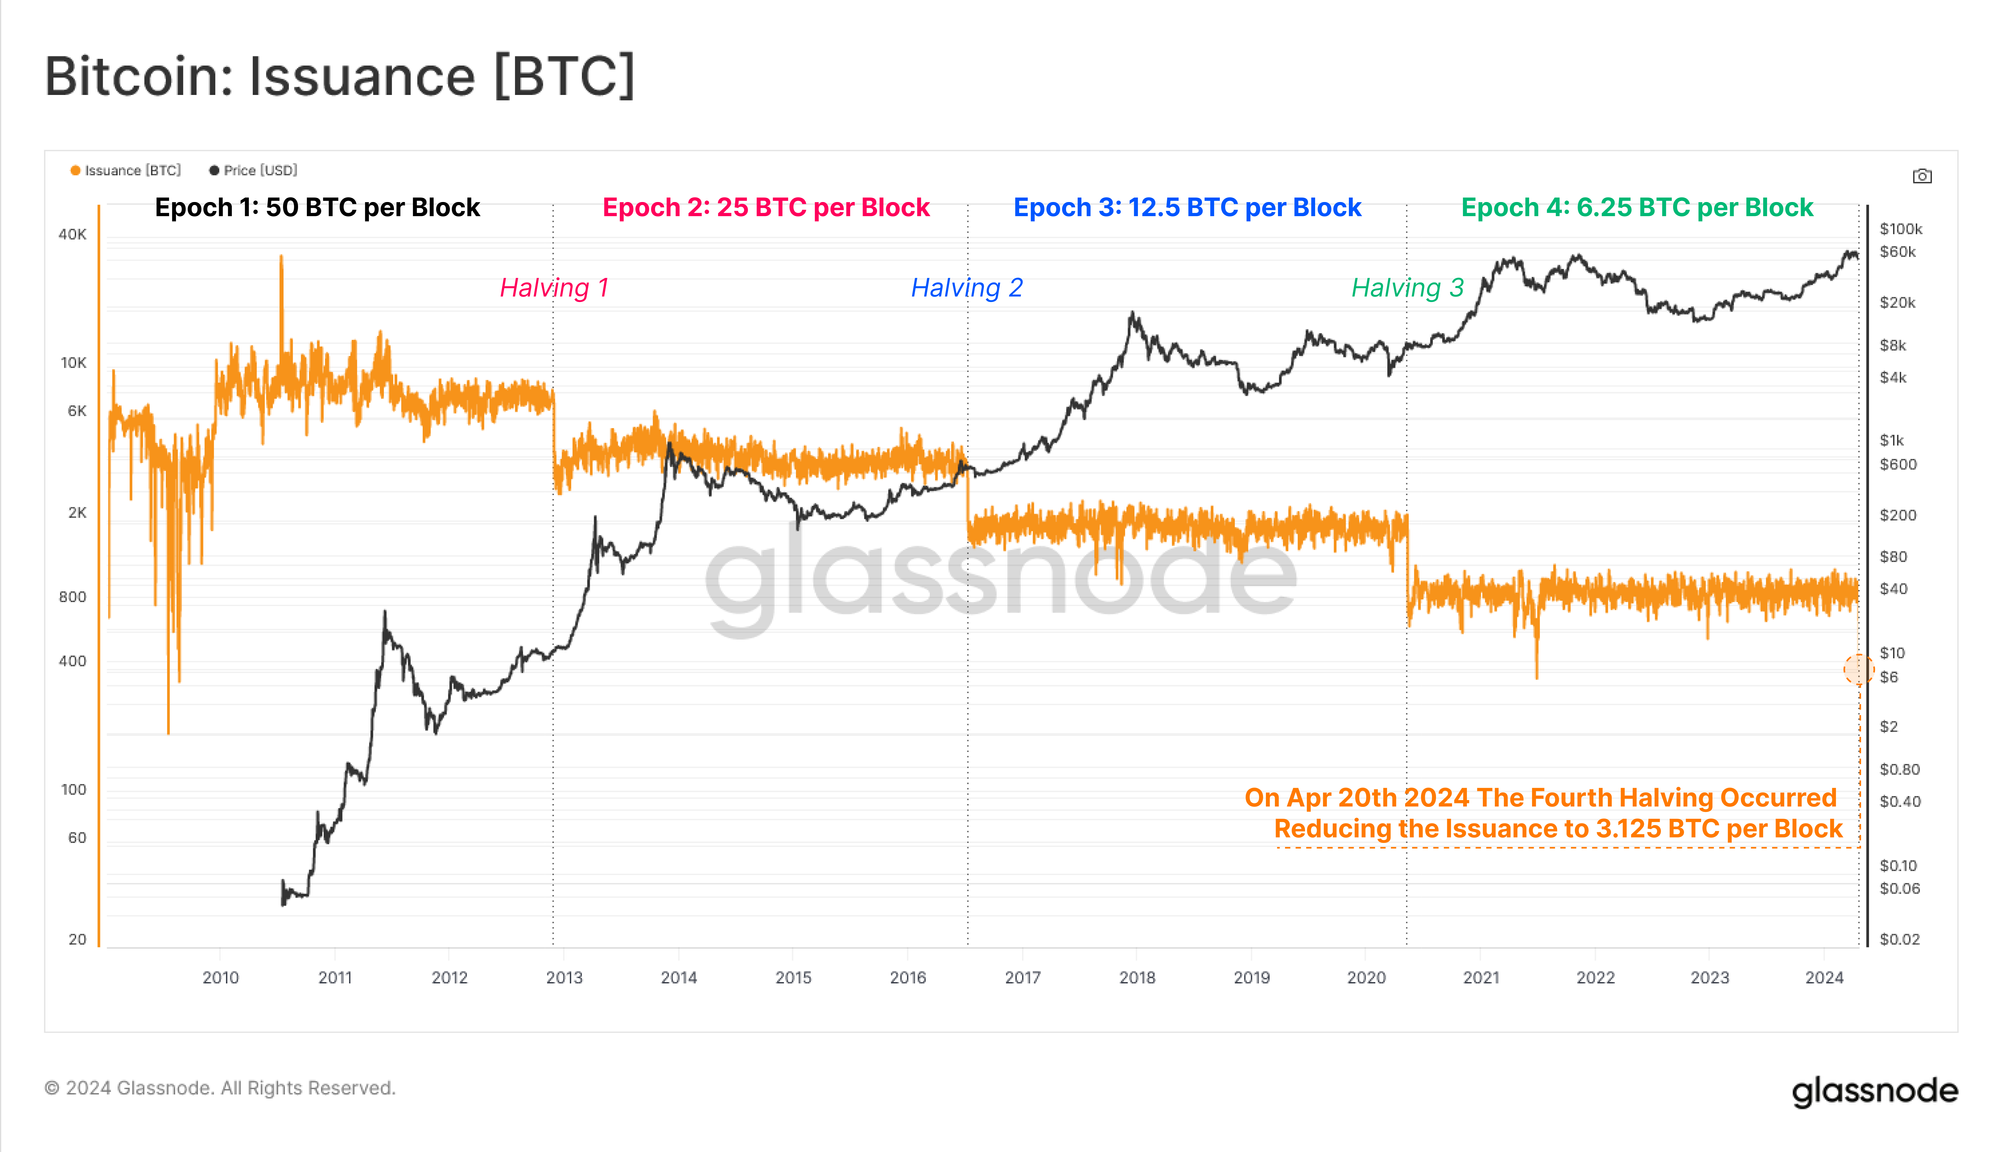
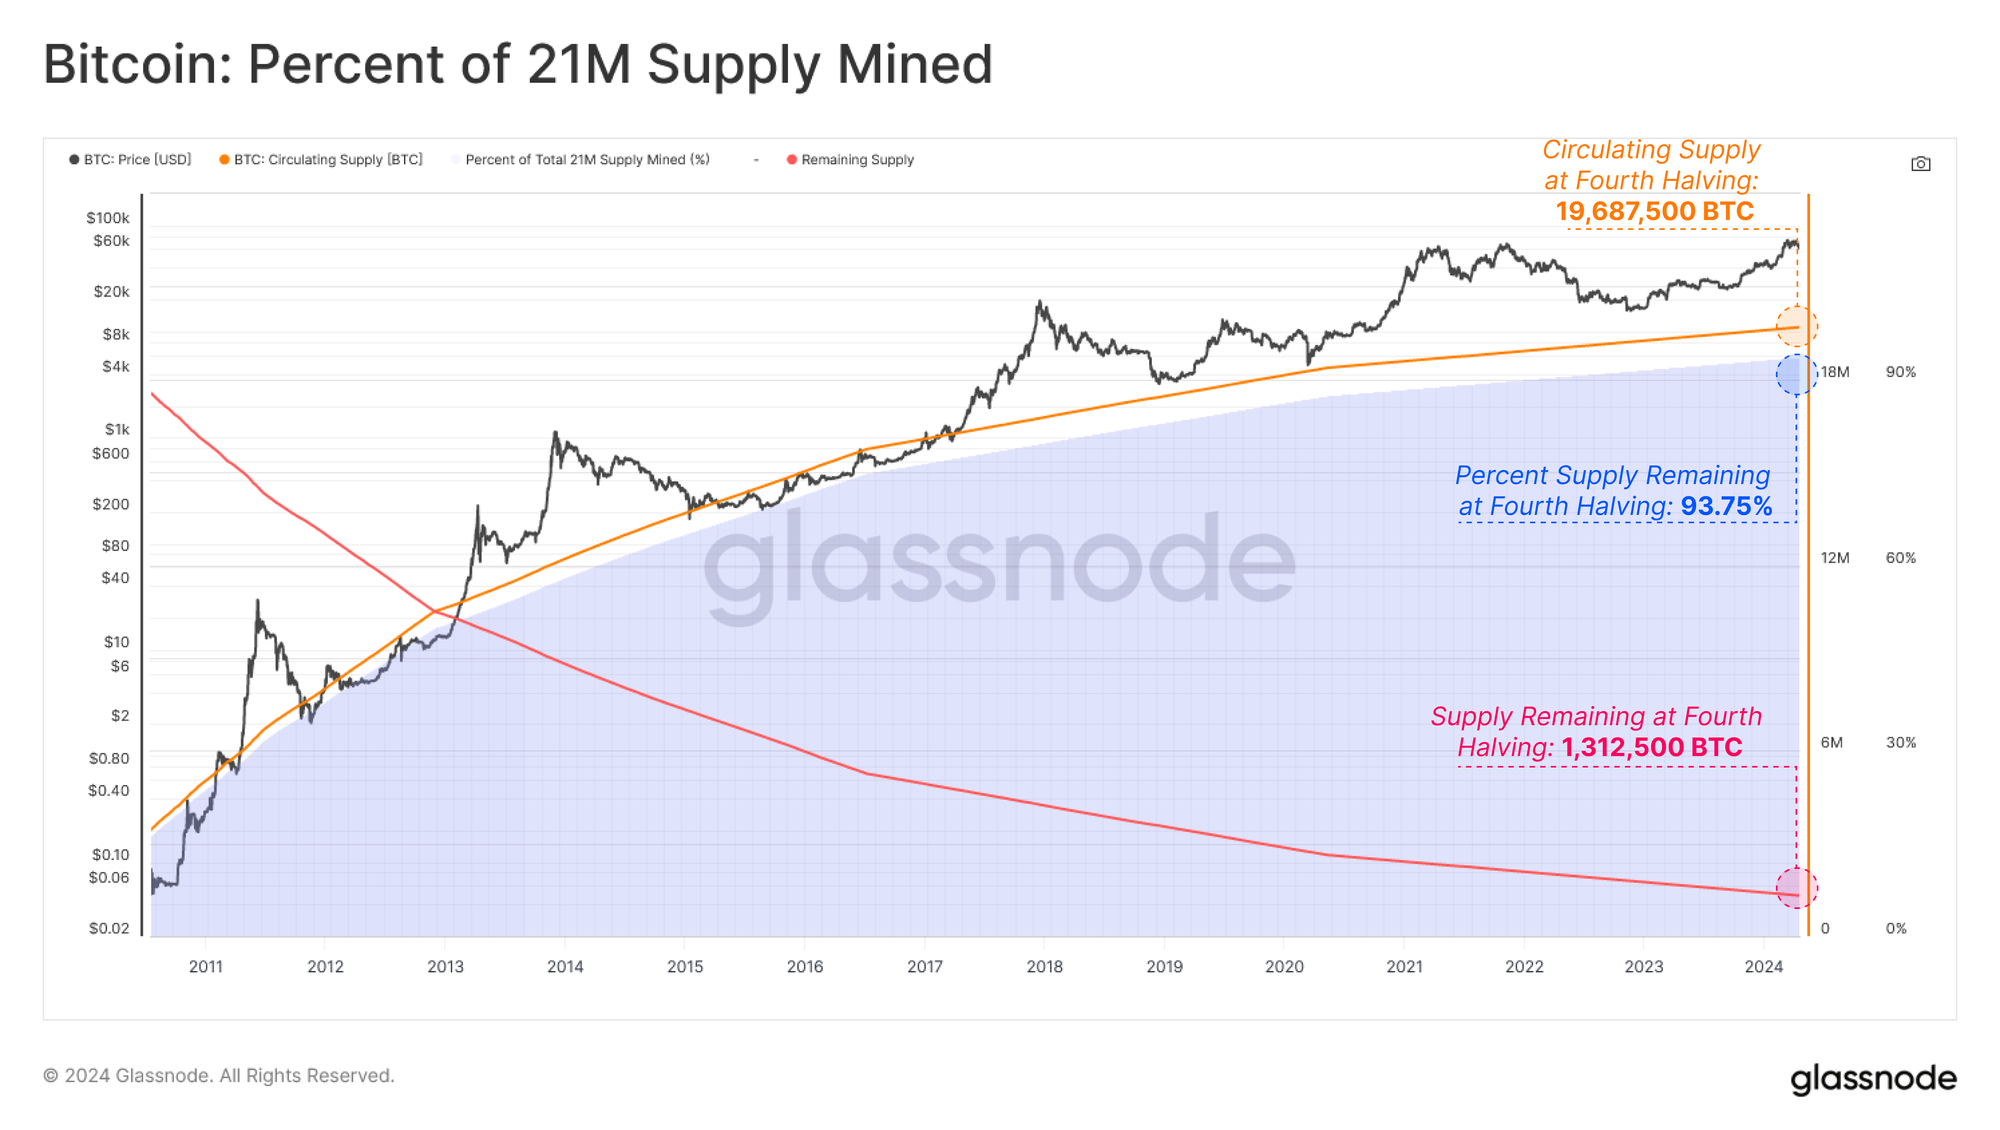
Entering the Fourth Epoch, 19,687,500 BTC has been mined and issued, equivalent to 93.75% of the terminal supply of 21M BTC. Thus there remains only 1,312,500 BTC to issued over the next 126 years, with 656,600 (3.125%) being issued across our current Epoch. Interestingly, each halving represents a point where:
- The percent of supply remaining equals the new block subsidy (3.125 BTC/block vs 3.125% remaining).
- 50% of the remaining supply (1.3125M BTC) will be mined between the fourth and fifth halving.
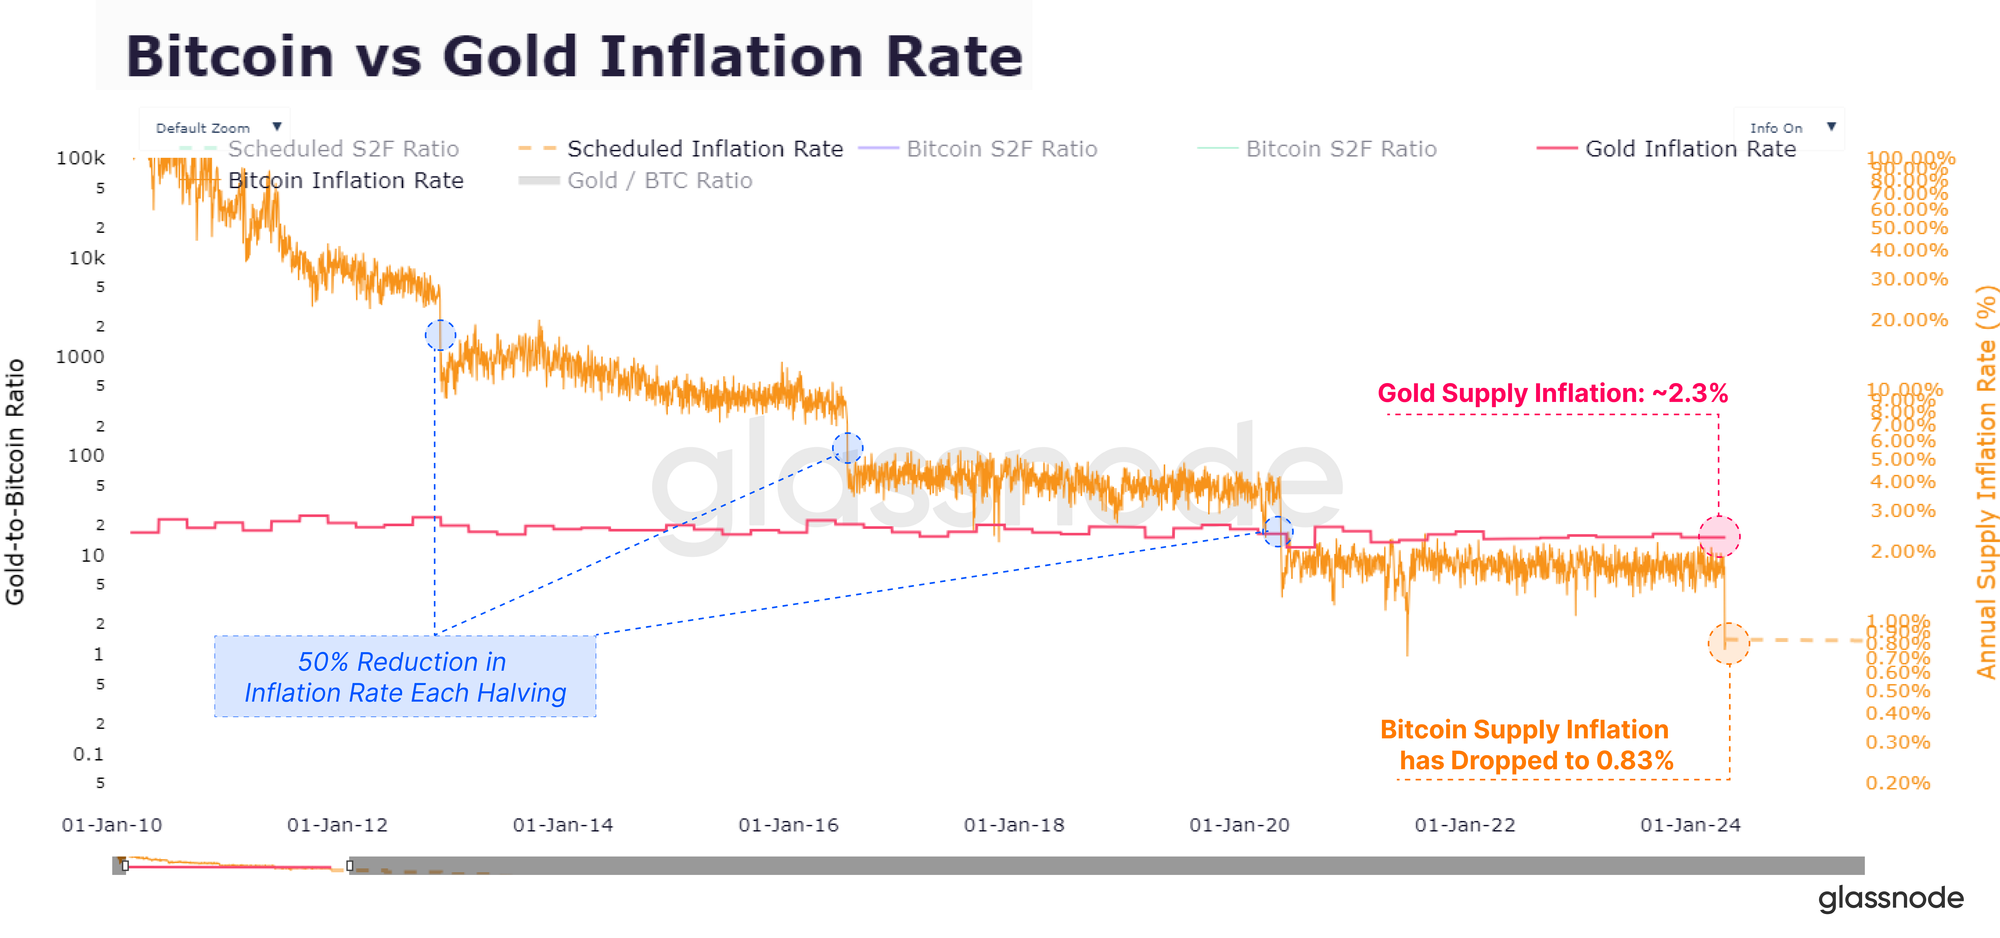
With the block subsidy halving every 210,000 blocks, the inflation rate is also halved roughly every 4 years. This puts the new annualized inflation rate of the Bitcoin supply at a value of 0.85%, down from 1.7% in the prior epoch.
The fourth halving also marks a significant milestone in the comparison of Bitcoin to Gold as for the first time in history, Bitcoin’s steady-state issuance rate (0.83%) becomes lower than Gold (~2.3%), marking a historic handover in the title of scarcest asset.
Keeping Perspective
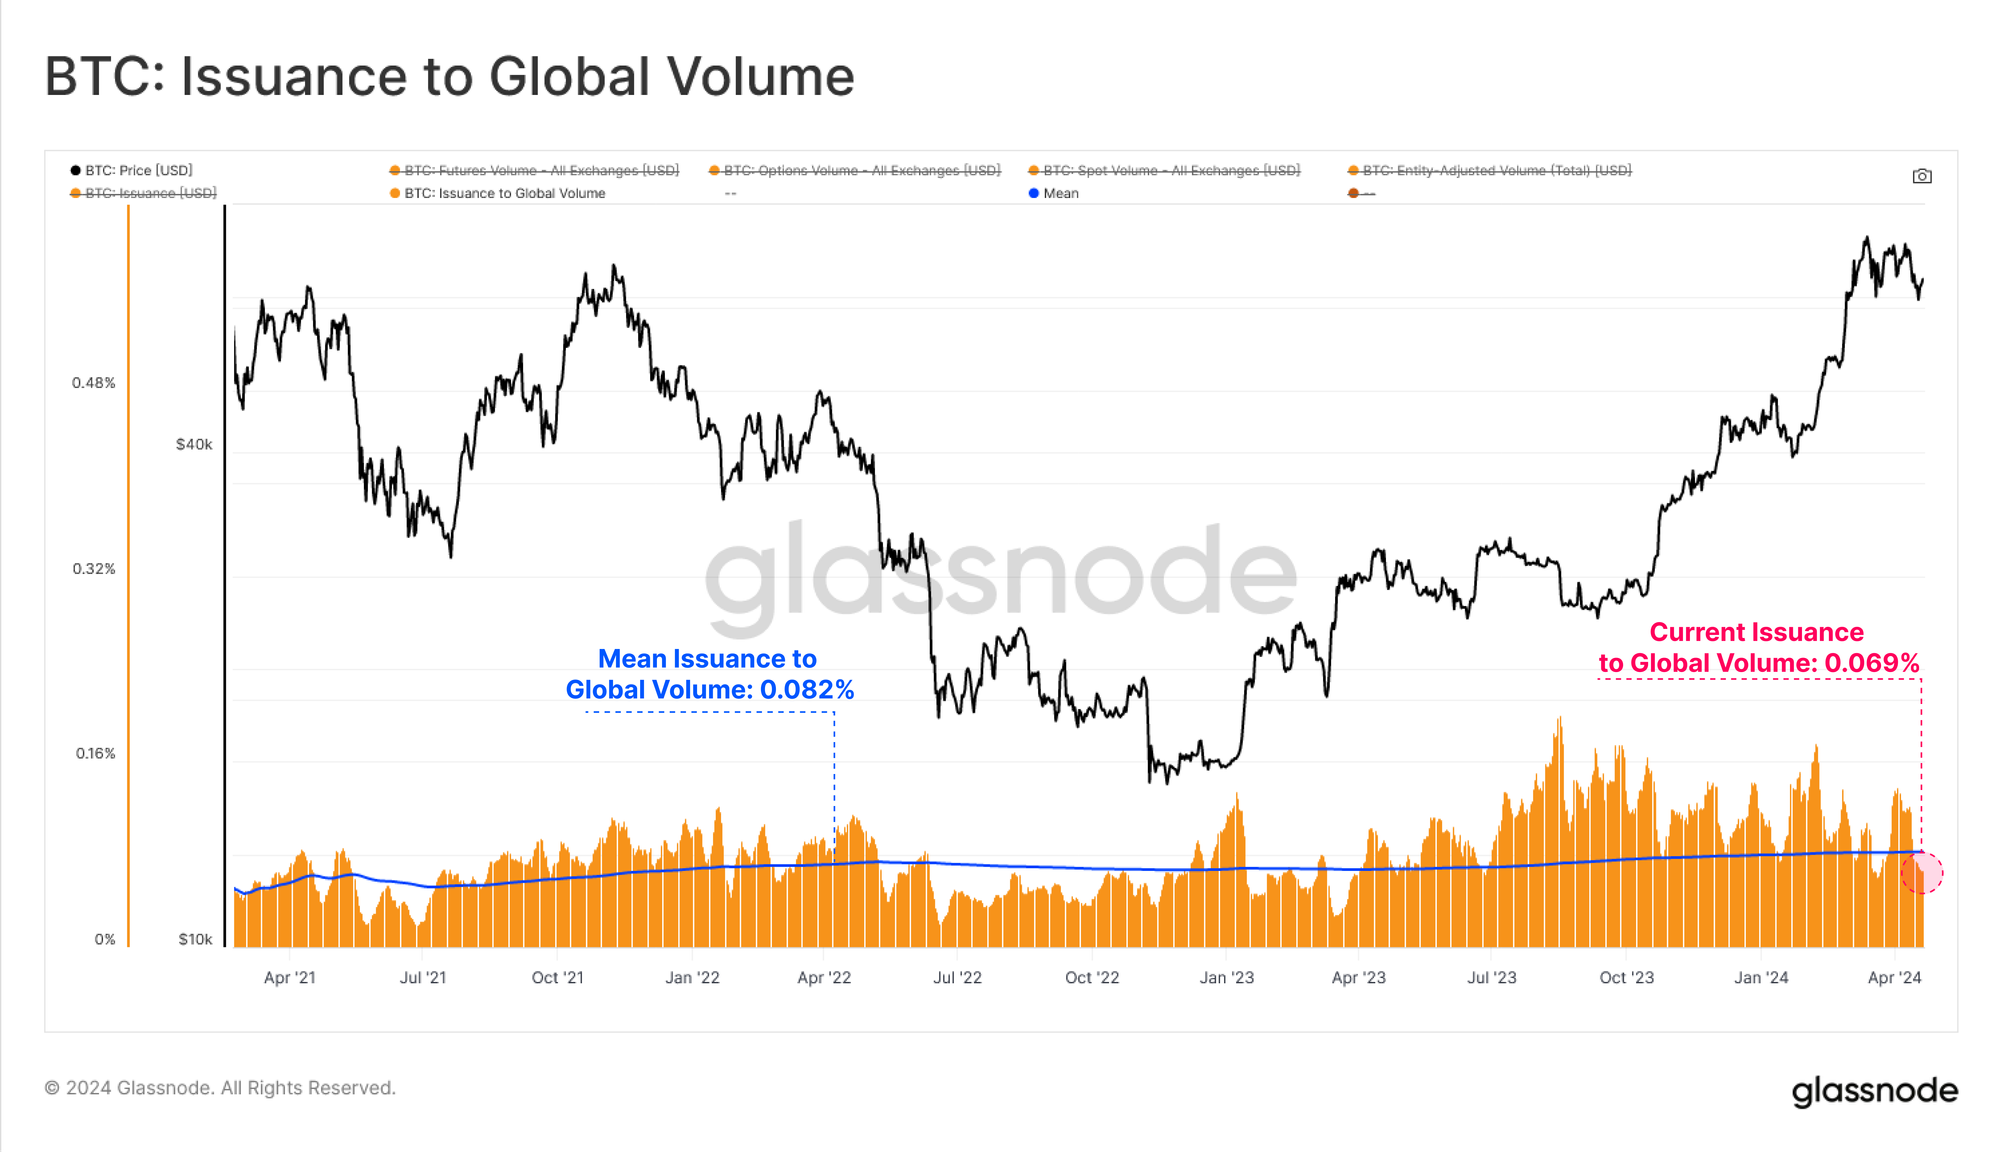
It is important however to keep the scale of the halving in perspective. When assessing the relative impact of the halving on market dynamics, the volume of freshly minted coins does remain very small compared to the global trade volume within the Bitcoin ecosystem.
Issuance is a fraction of the on-chain transfer volumes, spot volume and derivatives volume we see today, and is currently equivalent to less than 0.1% of the aggregate capital moved and traded on any given day.
Thus the impact that Bitcoin halvings have on the available traded supply is diminishing across cycles, not only due to the reduction in mined coins, but also as the size of the asset and ecosystem expand around it.
Grounding Expectations
The Halving is an important and well publicised event, naturally leading to heightened speculation around its impact on price action. It can be a useful to balance our expectations against historical precedence, and create loose boundaries based upon past performance.
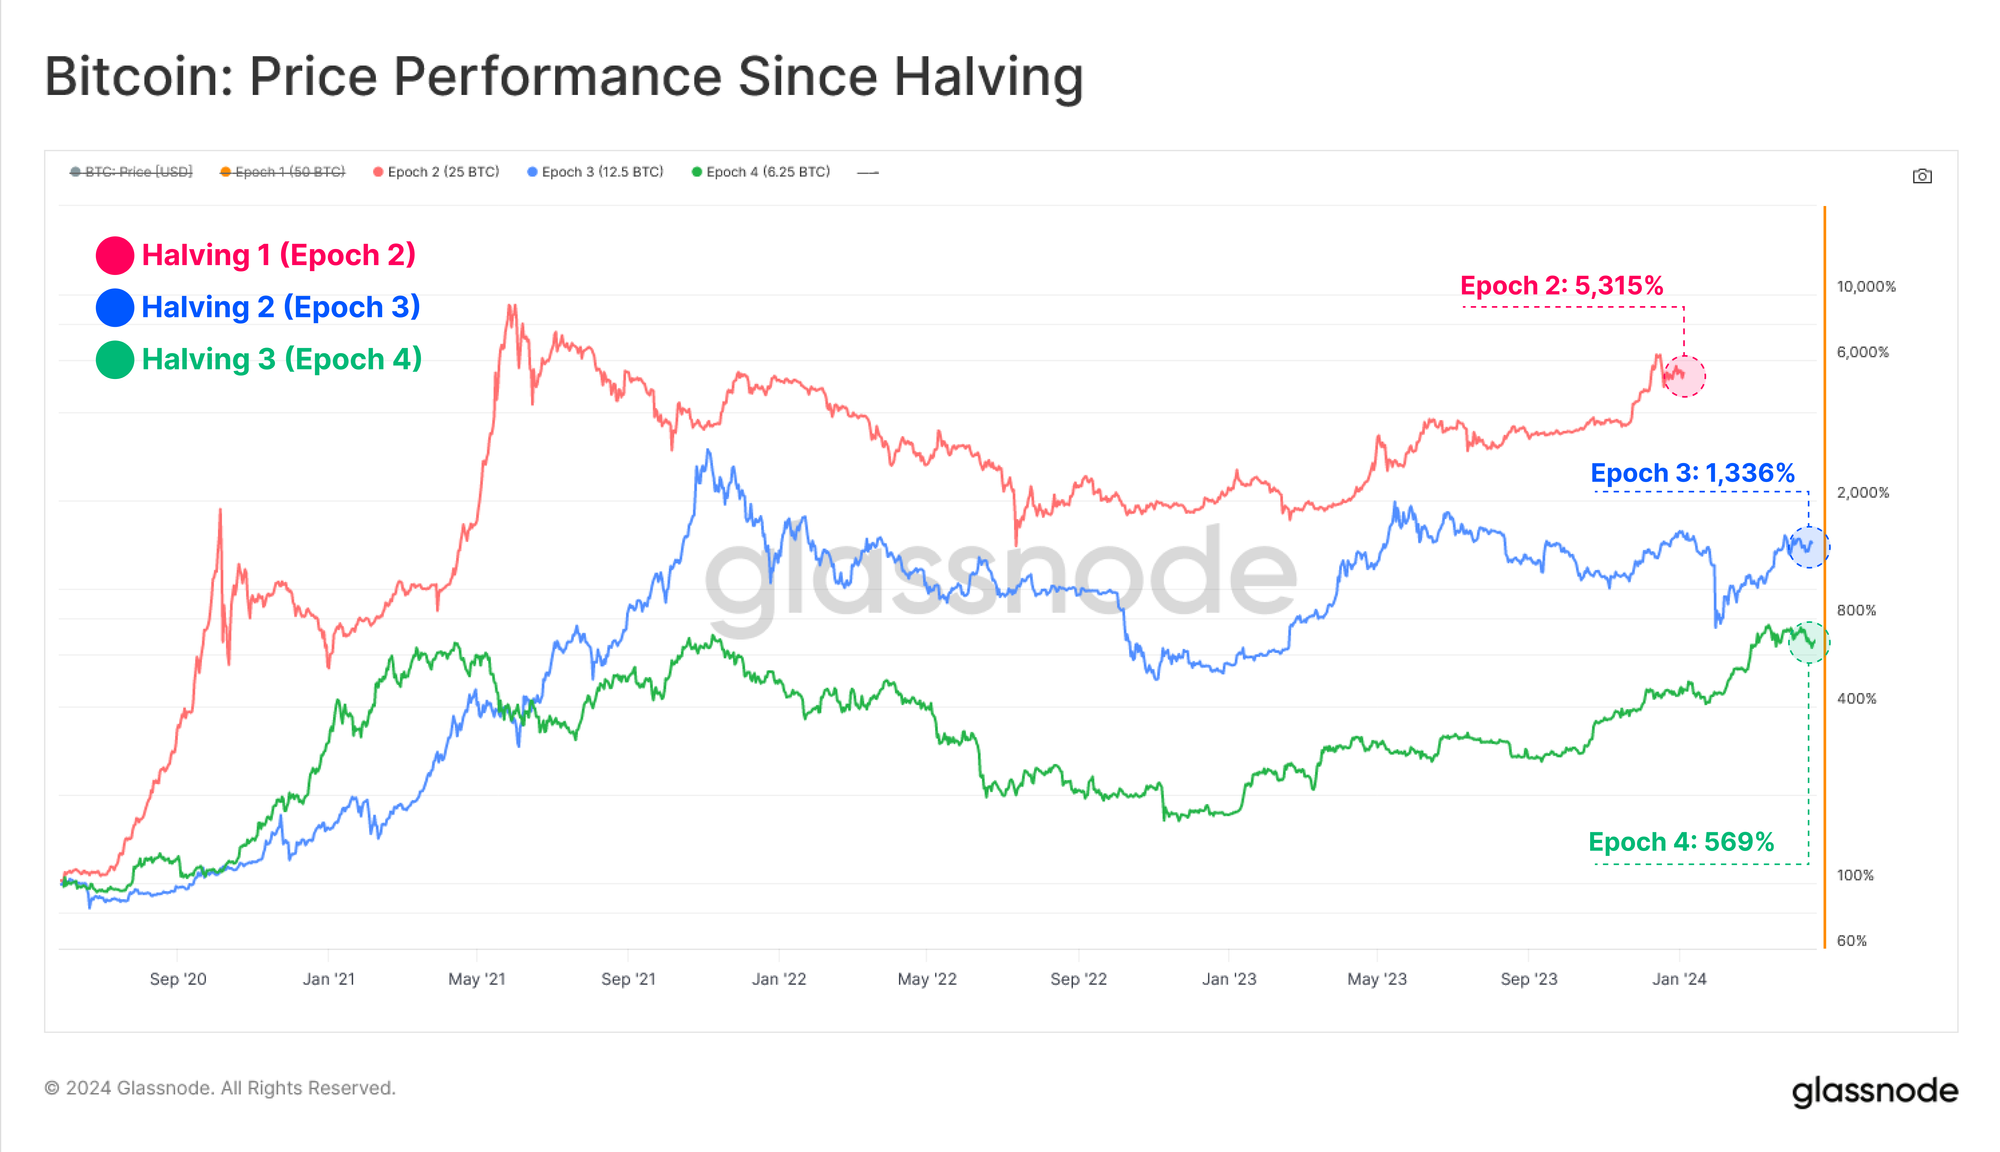
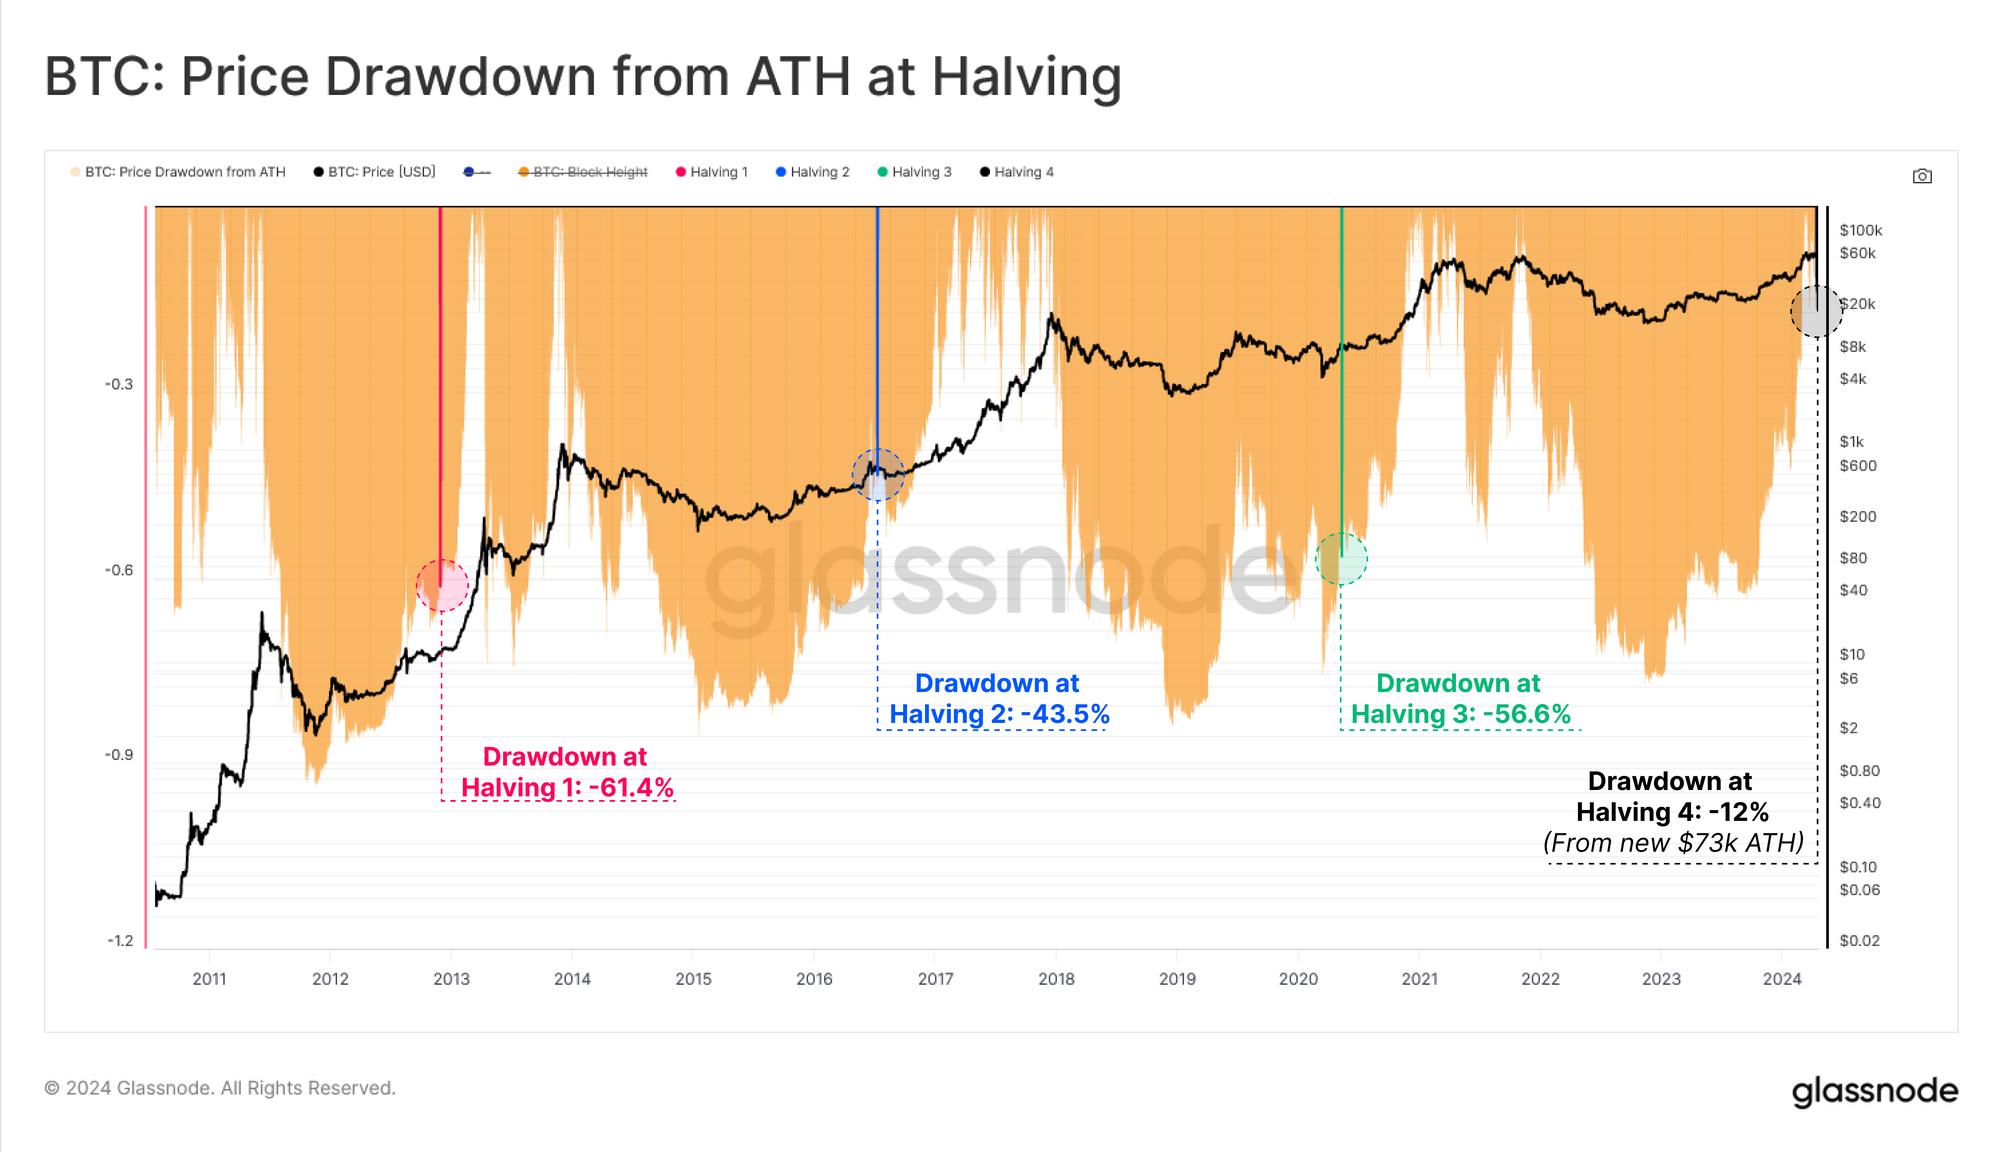
The price performance of Bitcoin across various halving epochs has a very wide spread, and we argue the earlier epochs are too different to today to be much of a guide. We do see both a diminishing returns, and shallower total drawdown effect over time, which is a natural result of the growing market size, and the scale of capital flows required to move it.
- 🔴 Epoch 2 Price Performance: +5315% with a max drawdown of -85%
- 🔵 Epoch 3 Price Performance: +1336% with a max drawdown of -83%
- 🟢 Epoch 4 Price Performance: +569% with a max drawdown of -77%
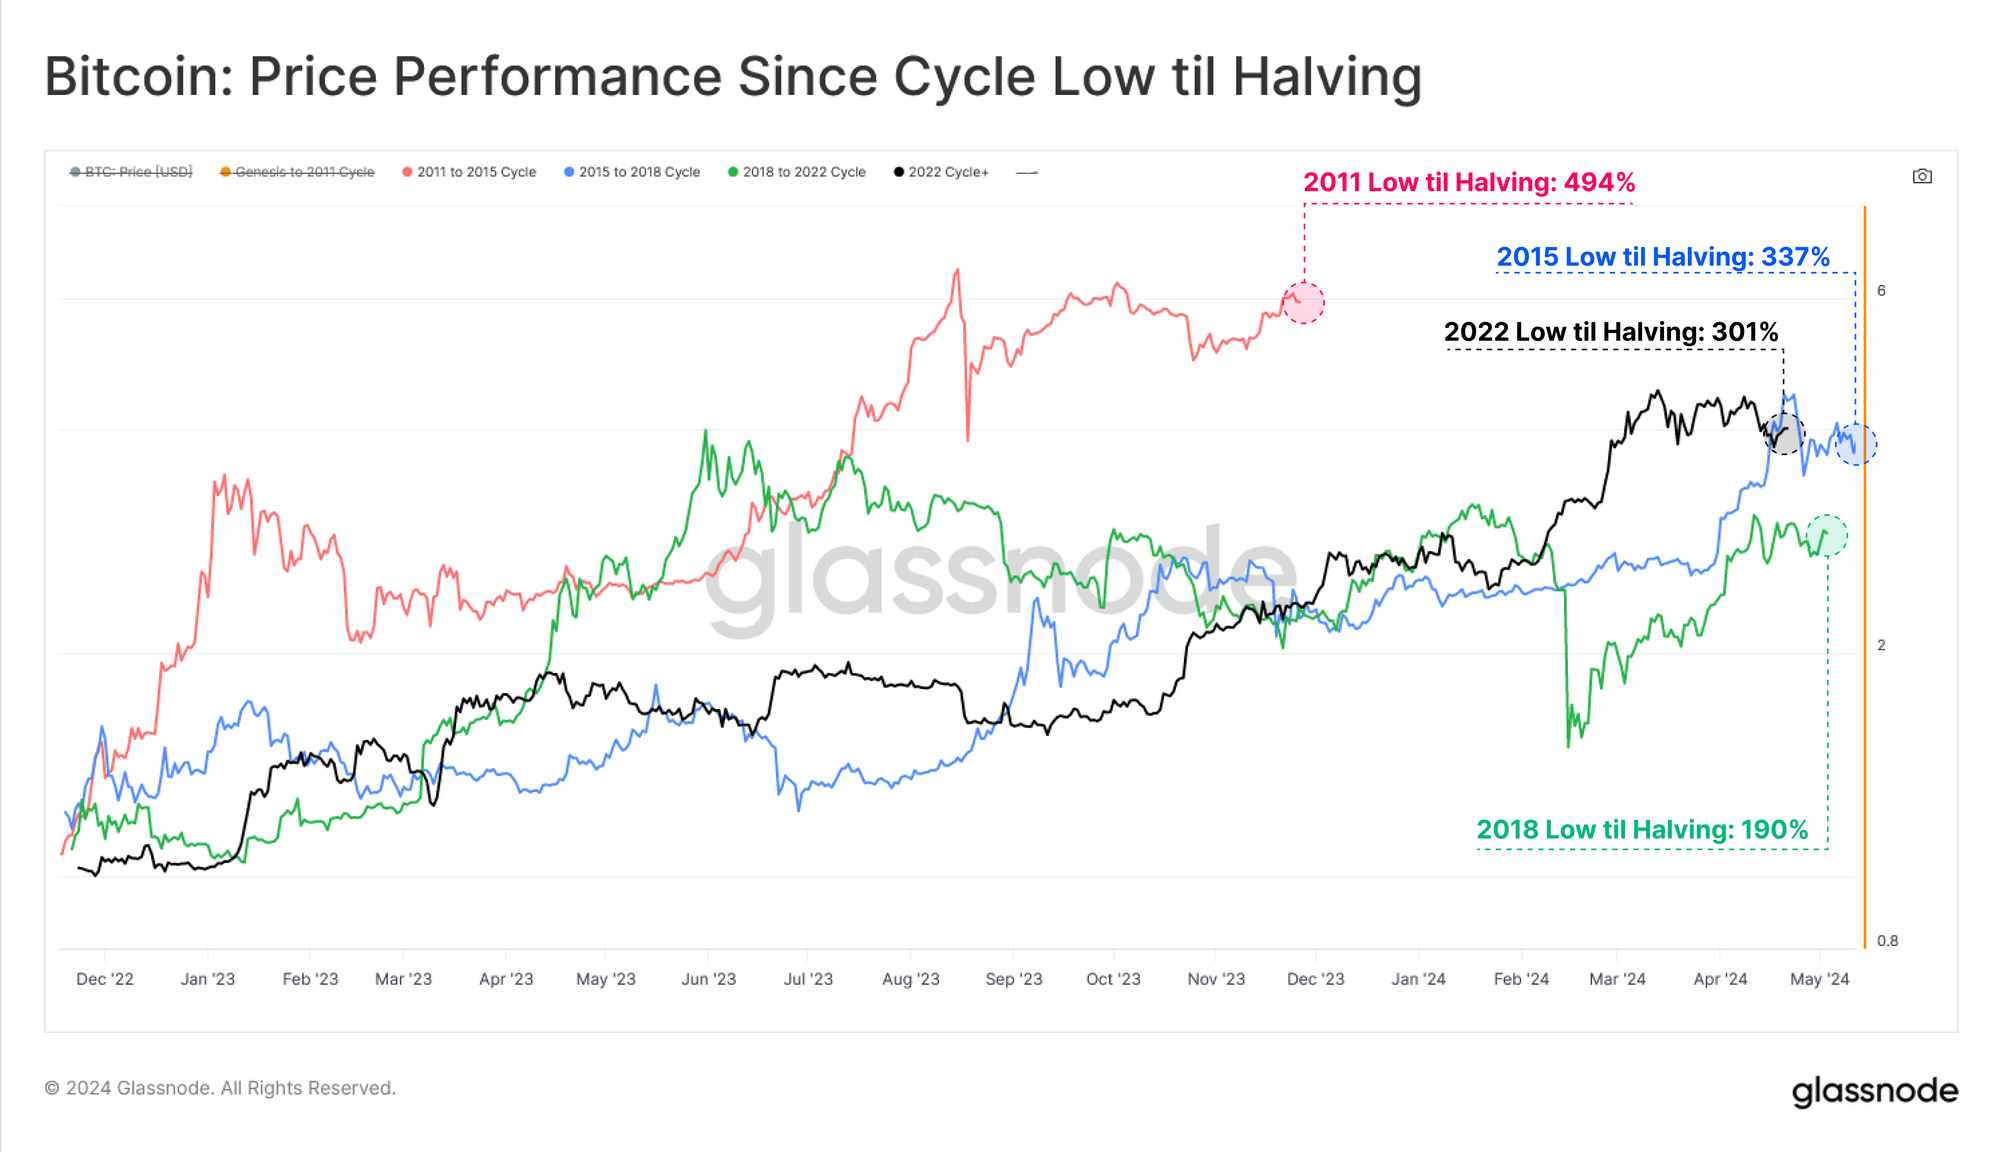
Assessing the price performance since the cycle low up until the Halving, we note a stark similarity between the 2015, 2018 and our current cycle, all experiencing an increase of around ~200% to ~300%.
However, our current cycle has been the only one on record to decisively break the previous ATH before the halving event.
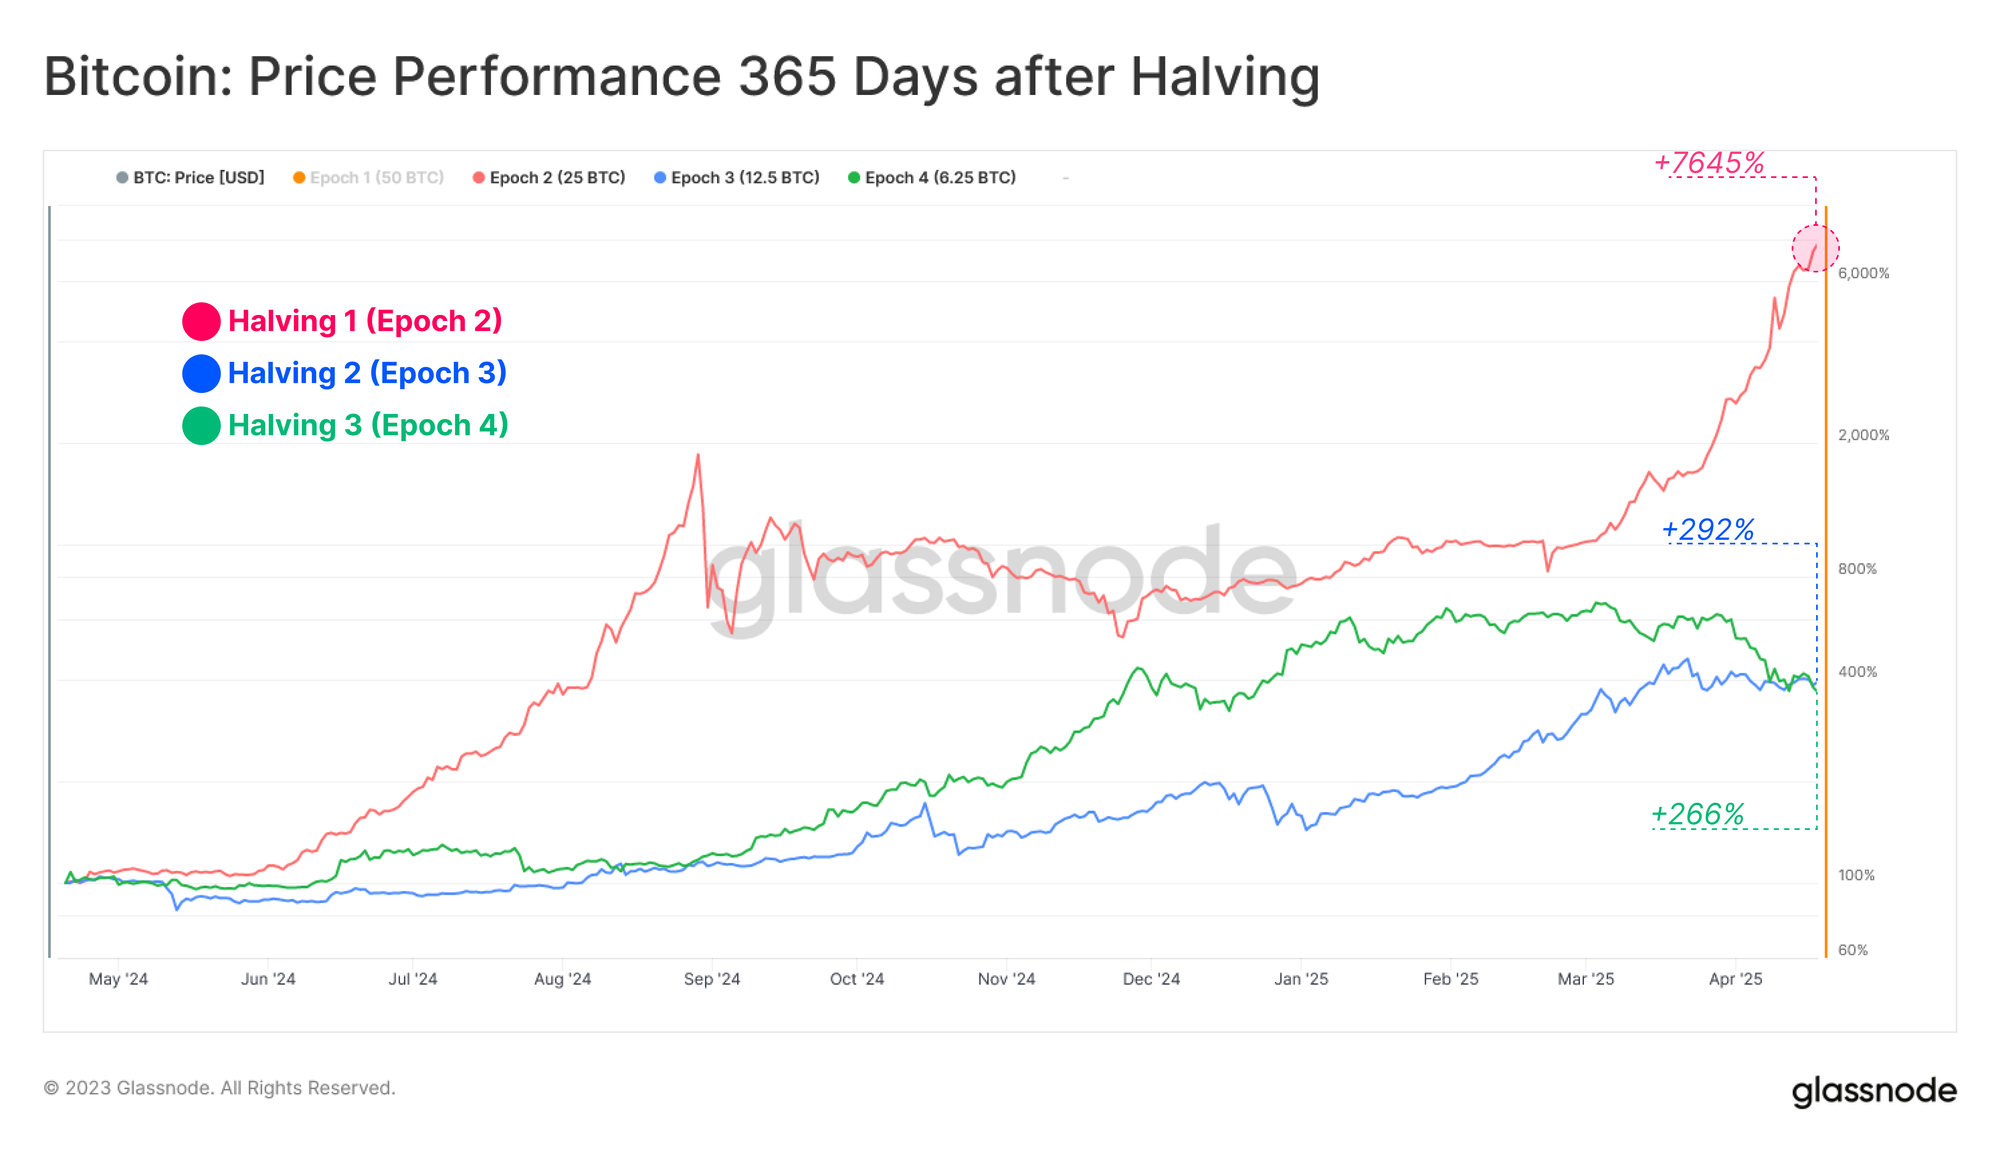
Another lens is to check market performance is in the 365-days following each halving. Epoch 2 saw a substantially larger performance, but we must consider that the dynamics and landscape of the market today has evolved significantly relative to the 2011-2013 period.
Therefore, the two most recent Epochs (3 and 4) provide a more informative depiction of the impact of asset size.
- 🔴 Epoch 2 Price Performance: +7,258% with a max drawdown of -69.4%
- 🔵 Epoch 3 Price Performance: +293% with a max drawdown of -29.6%
- 🟢 Epoch 4 Price Performance: +266% with a max drawdown of -45.6%
Whilst the year following a halving event is historically strong, it has come with some serious gut-check drawdowns along the way, ranging from -30% to -70%.
History Rhymes, Sometimes
During the bear market of 2022, a common narrative was that prices would never drop below the previous cycle ATH ($20k set in 2017 at the time). This was of course invalidated as prices collapsed more than 25% below the 2017 cycle high during the widespread deleveraging in late 2022.
A similar narrative circulated of late that prices could not break to a new the ATH before the halving had occurred. Once again, this was invalided in March this year. The ATH we saw in March comes off the back of both a historically tight supply (WoC-46-2023), and the remarkable demand interest brought online via the new spot ETFs.
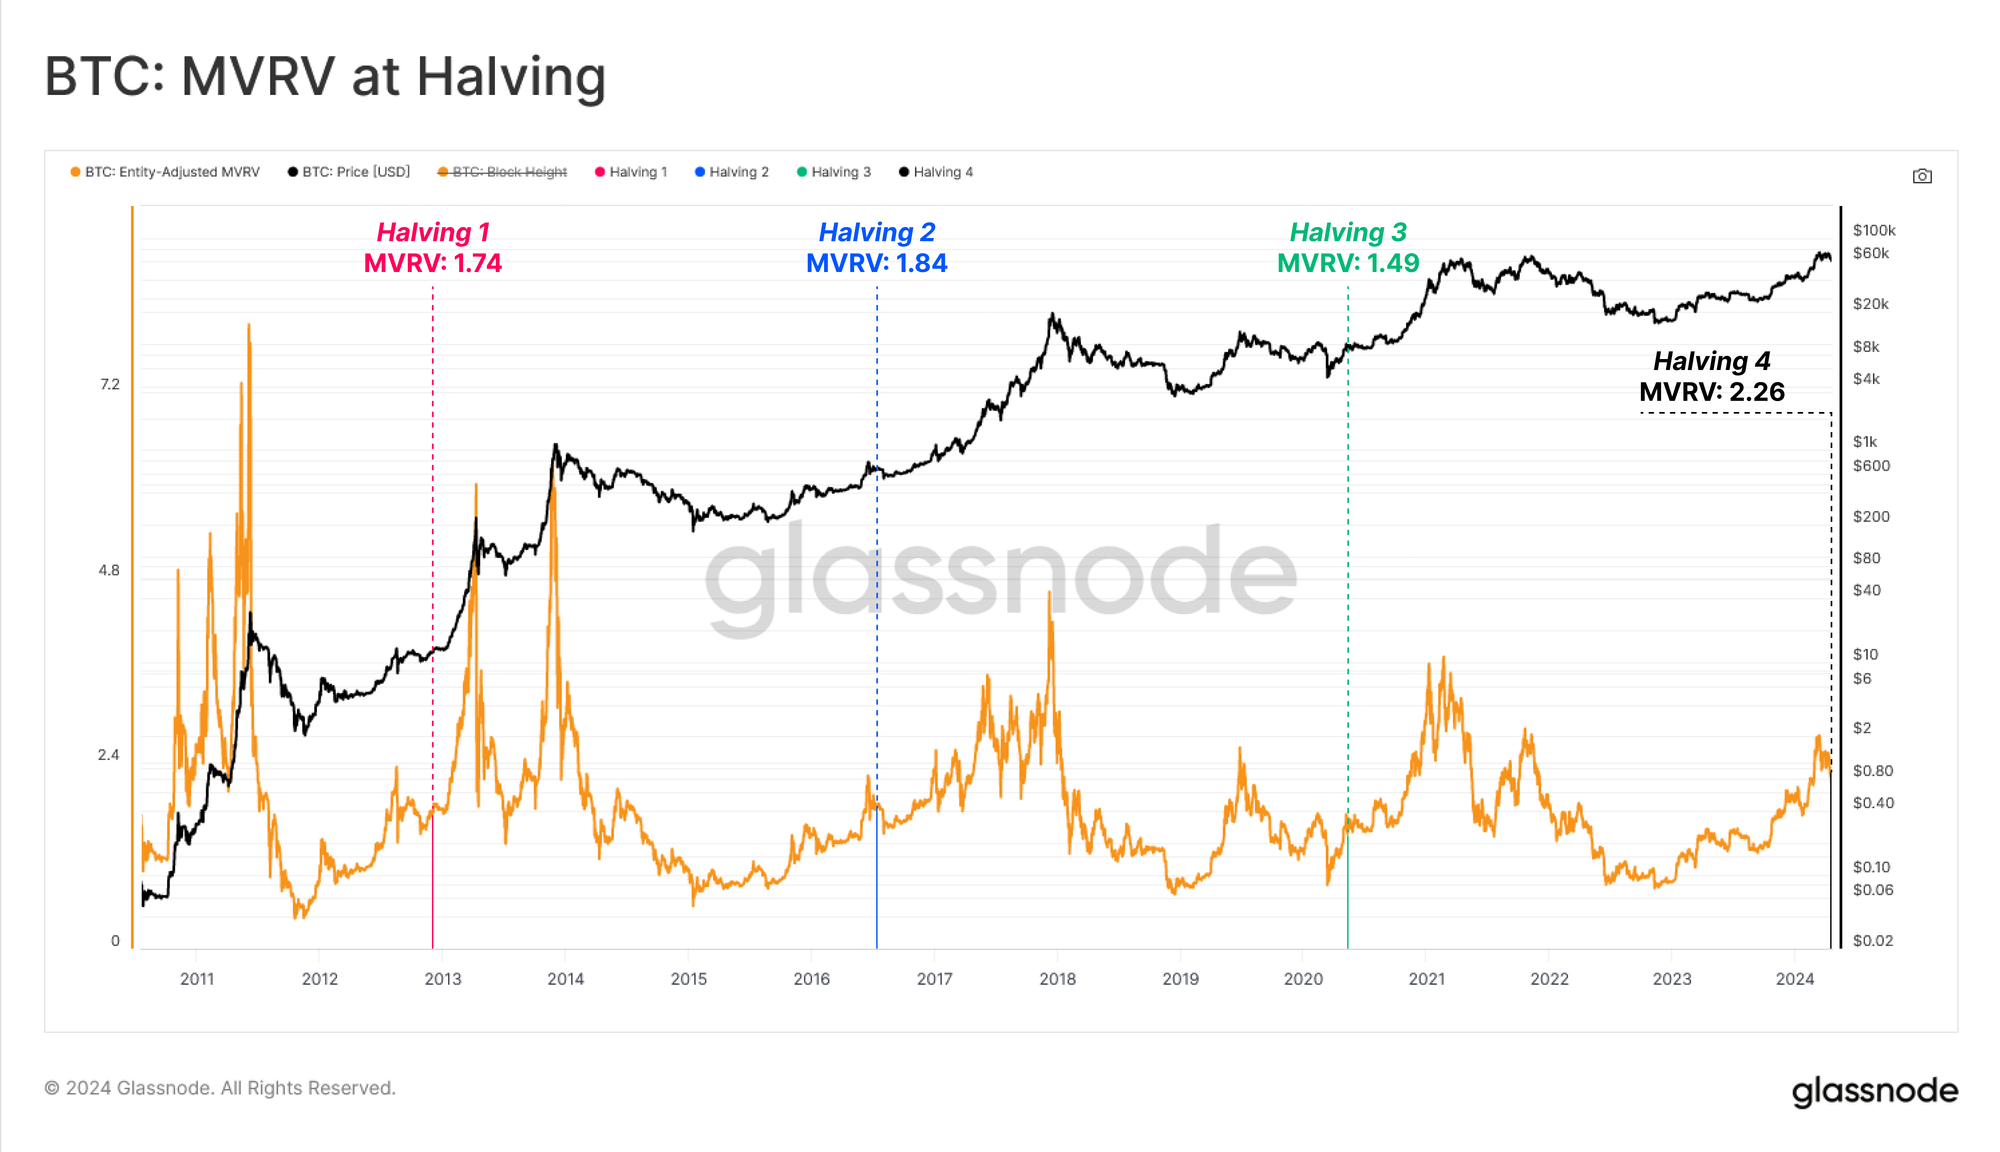
This price increase has also had meaningful effects on the unrealized profit held by investors. Currently, unrealized profit held within the coin supply is the largest it has ever been moving into a Halving event (as measured by MVRV).
In other words, investors are holding the largest paper gains relative to their cost basis as of a halving date. With the MVRV Ratio is trading at 2.26, this means the average unit of BTC is holding a +126% paper gain.
Fundamental Growth
In the previous section we assessed historical price performance centred around the Halving. In the next section, we will shift our focus to the growth of network fundamentals, ranging from mining security, miner revenues, asset liquidity and settlement volumes over halving epochs.
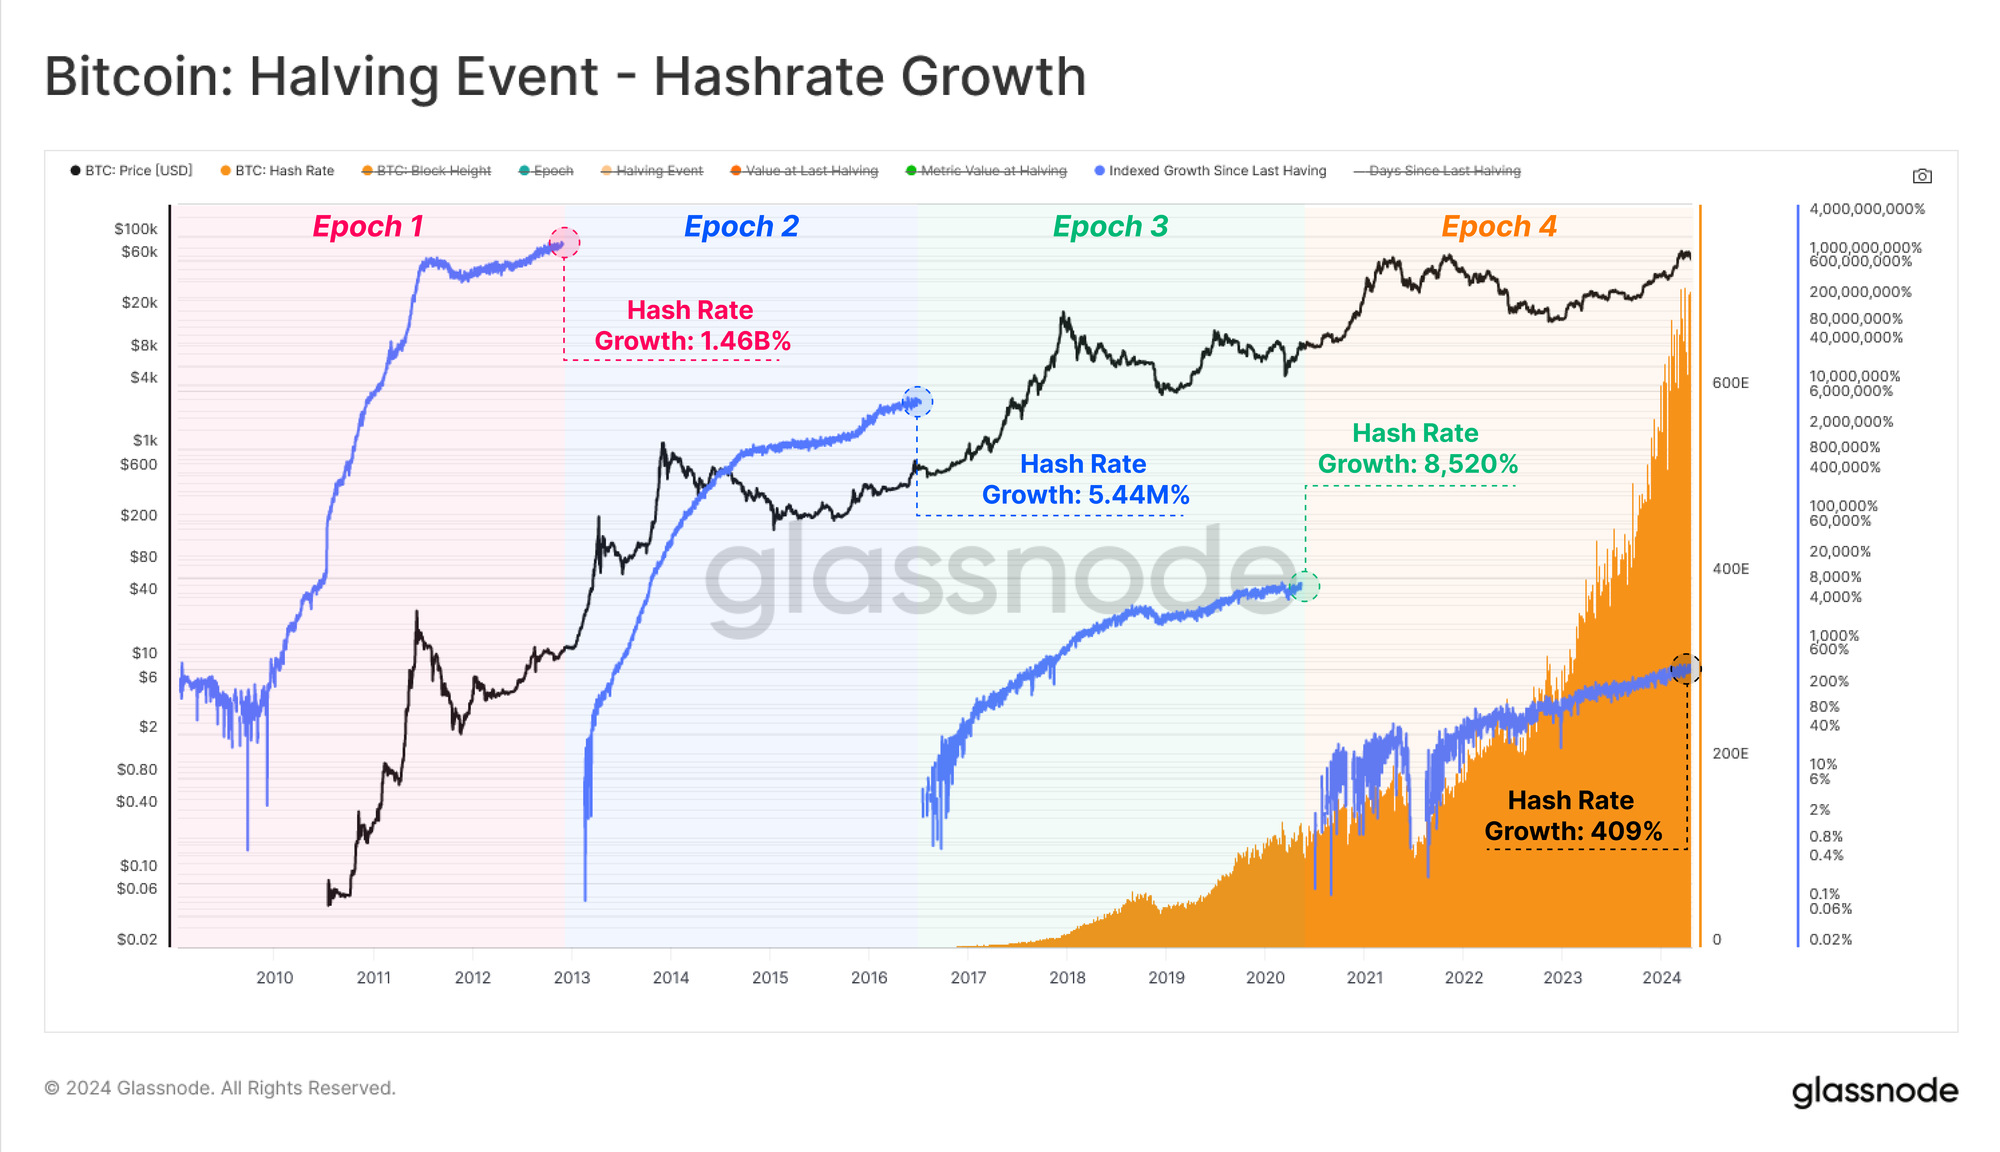
Hashrate is a network statistic for evaluating the collective ‘firepower’ of the mining cohort. Across halving epochs, the rate of growth in hashrate has slowed, however the absolute Hashes per second continues to expand, now at 620 Exahash per second (equivalent to all 8-billion people on earth completing 77.5-billion hashes every second).
Interestingly, hashrate has been at or near a new ATHs entering each halving event, which suggests two scenarios could be occurring;
- More ASIC rigs are coming online and/or,
- More efficient hashing ASIC hardware is being produced.
The conclusion drawn from both of these scenarios is that despite issuance being reduced by 50% each halving, the aggregate security budget has been sufficient not only to sustain current OPEX costs, but also to stimulate further investment across both the CAPEX and OPEX domains.
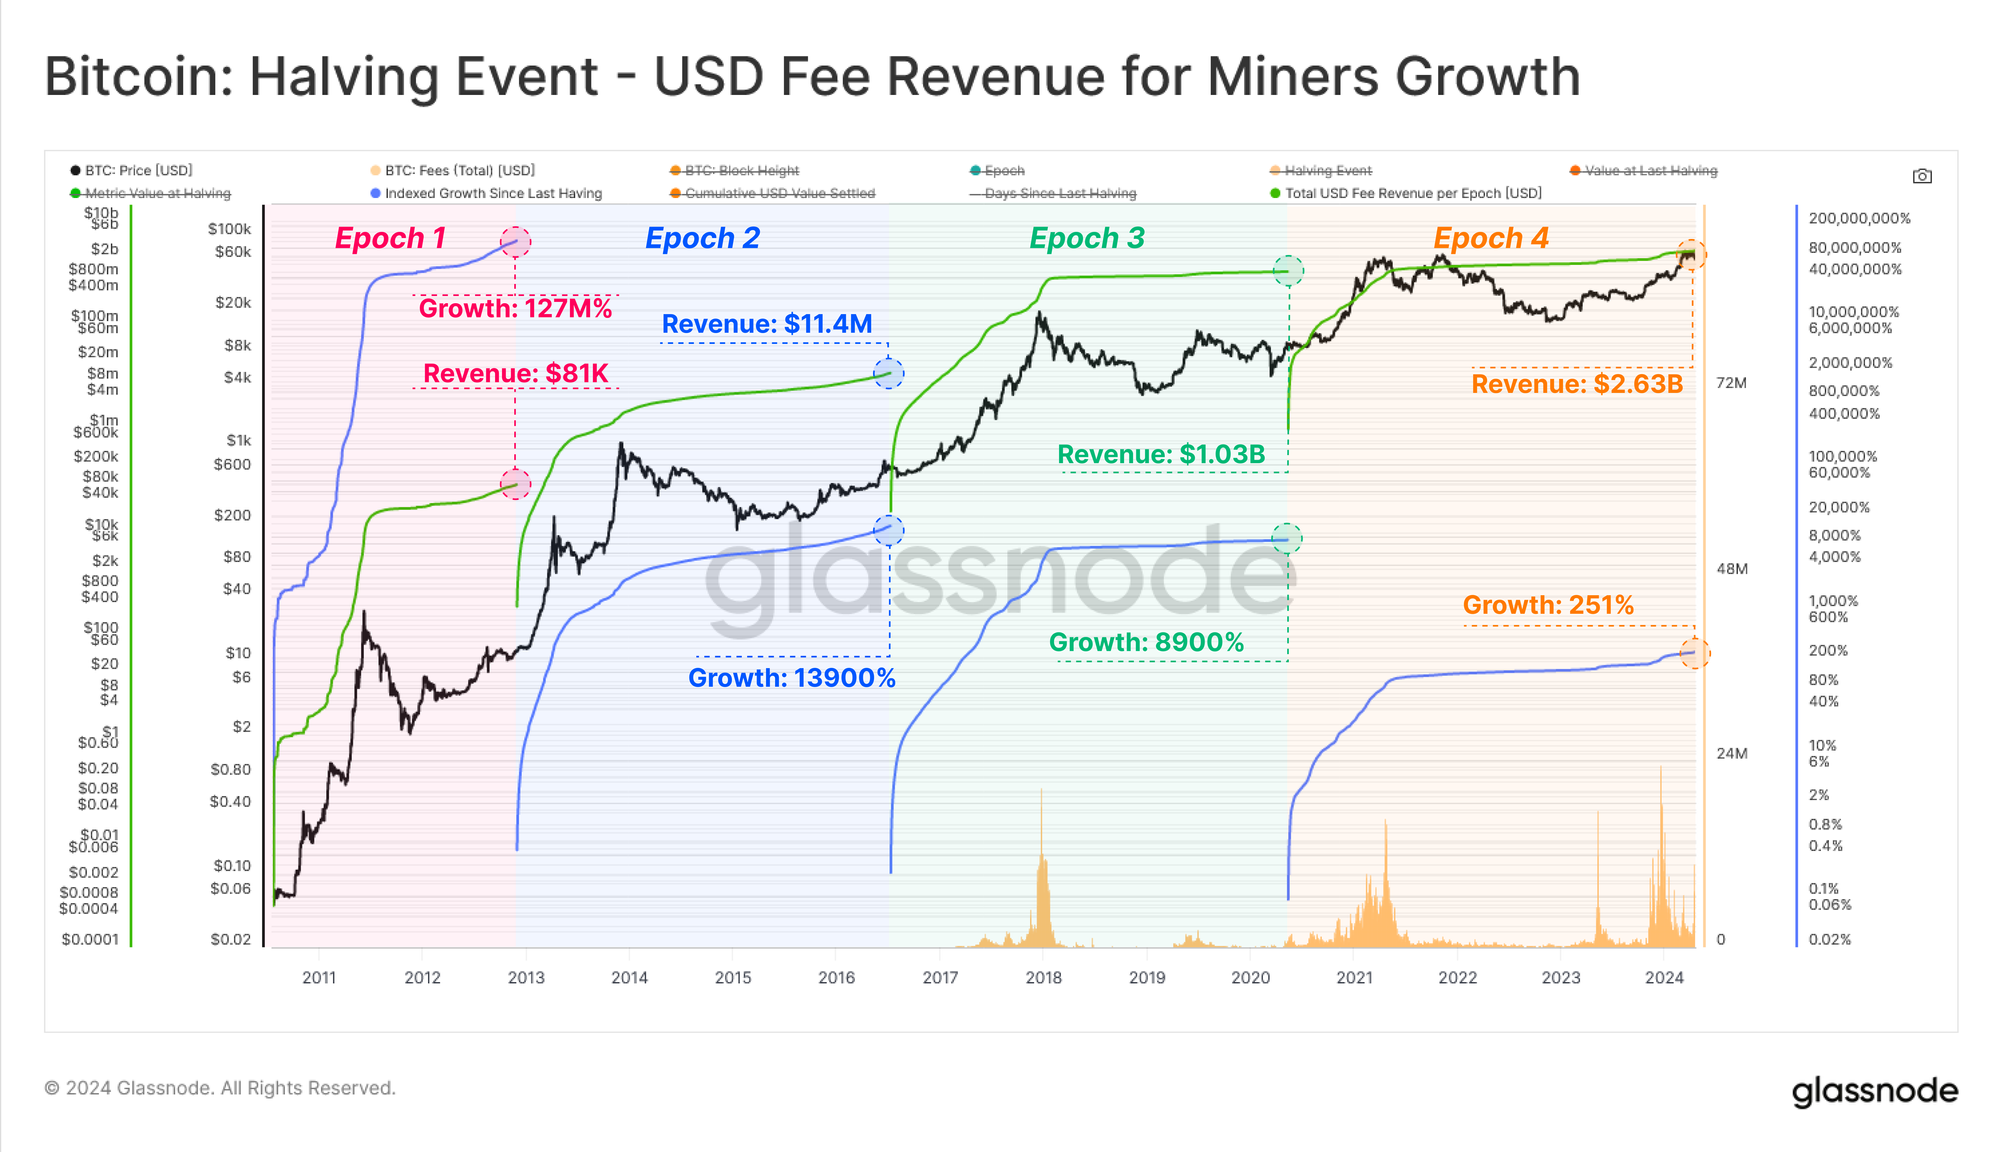
Miner revenues are similarly seeing a diminishing growth rate when denominated in USD, but a net expansion in absolute size. Cumulative miner revenue topped a staggering $3B over the past four years, increasing by an order of magnitude over the prior Epoch.
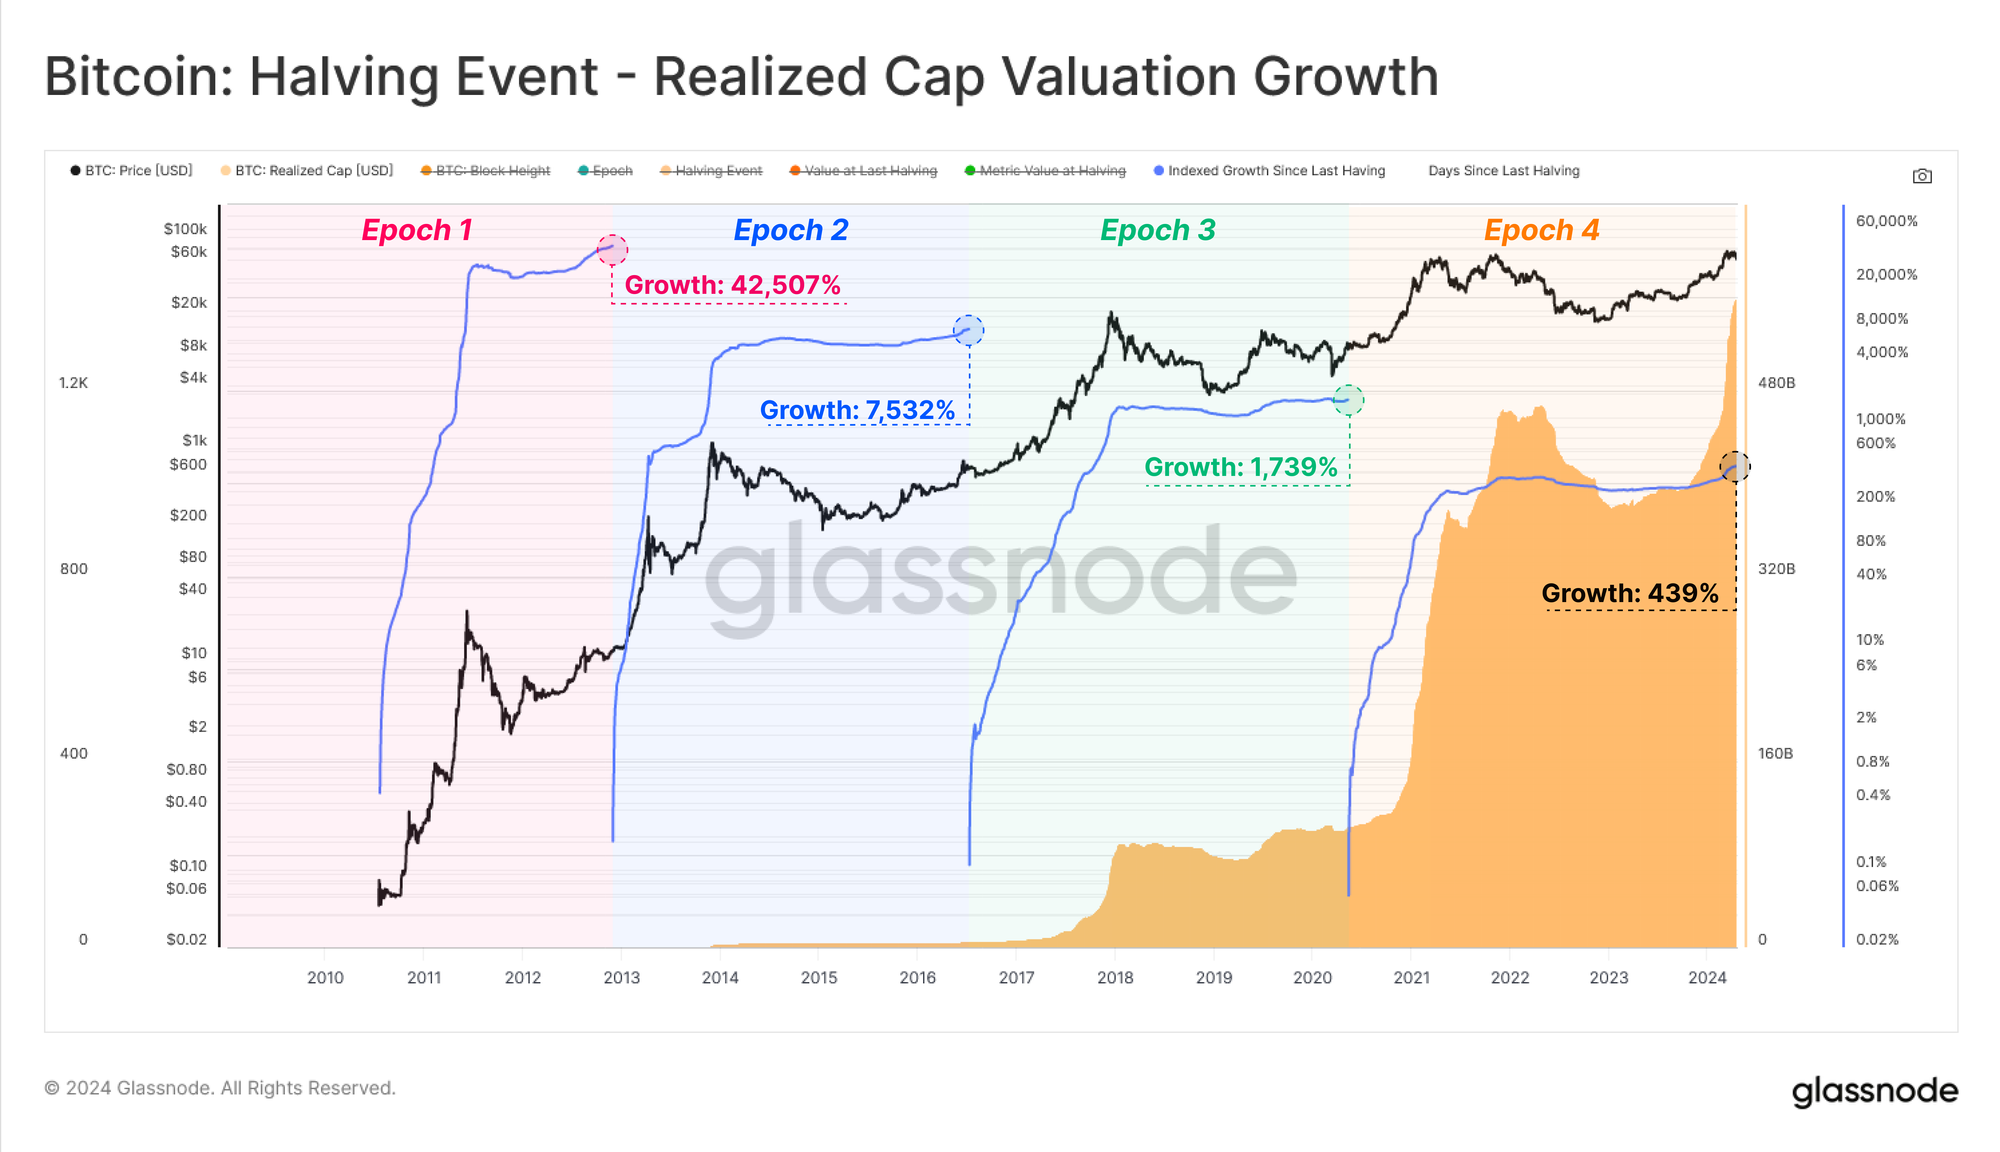
The Realized Cap is a powerful tool to measure the capital invested and stored within Bitcoin over time, and can be used to compare USD denominated liquidity growth across cycles.
A net total of $560B worth of USD value has been ‘stored’ within Bitcoin by this measure. The realized cap increased by 439% over the last epoch, which supports the now $1.4 trillion dollar market cap of the asset. It is also noteworthy that Bitcoin continues to see capital inflows despite the infamous volatility, bad headlines, and cyclical drawdowns.
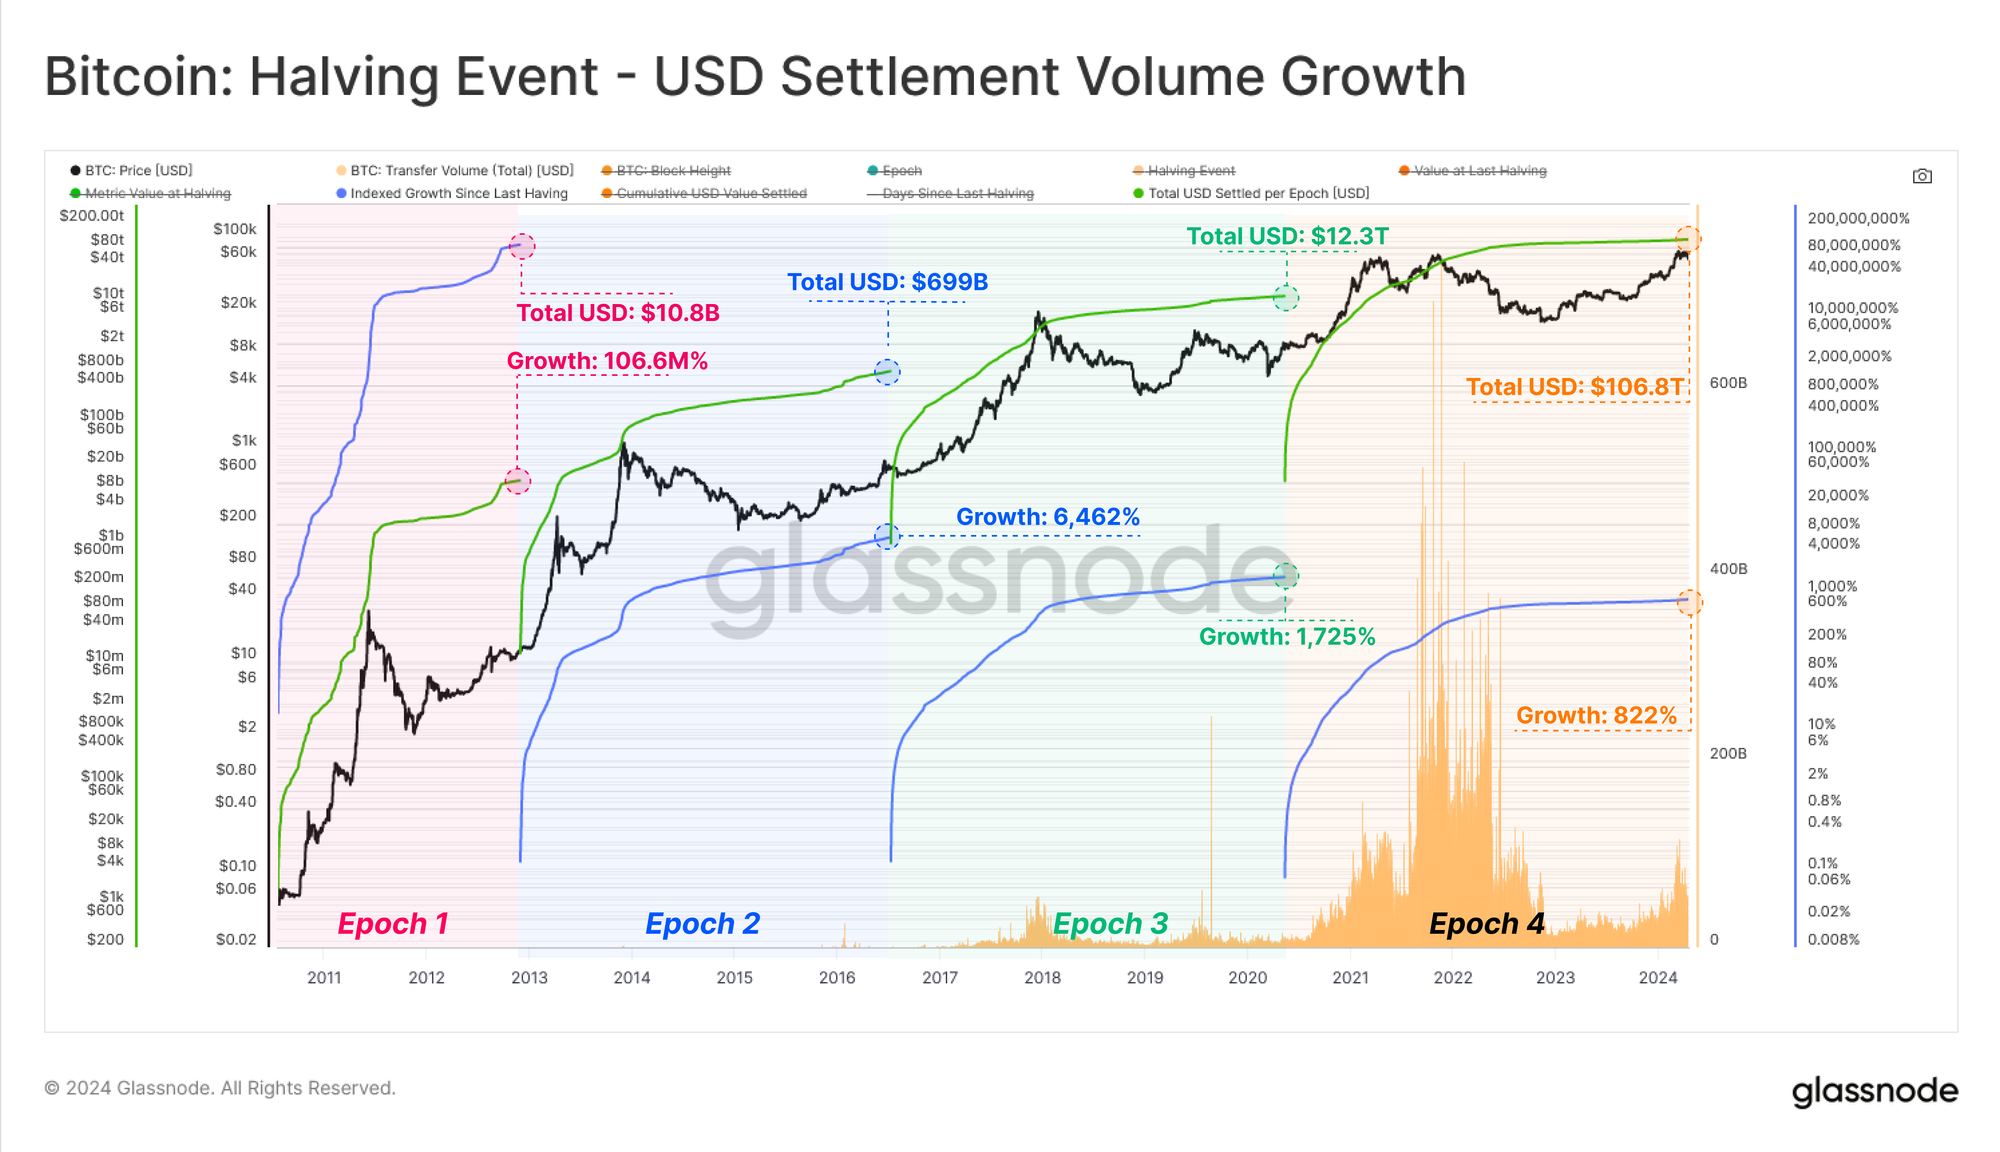
Finally, if we evaluate transfer volumes settled across halving epochs, we can see that over the last four years, a staggering $106T worth of economic value was transferred and settled by the network. Now it is important to note that this is considering raw unfiltered volumes, and does not adjust for internal wallet management.
Nevertheless, each transaction was settled without intermediaries, and highlights the incredible value throughput capacity of the Bitcoin network at scale.
Conclusions and Summary
With the highly anticipated Halving complete, the issuance emission per block has been halved and the scarcity of the asset hardened, with the Bitcoin asset decisively overtaking gold in terms of issuance scarcity.
Comparing across Epochs, a contraction in growth can be noted across Hashrate, Network Settlemend, Liquidity and Miner Revenue. However, the absoloute value of these metrics has increased by an order of magnitude, an incredibly impressive feat when observed in relation to the size of the market.
Of note, network profitability across all walks of market investors has largely imrproved in relation to previous Halvings. This includes the fundamental Miner class, who have entered the Halving with an ATH in Hashrate, suggesting a sufficient security budget to stimulate OpEx and CapEx requirements.
Disclaimer: This report does not provide any investment advice. All data is provided for information and educational purposes only. No investment decision shall be based on the information provided here and you are solely responsible for your own investment decisions.
Exchange balances presented are derived from Glassnode’s comprehensive database of address labels, which are amassed through both officially published exchange information and proprietary clustering algorithms. While we strive to ensure the utmost accuracy in representing exchange balances, it is important to note that these figures might not always encapsulate the entirety of an exchange’s reserves, particularly when exchanges refrain from disclosing their official addresses. We urge users to exercise caution and discretion when utilizing these metrics. Glassnode shall not be held responsible for any discrepancies or potential inaccuracies. Please read our Transparency Notice when using exchange data.
- Join our Telegram channel
- For on-chain metrics, dashboards, and alerts, visit Glassnode Studio
- For automated alerts on core on-chain metrics and activity on exchanges, visit our Glassnode Alerts Twitter
