Approaching All Time Highs
Bitcoin’s strong price performance as of recent has significantly improved investor portfolios, prompting many to de-risk and take profit. This wave of fresh capital inflows has pushed Bitcoin’s Realized Cap to a new all-time high above $900B, a major milestone in the asset’s history.


Executive Summary
- Bitcoin has reached a local high of $107K, remaining within close range of its ATH of $109K set in Dec 2024. This has driven a notable increase in capital inflows, pushing the Realized Cap above $900B for the first time, a historic milestone.
- Following one of the sharpest improvements in Short-Term Holder profitability on record, the cohort’s spending activity has surged, recording a peak realized profit of $747M /day and a cumulative $11.4B over the past 30 days.
- Ethereum's price has experienced a major surge in recent weeks, potentially driven by excitement around the successful Pectra upgrade on May 7th. The recent rally included several daily price gains exceeding +1σ moves, with the most significant being a +21.8% surge, the strongest one-day increase since May 2021.
- Notably, the $2,400–$2,900 range remains a crucial area for Ethereum, acting as both a resistance zone and a potential breakout level essential for maintaining upward momentum.
Financial Relief
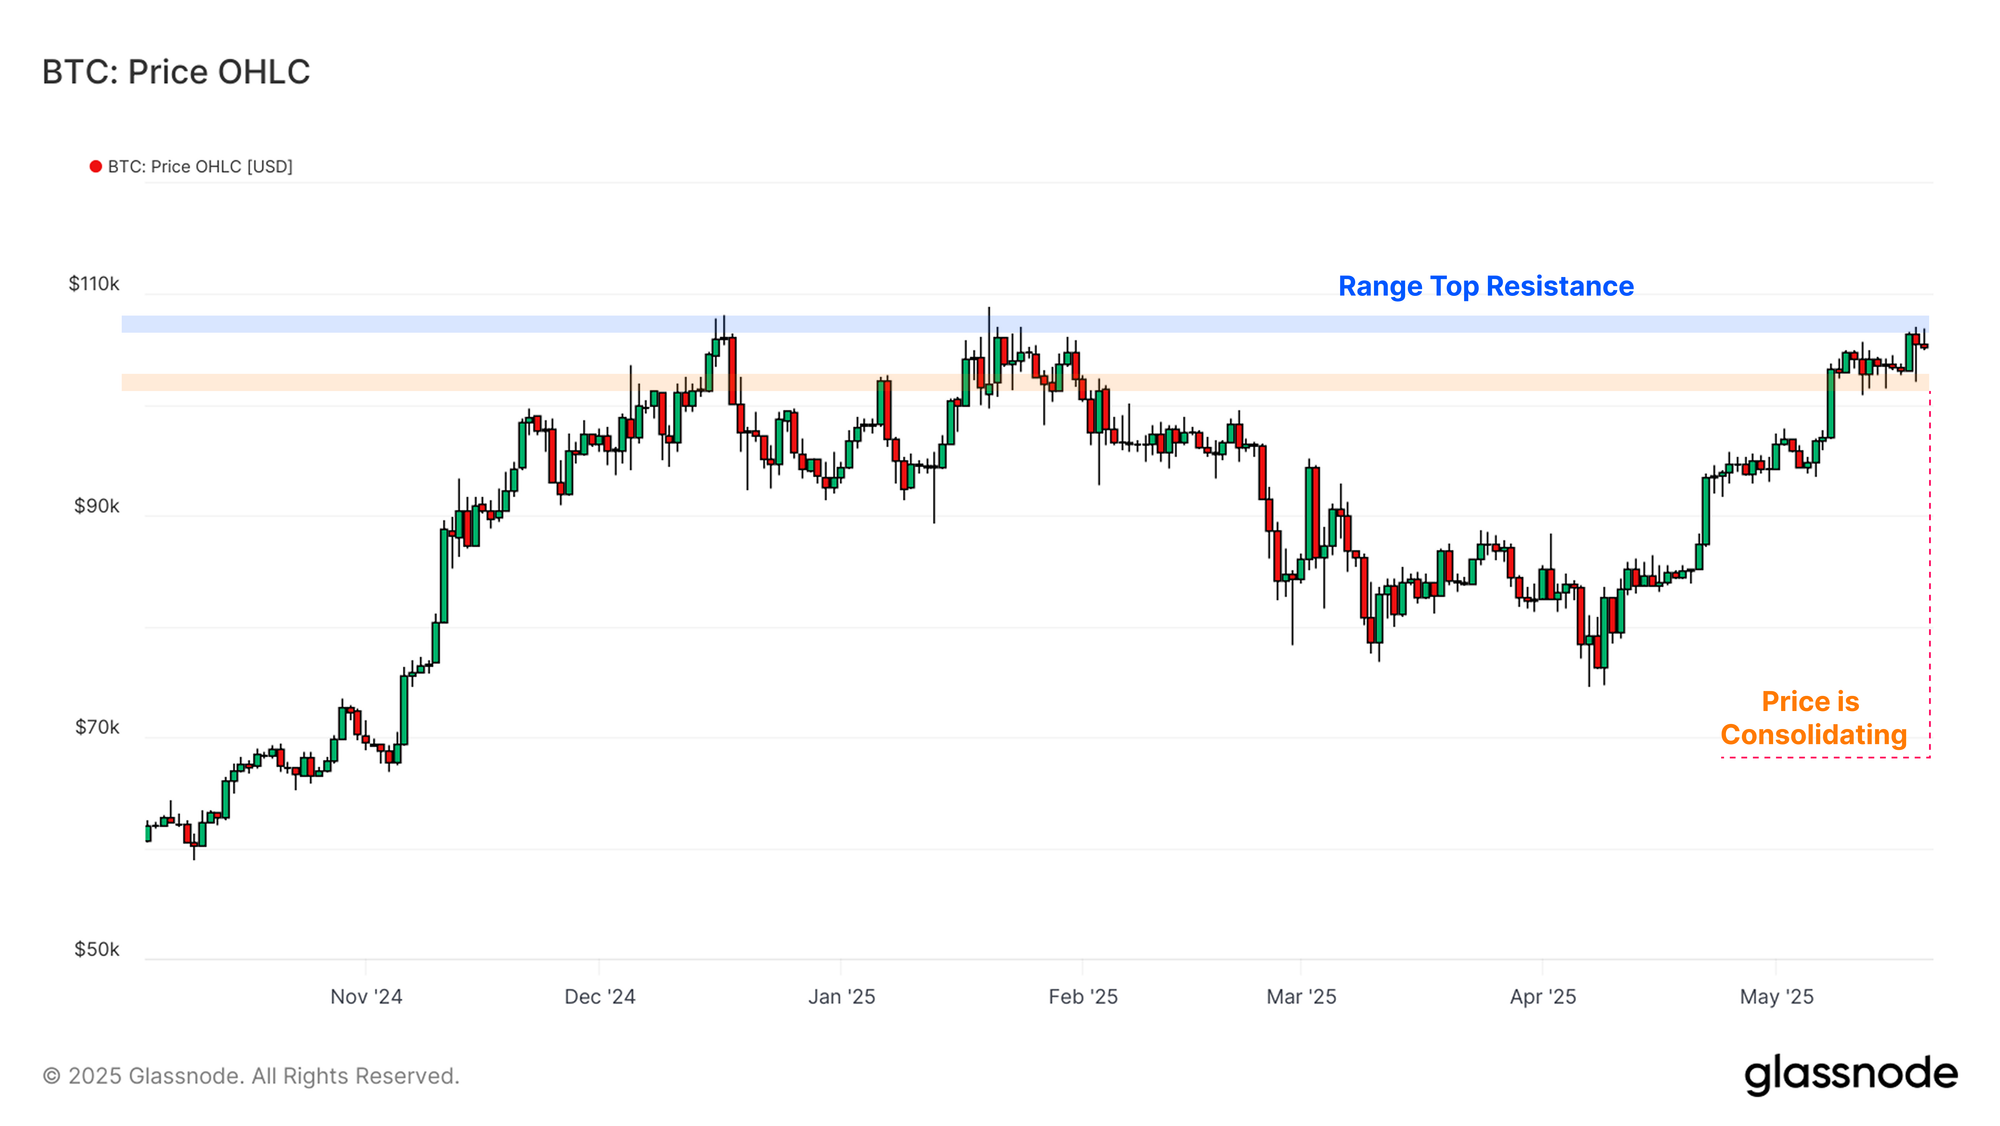
The digital asset ecosystem has continued to show strength in recent weeks, led by Bitcoin, which has reached a local high of $107k, and is now just a stone's throw away from the $109k ATH. The market has encountered its meaningful resistance between $102k and $105k, where it has been consolidating for the last two weeks.
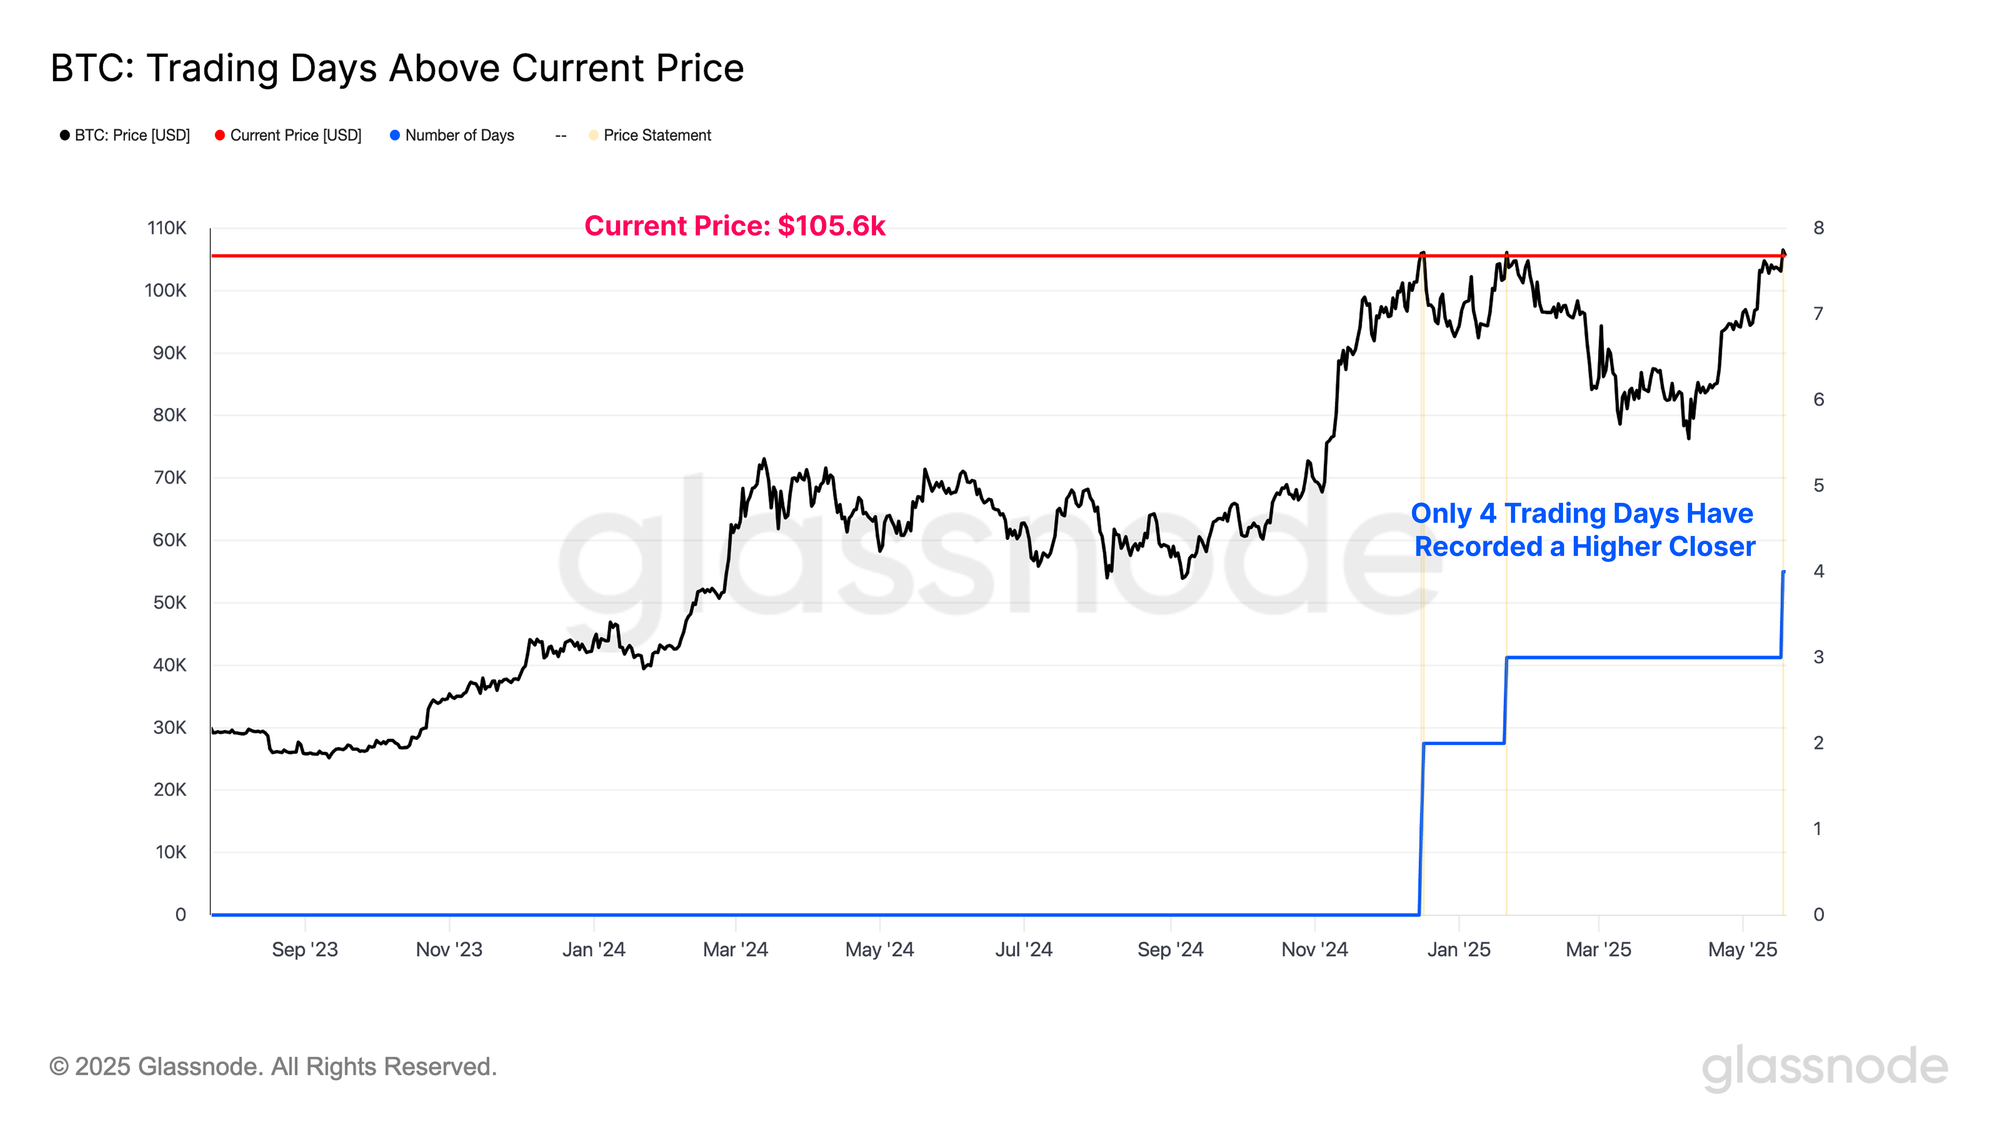
To date, only 4 trading days have ever recorded a higher daily closing Bitcoin price, and the last weekly close of $106.5k is the highest in history. Bitcoin is also trading approximately 40% higher over the last six weeks, highlighting how strong the market recovery has been.
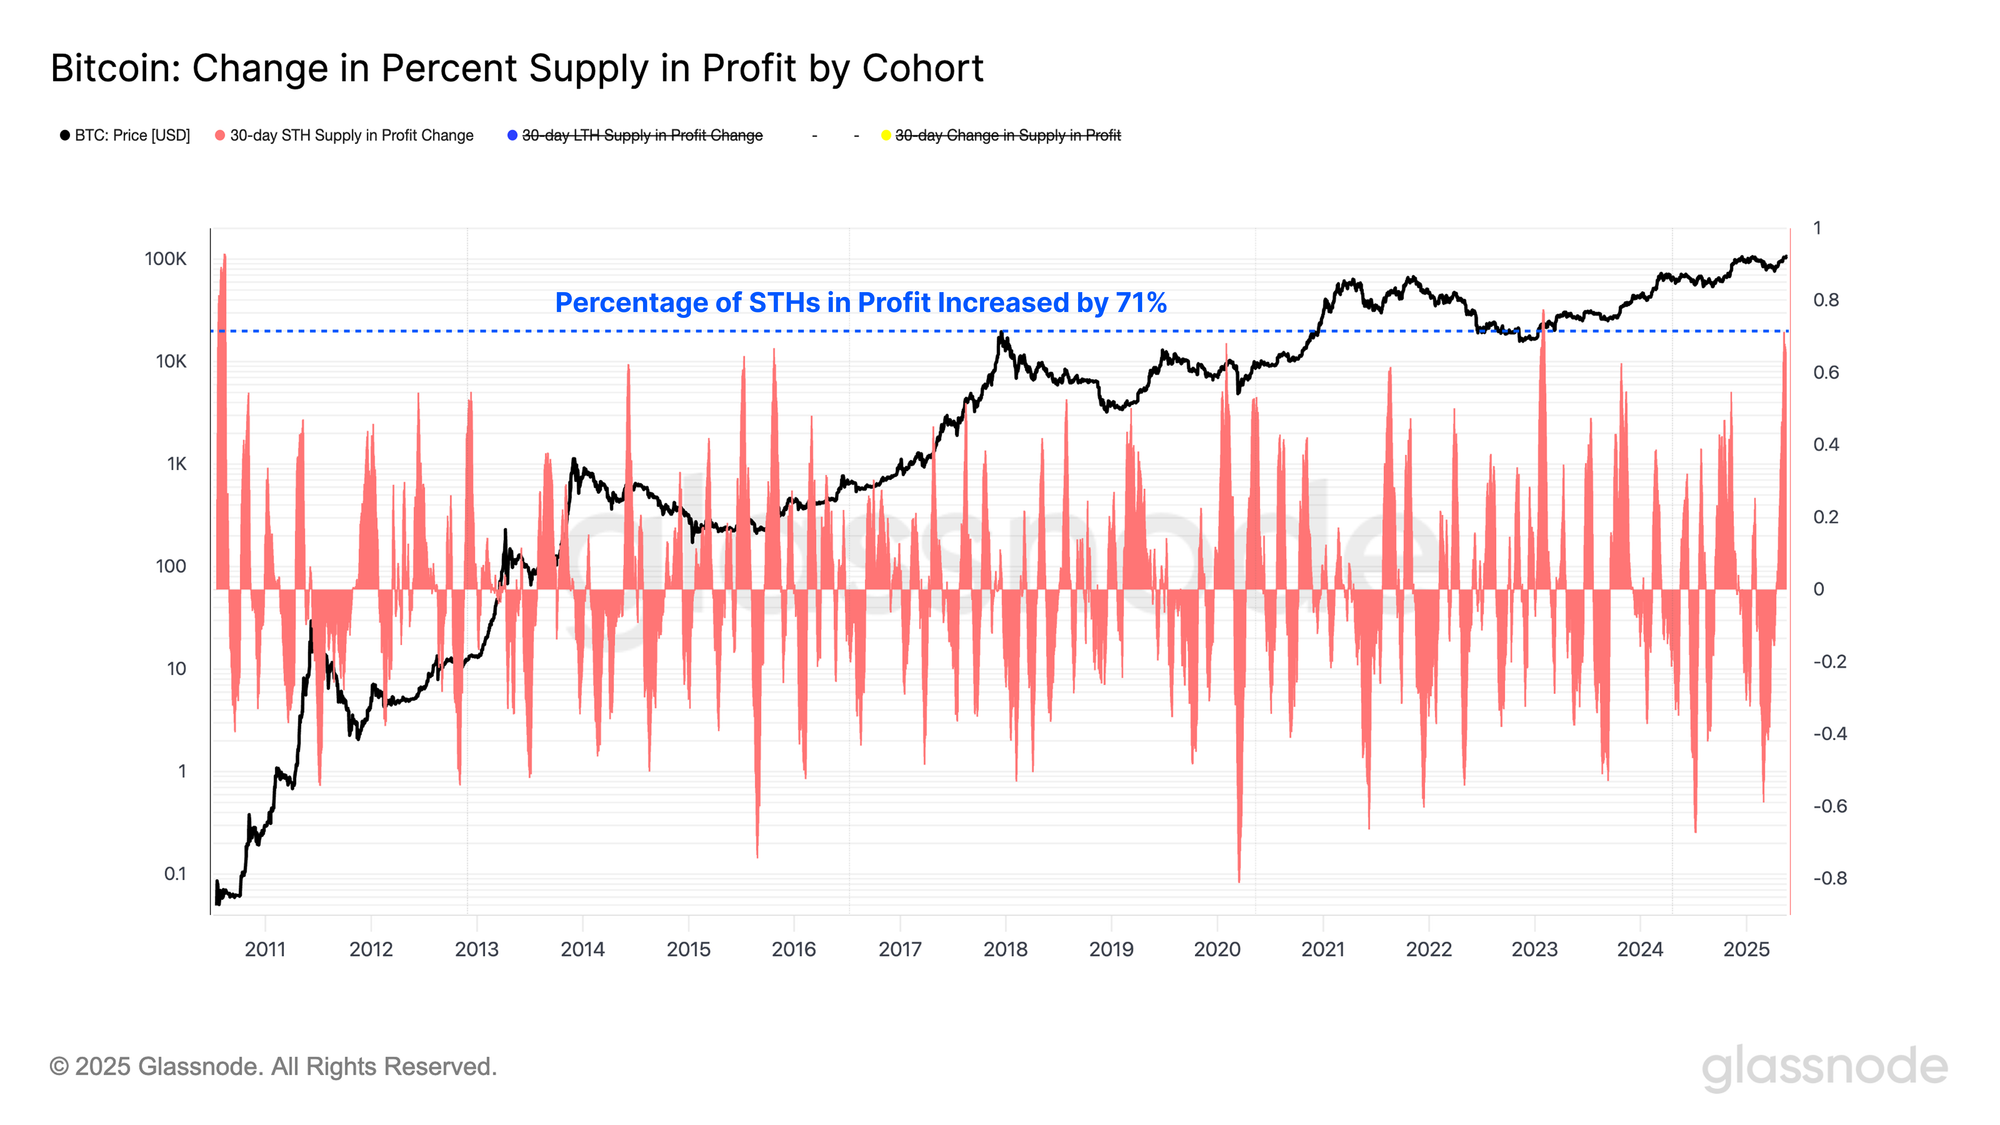
When the market recovers quickly from a drawdown, we can track the 30-day change in the proportion of supply held in profit across various cohorts. This helps us identify which investor groups have benefited from the recovery and can illustrate major shifts in sentiment.
The recent price rise has provided significant financial relief to the Short-Term Holder cohort in particular, with their percentage of supply in profit increasing by +71% over the last month. This marks the second-largest positive uptick in profitability for this cohort on record.
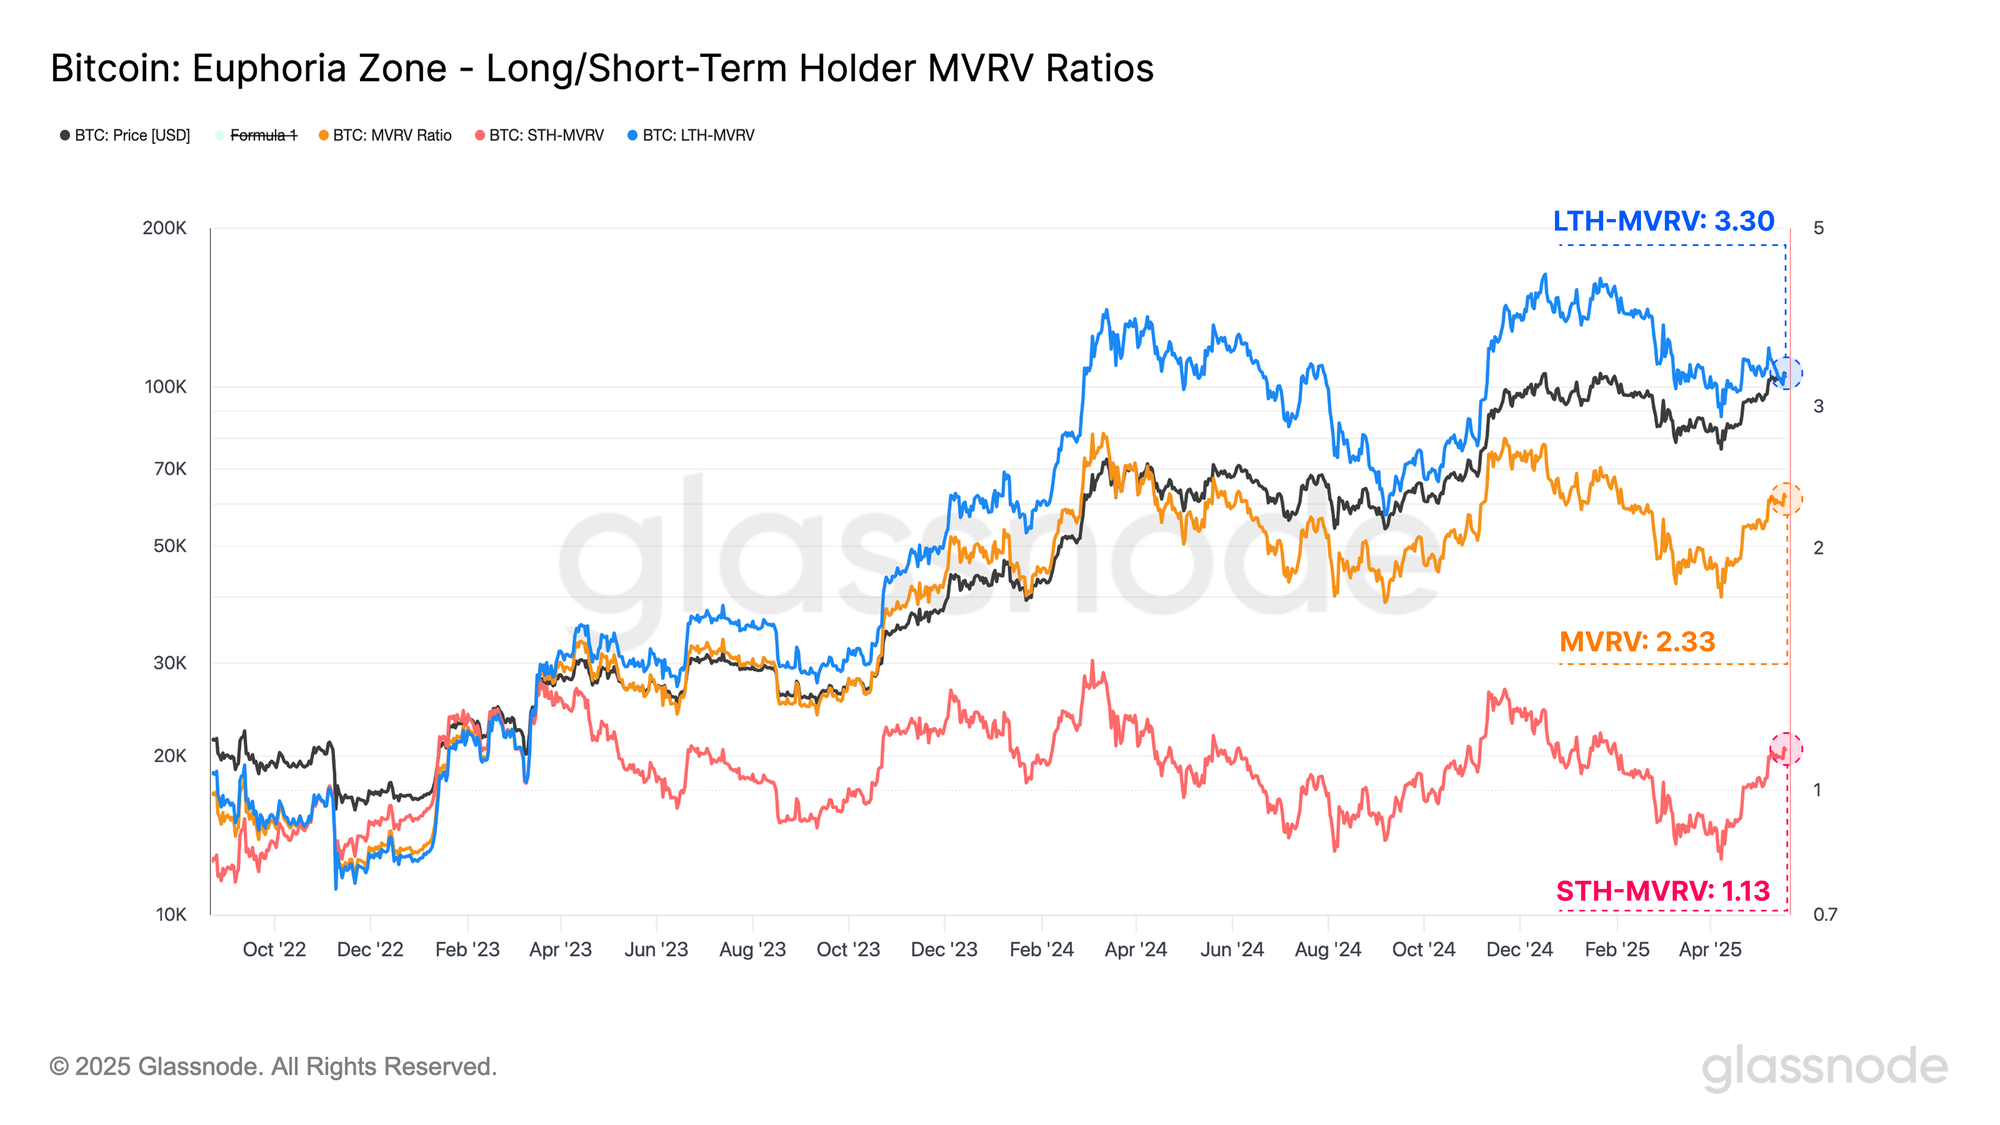
Another tool we can use to gauge improvements to investor profitability is by inspecting changes in each cohort’s MVRV Ratio since the local $74k price low.
- MVRV has increased from 1.74 to 2.33 (+74% to +133% unrealized gain)
- STH MVRV increased from 0.82 to 1.13 (-18% unrealized loss to +13% unrealized gain)
- LTH MVRV increased from 2.91 to 3.30 (+191% to +230% unrealized gain)
Notably, for all of these cohorts, investors have experienced a marked improvement in their financial position. This likely has the knock-on effect of boosting investor confidence and sentiment.
As market conditions improve and investor portfolios recover, many are taking the opportunity to lock in profits. Profit taking in a bull market can be thought of as the opposite side of fresh demand, which is absorbing this supply.
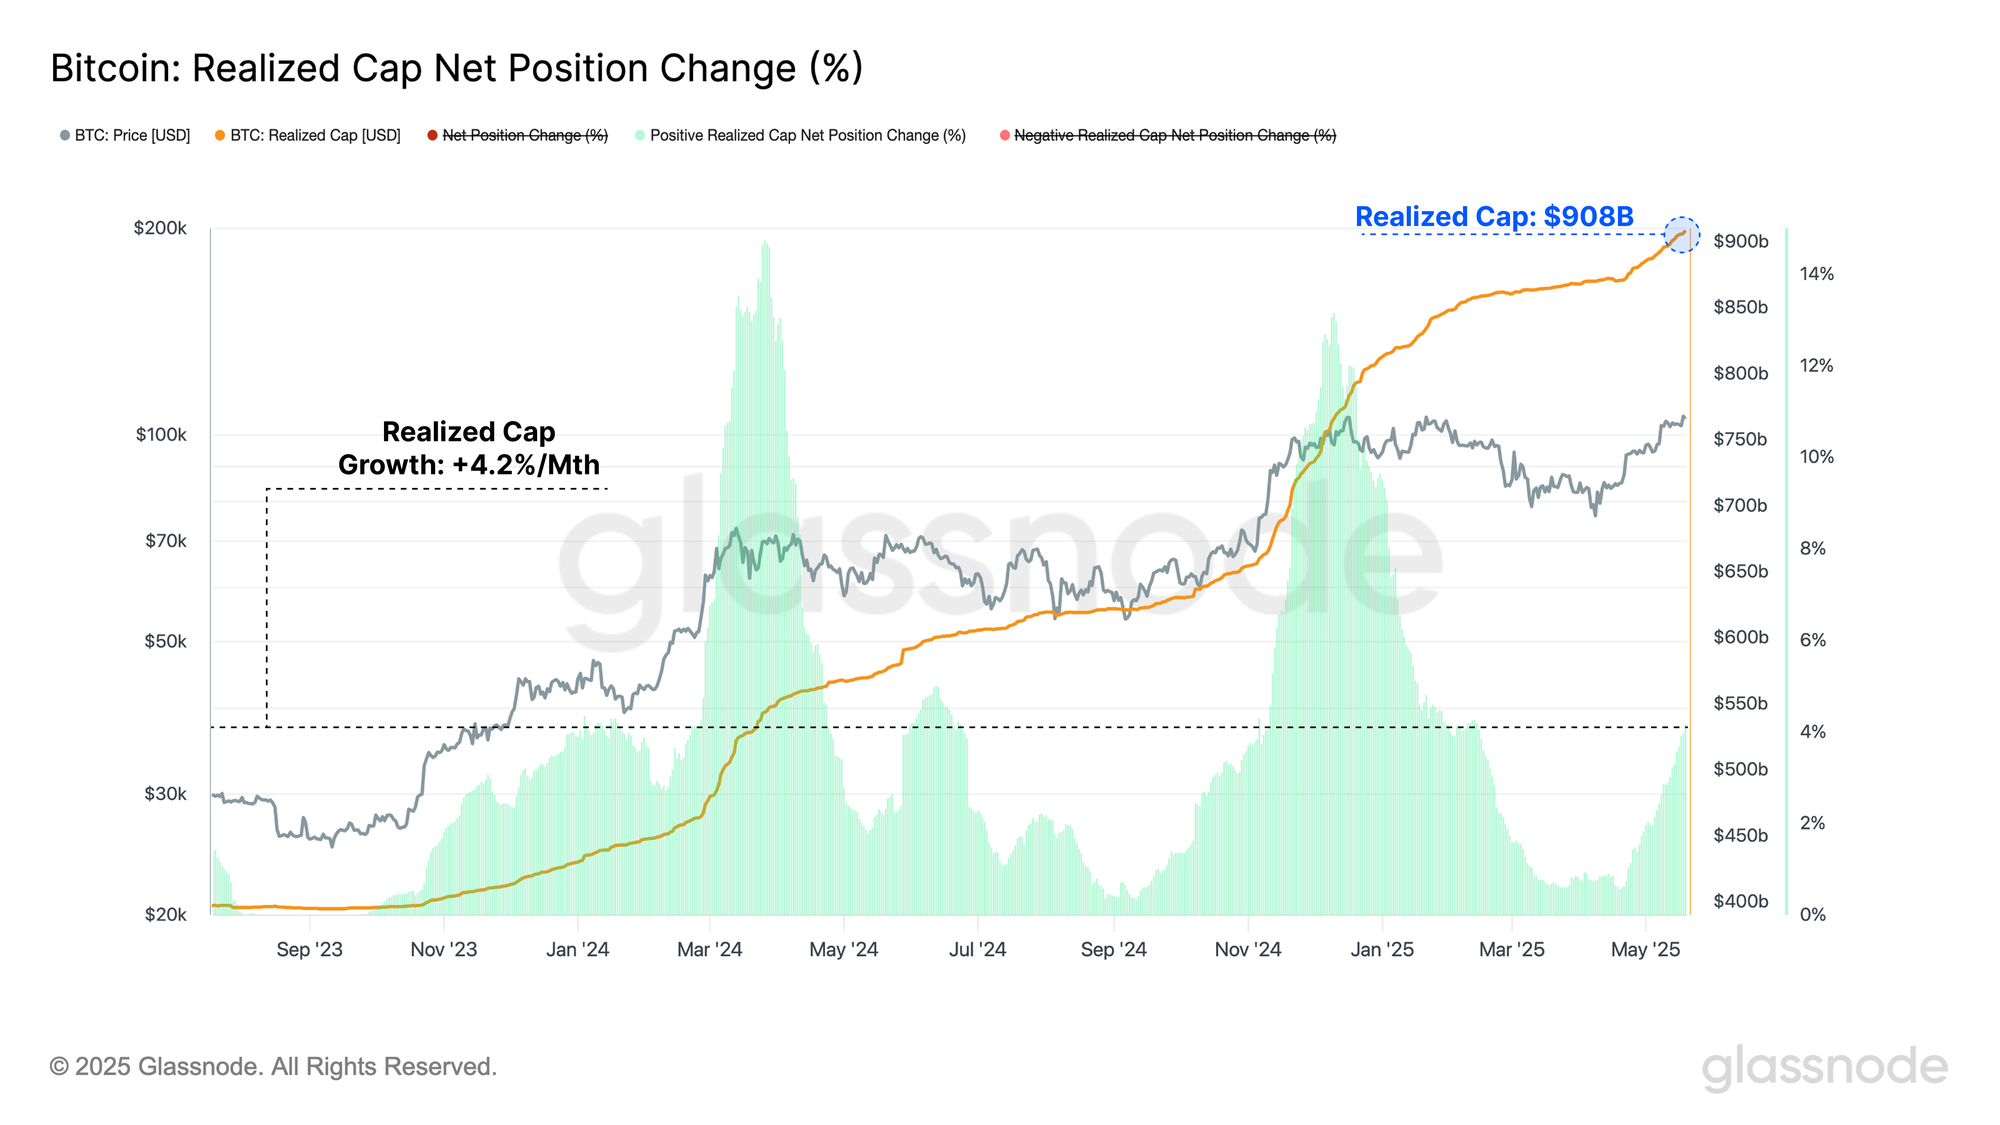
One way to quantify shifts in this supply and demand balance is via the Realized Cap metric, which aggregates the cumulative net capital inflows into a digital asset. Over the past month, the total value stored in the Bitcoin network has grown by +4.2%, reflecting a meaningful uptick in capital entering the market.
This has pushed the Realized Cap to a new ATH, and over $900B for the first time, a significant milestone that underscores the immense value investors have stored within the leading digital asset.
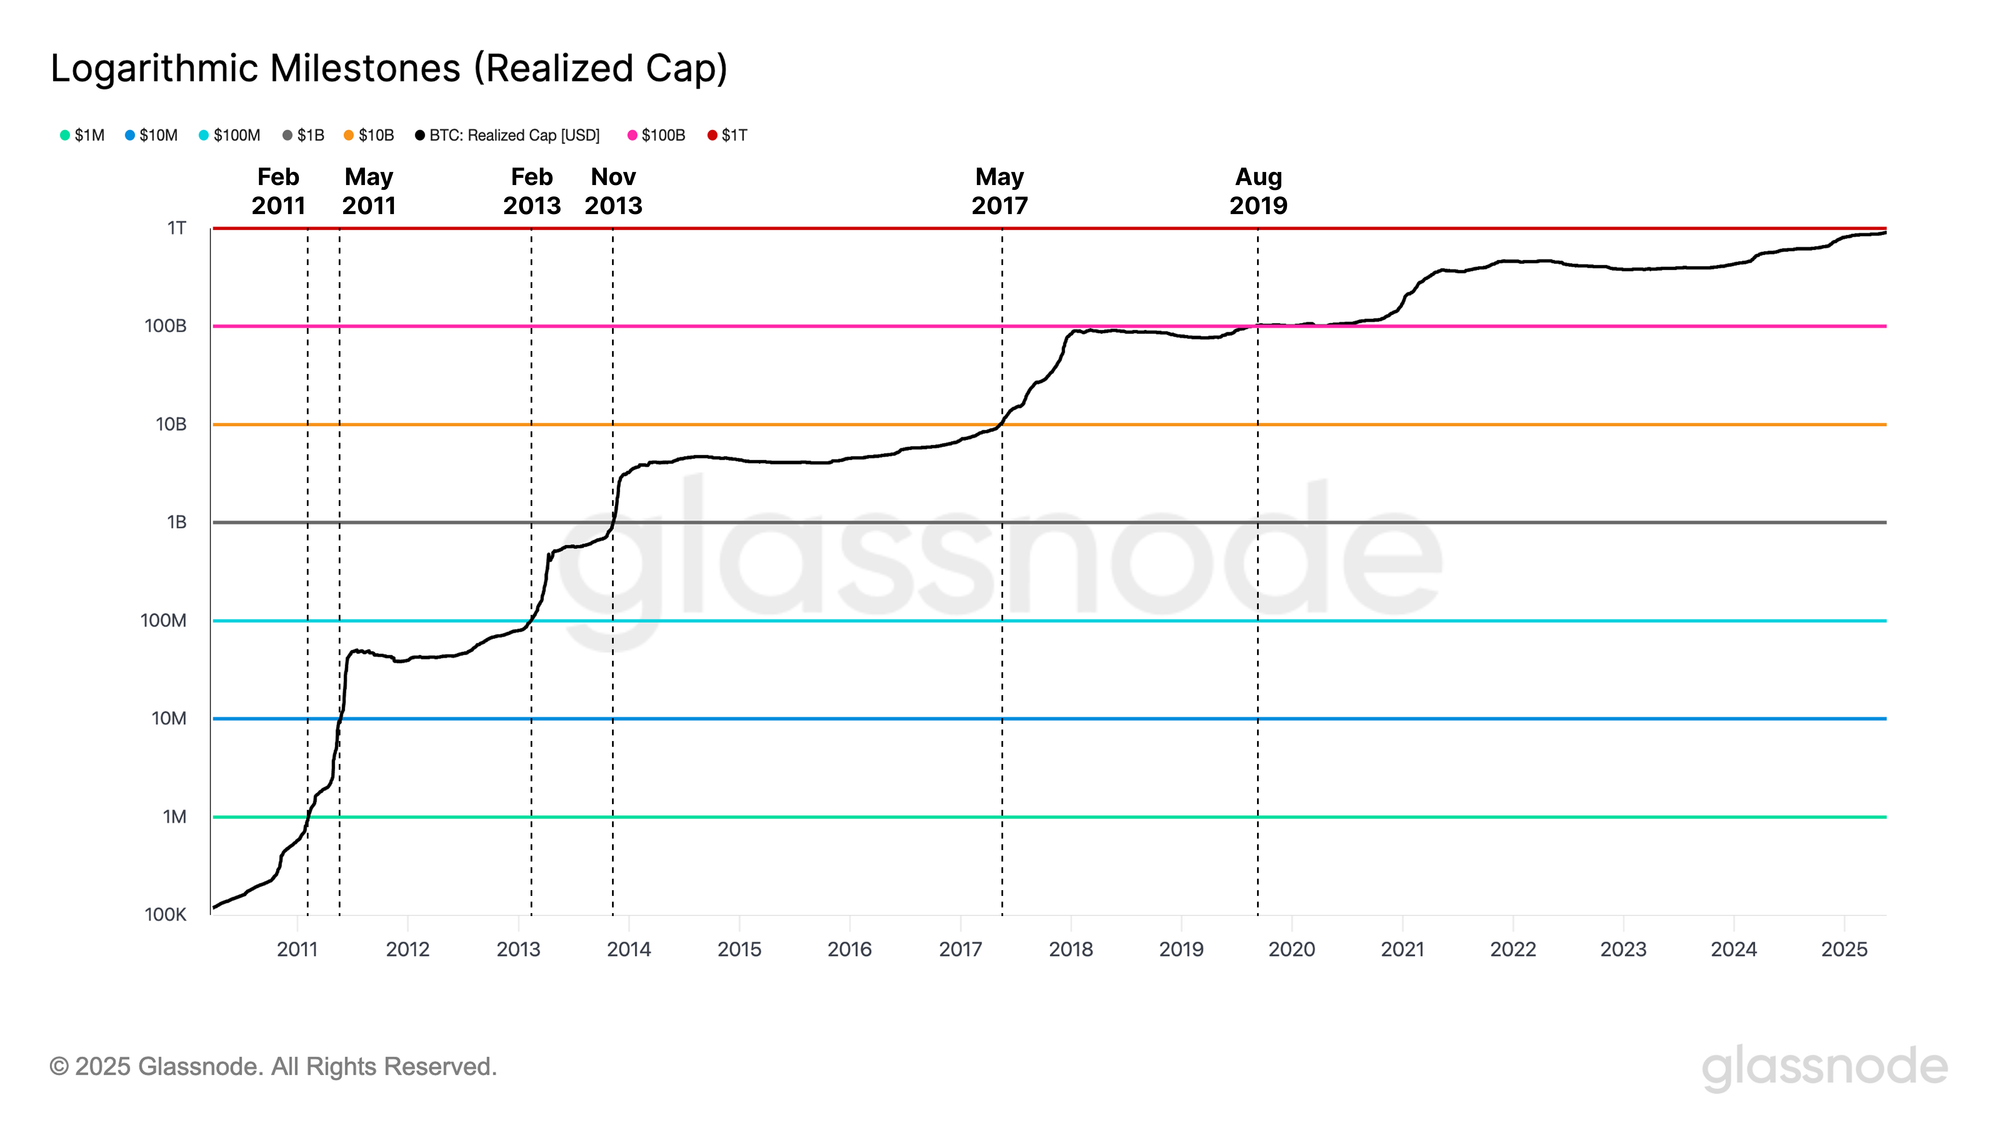
With a $1T milestone for the Realized Cap on the horizon, we can track how capital flows have accrued in the Bitcoin network over its 16-year history. The chart below illustrates the duration between each log-scale milestone that the realized cap has surpassed over time:
- $1M: February 2011
- $10M: May 2011
- $100M: February 2013
- $1B: November 2013
- $10B: May 2017
- $100B: August 2019
Between 2011 and 2013, the realized cap moved from $1M to over $1B, clearing four logarithmic milestones over a 2-year time horizon. Bitcoin was a far smaller asset than it is today, and experienced exponential growth during the network's initial bootstrapping phase. The next major milestone of $10B required three and a half years before the Realized Cap hit $10B in mid-2017.
The last logarithmic milestone of $100B was reached nearly 6 years ago in August 2019. This is the longest interval between logarithmic milestones, showing how the appreciation and growth of the asset has slowed over time, requiring longer periods of time, and increasingly large volumes of capital required before it can cross the $1T threshold.
Short-Term Holder Profit Taking
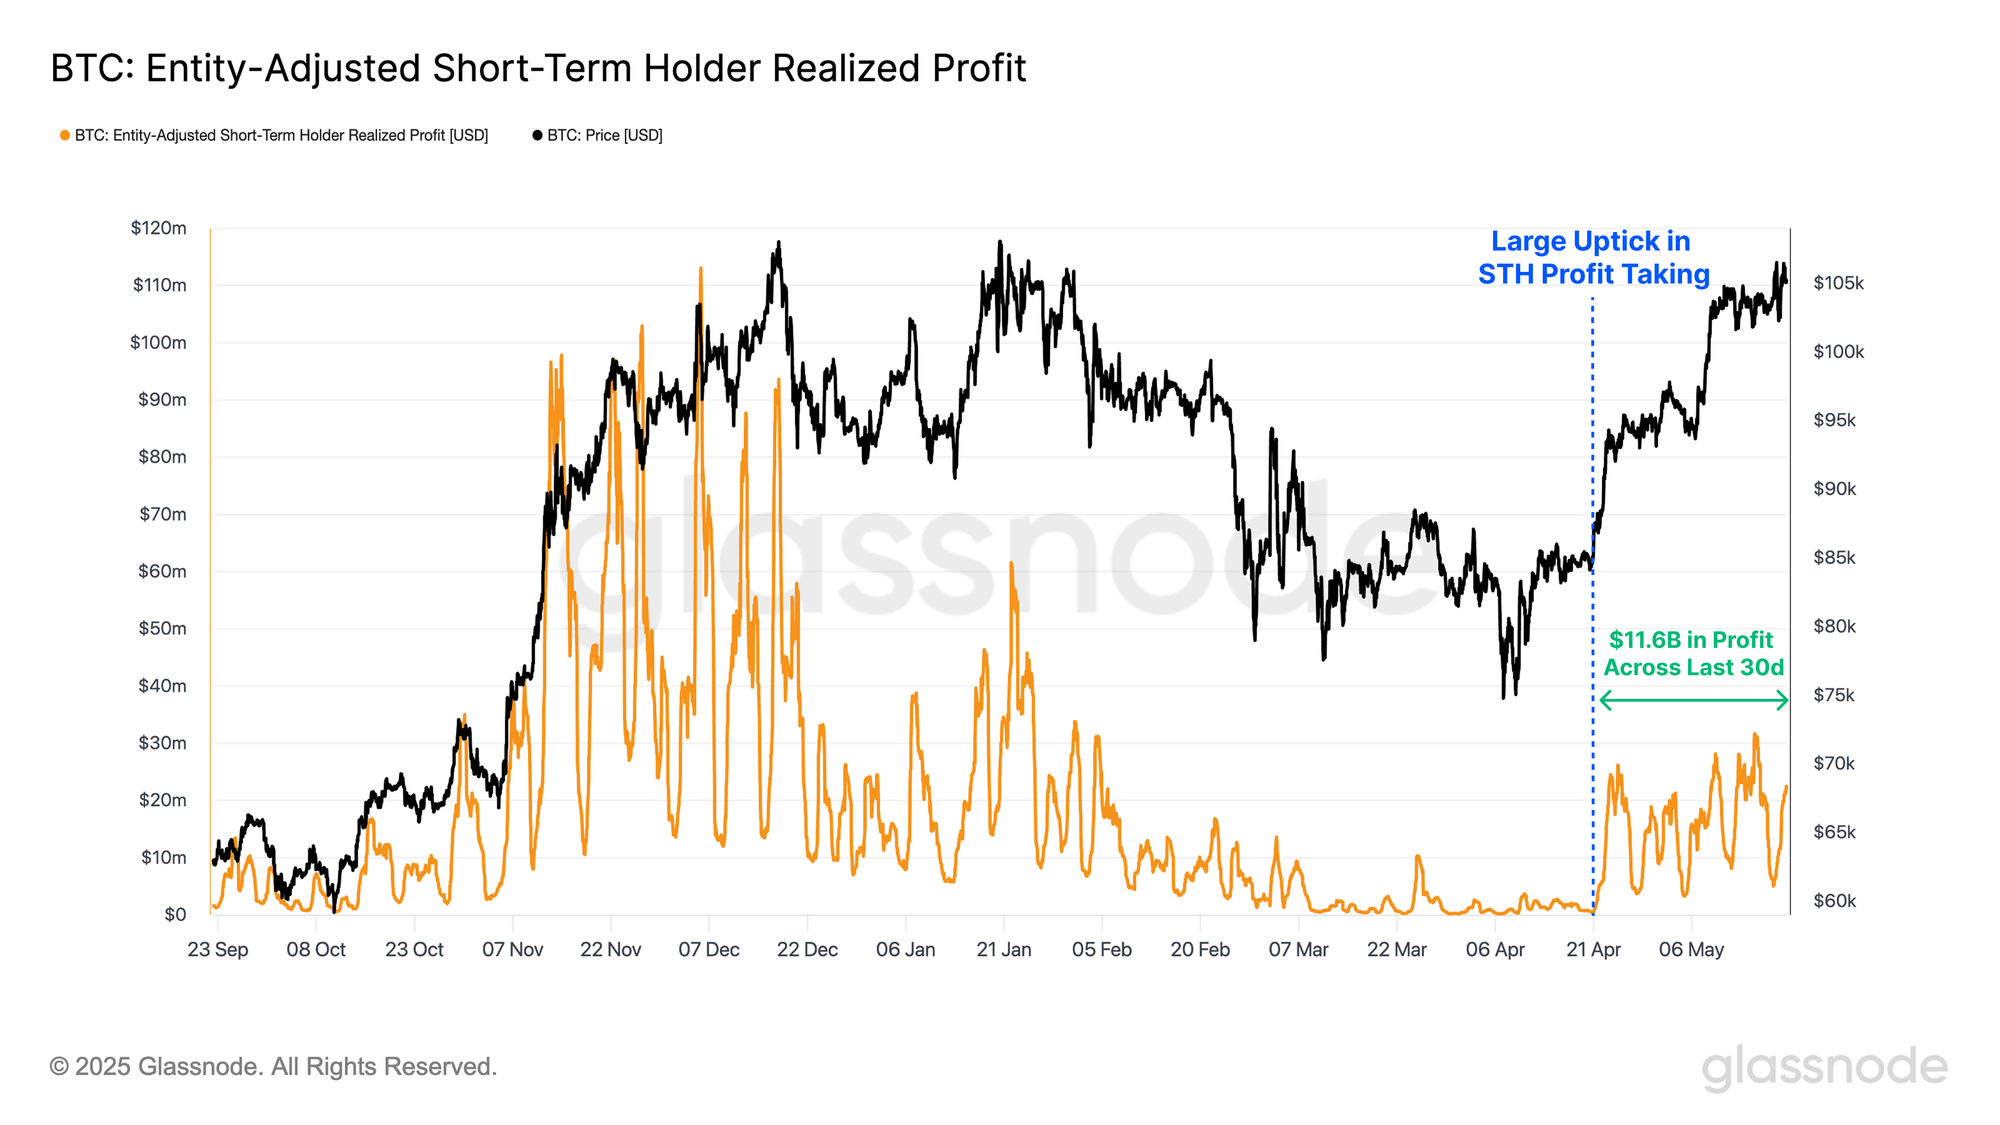
Following one of the sharpest improvements in Short-Term Holder profitability on record, it is likely that many recent dip buyers will switch into profit-taking, to capitalize on market strength.
As the price accelerated towards the Short-Term Holder cost-basis of $93k, and then decisively broke above it, we can see a substantial uptick in profit-taking activity, peaking at $747M/day.
Over the last 30 days, we have seen a total of $11.4B in cumulative realized profit by Short-Term Holders. For comparison, over the previous 30-day period, only $1.2B of profit was realized, underscoring how drastic the rebound in new investor sentiment and spending behaviour has been.
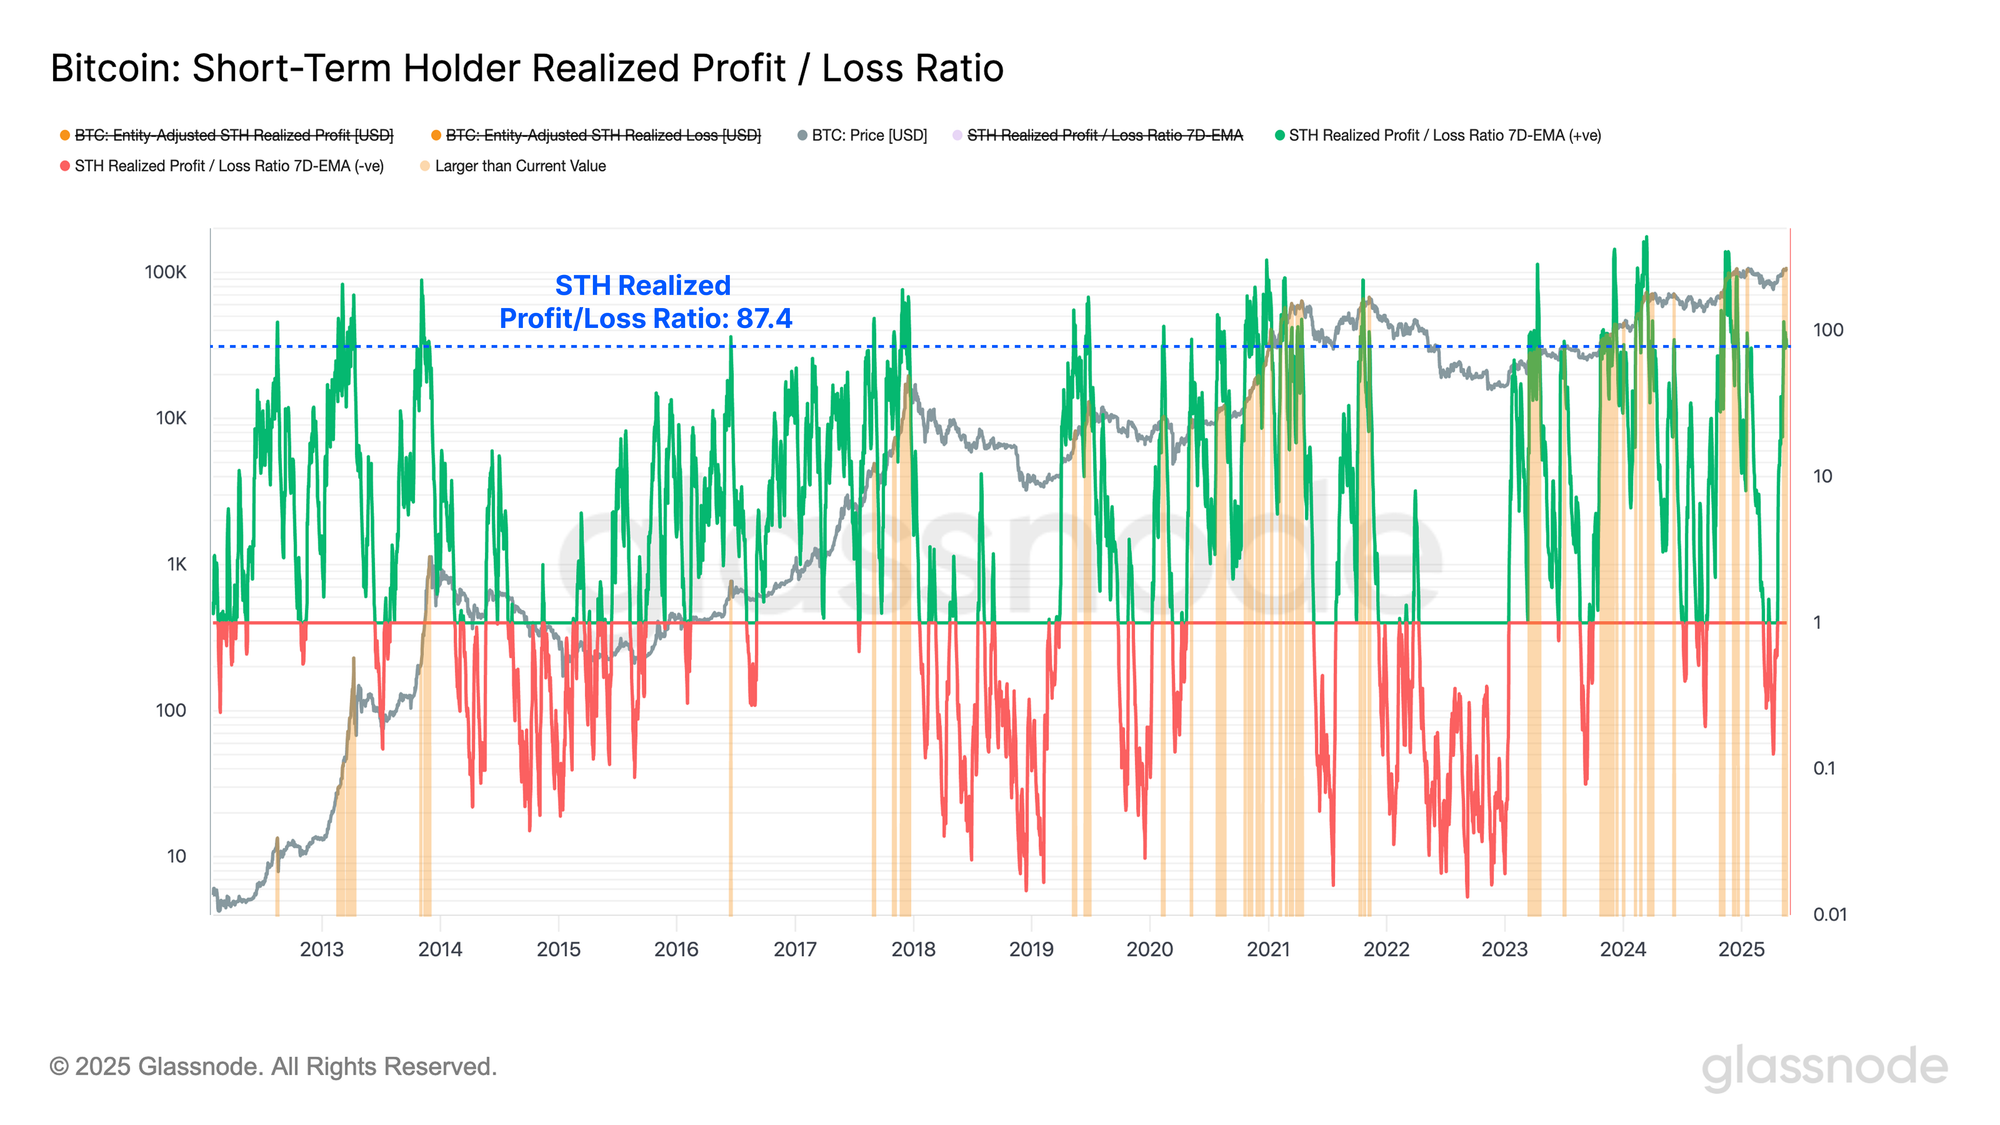
This shift has caused a major spike in the Short-Term Holder Realized Profit/Loss Ratio. Realized profit volumes for Short-Term Holders now massively outweigh realized losses, such that only 8% of trading days have seen the P/L Ratio at a higher level.
Historically, values this elevated are typical during strong bullish impulses, but also tend to occur as the market rallies towards local and global topping formations. Excessive profit taking can overwhelm the inflow of new demand, resulting in an excess of overhead supply acting as resistance.
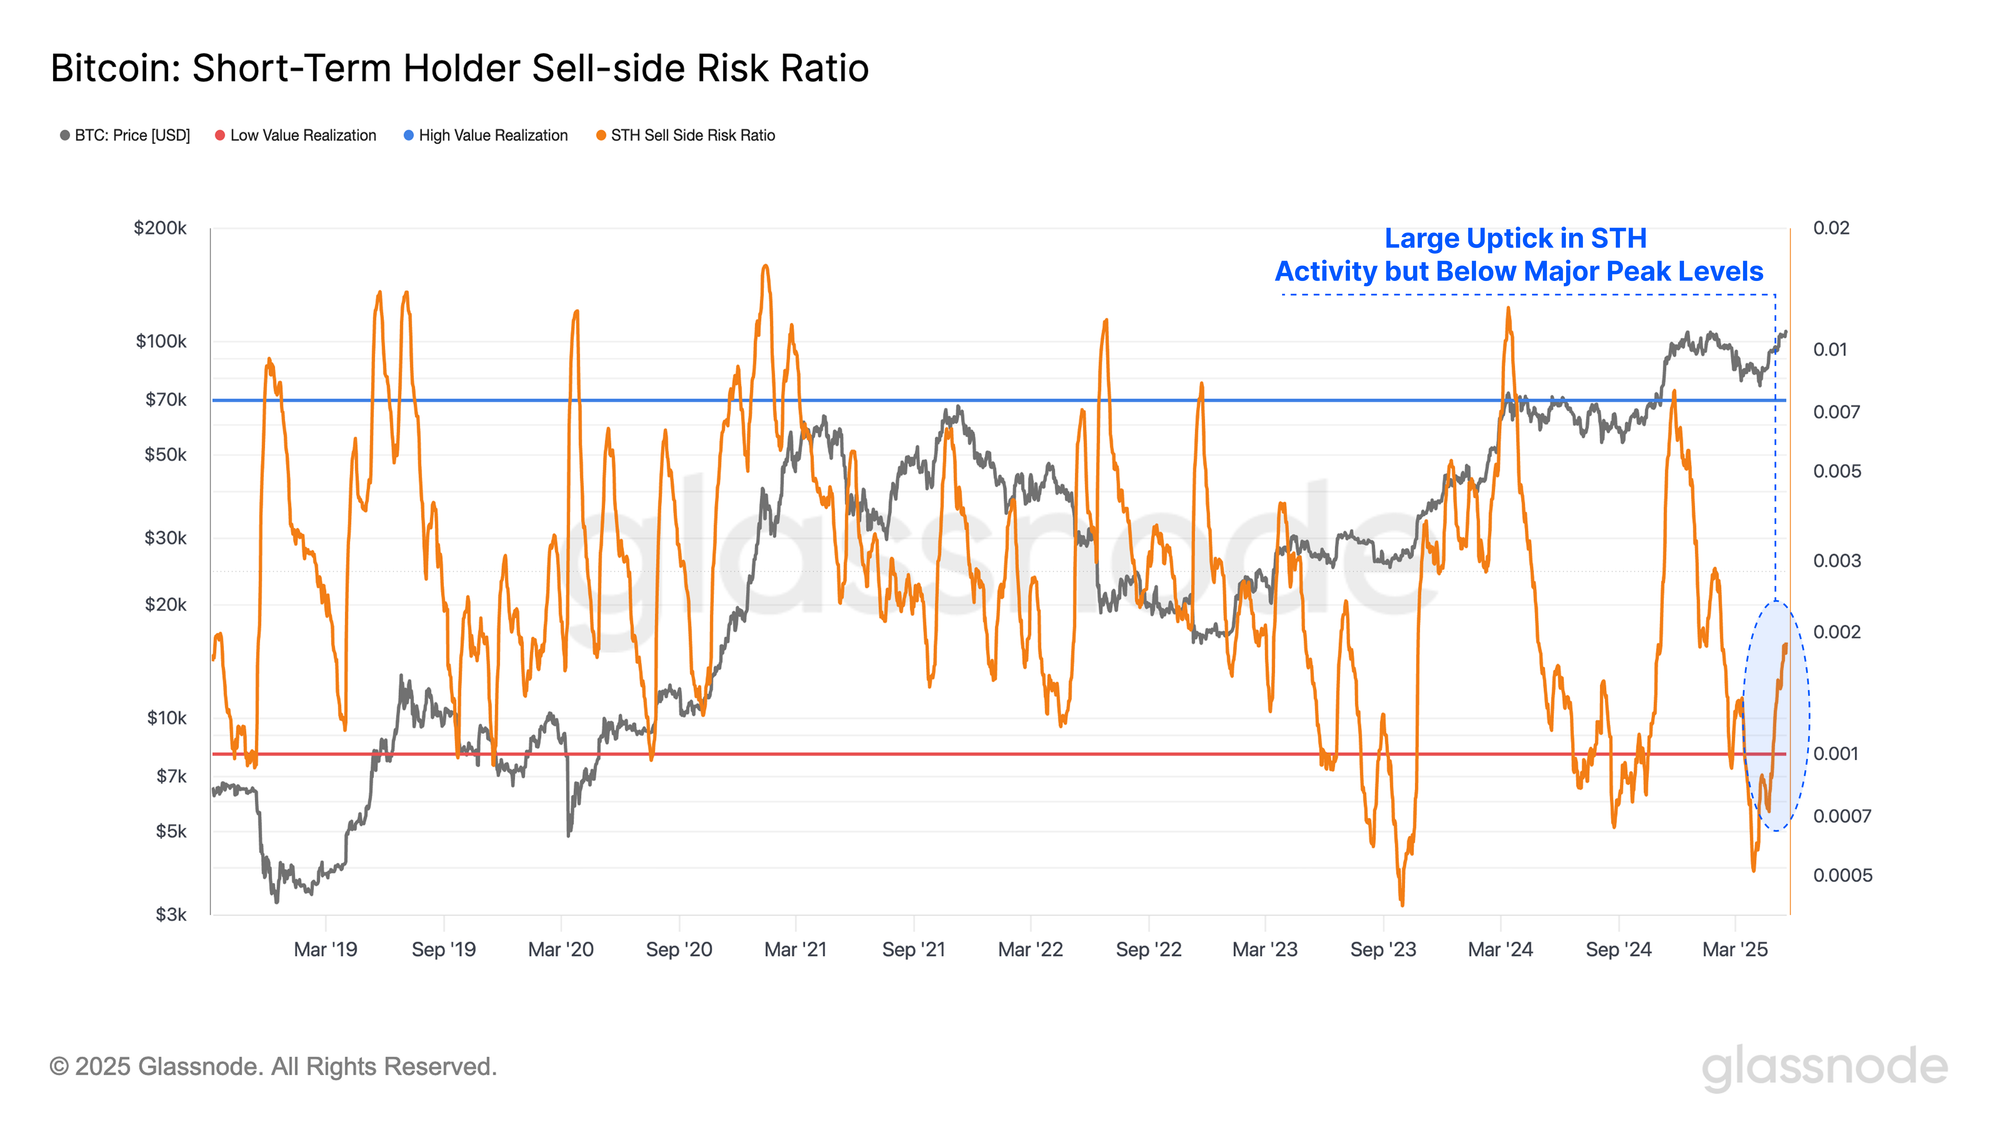
We can complement this analysis by utilizing the Sell-Side Risk Ratio, which is a powerful tool assessing how, at equilibrium, the market is viewed from the perspective of existing holders. We can consider this metric under the following framework:
- High values indicate that investors spend coins at a large profit or loss relative to their cost basis. This condition indicates that the market likely needs to re-find equilibrium and usually follows a high volatility price move.
- Low values indicate that most coins are being spent relatively close to their break-even cost basis, suggesting a degree of equilibrium has been reached. This condition often signifies an exhaustion of ‘profit and loss’ within the current price range and usually describes a low volatility environment.
For the Short-Term Holder cohort, we can see a sharp uptick in their Sell-Side Risk Ratio, although it remains significantly below levels often seen around major peaks. This suggests there may still be room for the market rally to continue, as investors are not yet locking in excessive profits relative to their total holdings.
Ethereum Surges on Pectra Upgrade
Ethereum is the second-largest digital asset and has faced challenging market conditions in recent years. The ETH price has fallen short of many investors' expectations since 2023, and has thus far not set a new ATH in this cycle.
However, the ETH price has experienced a major price surge in recent weeks, potentially driven by excitement around the successful Pectra upgrade on May 7th. The Pectra upgrade aims to consolidate the validator set and enhance overall network efficiency.
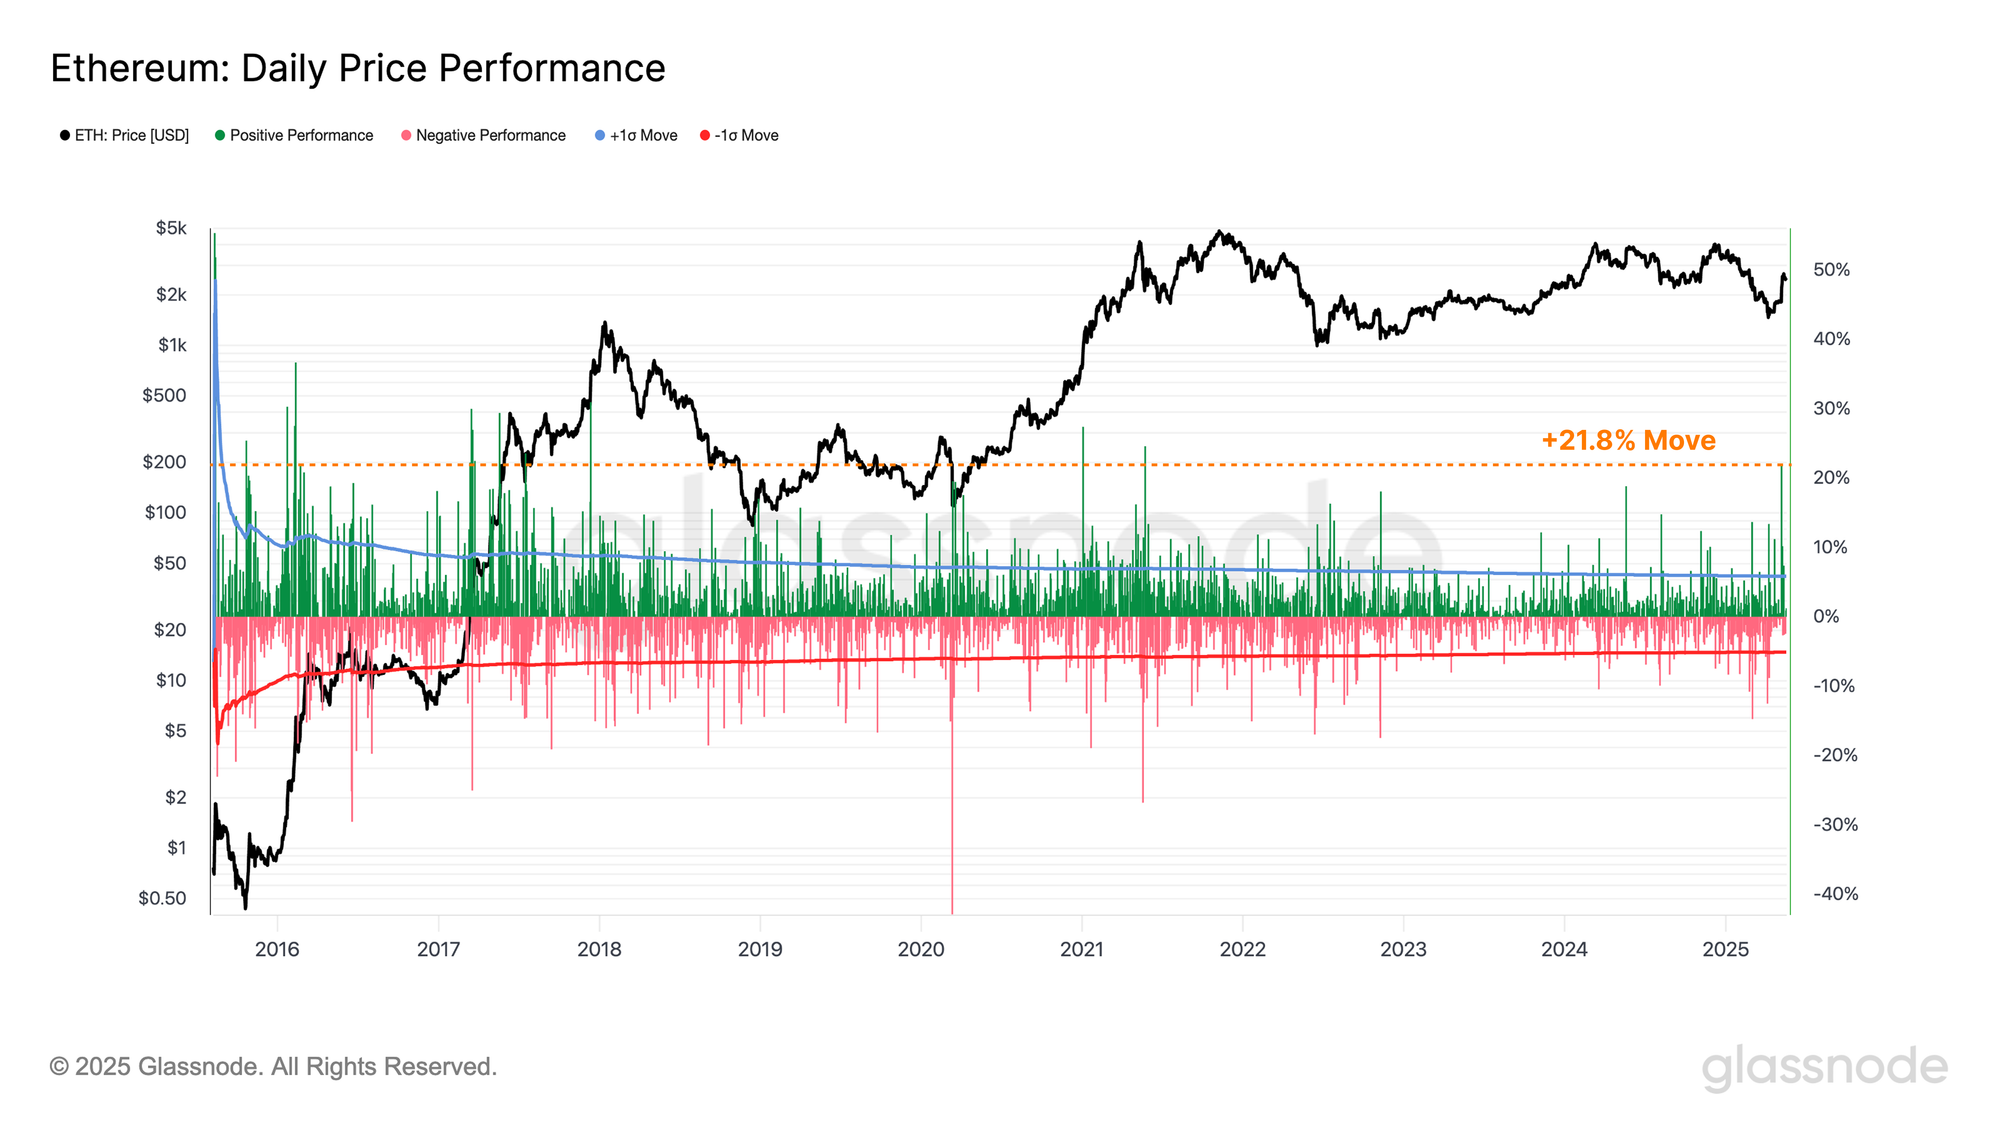
The Ethereum price has rallied from $1,800 to a new local high of $2,700, a +50% increase in a few weeks, offering significant financial relief to investors.
The recent rally included several daily price gains exceeding +1σ moves, with the most significant being a +21.8% surge, the strongest one-day increase since May 2021.
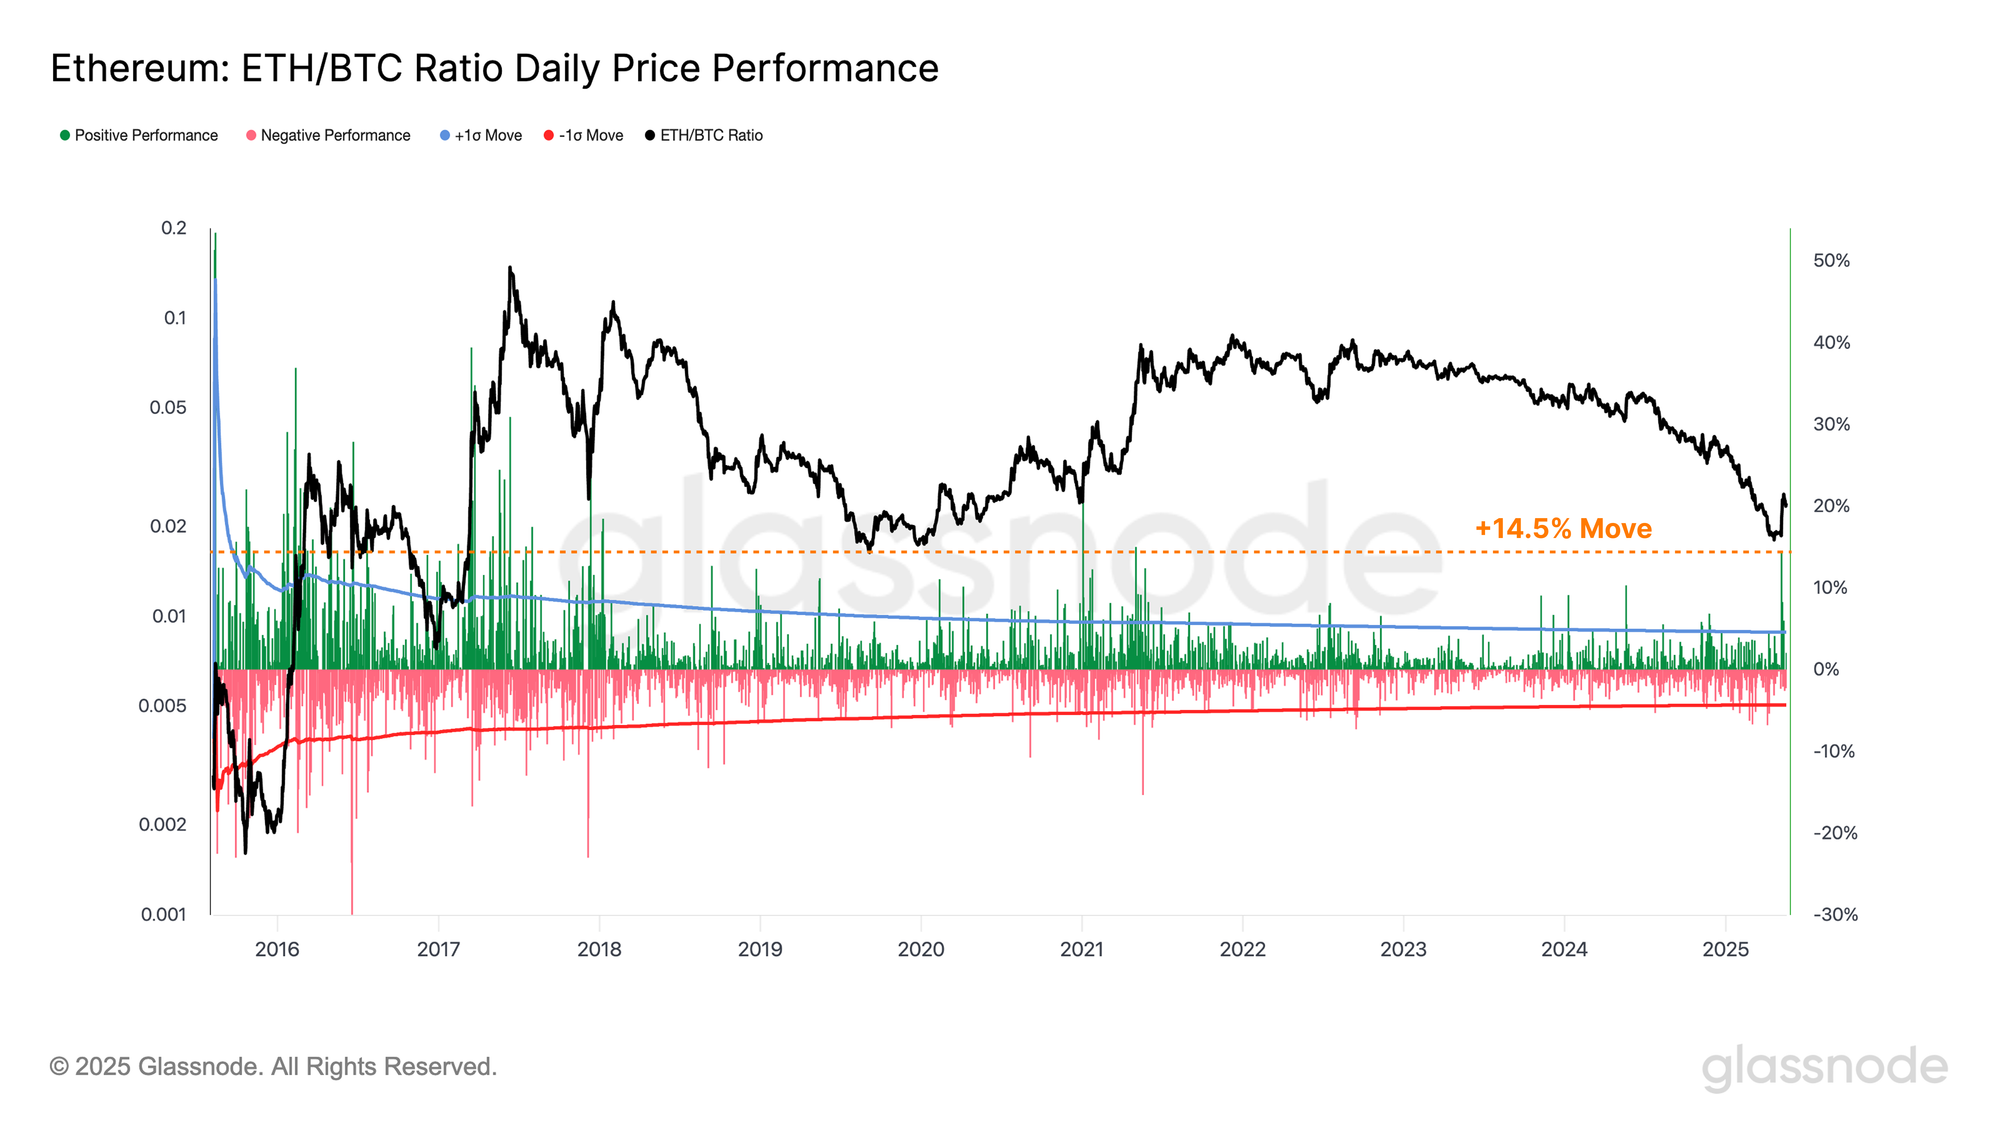
The divergence in performance between the two leading digital assets this cycle is reflected in the ETH/BTC ratio, which has been in a sustained downtrend since the 2022 Merge event. It recently bottomed at 0.018, the lowest level since January 2020.
Ethereum’s recent outperformance has resulted in a resurgence of the ETH/BTC Ratio, with the ratio accelerating to a value of 0.026, an increase of 14.5%, the 46th largest event on record.
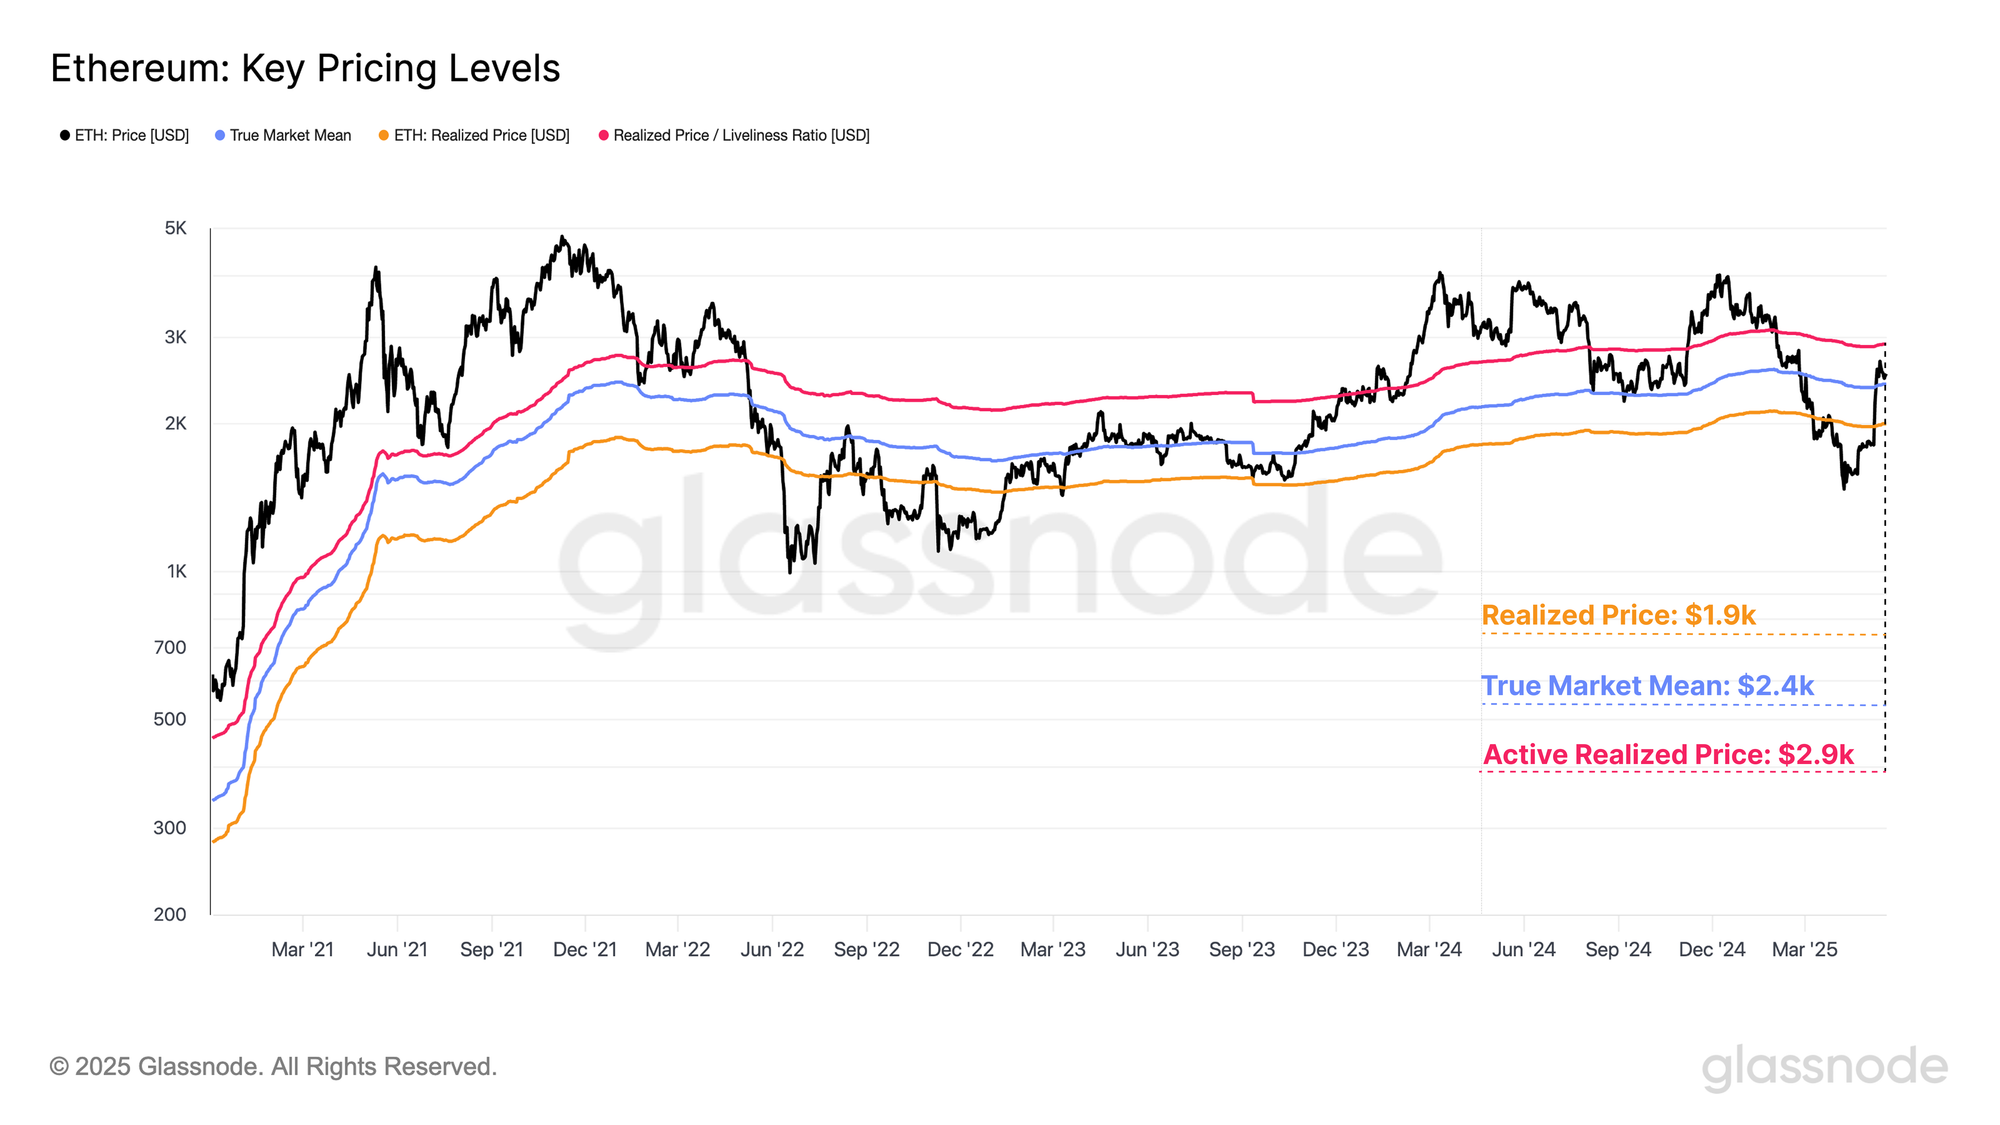
Of interest, this price rally has decisively broken above the Realized Price, which is trading at $1,900. This indicates the average holder of ETH is now back in an unrealized profit, providing meaningful financial relief for many holders.
The Active Realized Price and True Market Mean are two alternative onchain valuation models which often trade near the midpoint of Ethereum market cycles. These metrics estimate the cost basis of active market participants and discount lost coins and long-dormant supply. This results in a more accurate read of the cost basis for economically active investors.
- True Market Mean: $2,400
- Active Realized Price: $2,900
Encouragingly, price has also moved above the True Market Mean, underscoring the strength of this upwards price move. However, the Active Realized Price still sits overhead and remains a key level that must be decisively reclaimed to support continued improvement in Ethereum investor confidence.
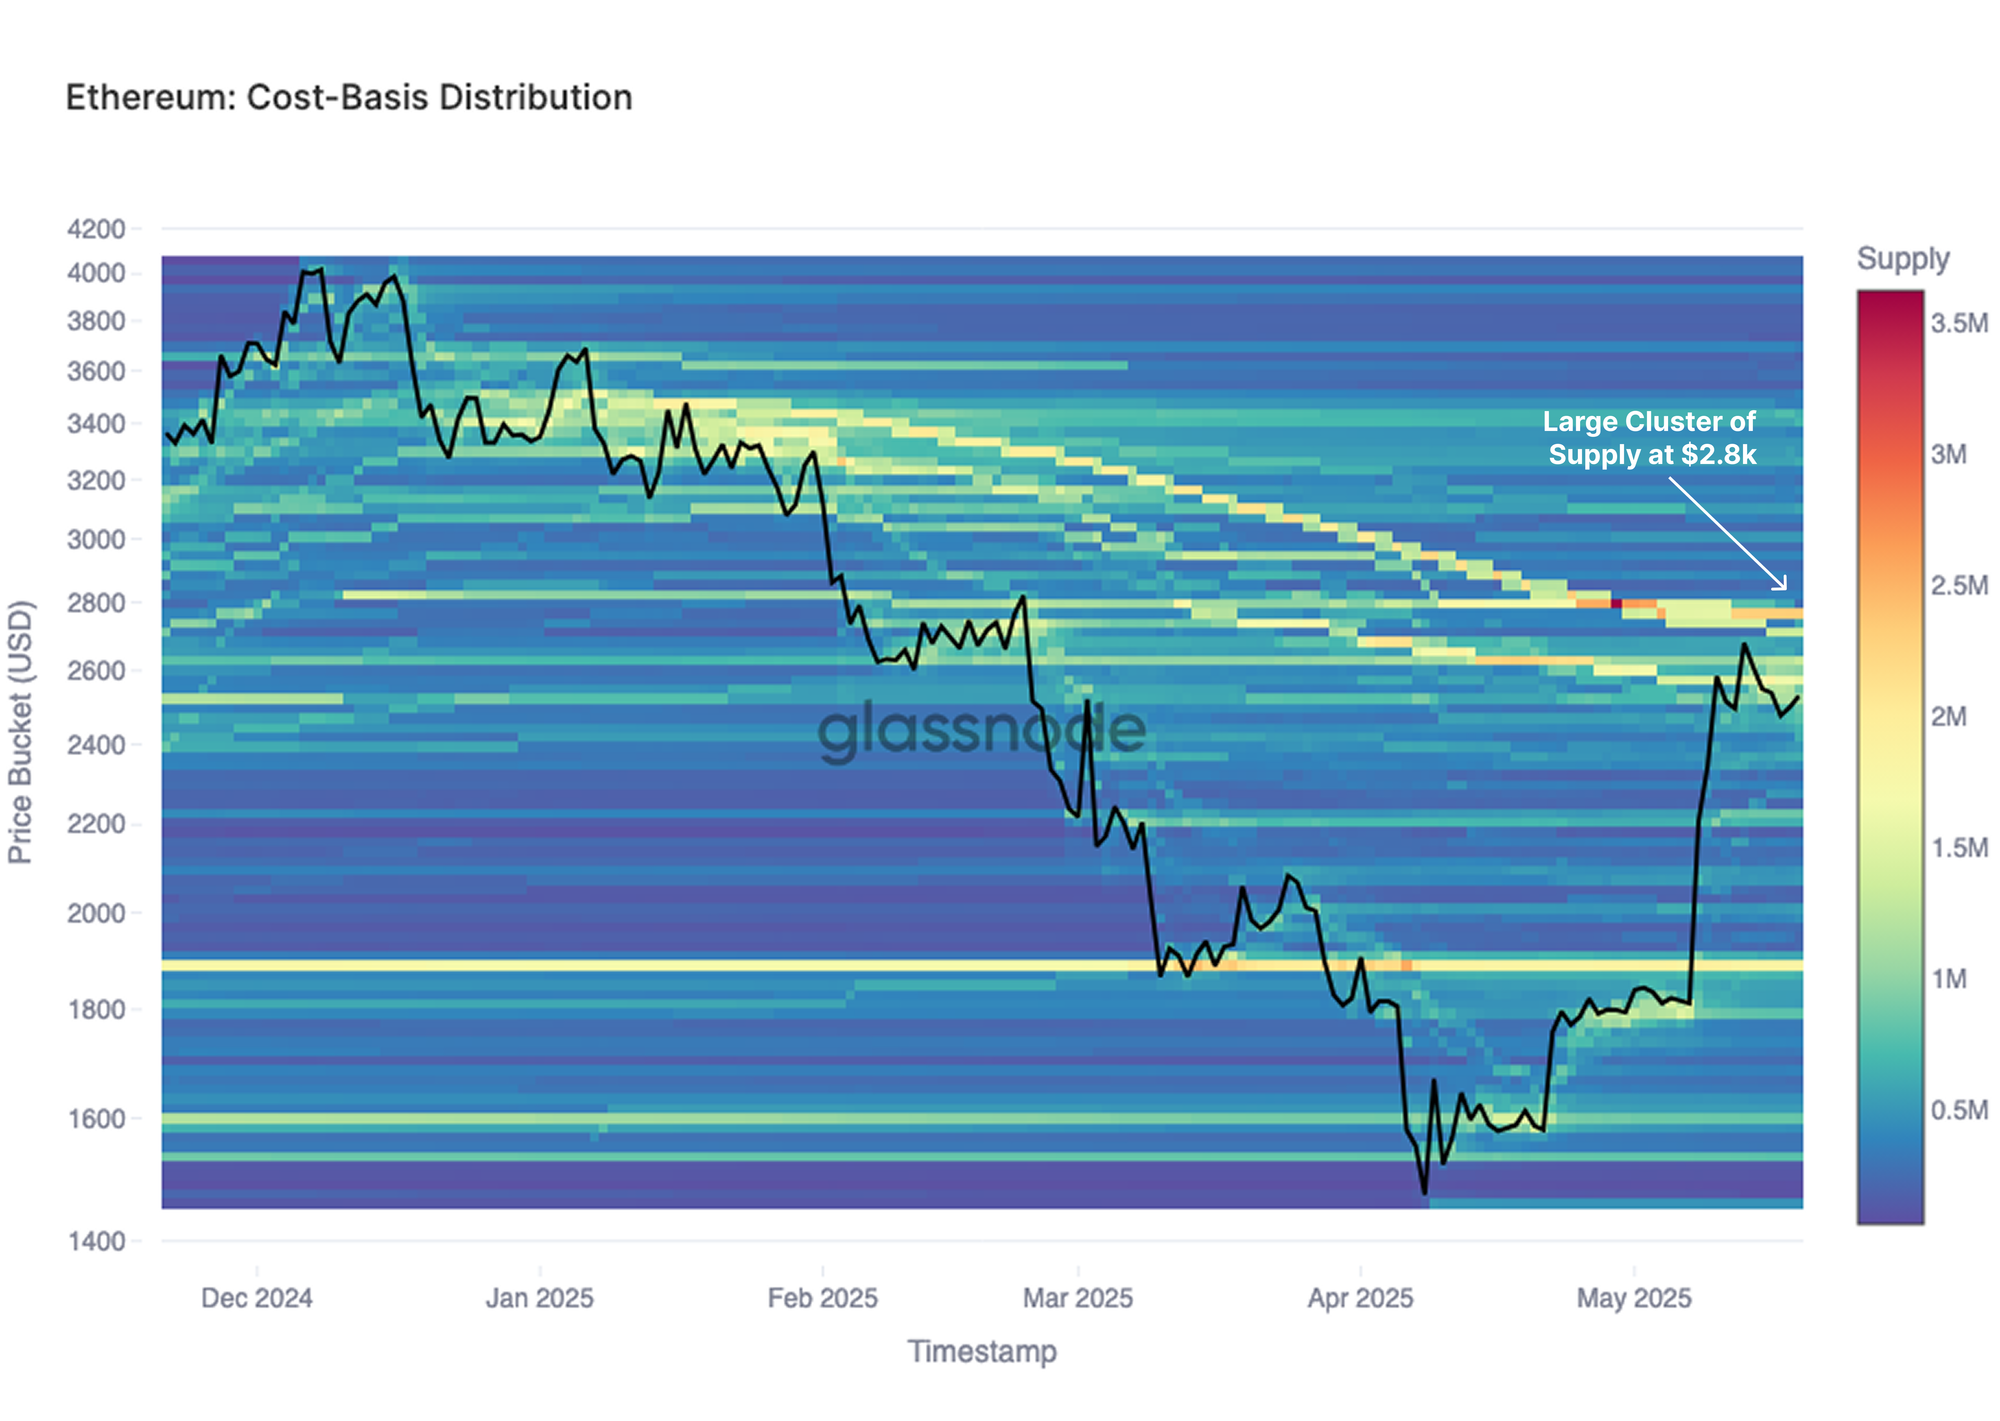
We can find confluence when examining Ethereum’s Cost-Basis Distribution profile. Presently, there is a significant concentration of investor cost basis levels around the $2,800 level. This region is likely to attract increased sell-side pressure, as many investors who were previously underwater may look to de-risk at, or near, their breakeven level, and take some chips off the table.
Summary and Conclusion
Strength in the digital asset market remains robust, with Bitcoin continuing to consolidate just beneath its ATH of $109k. The elevation in price has raised the profitability of the vast majority of market investors, with many seizing the opportunity to lock in profits. As a result, capital inflows have increased markedly, pushing the Realized Cap above $900B for the first time, a historic milestone that underscores the depth of liquidity in the market.
For the Short-Term Holders, the improvement in their portfolio values has directly translated into a notable increase in spending activity, with the cohort realizing over $11.4B of profit across the last month.
Ethereum has shown a strong response following the Pectra upgrade, with its spot price rallying from $1,800 to a high of $2,700. This recovery has returned the average ETH holder to a position of unrealized profit, offering meaningful financial relief. Notably, the $2,400–$2,900 range remains a key zone of interest, serving as both a resistance band and a potential breakout region critical for sustaining further upward momentum.
Disclaimer: This report does not provide any investment advice. All data is provided for informational, and educational purposes only. No investment decision shall be based on the information provided here and you are solely responsible for your own investment decisions.
Exchange balances presented are derived from Glassnode’s comprehensive database of address labels, which are amassed through both officially published exchange information and proprietary clustering algorithms. While we strive to ensure the utmost accuracy in representing exchange balances, it is important to note that these figures might not always encapsulate the entirety of an exchange’s reserves, particularly when exchanges refrain from disclosing their official addresses. We urge users to exercise caution and discretion when utilizing these metrics. Glassnode shall not be held responsible for any discrepancies or potential inaccuracies.
Please read our Transparency Notice when using exchange data.
- Join our Telegram channel.
- For on-chain metrics, dashboards, and alerts, visit Glassnode Studio.