Bulls Under Pressure
Following several months of sideways price action, Bitcoin has experienced its deepest correction since late 2022, trading below the 200DMA, and putting a significant number of Short-Term Holders into an unrealized loss.


Executive Summary:
- Bitcoin has recorded its deepest drawdown for the current cycle, trading more than -26% below the ATH. Despite this, the drawdown remains historically shallow relative to past cycles.
- This price contraction has put a significant volume of Short-Term Holder Supply into an unrealized loss, with over 2.8M BTC now underwater based on their on-chain acquisition price.
- Whilst financial pressure is elevated amongst Short-Term Holders, the magnitude of losses locked in has remained relatively subdued in comparison to the market size.
Price Performance
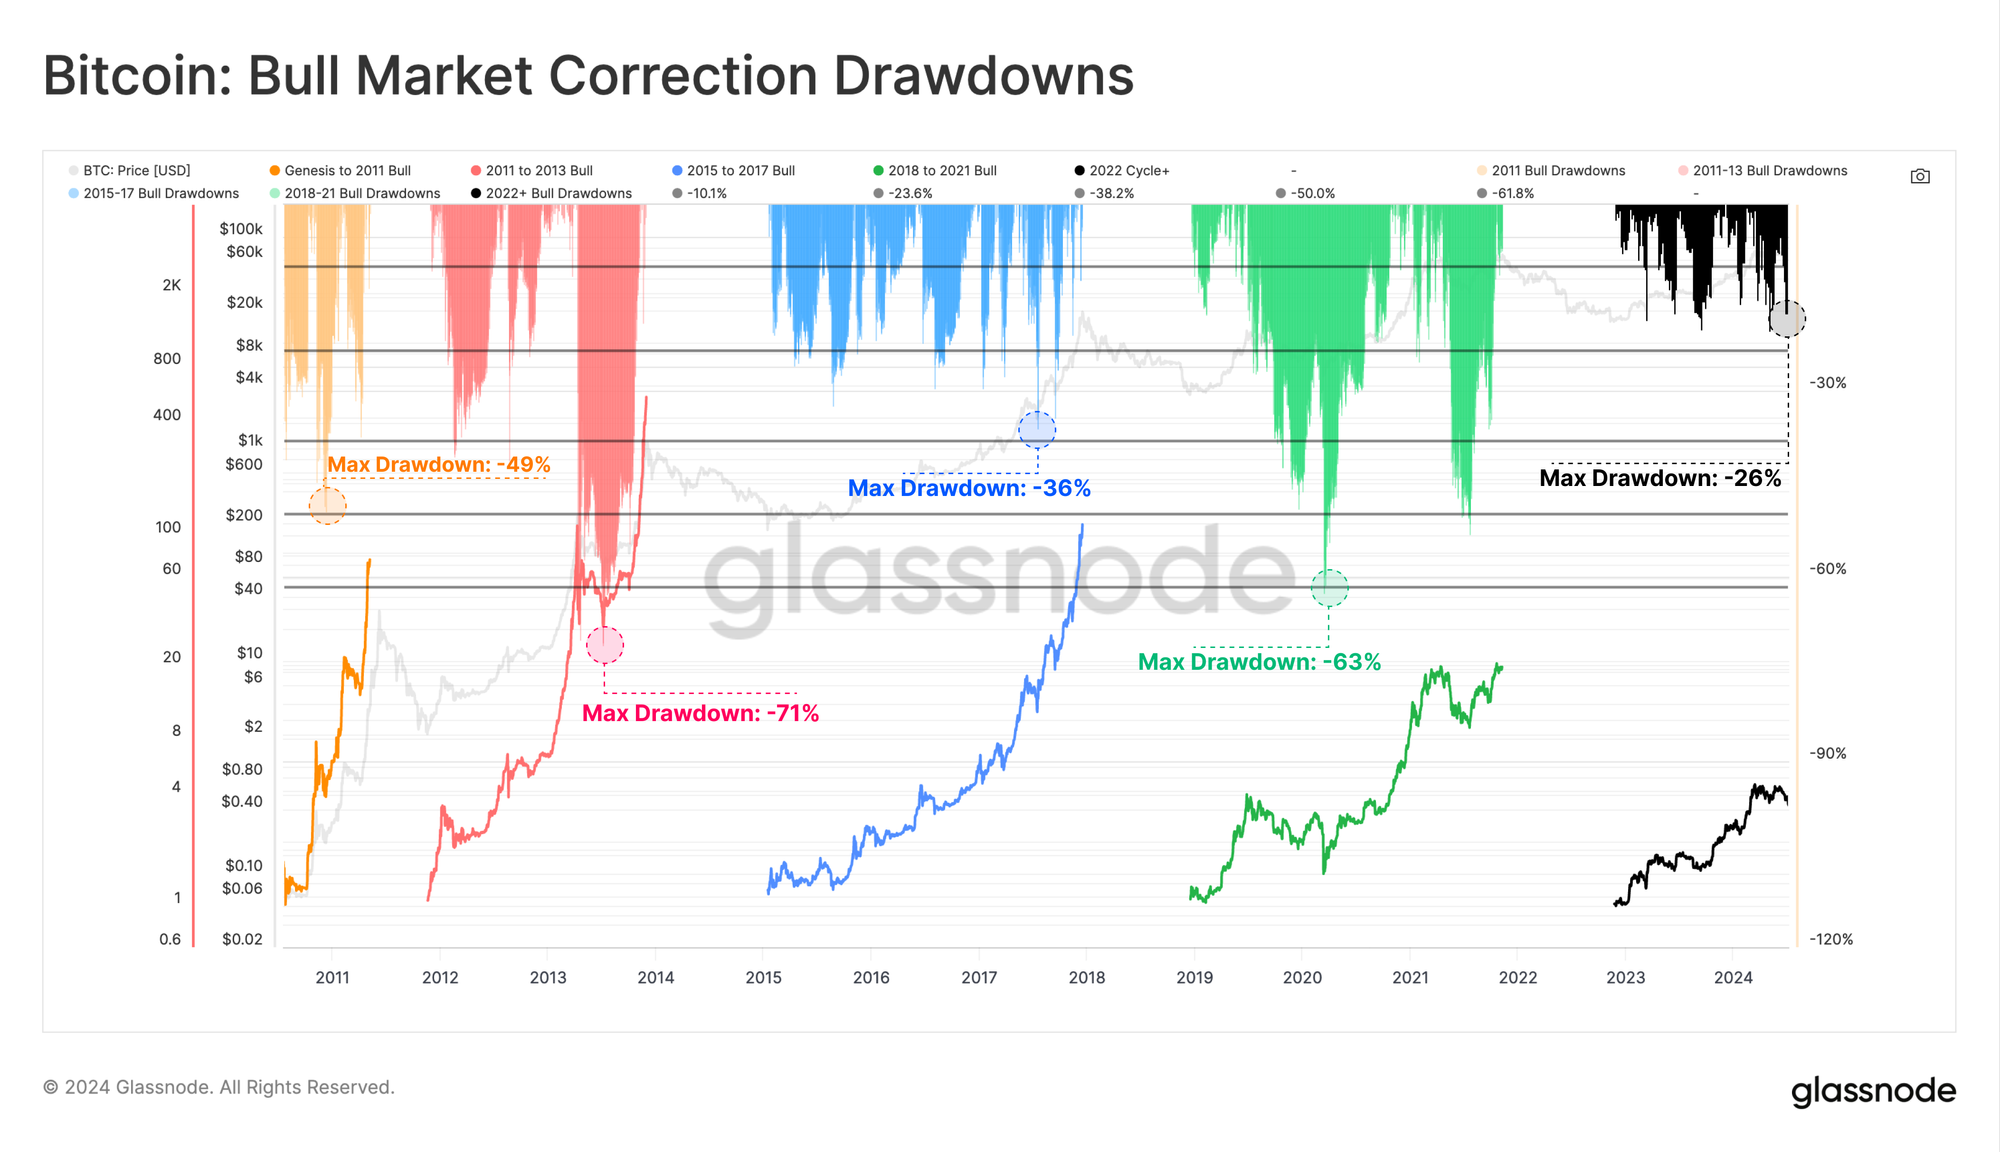
The 2023-24 Bitcoin cycle has been both similar and different to previous cycles. The market experienced around 18 months of steady price appreciation after the collapse of FTX, followed by three months of range-bound price action after the $73k ETF high. Between May and July, the market experienced its deepest cycle correction, recording a drawdown exceeding -26% from the ATH.
Whilst this is meaningful, this downtrend has been notably shallower than previous cycles, highlighting a relatively robust underlying market structure and compression of volatility as Bitcoin matures as an asset class.
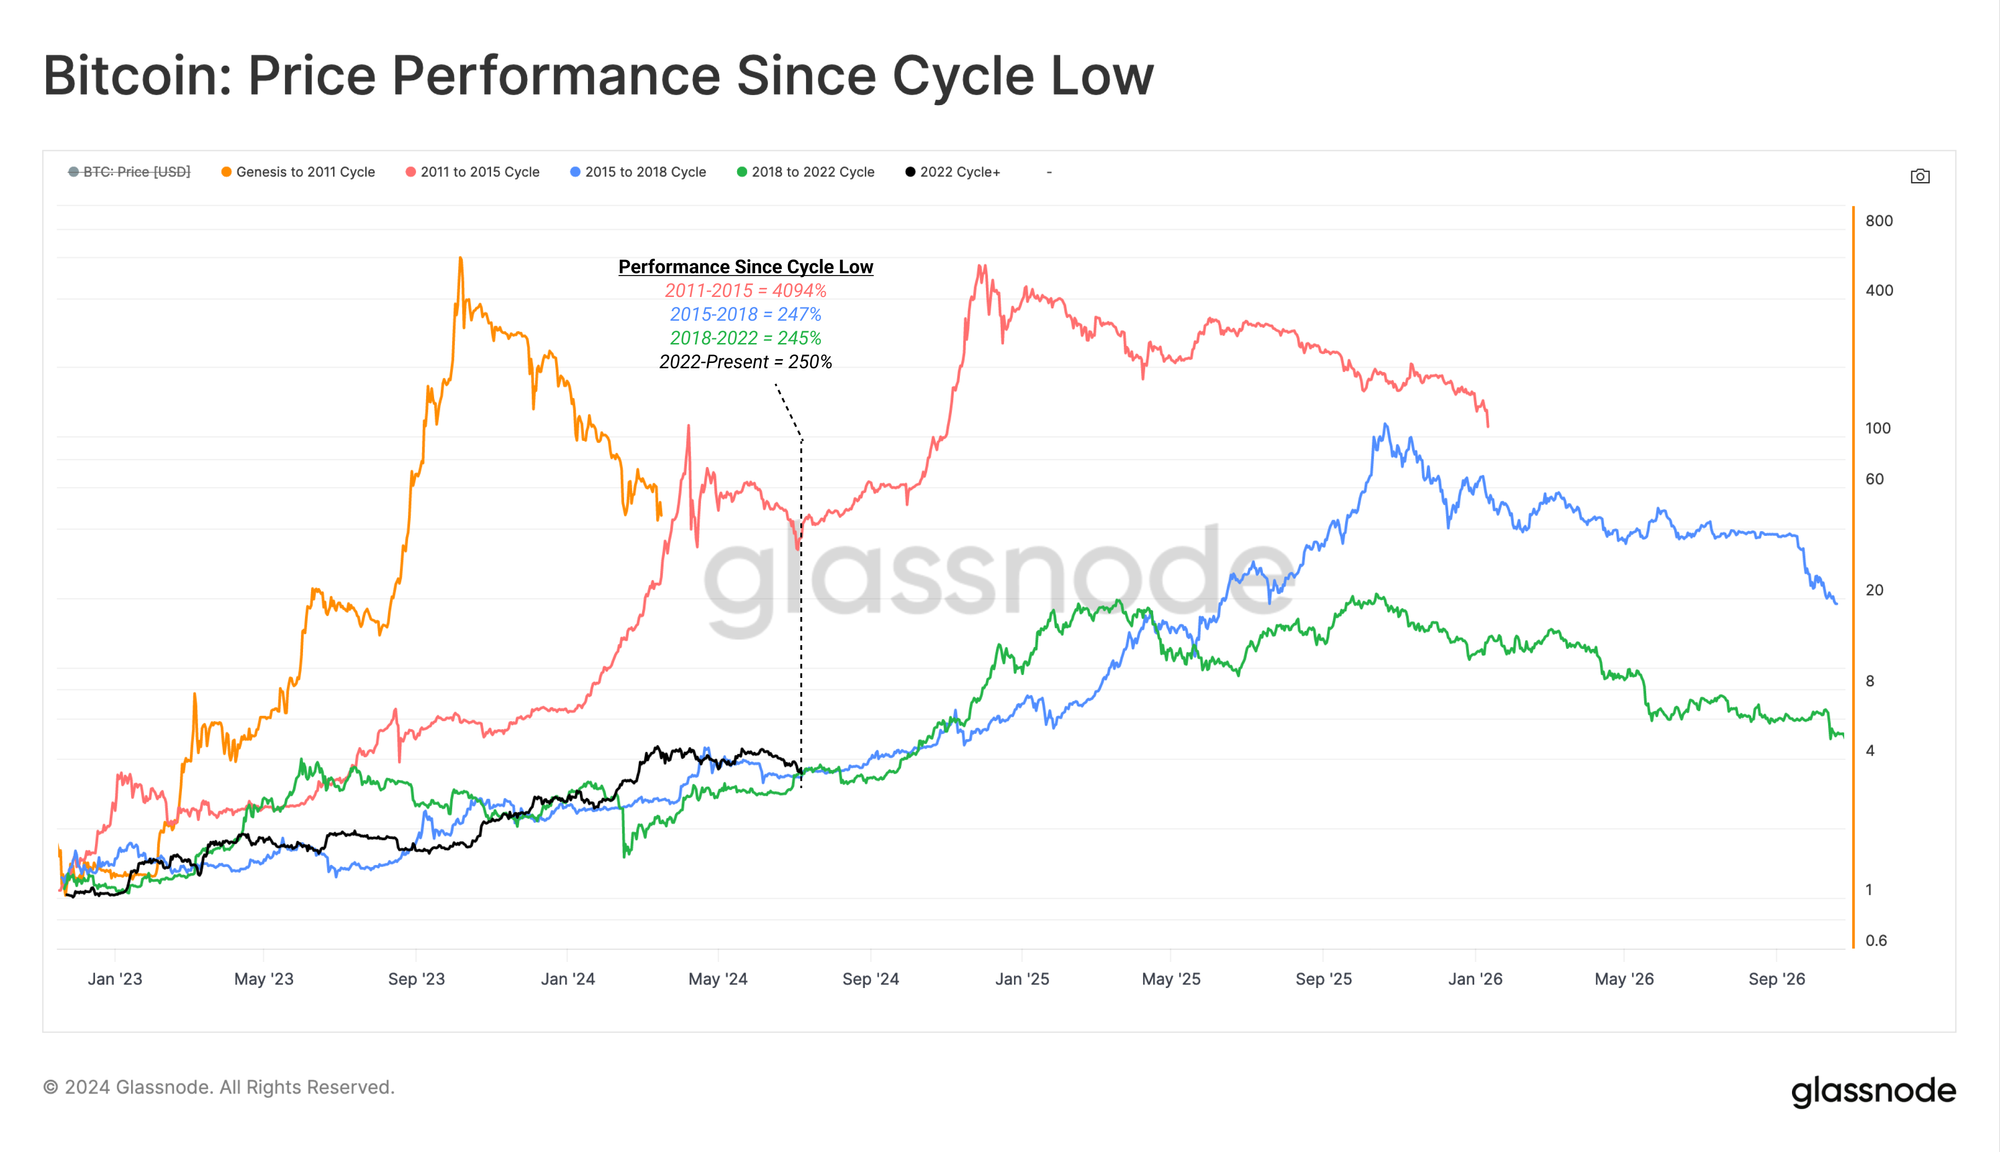
If we assess price performance relative to each cycle low, the 2023-24 market has behaved eerily similar to the last two cycles (2018-21 and 2015-17). The reason for Bitcoin following such a similar path is a regular topic of debate, but it continues to provide a valuable framework for analysts to think about cycle structure and duration.
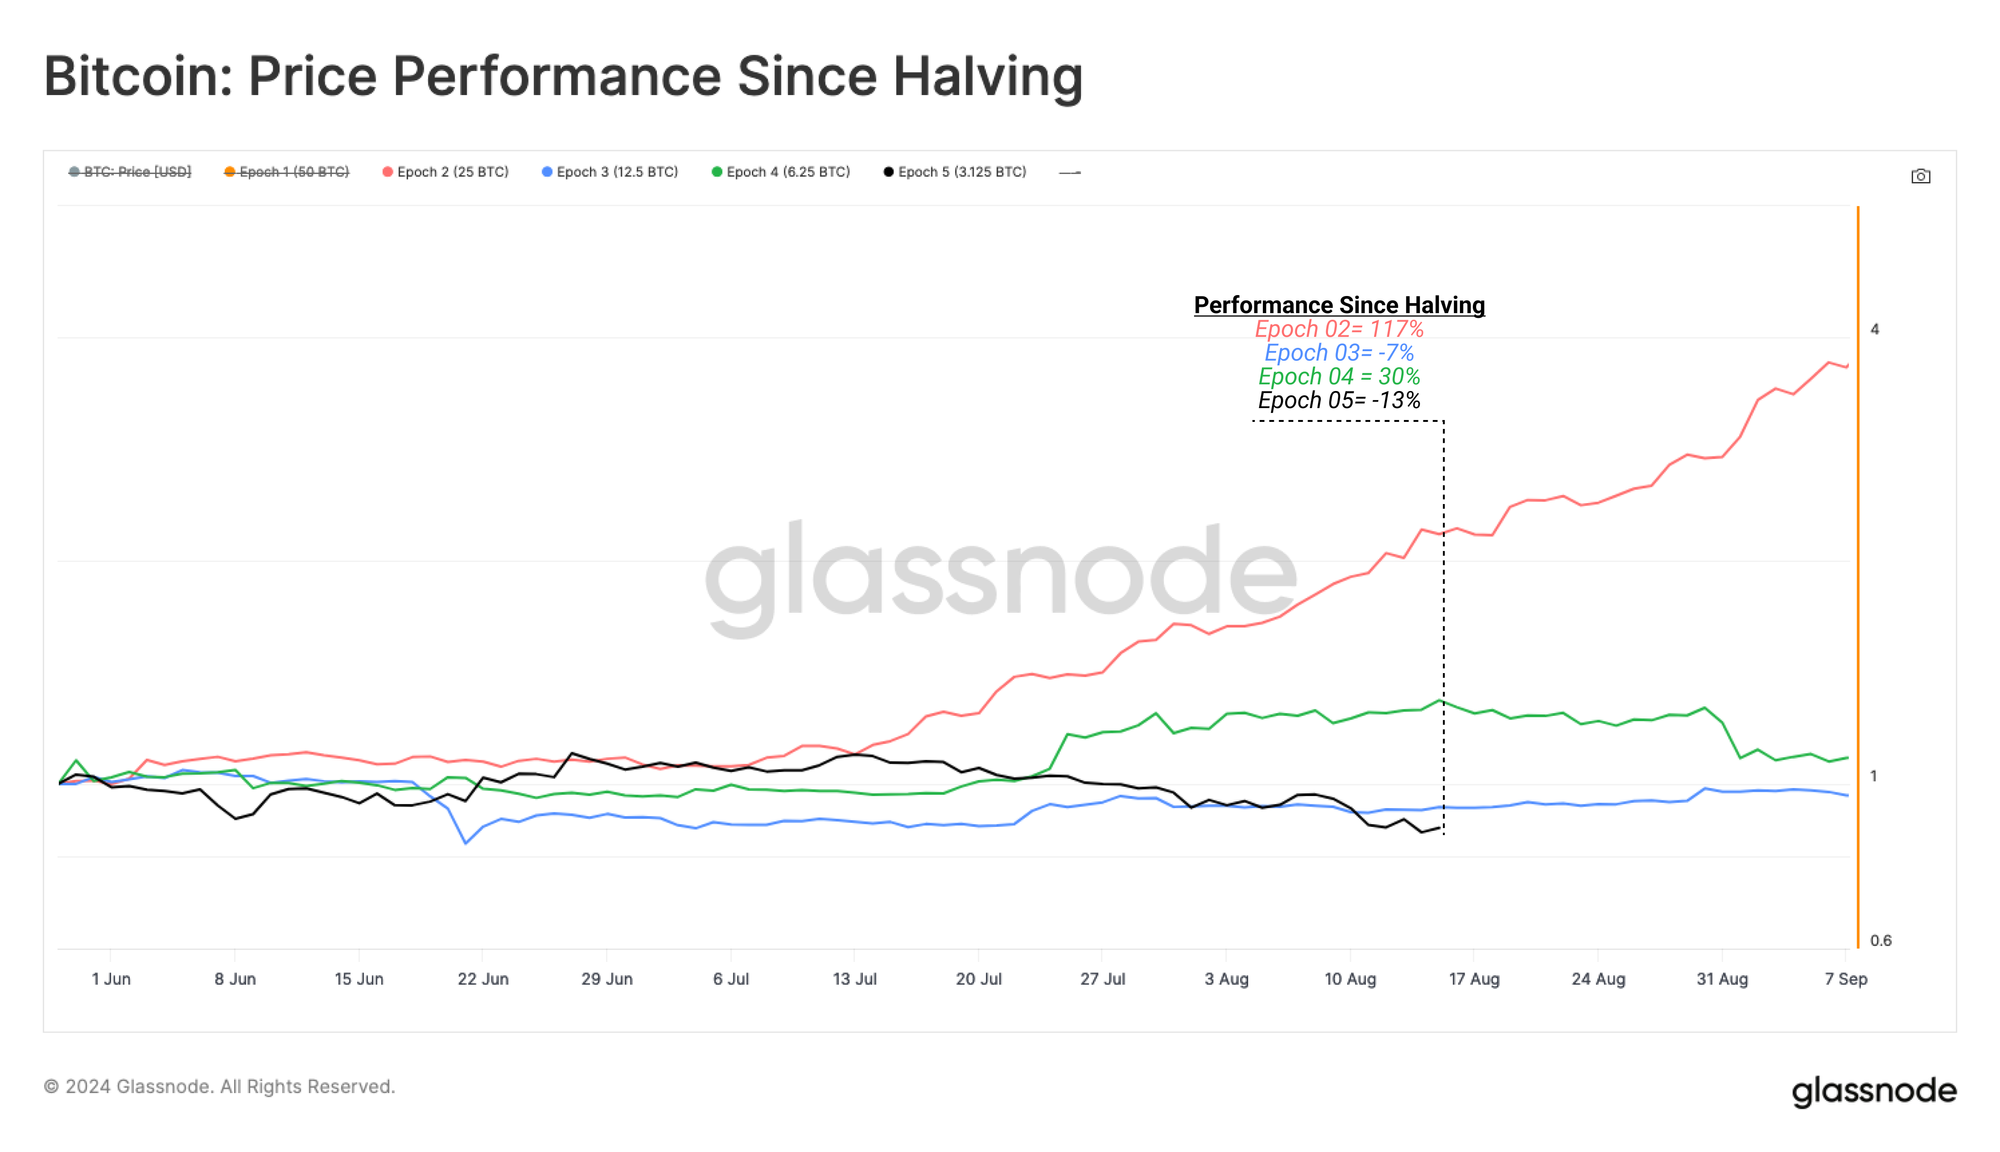
However, if we look at performance indexed to the date of the Bitcoin halving, we can see that the current cycle is one of the worst performing. This is despite the market breaching to a new cyclical ATH prior to the halving event in April, which was the first time this has happened.
- 🔴 Epoch 2: +117%
- 🔵 Epoch 3: -7%
- 🟢 Epoch 4: +30%
- ⚫ Epoch 5: -13%
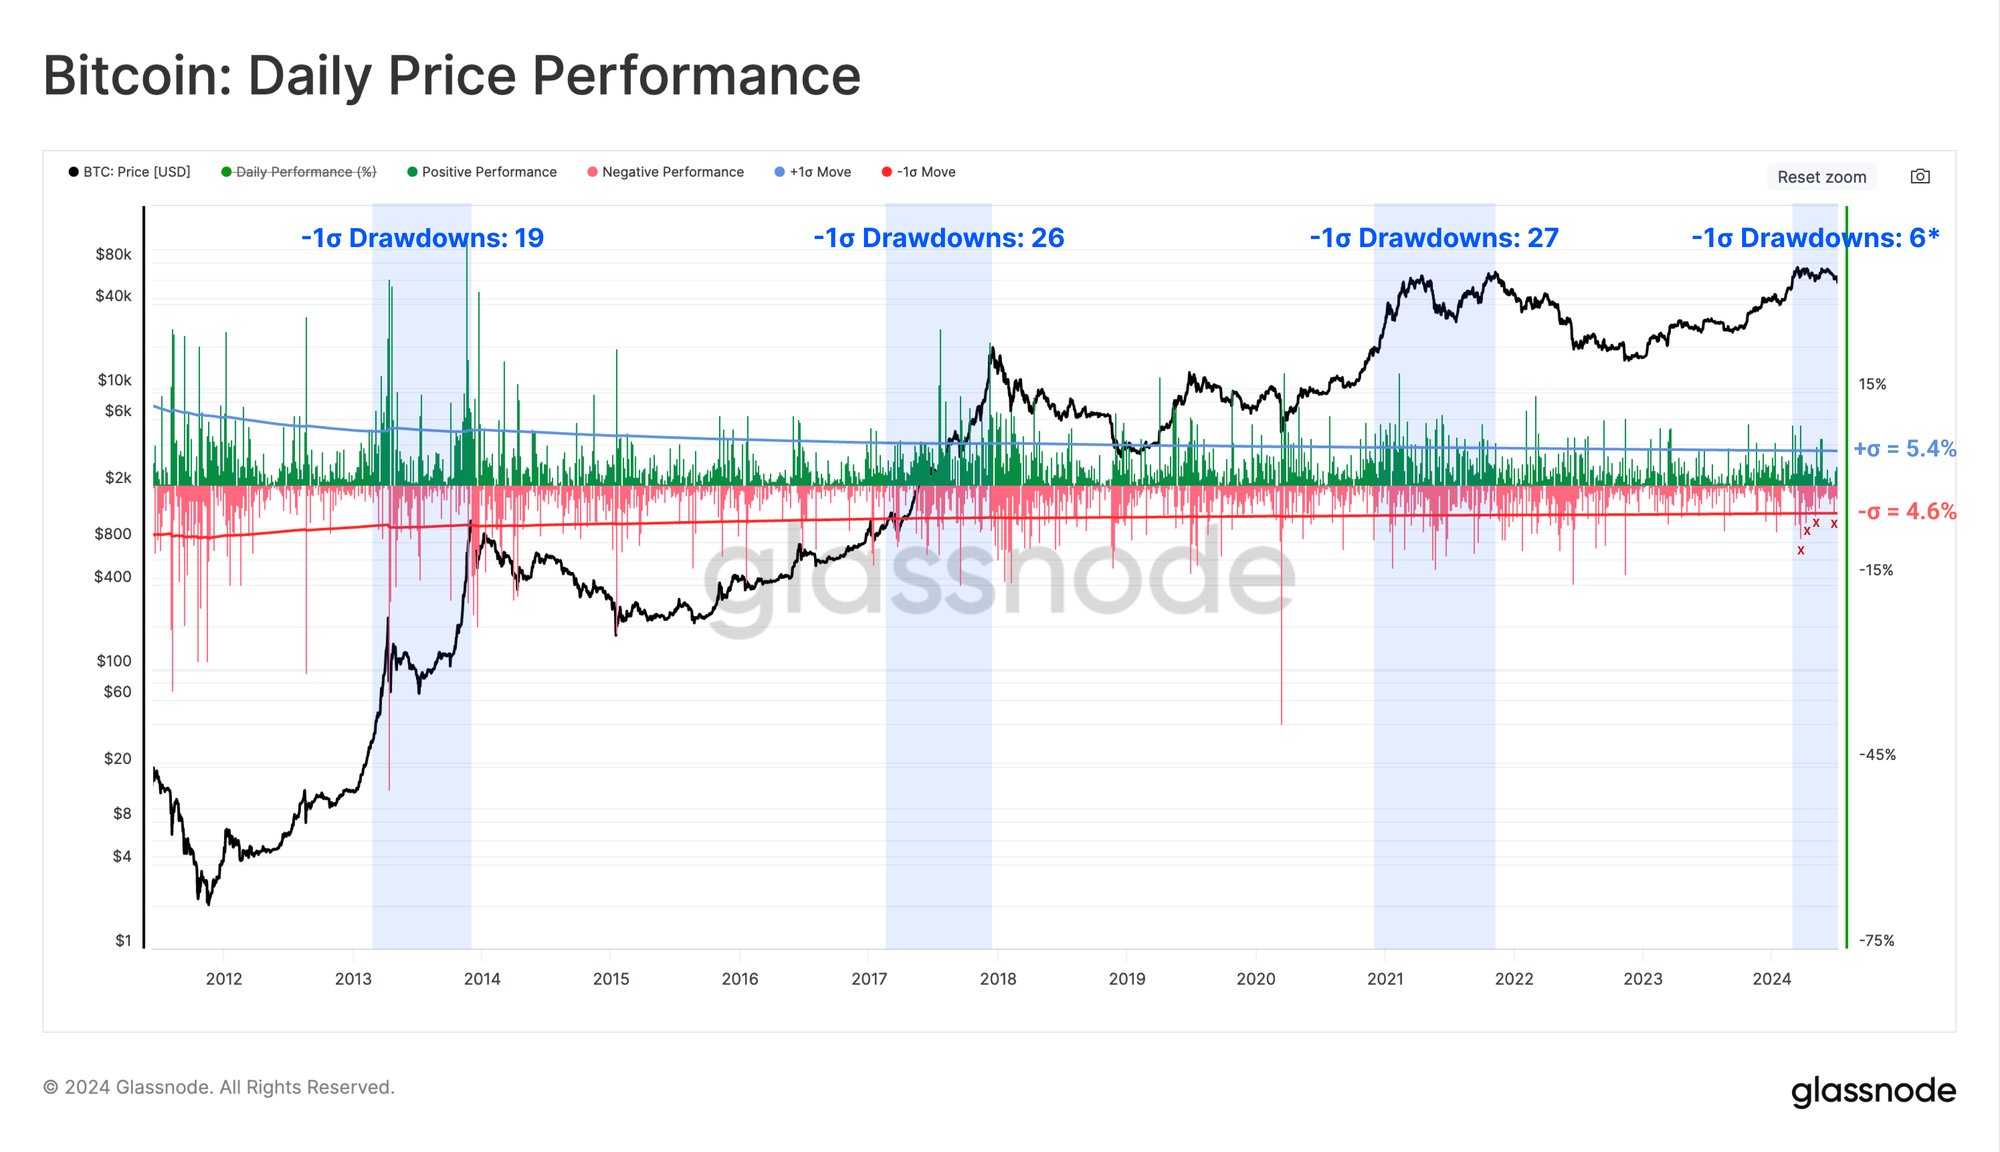
On a daily basis, we can evaluate the number of daily drawdowns during an uptrend which exceed the 1 Standard Deviation threshold to the downside. This helps us assess the number of meaningful sell-off events that investors experienced throughout the bull market uptrend.
- 2011-13: 19 Events
- 2015-18: 27 Events
- 2018-21: 26 Events
- Current Cycle 2023-24: 6 Events (to date)
The current cycle has recorded 6 daily drawdowns more than 1 standard deviation below the long term mean. This would suggest that the current cycle has either been notably shorter and less volatile than previous cycles, or perhaps there is more fuel in the investor tank.
New Investors Underwater
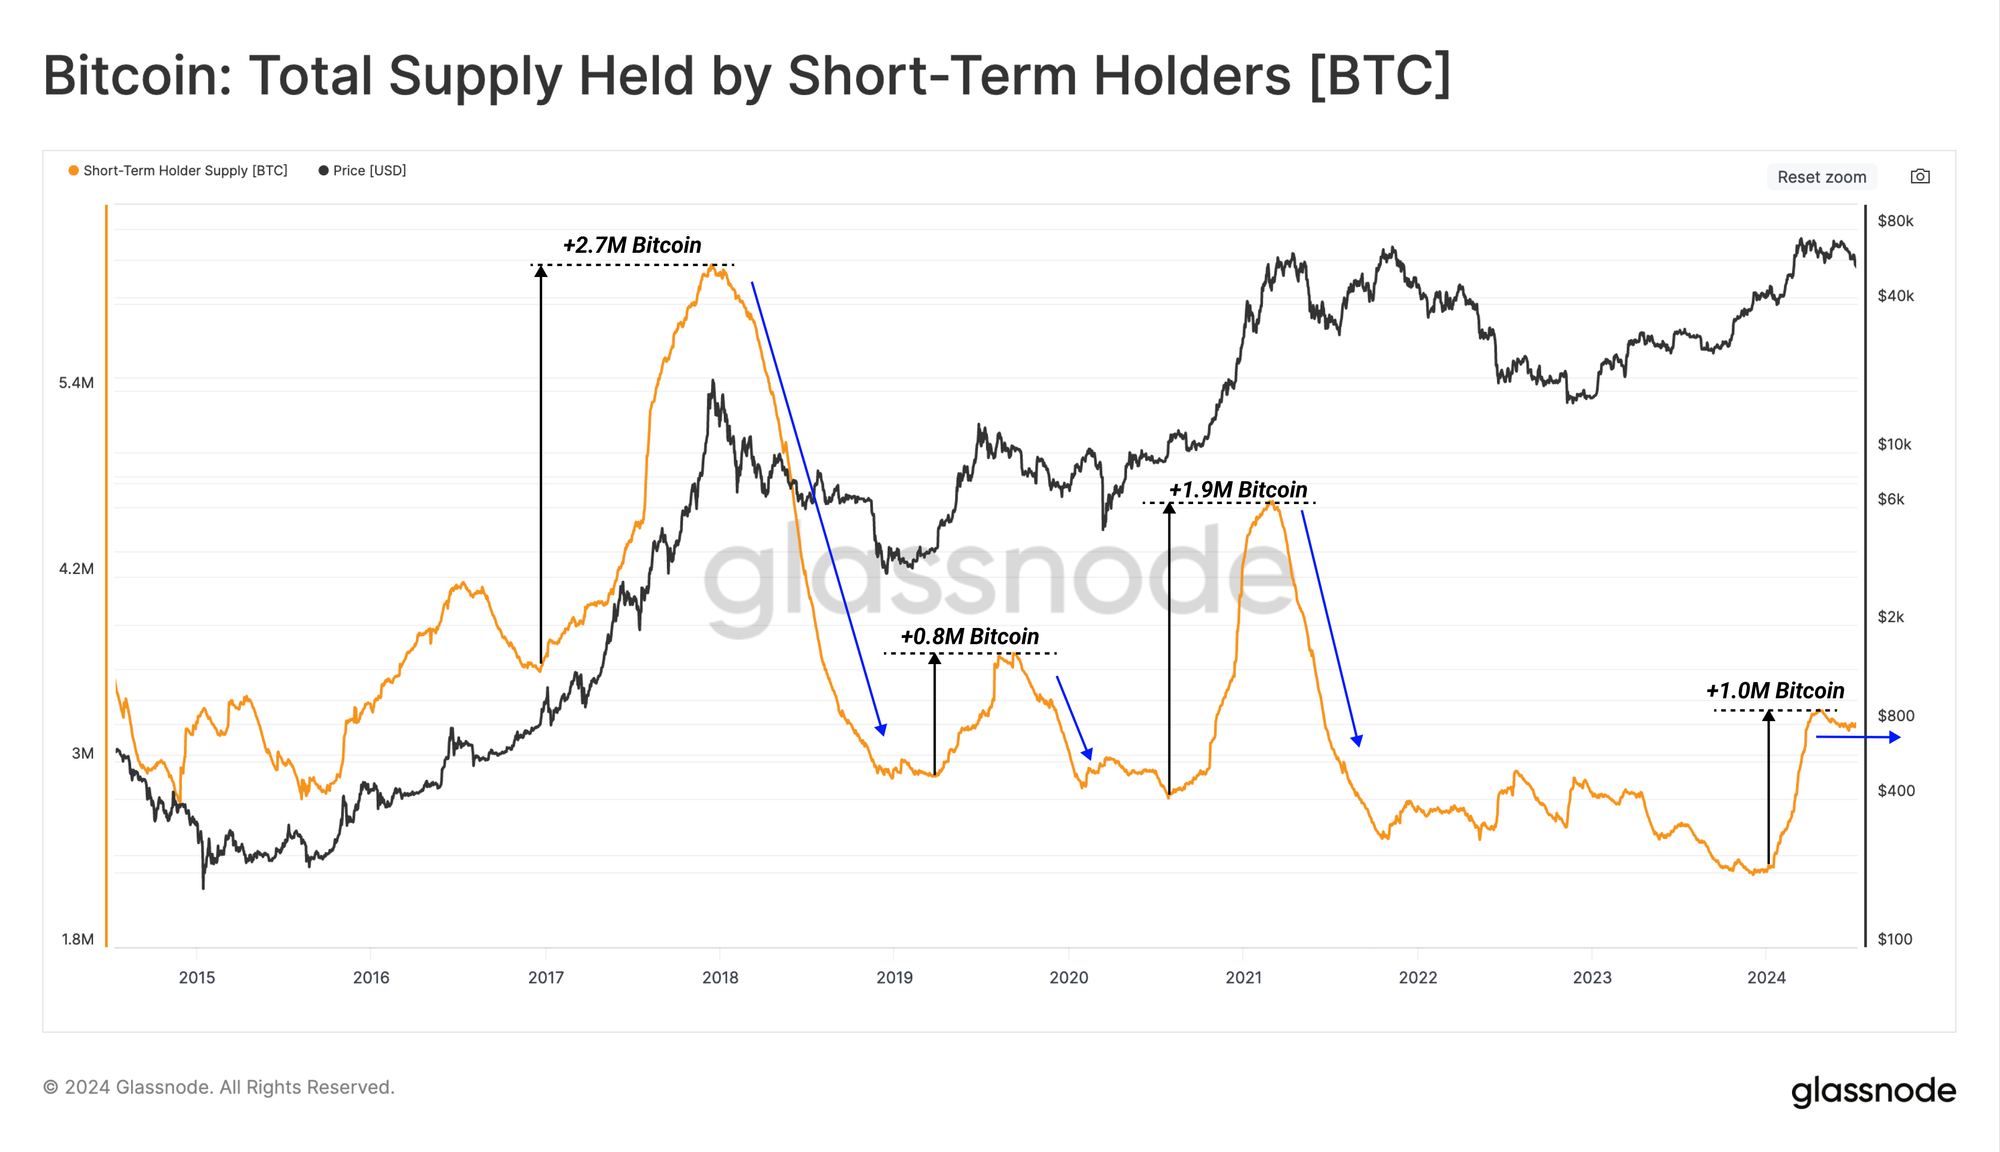
Assessing the volume of supply held by Short-Term Holders, we can see substantial growth from January 2024 onward. This accompanied explosive upwards price action in response to the spot ETFs going live, and reflected a strong inflow of new demand.
However, this demand profile has reached a plateau in growth over recent months, suggesting an equilibrium had formed between supply and demand in Q2-2024. This has since given way to a supply overhang, as fewer Long-Term Holders take profits, and fewer new buyers step in to accumulate.
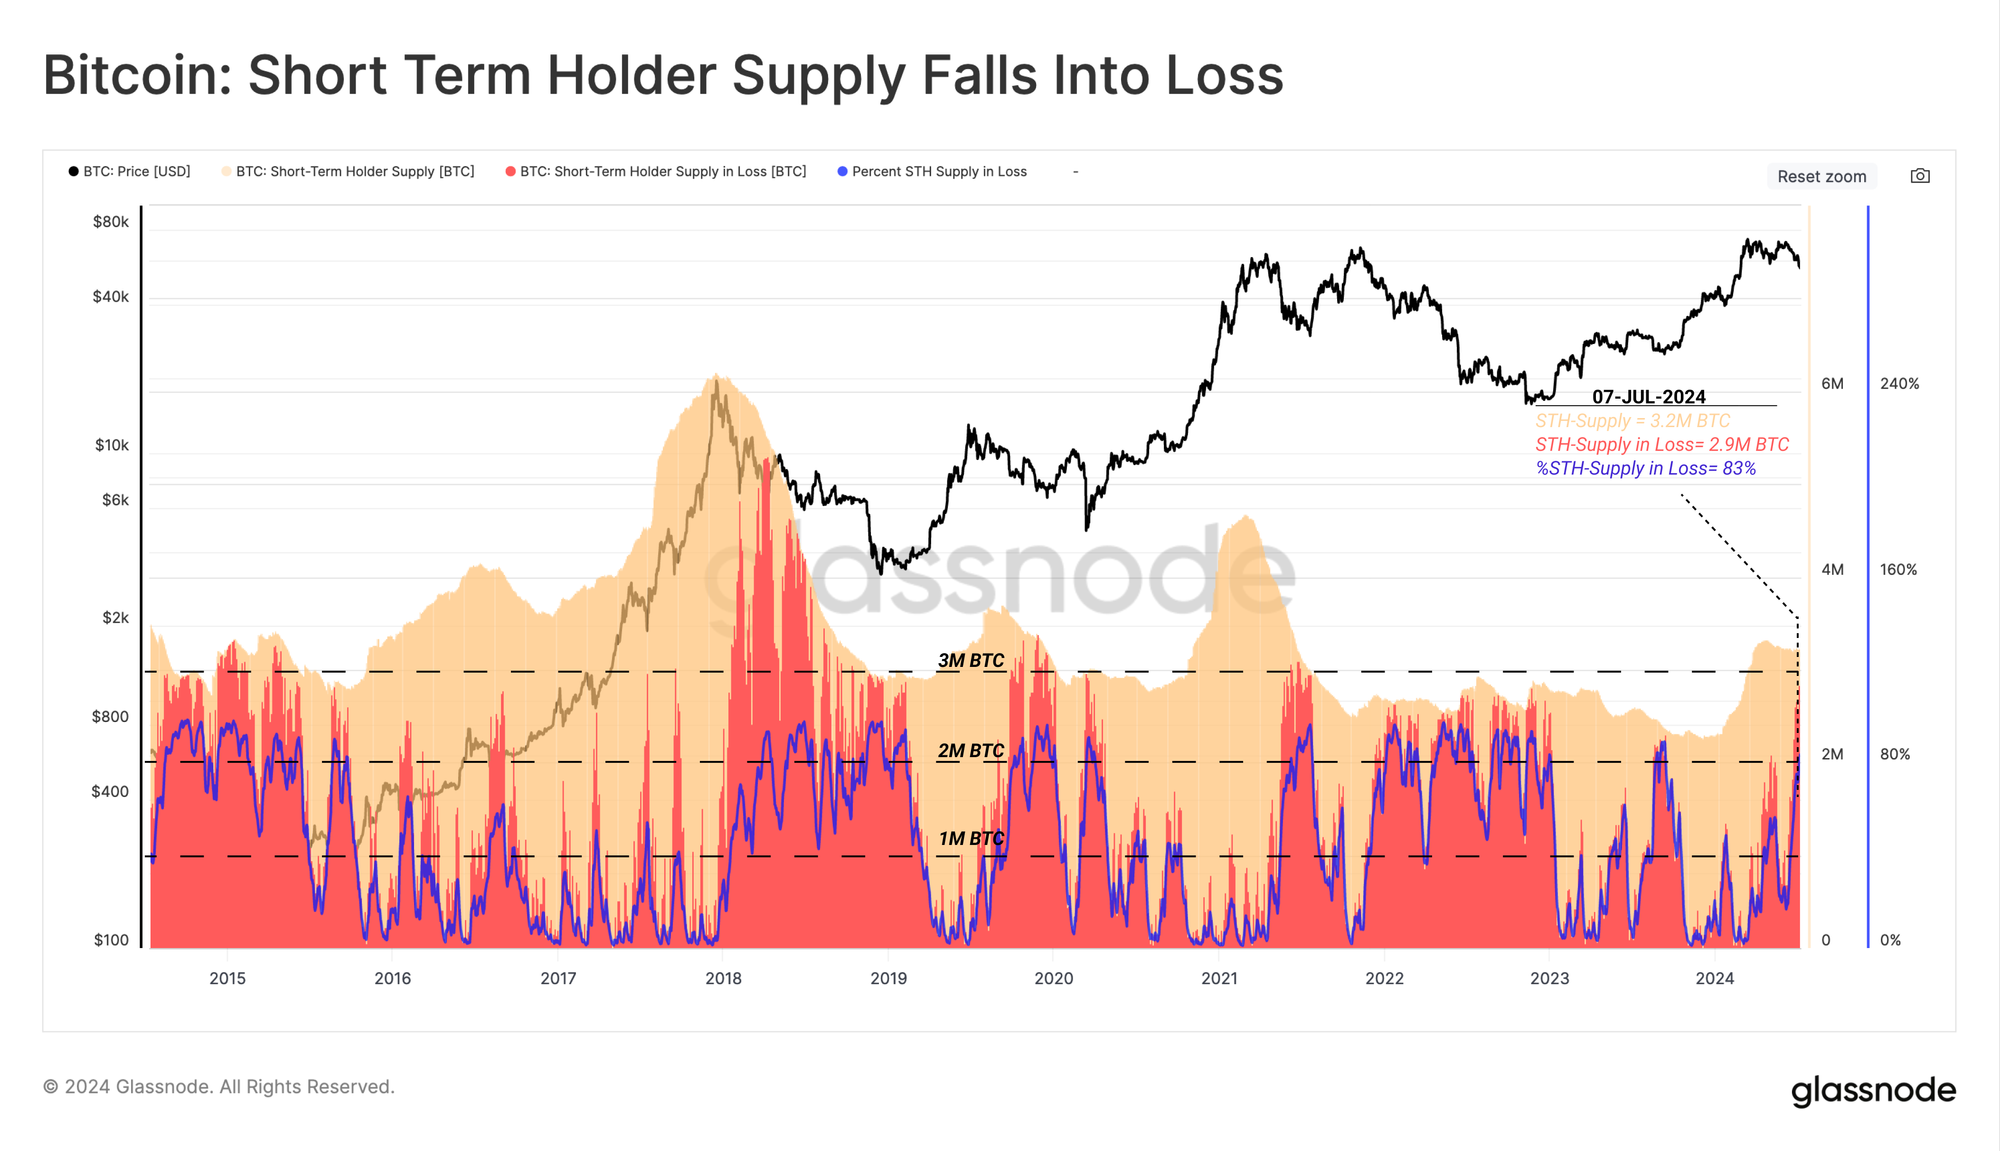
During sustained bull markets, local bottoms are commonly established after the volume of Short-Term Holder supply held in loss saturates around 1M to 2M BTC. In more severe cases, this supply in loss can peak to between 2M and 3M BTC.
We can see an example of this during the recent sell-off down to the 53k price level, which pushed the volume of coins held below their cost basis to over 2.8M BTC. This is the second time this has occurred in the last 12-months, with August 2023 being the other example where over 2M BTC owned by new investors were held in an unrealized loss.
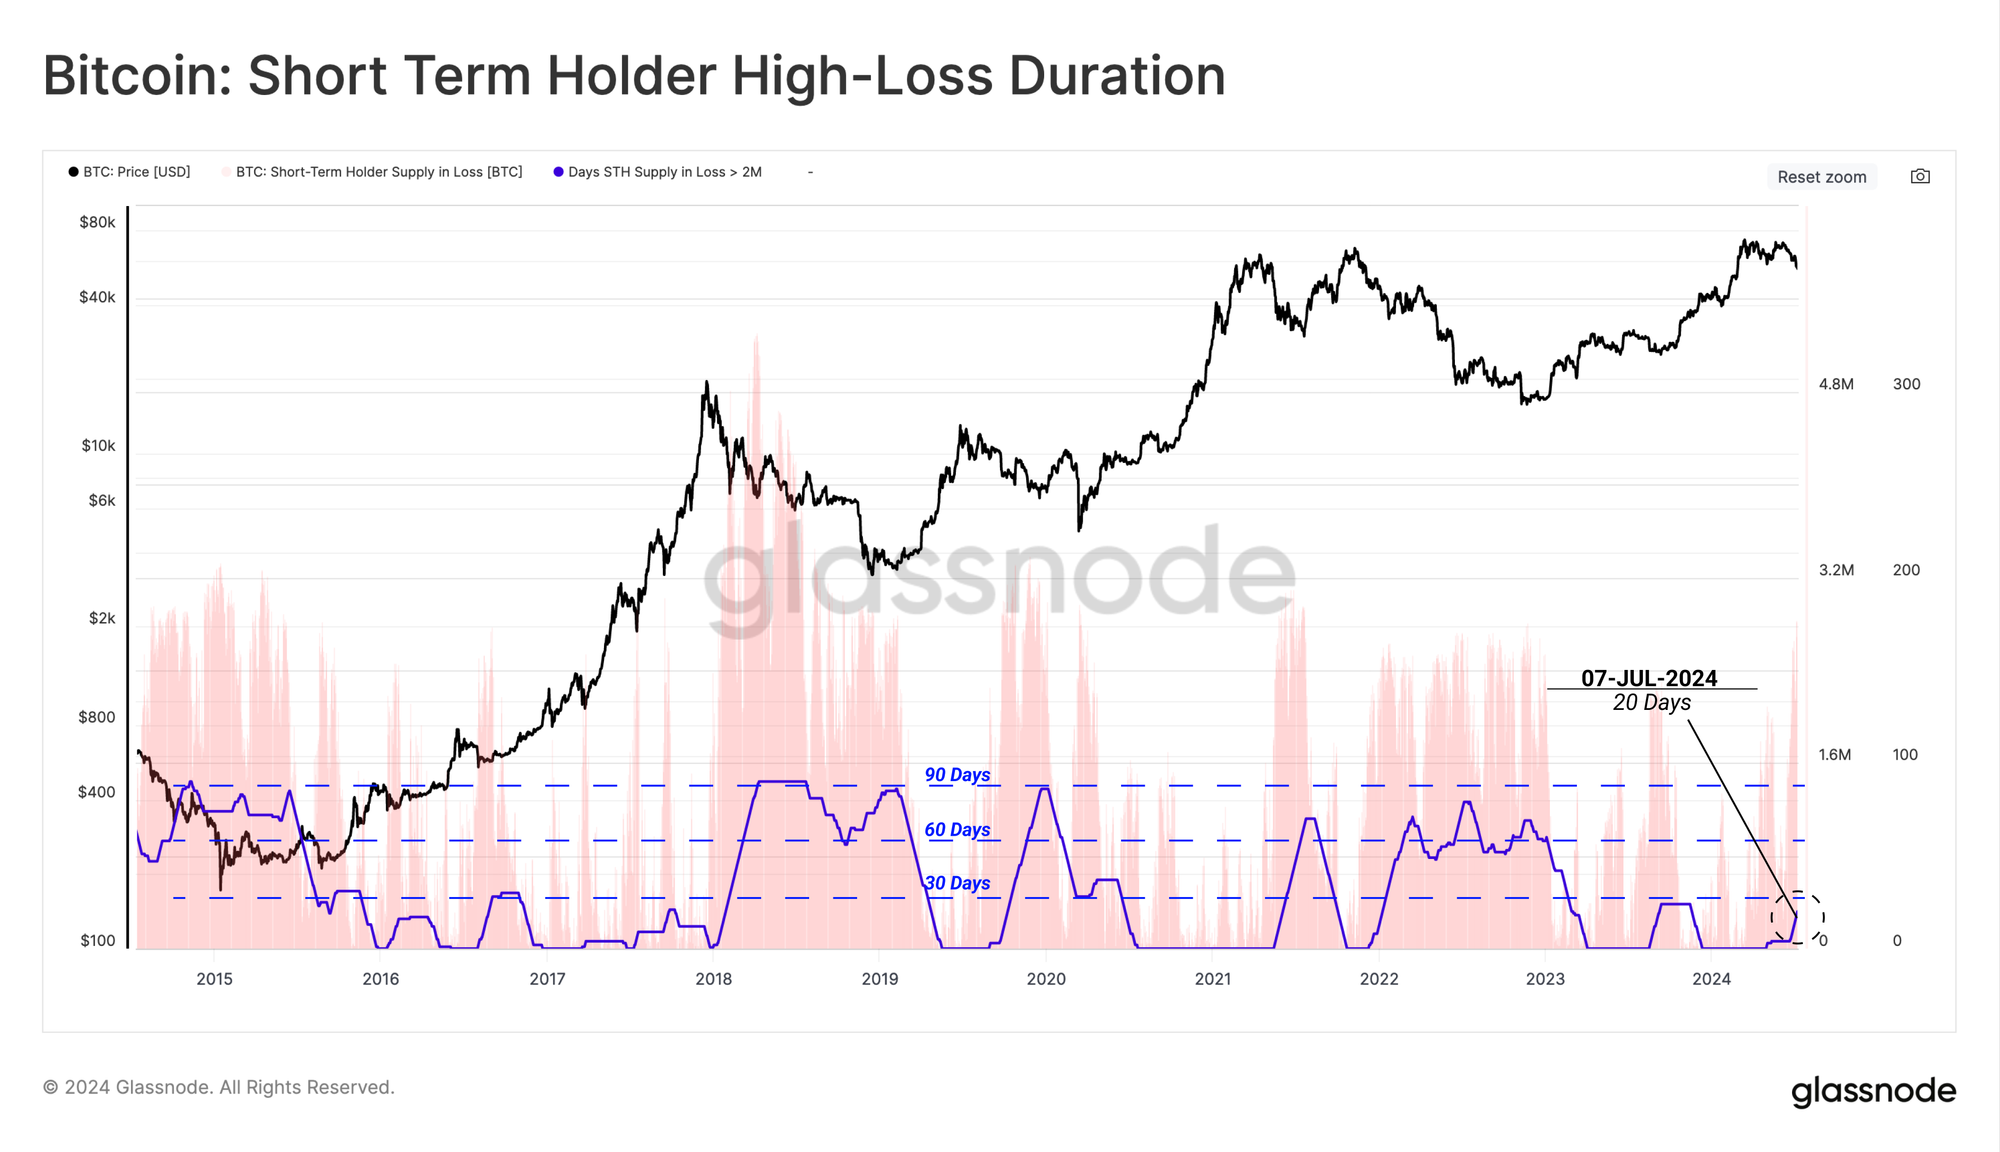
We can assess he intensity of these periods by counting the number days where more than 2M Short-Term Holder coins were underwater for at least a 90 day period. By this metric, this indicator has actively flagged for 20 days so far.
If we make a comparison with the market conditions seen in Q2-Q3 2021, a much more significant Short-Term Holders experienced a much more significant duration of 70 consecutive days in acute financial stress. That period of time was severe enough to break investor sentiment, and gave way to the destructive 2022 bear market. By comparison, this cycle has been relatively forging for the time being.
A Halt On Profitability
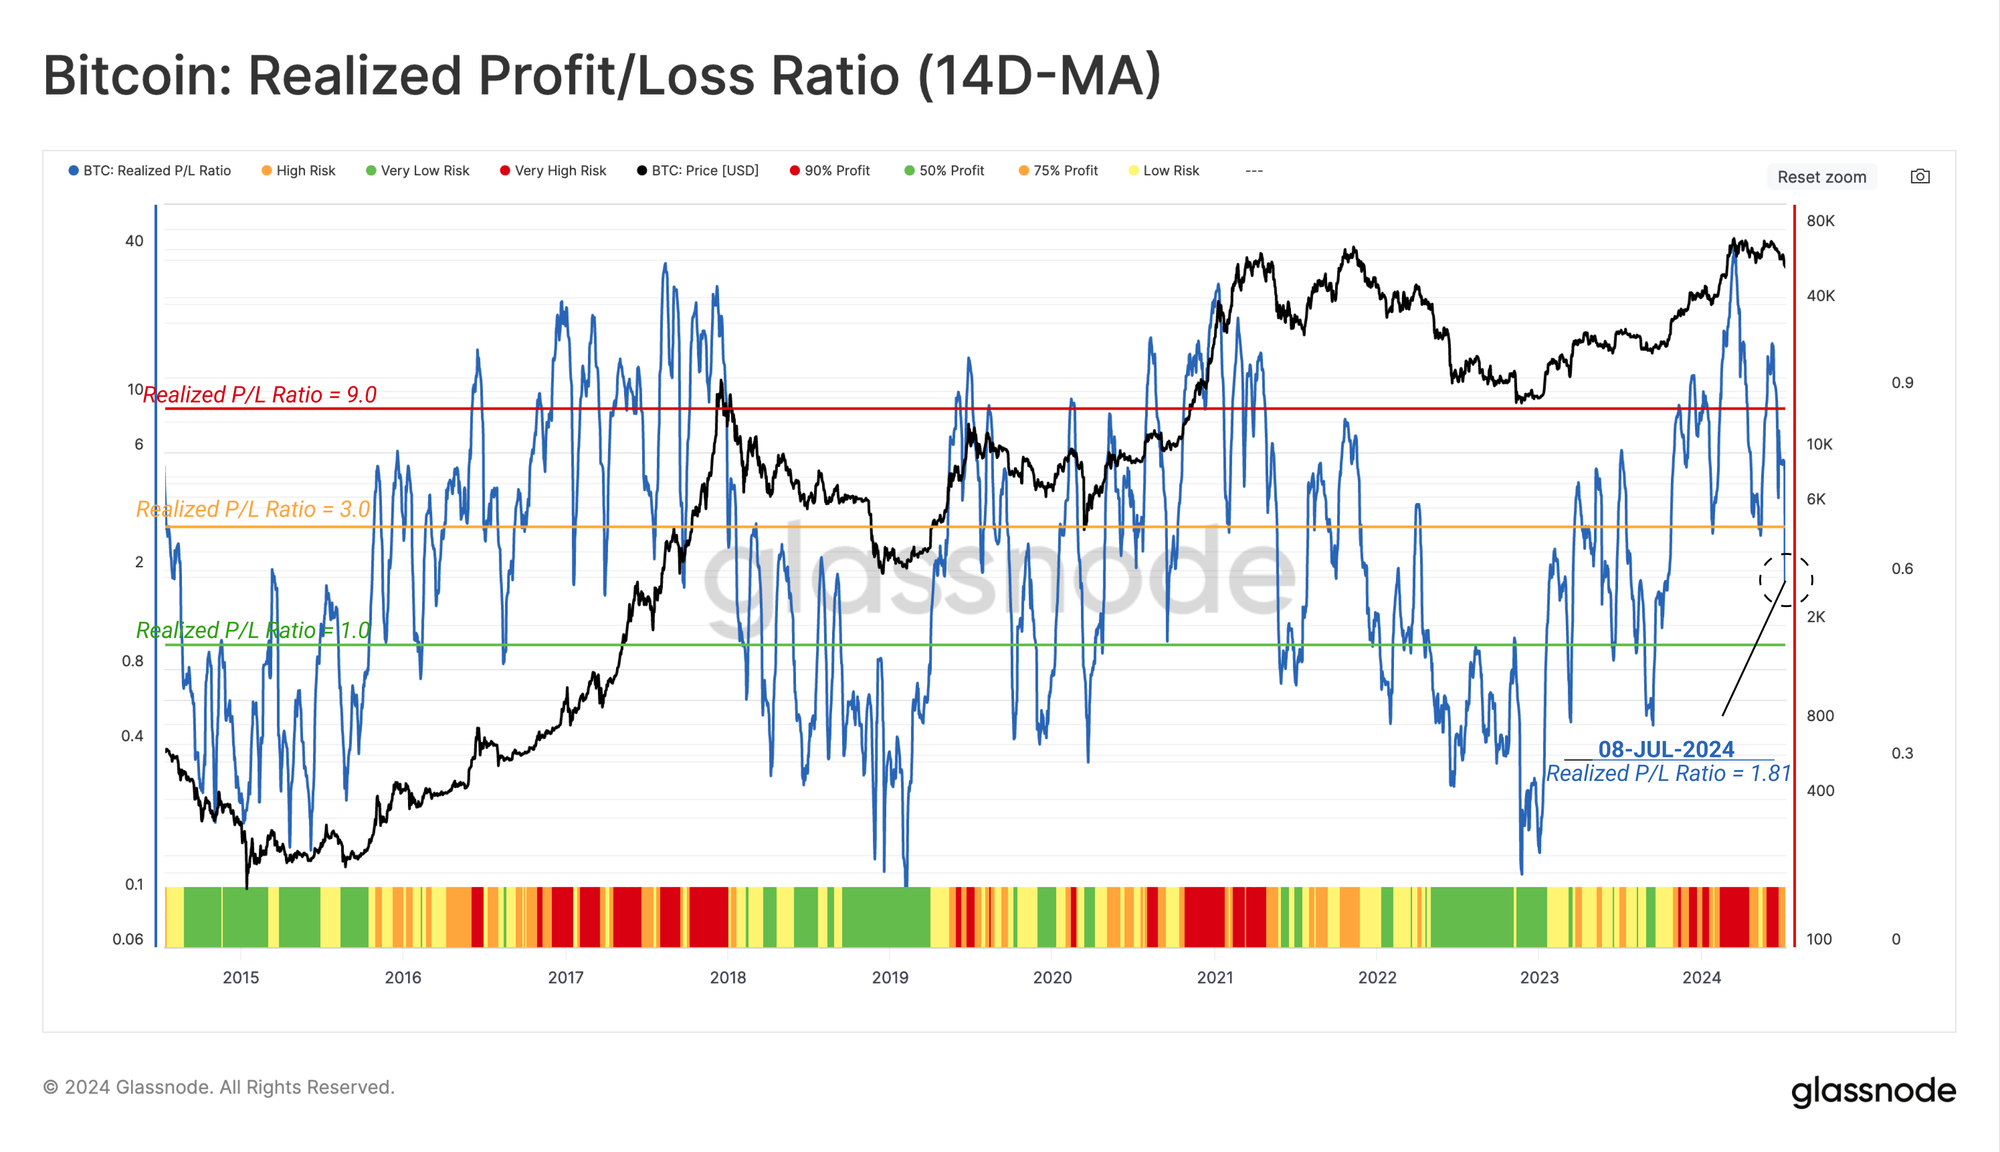
With a contraction in spot prices underway, the ratio between investor Realized Profit and Realized Loss has declined in tandem. This indicator has now declined into the 0.50 to 0.75 range, which is a more neutral level seen during bull markets corrections.
We can also see a similar pattern of sharp fluctuations in this metric throughout the 2019 to 2022 cycle, which could be considered a reflection of inherent instability and investor uncertainty.
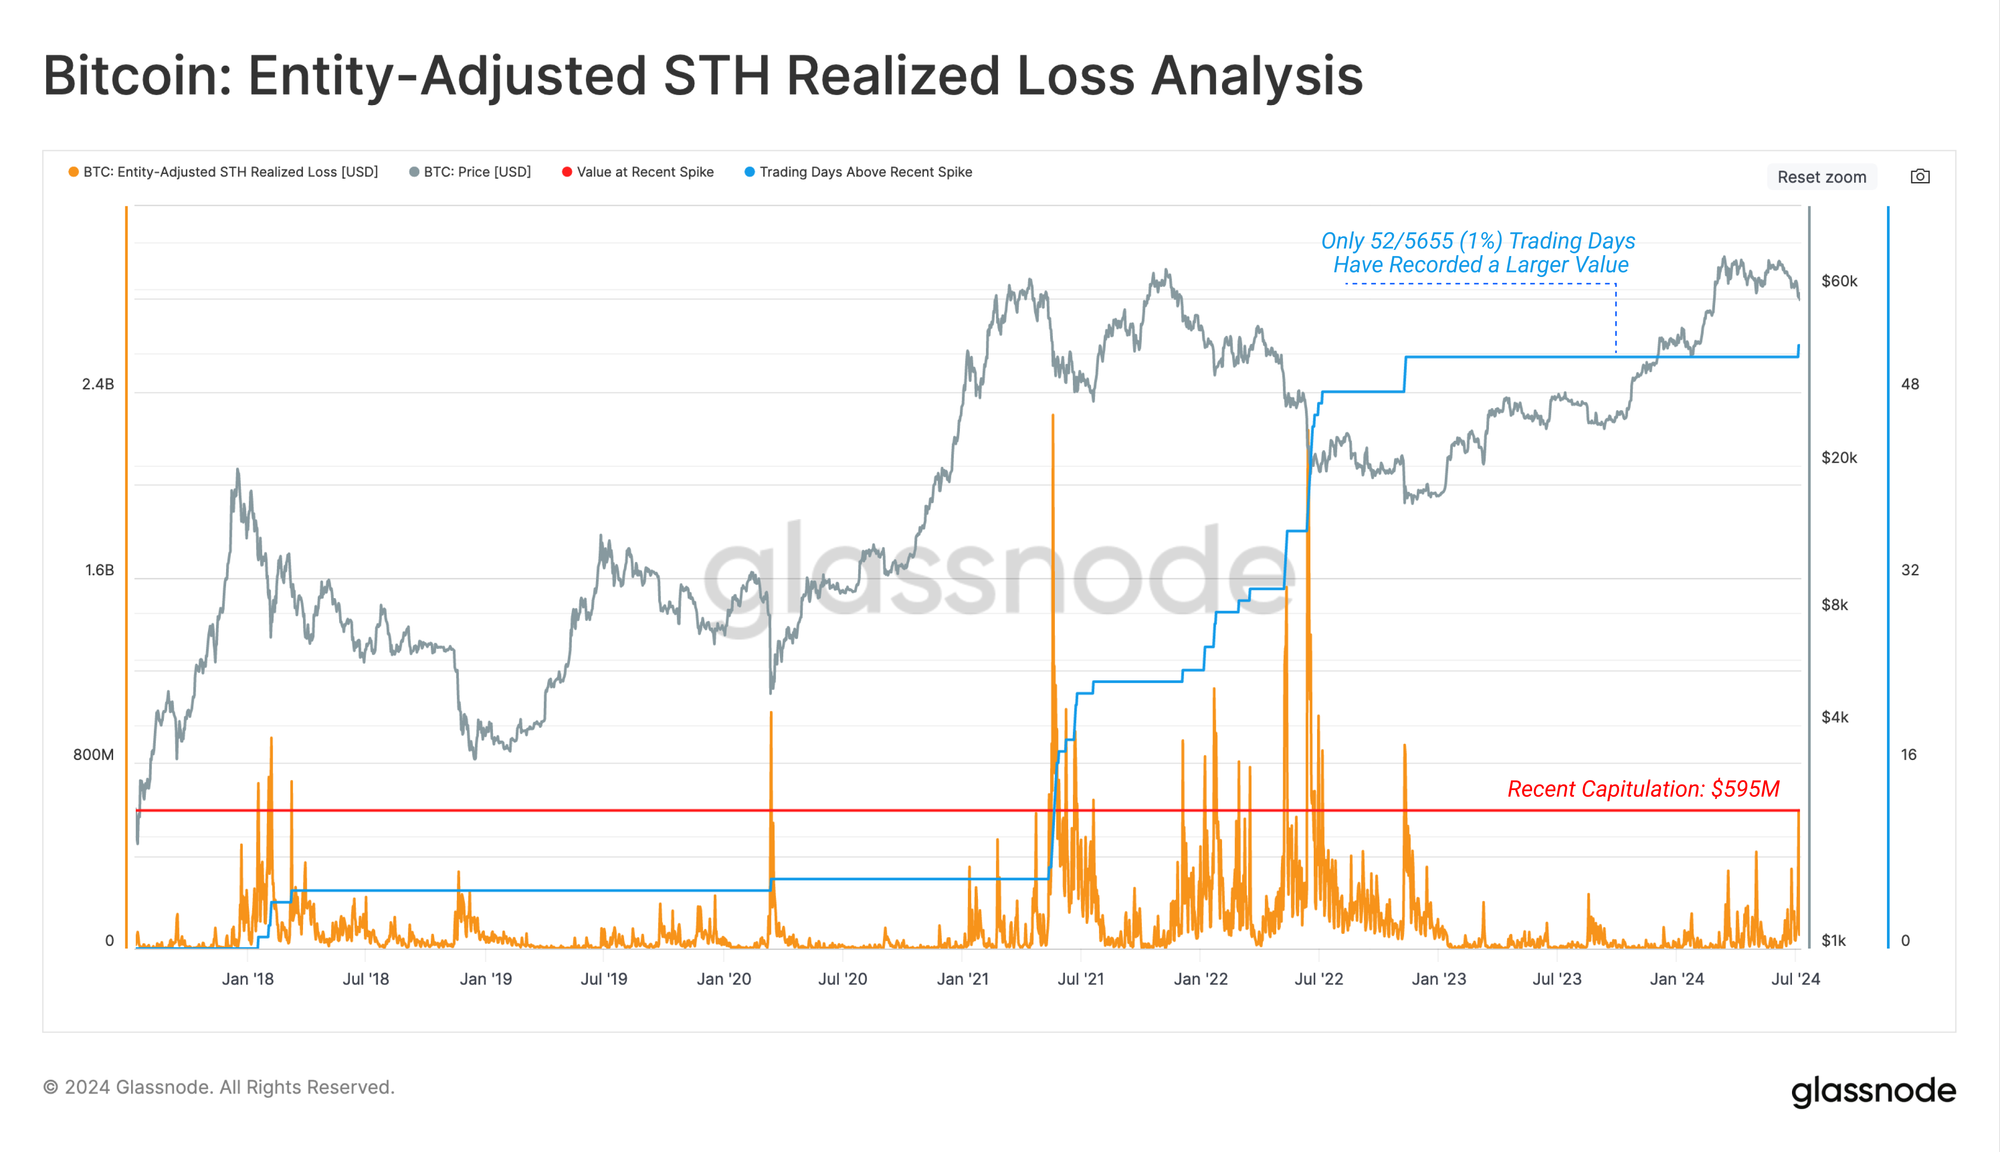
Zooming into Short-Term Holder losses specifically, we can see a total realized loss of ~ $595m was locked in by this cohort this week. This is the largest loss taking event since the 2022 cycle low.
Furthermore, only 52 out of 5655 trading days (< 1%) have recorded a larger daily loss value, highlighting the severity of this correction in dollar terms.
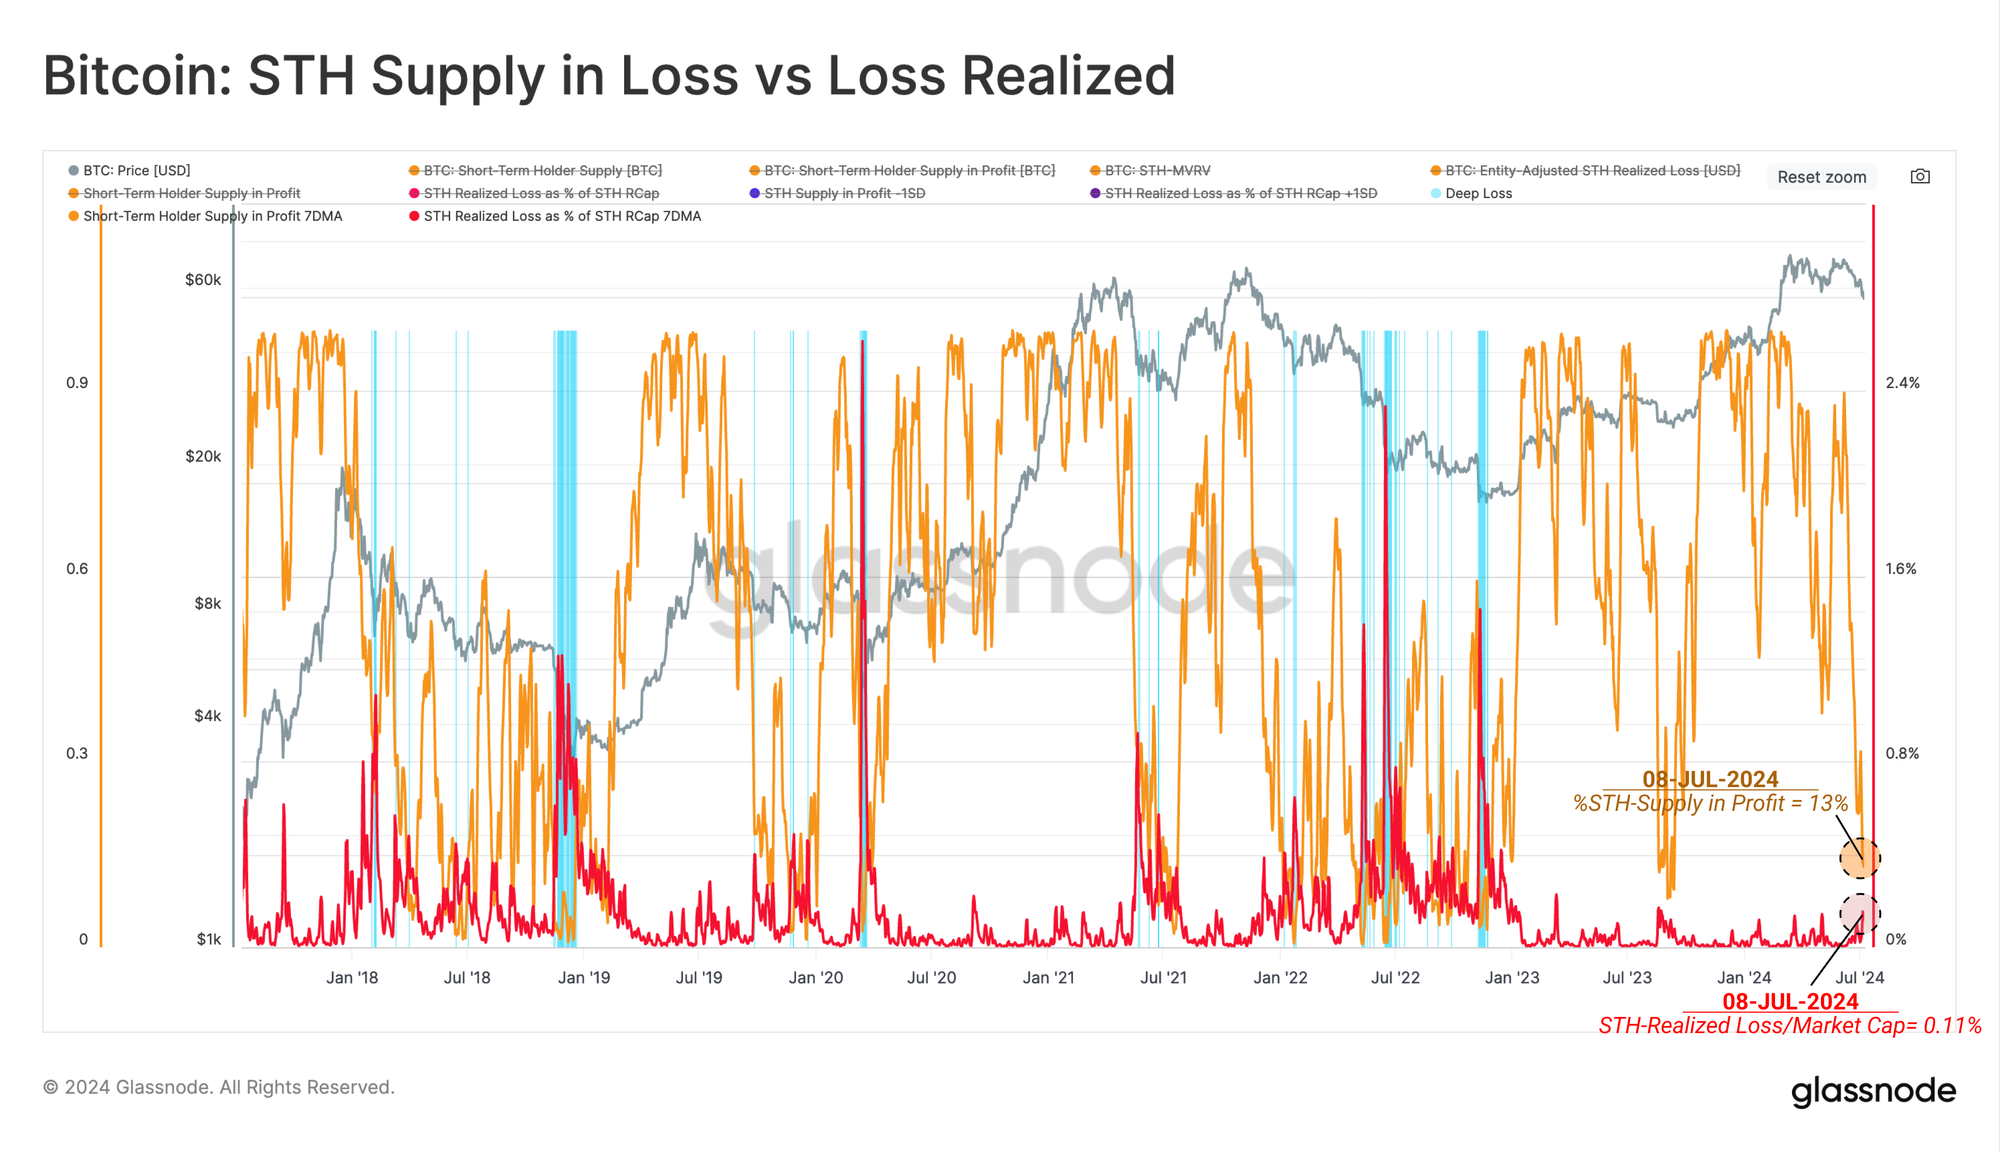
However, when we denominate these same Short-Term Holder losses as a percentage of total invested wealth (divided by the STH Realized Cap), we can see a dramatically different picture. On a relative basis, the losses locked in by this cohort remain fairly typical compared to previous bull market corrections.
In the chart below, we have highlighted (blue) periods of time where the both percent of Short-Term Supply held in Loss, and the magnitude of losses locked have moved more than 1 standard deviation from the mean.
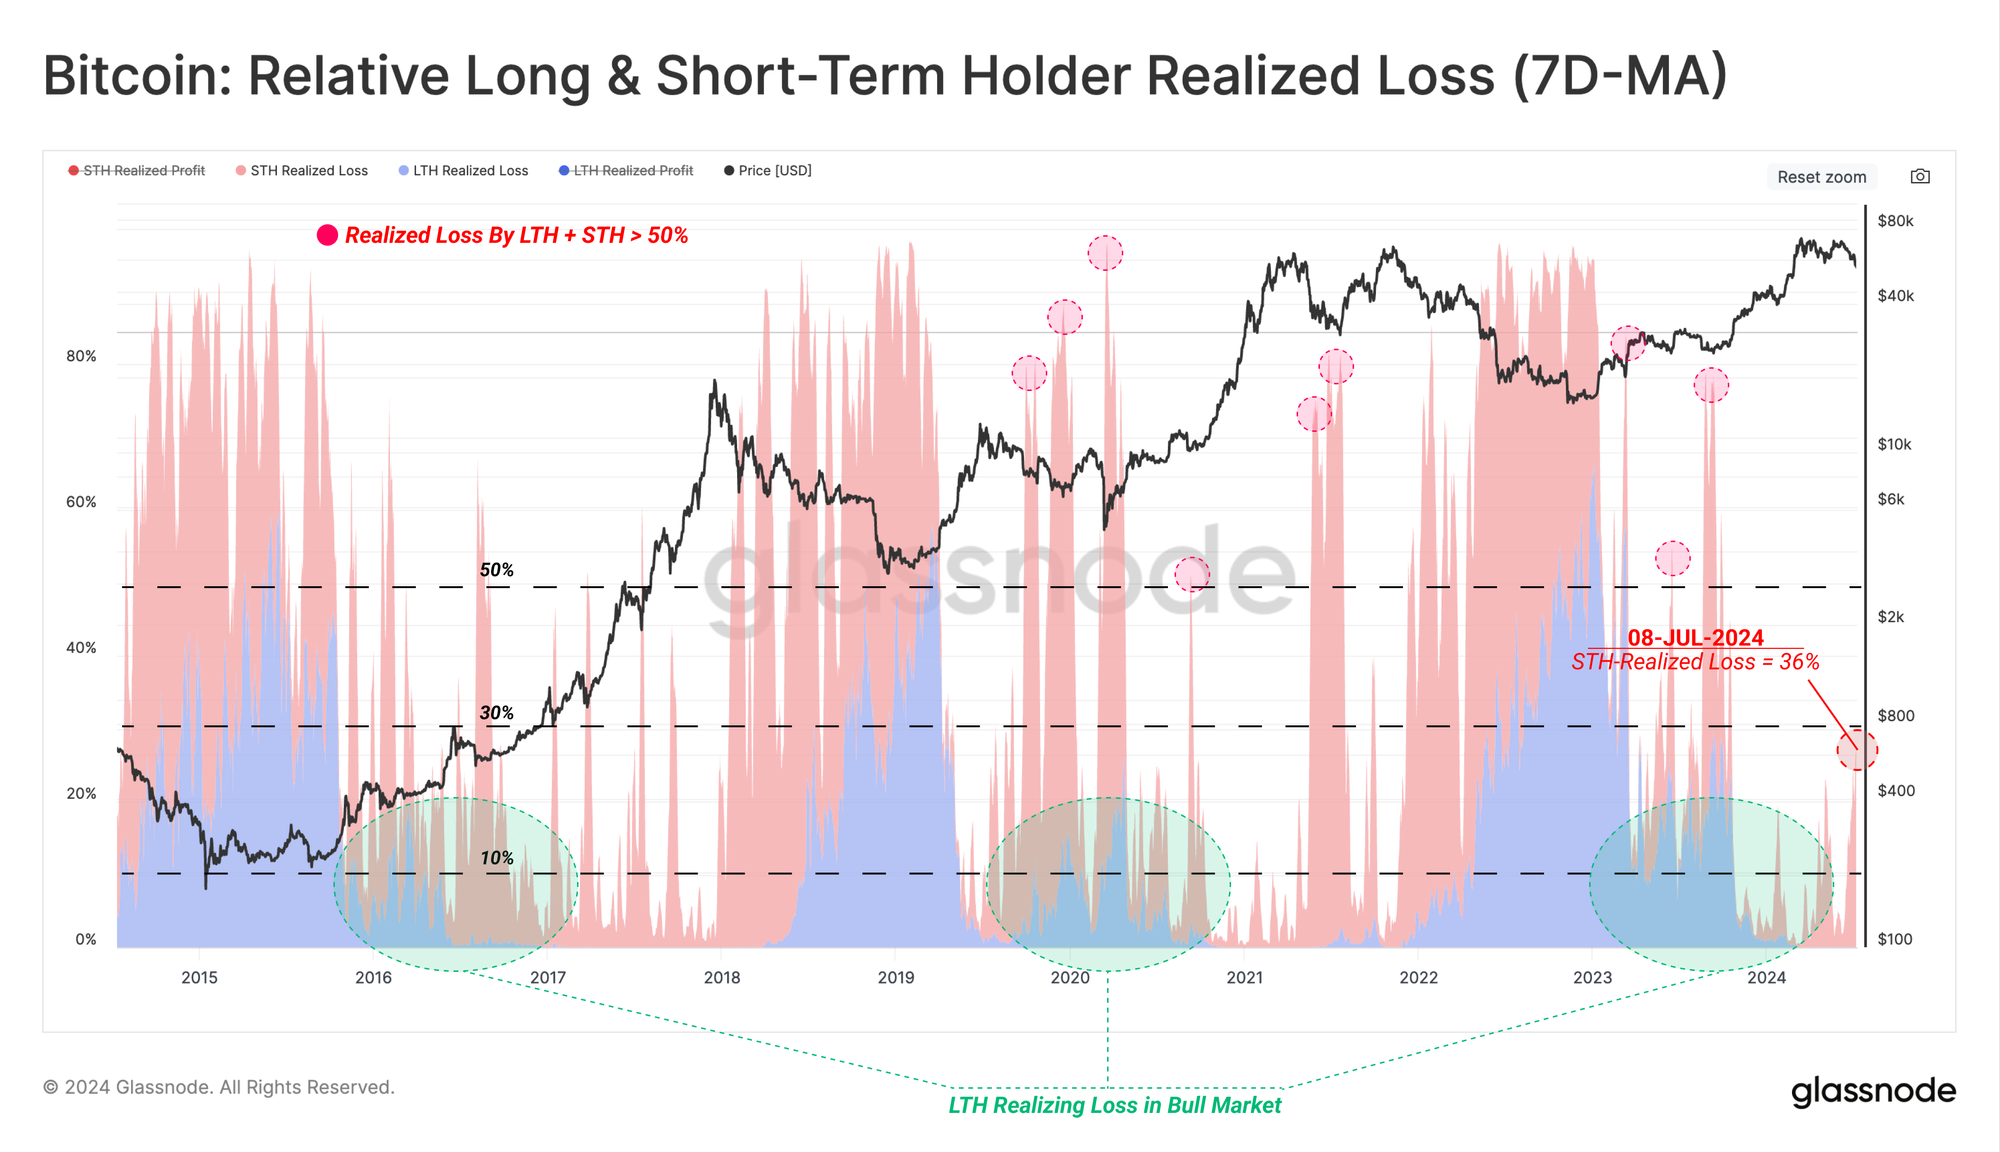
Looking at losses locked in by both Long-Term, and Short-Term Holders, we note that the loss taking events this week account for less than 36% of the total capital flows across the Bitcoin network.
Major capitulation events, such as Sep 2019, March 2020, and the sell-off in May 2021, saw losses account for more than 60% of capital flows over a period of several weeks, with a meaningful contribution from both cohorts.
Therefore, it could be argued that there are more similarities between the prevailing market contraction, and the Q1-2021 topping formation, more so than severe capitulation events. Nevertheless, the onus still falls towards the demand side to arrest the negative price momentum, else the profitability of investors will continue to deteriorate.
Summary and Conclusion
Following 18 months of up-only price action after the FTX implosion, and 3 months of apathetic sideways trading, the market has endured its deepest correction of the cycle. Nevertheless, drawdowns across our current cycle remains favourable when compared to historical cycles suggesting a relatively robust underlying market structure.
The aggressive contraction has plunged a significant amount of Short-Term Holders into a position of severe unrealized loss, placing a large degree of pressure upon the cohort. However, the magnitude of losses locked in has remained relatively subdued in comparison to the market size. Alongside this, the lack of Long-Term Holder participation in loss taking suggests mature investors remain profitable, despite the ensuing market hysteria.
Disclaimer: This report does not provide any investment advice. All data is provided for information and educational purposes only. No investment decision shall be based on the information provided here and you are solely responsible for your own investment decisions.
Exchange balances presented are derived from Glassnode’s comprehensive database of address labels, which are amassed through both officially published exchange information and proprietary clustering algorithms. While we strive to ensure the utmost accuracy in representing exchange balances, it is important to note that these figures might not always encapsulate the entirety of an exchange’s reserves, particularly when exchanges refrain from disclosing their official addresses. We urge users to exercise caution and discretion when utilizing these metrics. Glassnode shall not be held responsible for any discrepancies or potential inaccuracies. Please read our Transparency Notice when using exchange data.
- Join our Telegram channel
- For on-chain metrics, dashboards, and alerts, visit Glassnode Studio
- For automated alerts on core on-chain metrics and activity on exchanges, visit our Glassnode Alerts Twitter