Surviving the Sell-Off
The Bitcoin market recently absorbed over 48k BTC in sell-side sourced from the German Government. With Mt Gox distributions also on the horizon, we examine these major sell-side forces, as well as the role ETFs have on price action.


Executive Summary
- Large labelled entities currently hold approximately 4.9M BTC, which is equivalent to 25% of the circulating supply. Amongst these entities, centralized exchanges and ETF custodians account for the largest portion.
- Following the complete exhaustion of BTC sell-side by the German Government, there appears to be near-term sell-side relief, as well as renewed inflows of demand to support the market.
- Market profitability remains remarkably robust, with the majority of the coin supply still held at a favourable cost basis, and below the current spot price.
Assessing Large Entities
The landscape of Bitcoin holders remains a constantly evolving space, which requires an evolution of analysis frameworks over time. Historically, miners and exchanges have been the largest and most dominant Bitcoin holders.
Through history, large coin holdings have ended up custodied by market agnostic entities, such as the Mt.Gox trustee, tasked with holding the coins recovered after the collapse and bankruptcy of the Mt.Gox exchange. Similarly, significant coin volumes have been seized by government law enforcement, which are periodically sold off in tranches.
More recently, institutional grade custodians, and ETFs have entered the picture. The suite of 11 new US spot ETFs have now accrued a combined +887K BTC, making their combined balance the second largest pool of Bitcoin that we monitor.
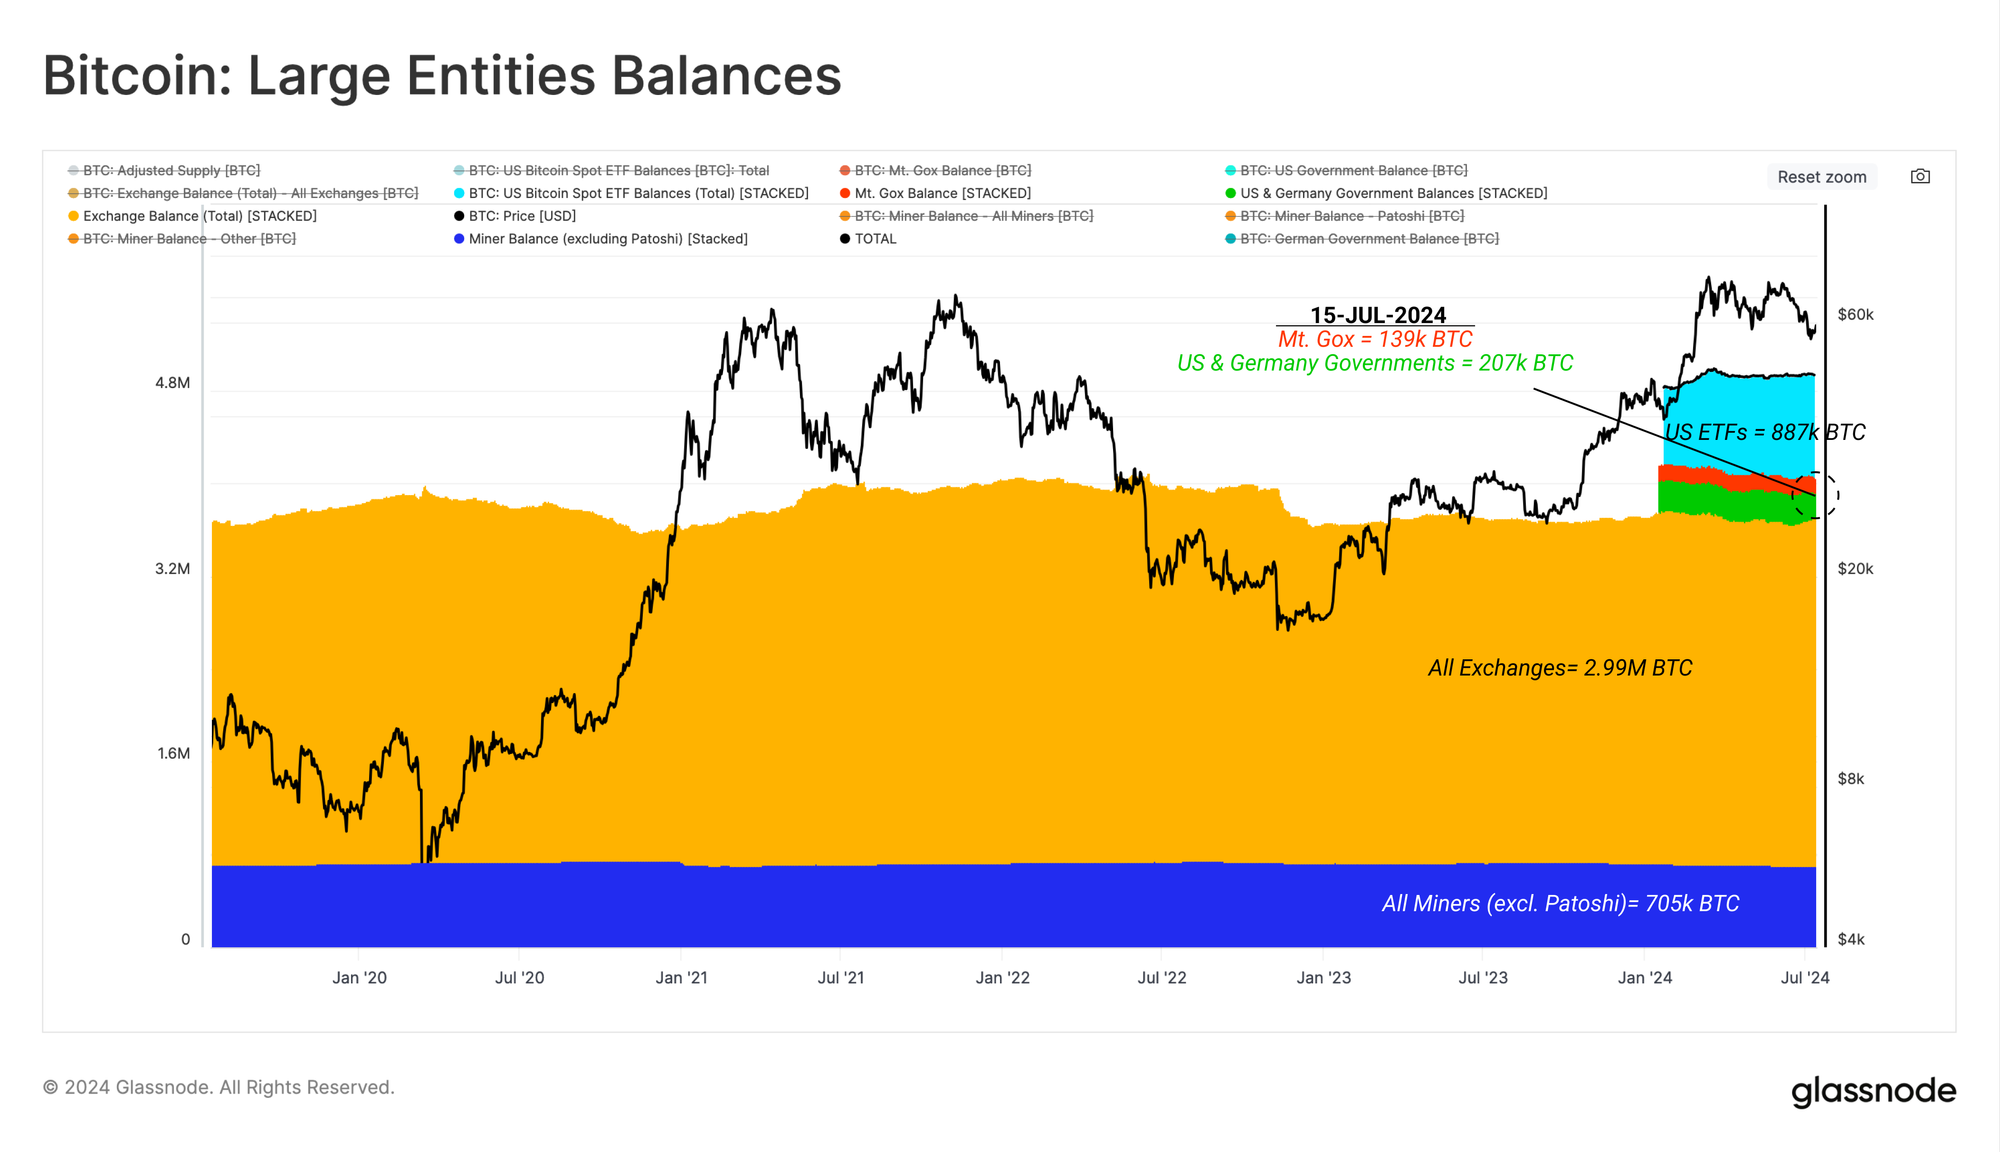
The chart below shows the volume of BTC held by these large entities.
- 🟨 Centralized Exchanges: 3M BTC
- ⬜ US ETF Balance: 887k BTC
- 🟦 Miners excluding Patoshi: 705k BTC
- 🟩 Government Entities: 207k BTC
- 🟥 Mt Gox Trustee: 139k BTC
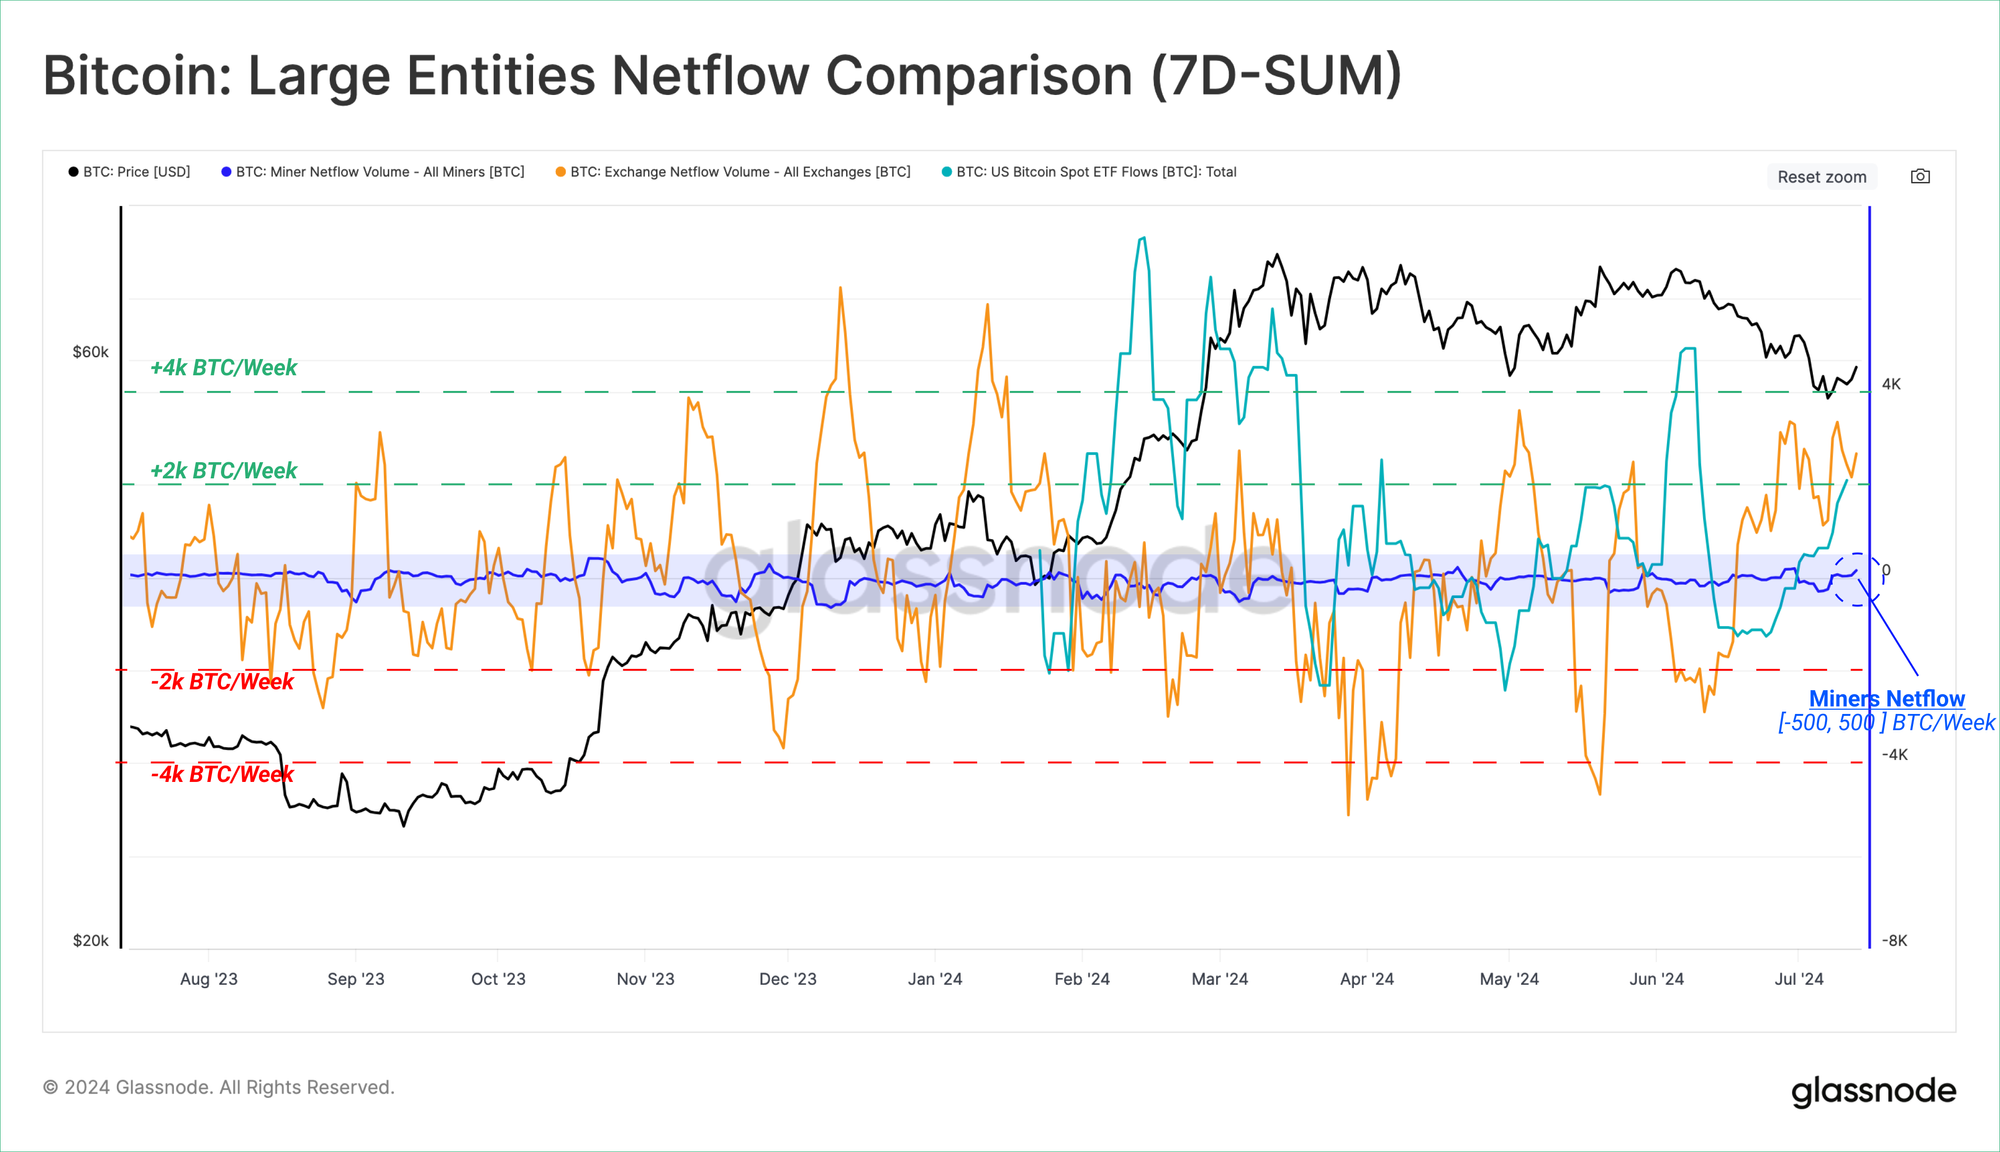
Miners have historically been a primary source of sell-side pressure, however their supply relevance does decrease with each halving event. Miner netflows over the last 12-months shows a typical aggregate balance change of around ±500 BTC per week.
In the chart below, we compare miner net flows 🔵 to the net deposit / withdrawal volumes of centralized exchanges 🟠, and to the netflows into ETF on-chain wallets 🟢. We can see that the latter two entities often see much larger swings of ±4K BTC, suggesting flows through these entities are likely to have a market influence of around 4x to 8x larger than for miners.
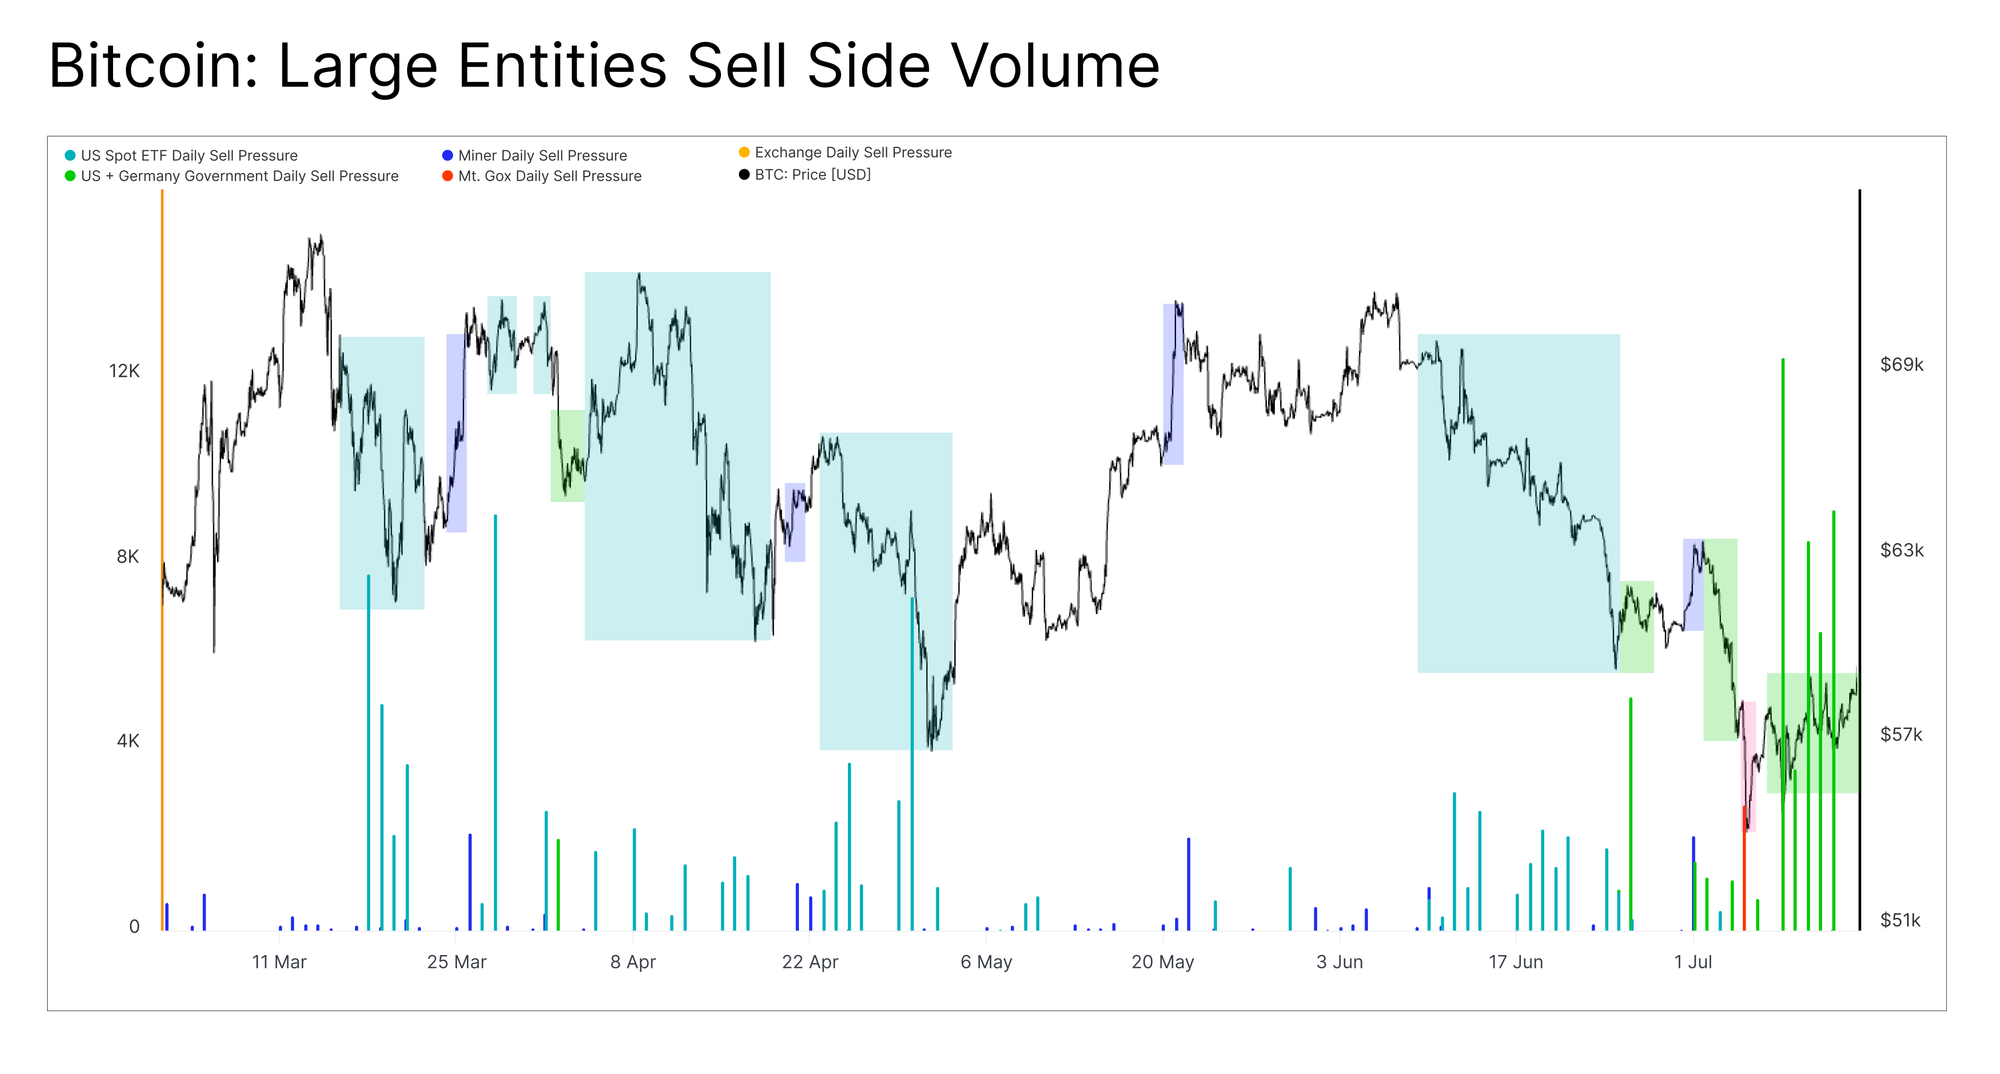
Keeping this netflow dynamic as our baseline, we can gauge the intensity of estimated sell-side pressure by large sized entities, by isolating only net outflow volumes. From this, three key observations can be made:
- Elevated sell-side pressure from miners tends to occur around periods of price volatility.
- ETF outflows dominated following the market setting a new ATH in March, which was largely dominated by the GBTC product.
- Sell-side sourced from the German Government in the last few weeks has been tremendous. However, we can also see that the majority of outflows occurred after prices had sold off to $54k, suggesting the market effectively front-ran the news.
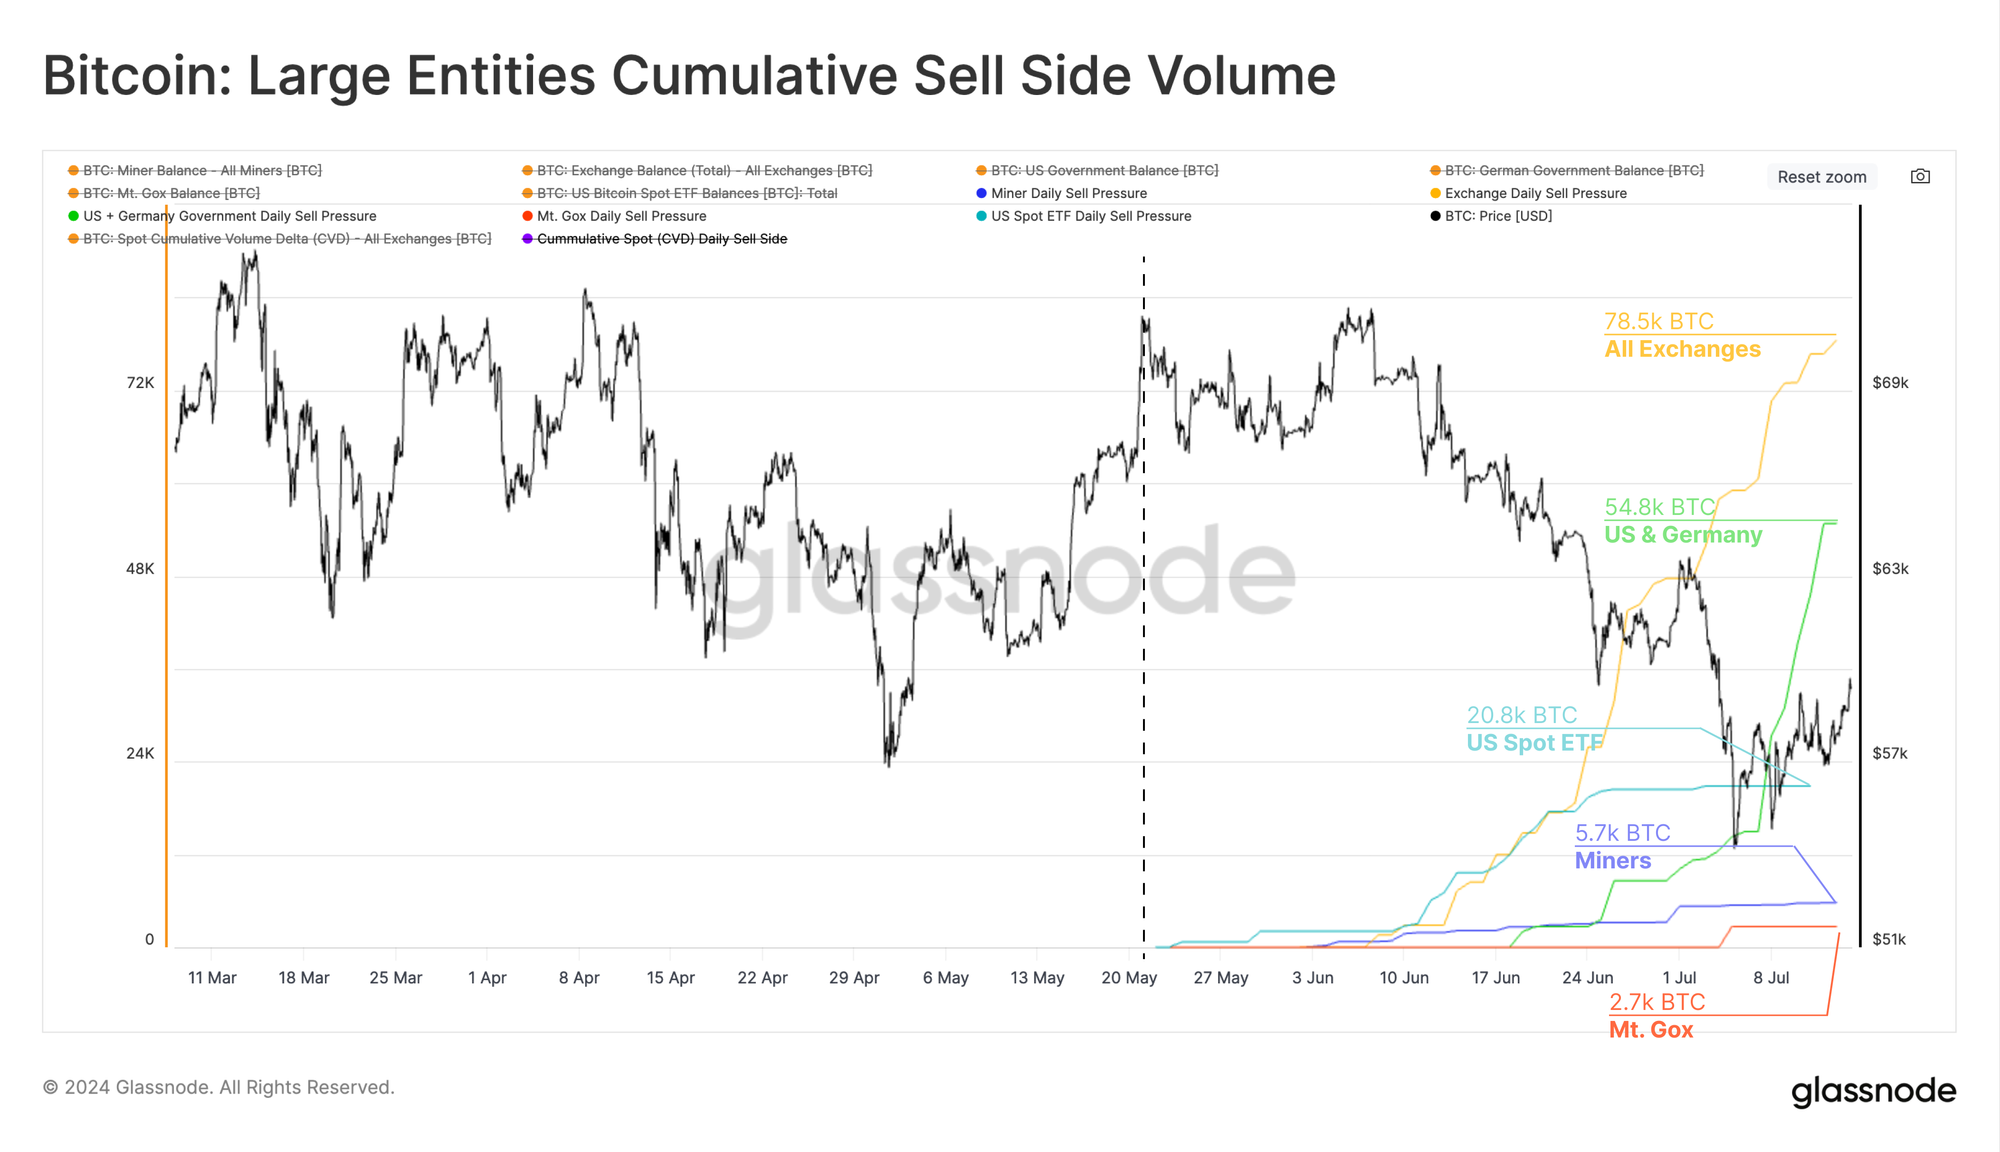
The chart below shows the cumulative net outflow activity of these large entities since the $73k ATH. From this, we can see how sell-side pressure from Miners is comparatively small relative to Government sell-side, ETF outflows, and exchange deposit volumes.
Centralized exchange deposits continue to be the largest and most persistent source of sell-side pressure. However even with these primary trading venues as our upper bound, we can see the massive scale of sell-side from the German Government of late.
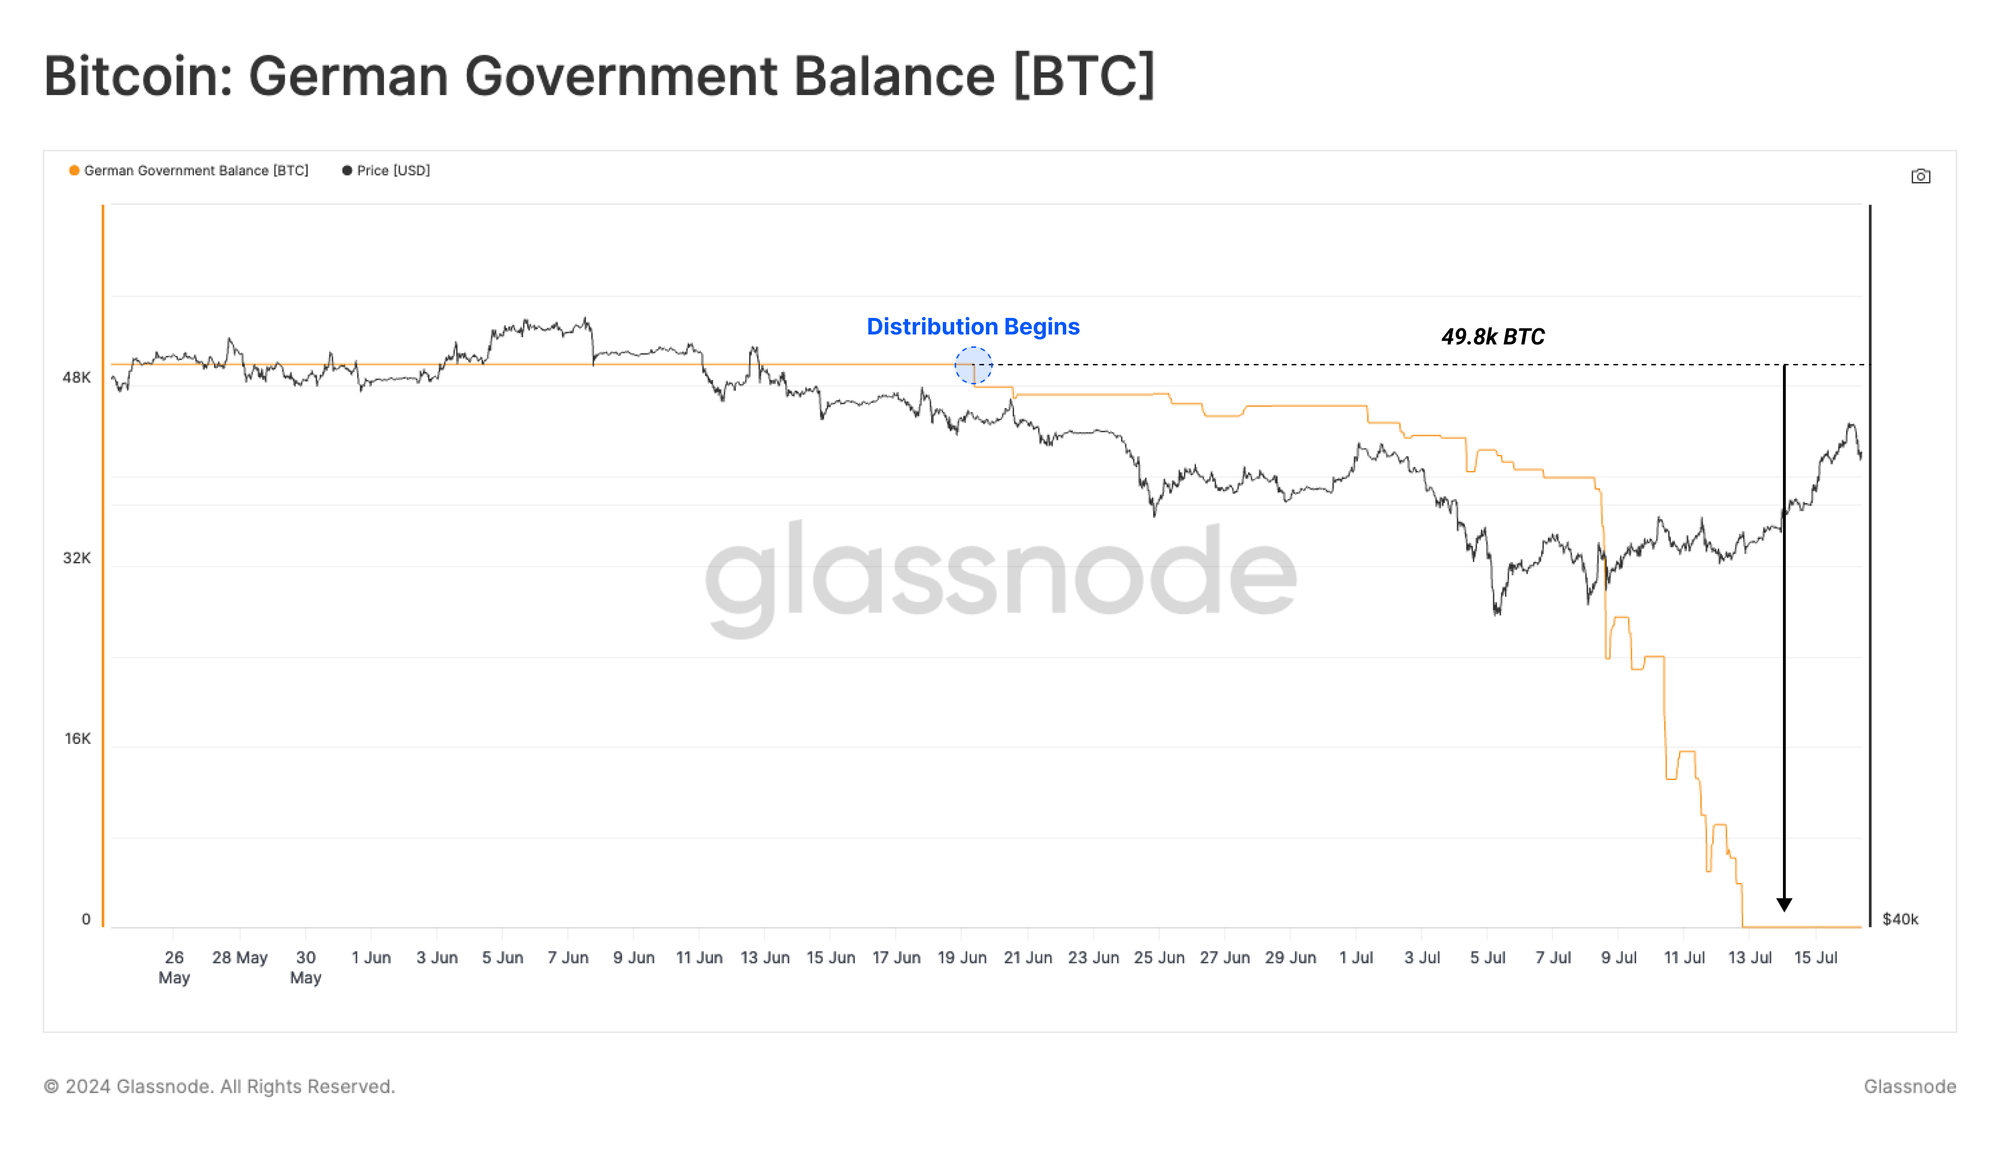
Increasing our focus on the German Government sell pressure, we can see their 48.8k BTC balance was depleted over just a few weeks. The majority was distributed over a very short window between 7-July and the 10th-July, where over 39.8k BTC flowed out of labelled wallets.
Interestingly, this sell-side occurred after the market had bottomed around $54k, suggesting market front-ran the news.
Stability and Speculation
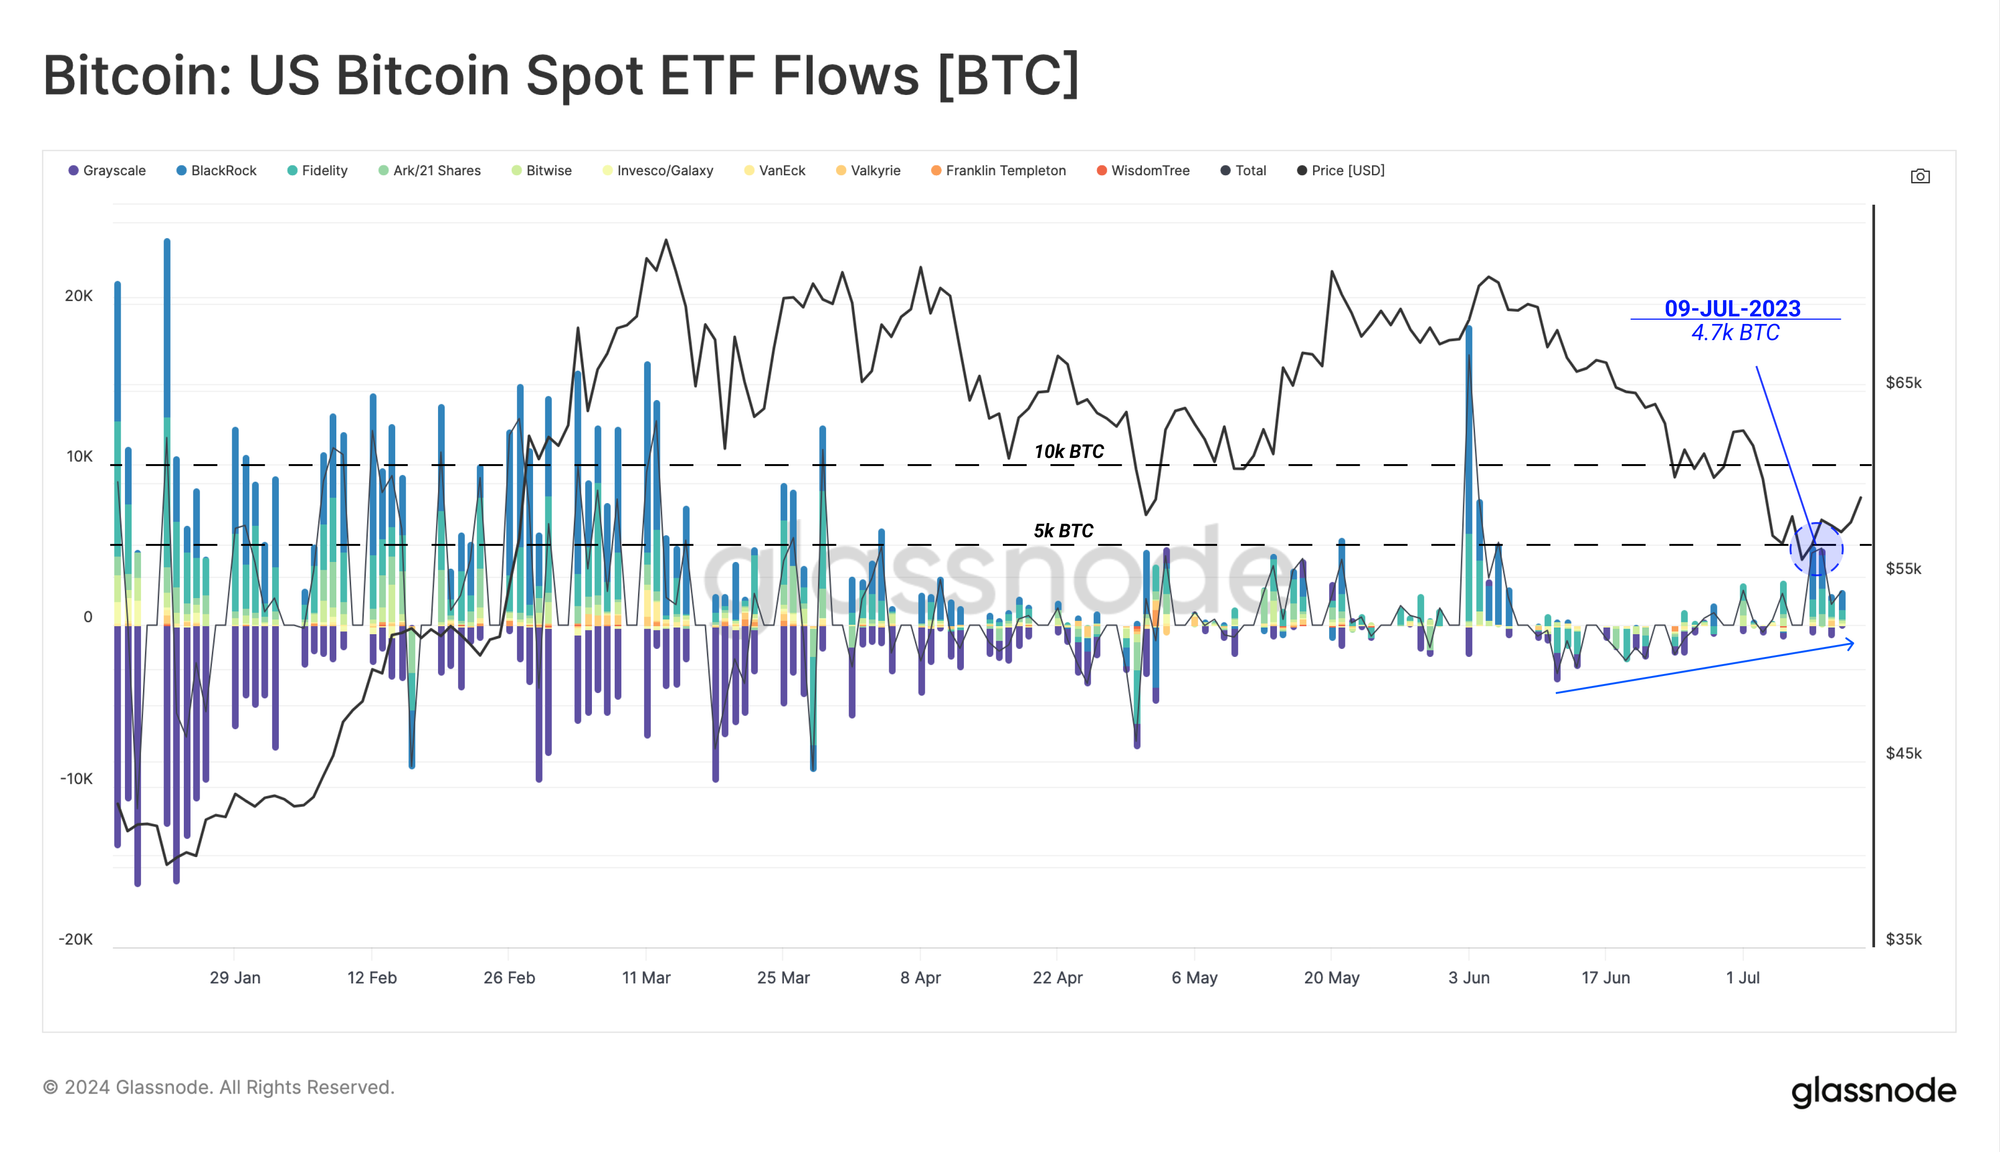
Following an extended period of choppy range-bound trading, aggregated netflows across all ETFs saw a sustained period of outflows. As prices sold off towards the $54k low, they dropped below the average inflow cost basis of ETF holders, which is currently at $58.2k.
In response, the ETFs have seen their first significant tranche of positive interest since early June, with over $1B in total inflows last week alone.
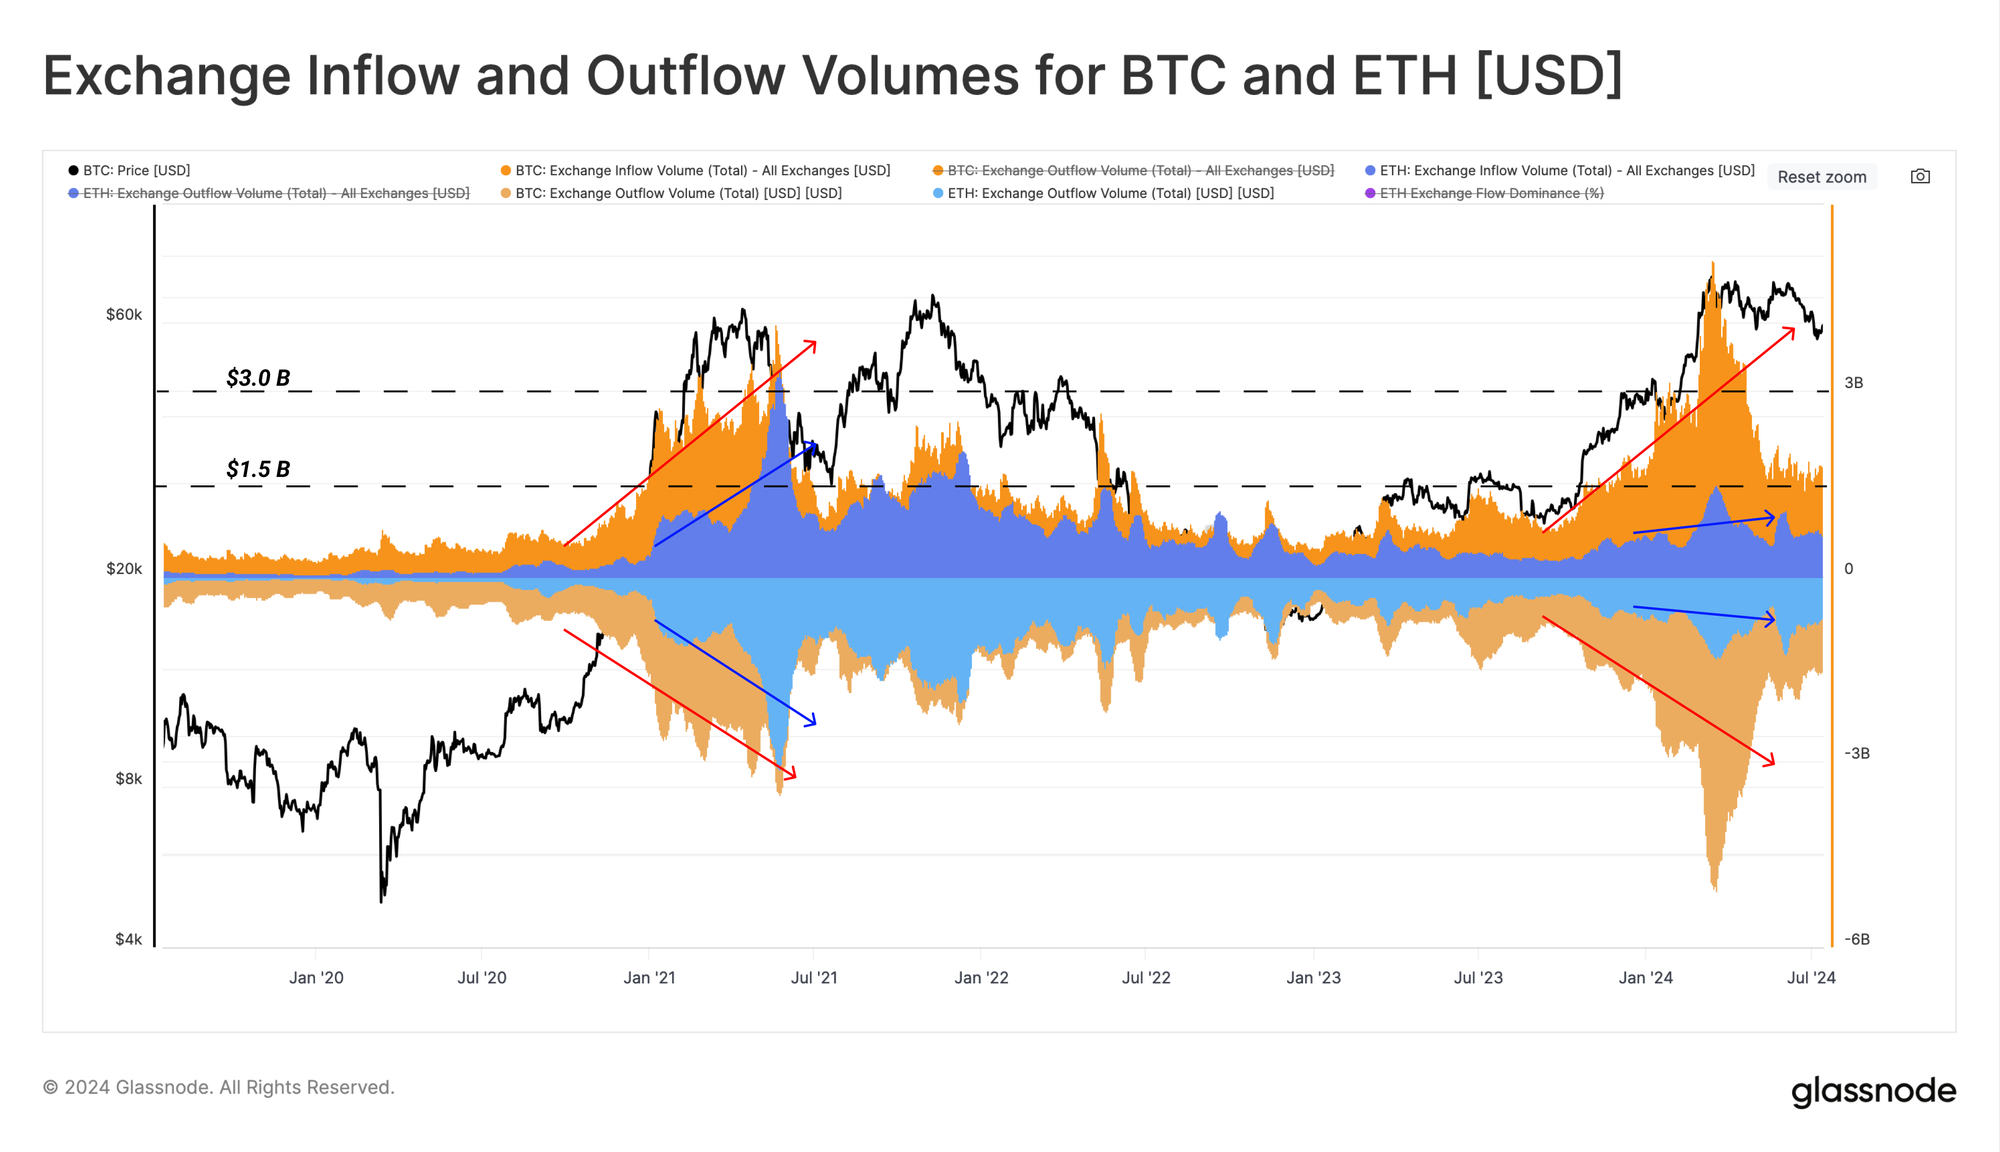
Volumes deposited and withdrawn from exchanges tend to be a strong gauge for investor interest and market liquidity. After the ATH was set in March, there has been a marked decline in exchange flows, where BTC volumes 🟠 have since found a stable baseline of around $1.5B/day.
If we compare the inflow and outflow structure for Ethereum 🔵, there has been a notably less interest relative to the 2021 bull cycle. At the height of the 2021 bull cycle, daily ETH exchange flows were almost as large as for BTC.
This suggests that the degree of speculative interest in 2024 has been comparatively muted, and aligns with the generally weaker performance of ETH relative to BTC since the 2022 cycle lows.
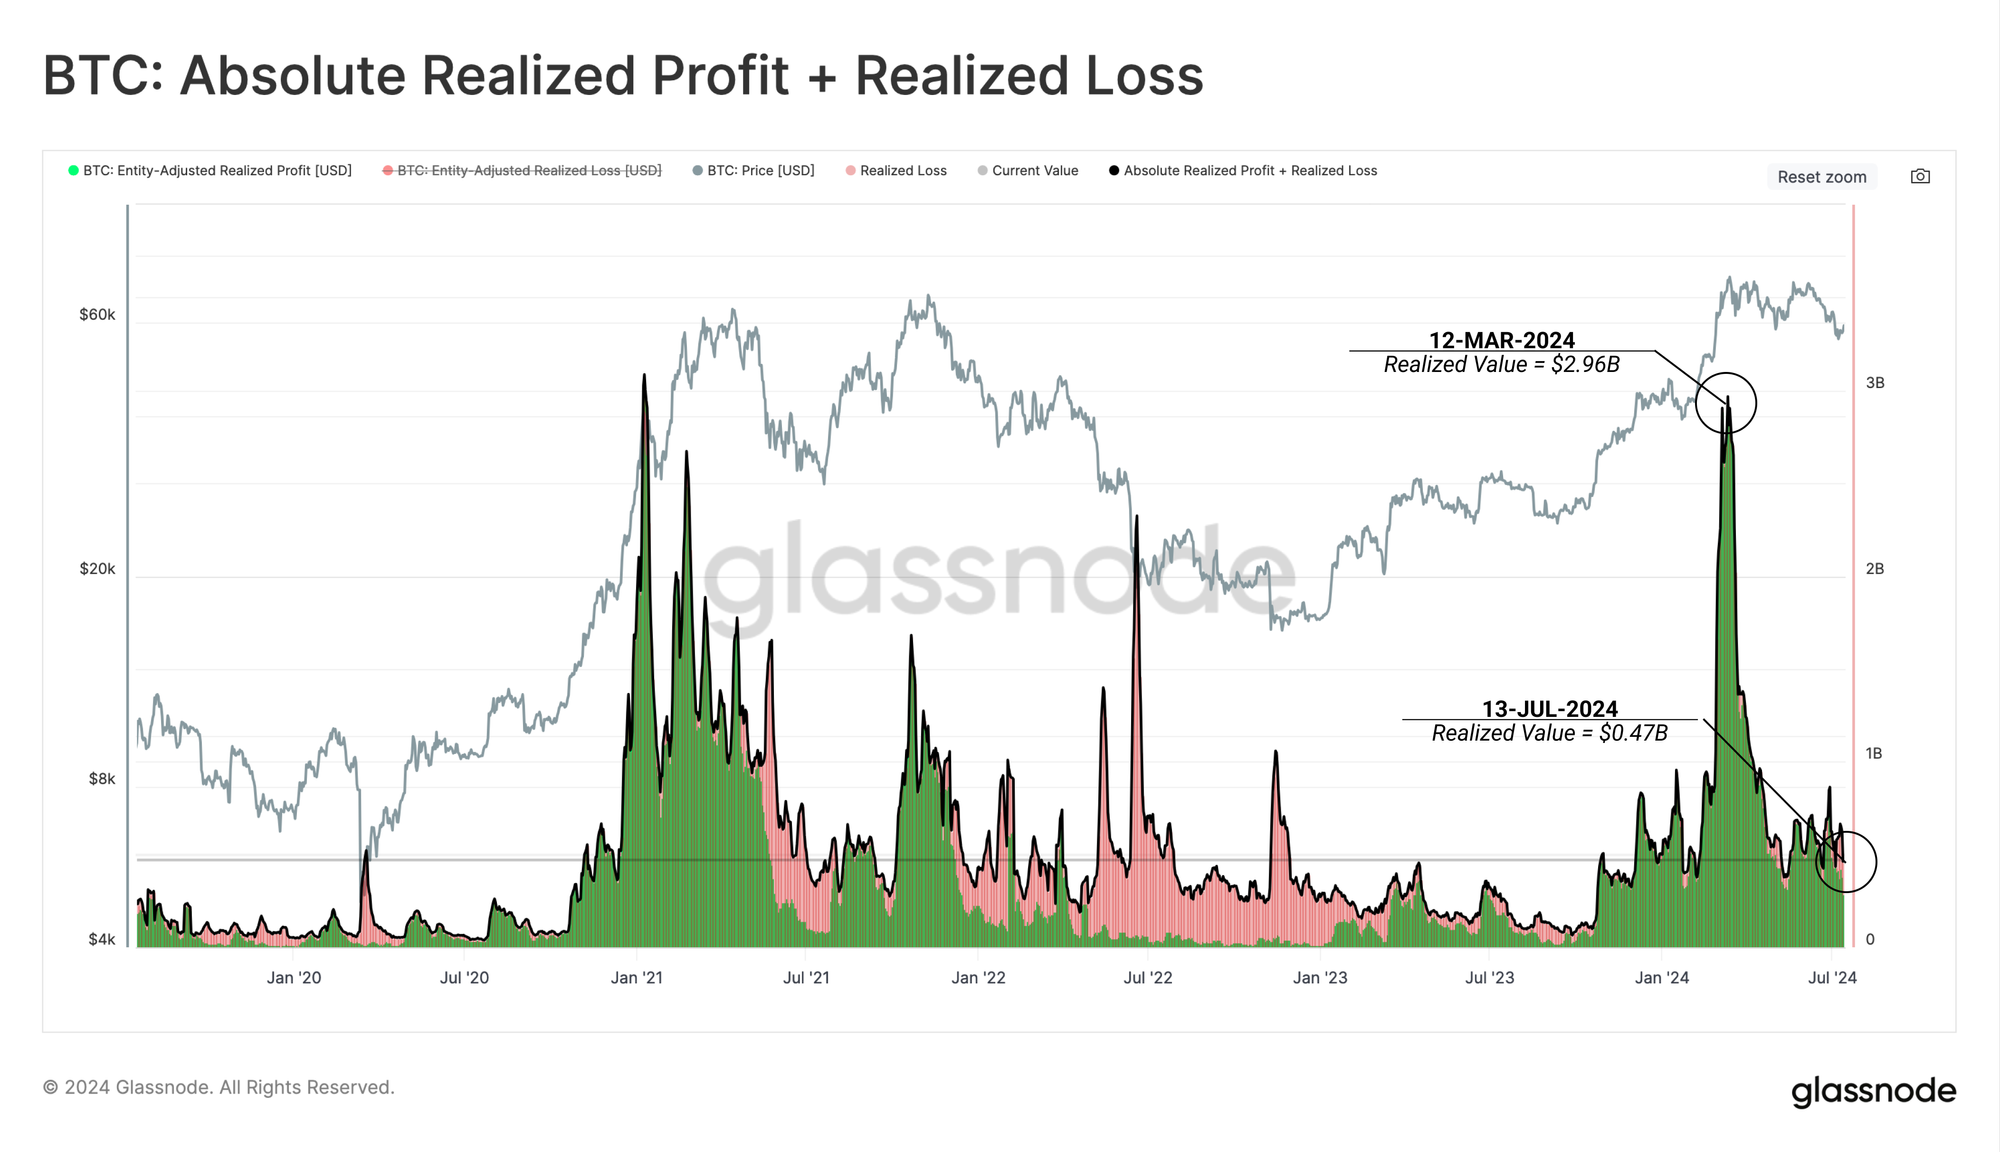
The magnitude of realized profit and loss being locked in by investors can also provide a proxy for demand. By this metric, we can see a similar story, where significant demand supported the rally into the ATH, and was followed by a period of compression and consolidation.
This underscores the an equilibrium being established between supply and demand over the past 3-months. We can also see that realized losses have not ticked meaningfully higher thus far, suggesting limited panic, despite the market correcting over -25% from the highs.
Net Sell-Side
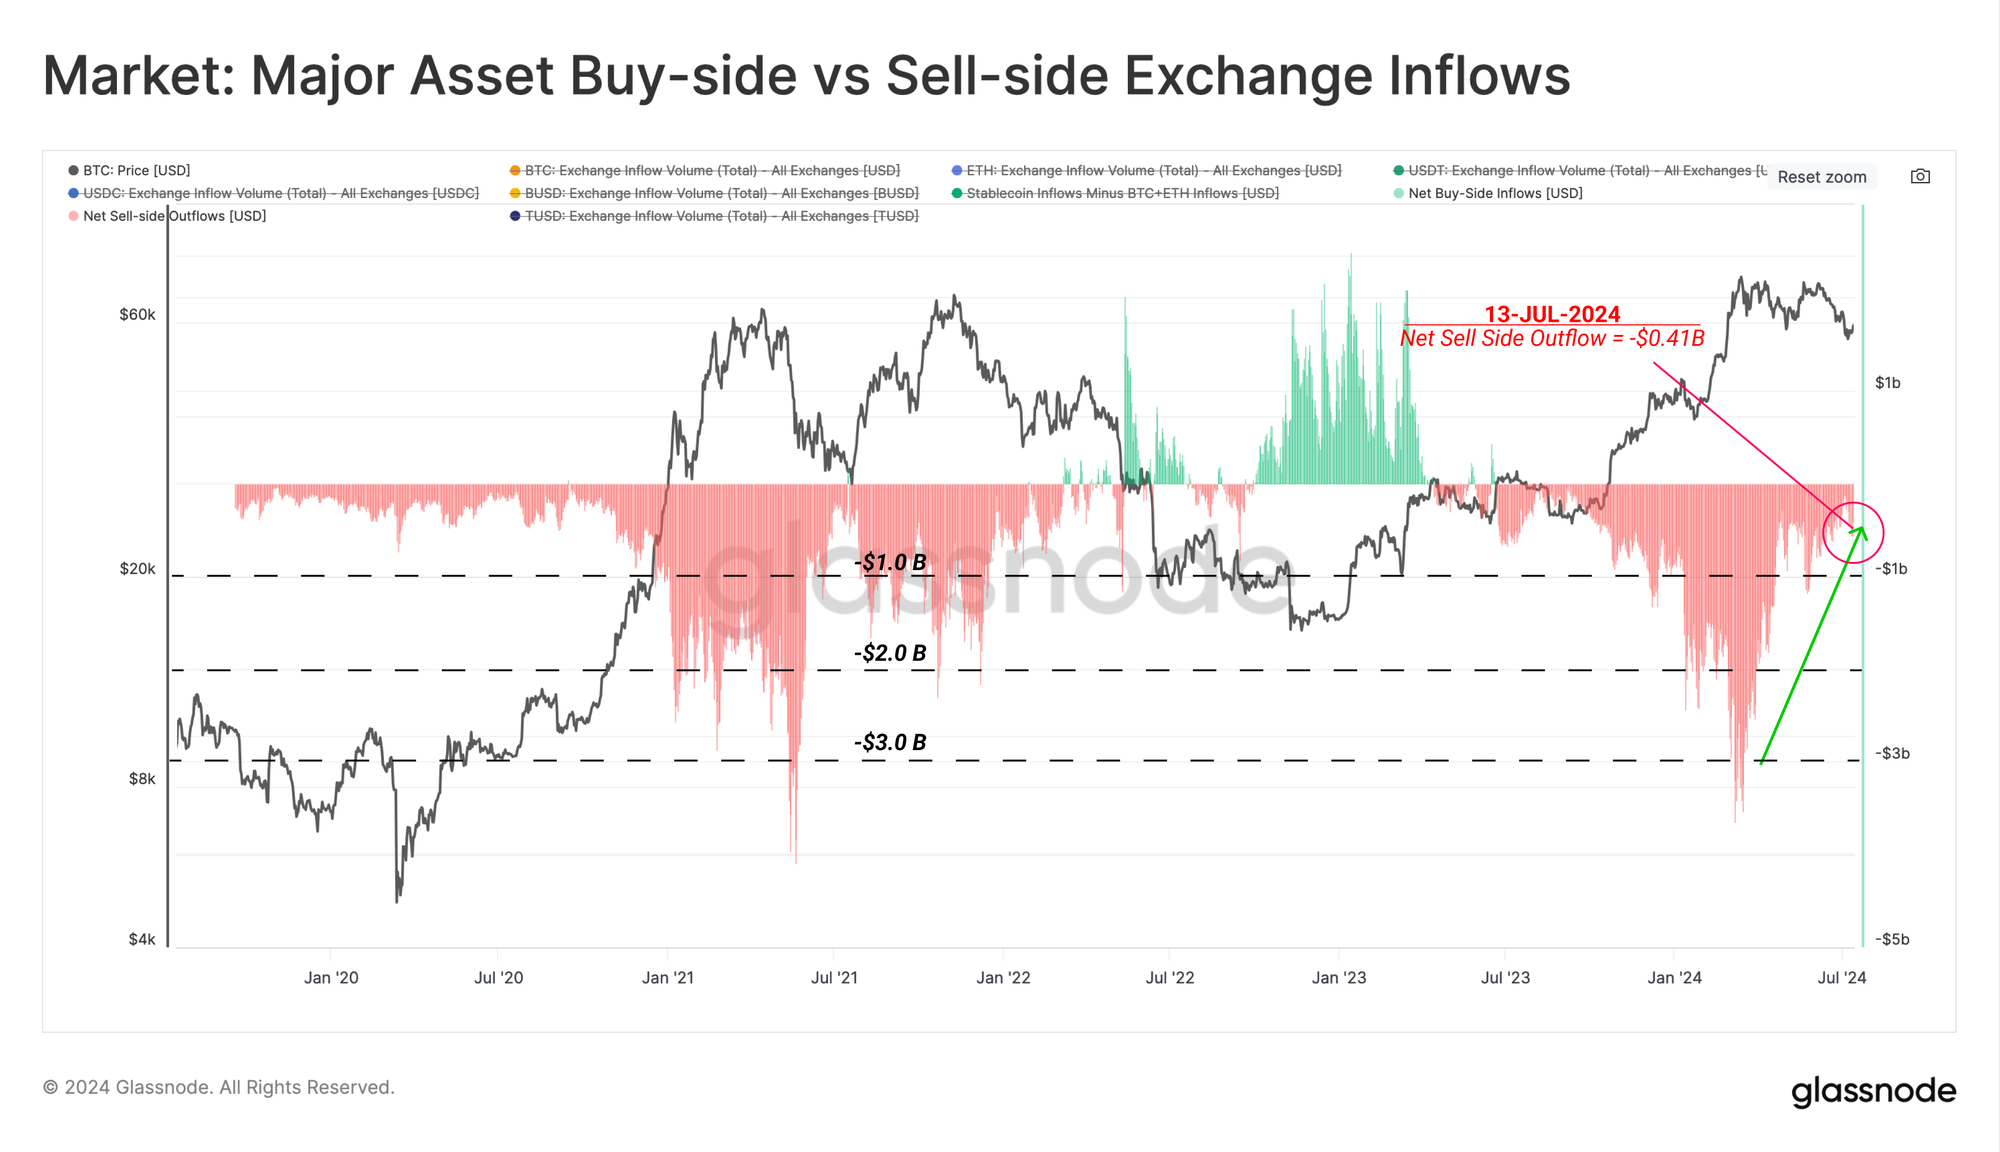
If we consider exchange inflows of BTC and ETH as sell-side pressure, we can compare this to the inflow volumes of stablecoin, representing a proxy for demand. By this metric, we are able to assess the overall balance between buy-side or sell-side bias in the market.
We can consider this via the following framework:
- Values near zero suggest an neutral regime, where buy-side inflows are of an equivalent magnitude to sell-side pressure from the major two assets.
- 🟢 Positive values suggest a net buy-side regime, where stablecoin buy side exceeds sell-side by the major assets.
- 🔴 Negative values suggest a net sell-side regime, where sell-side volumes exceed the available new stablecoin capital to absorb it.
As we can see, the market has been experiencing a net sell-side regime since mid-2023, however this has been on the decline over the last few months.
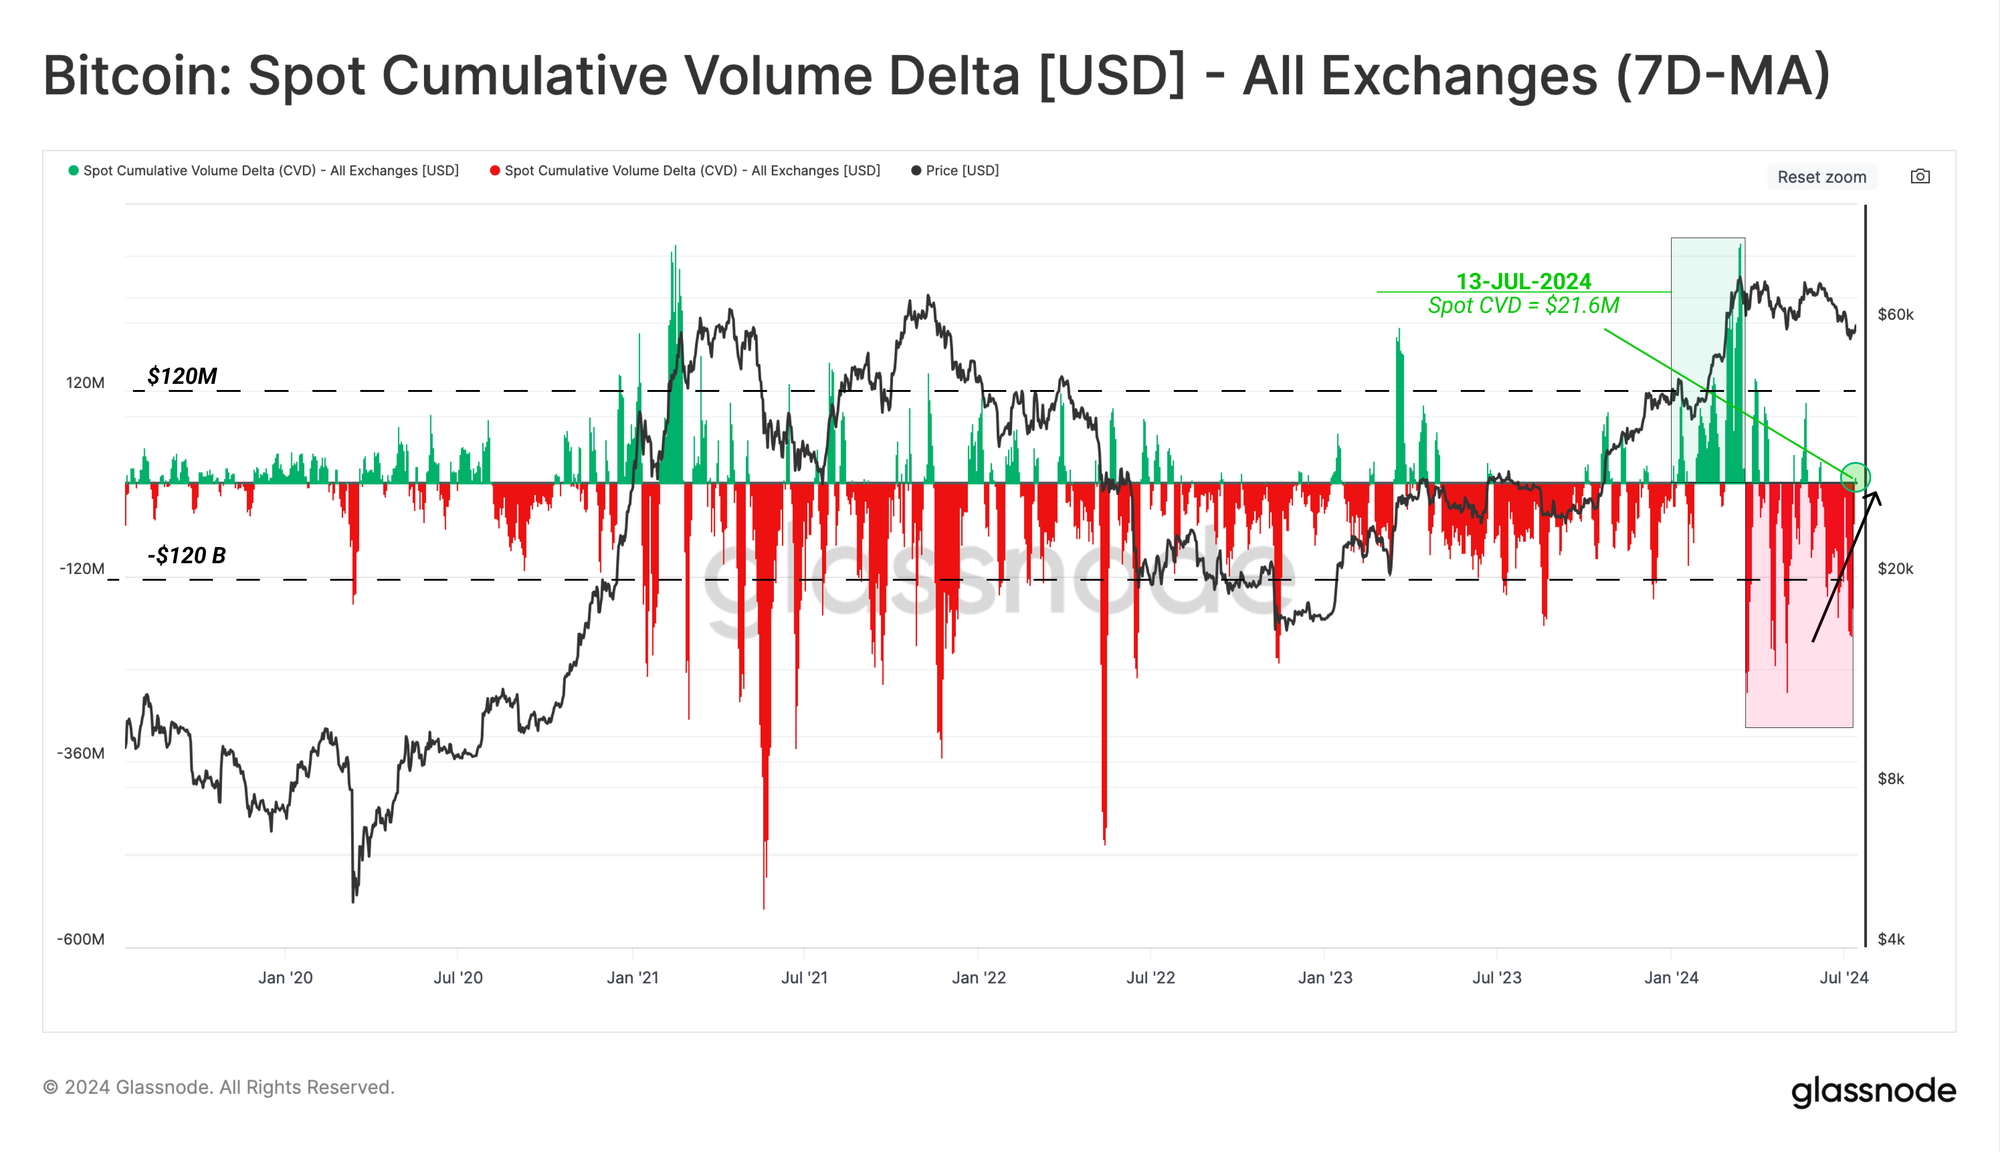
We see a similar dynamic using the spot cumulative volume delta (CVD) metric. This tool measures the net difference between buying and selling trade volumes on centralized exchanges.
From this perspective, we can see the significant sell-side dominance since the March ATH. However, as of last week, CVD has recorded the first net-buy-side indicator since July, suggesting a softening of sell-side pressure applied to spot markets.
Investor Profitability Remains Robust
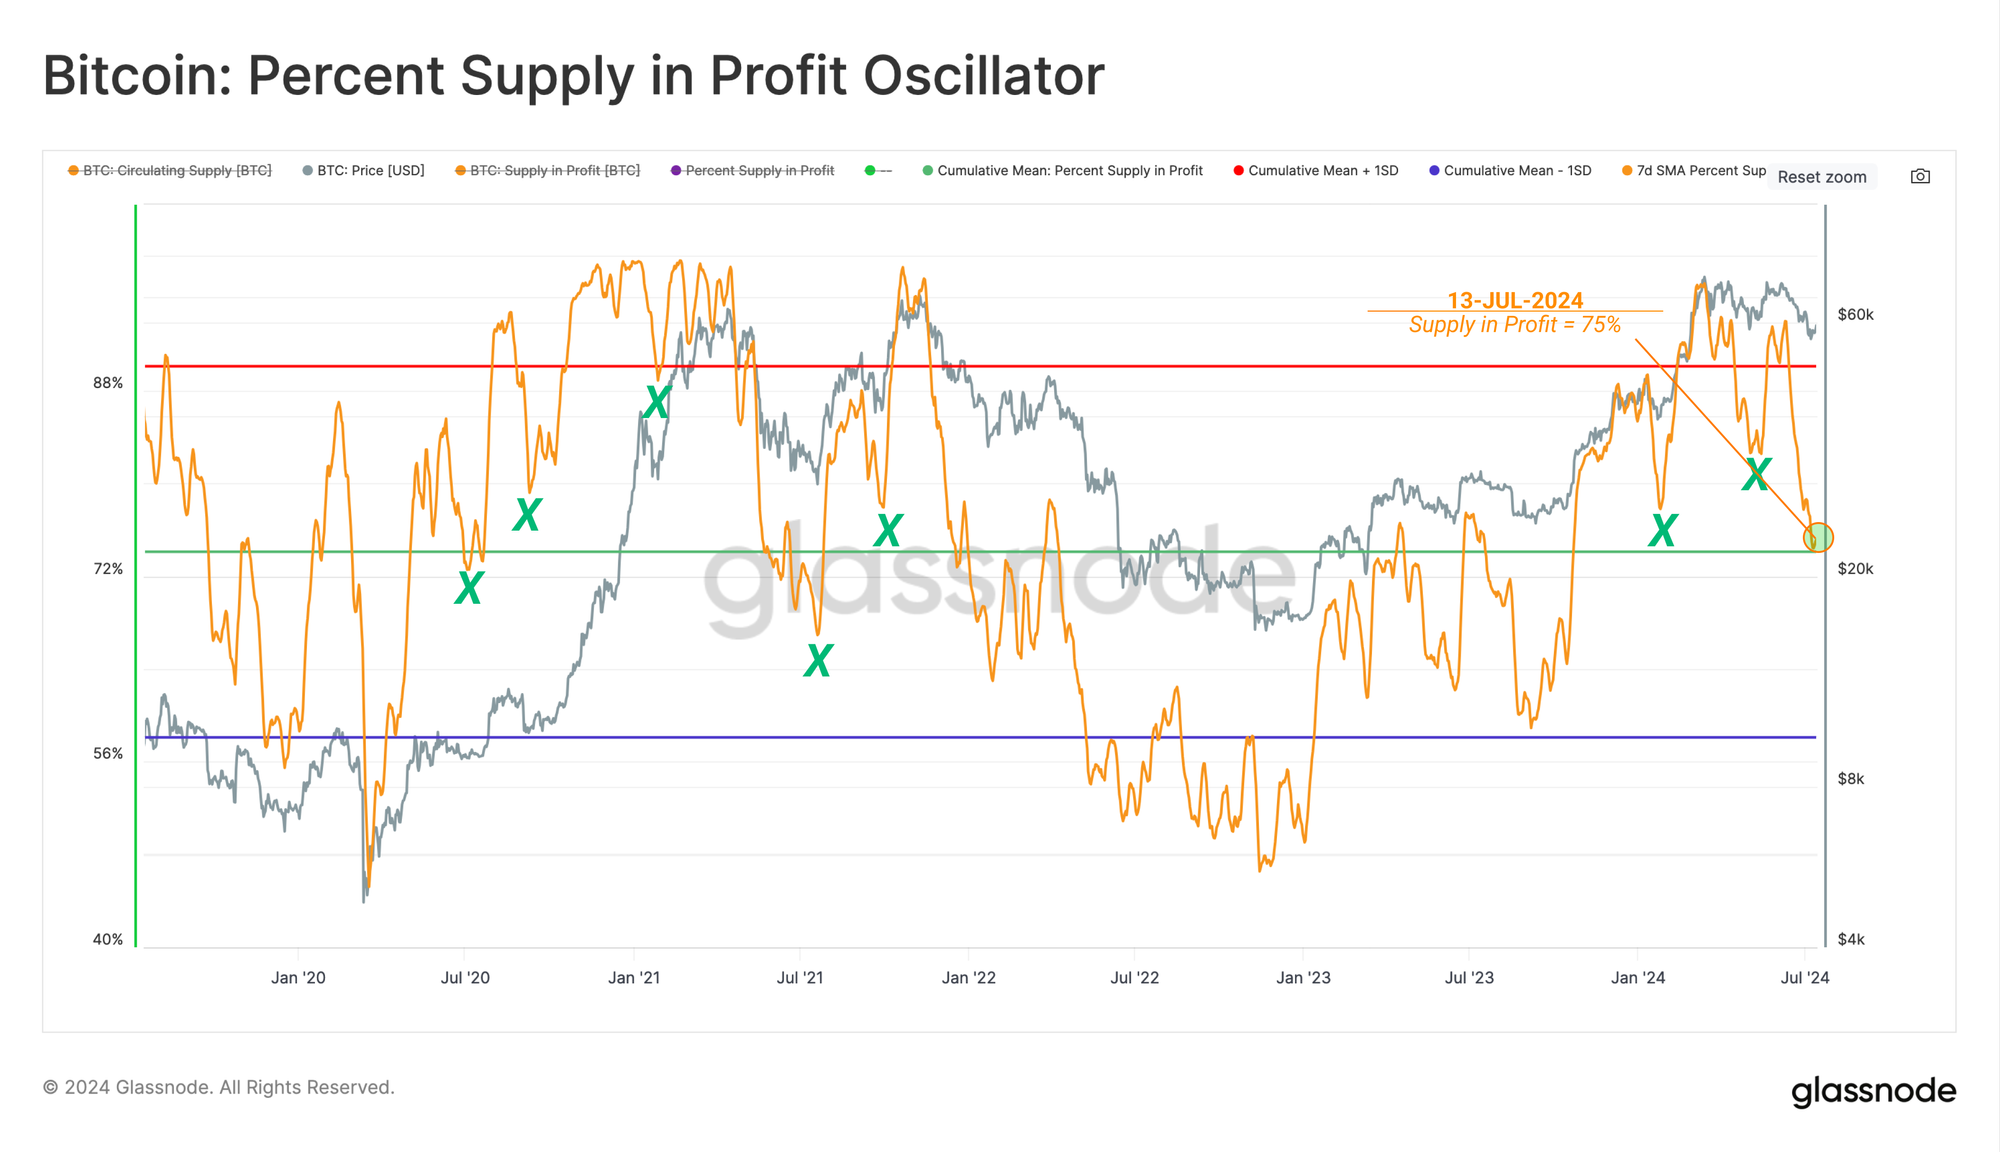
As Bitcoin prices traded down to the local low of $53.5k, the proportion of the coin supply held at an unrealized loss spiked to around 25% of the coin supply. This brought the Percent Supply in Profit metric back down towards its long-term mean of 75%, which is a level it has historically visited during previous bull market corrections.
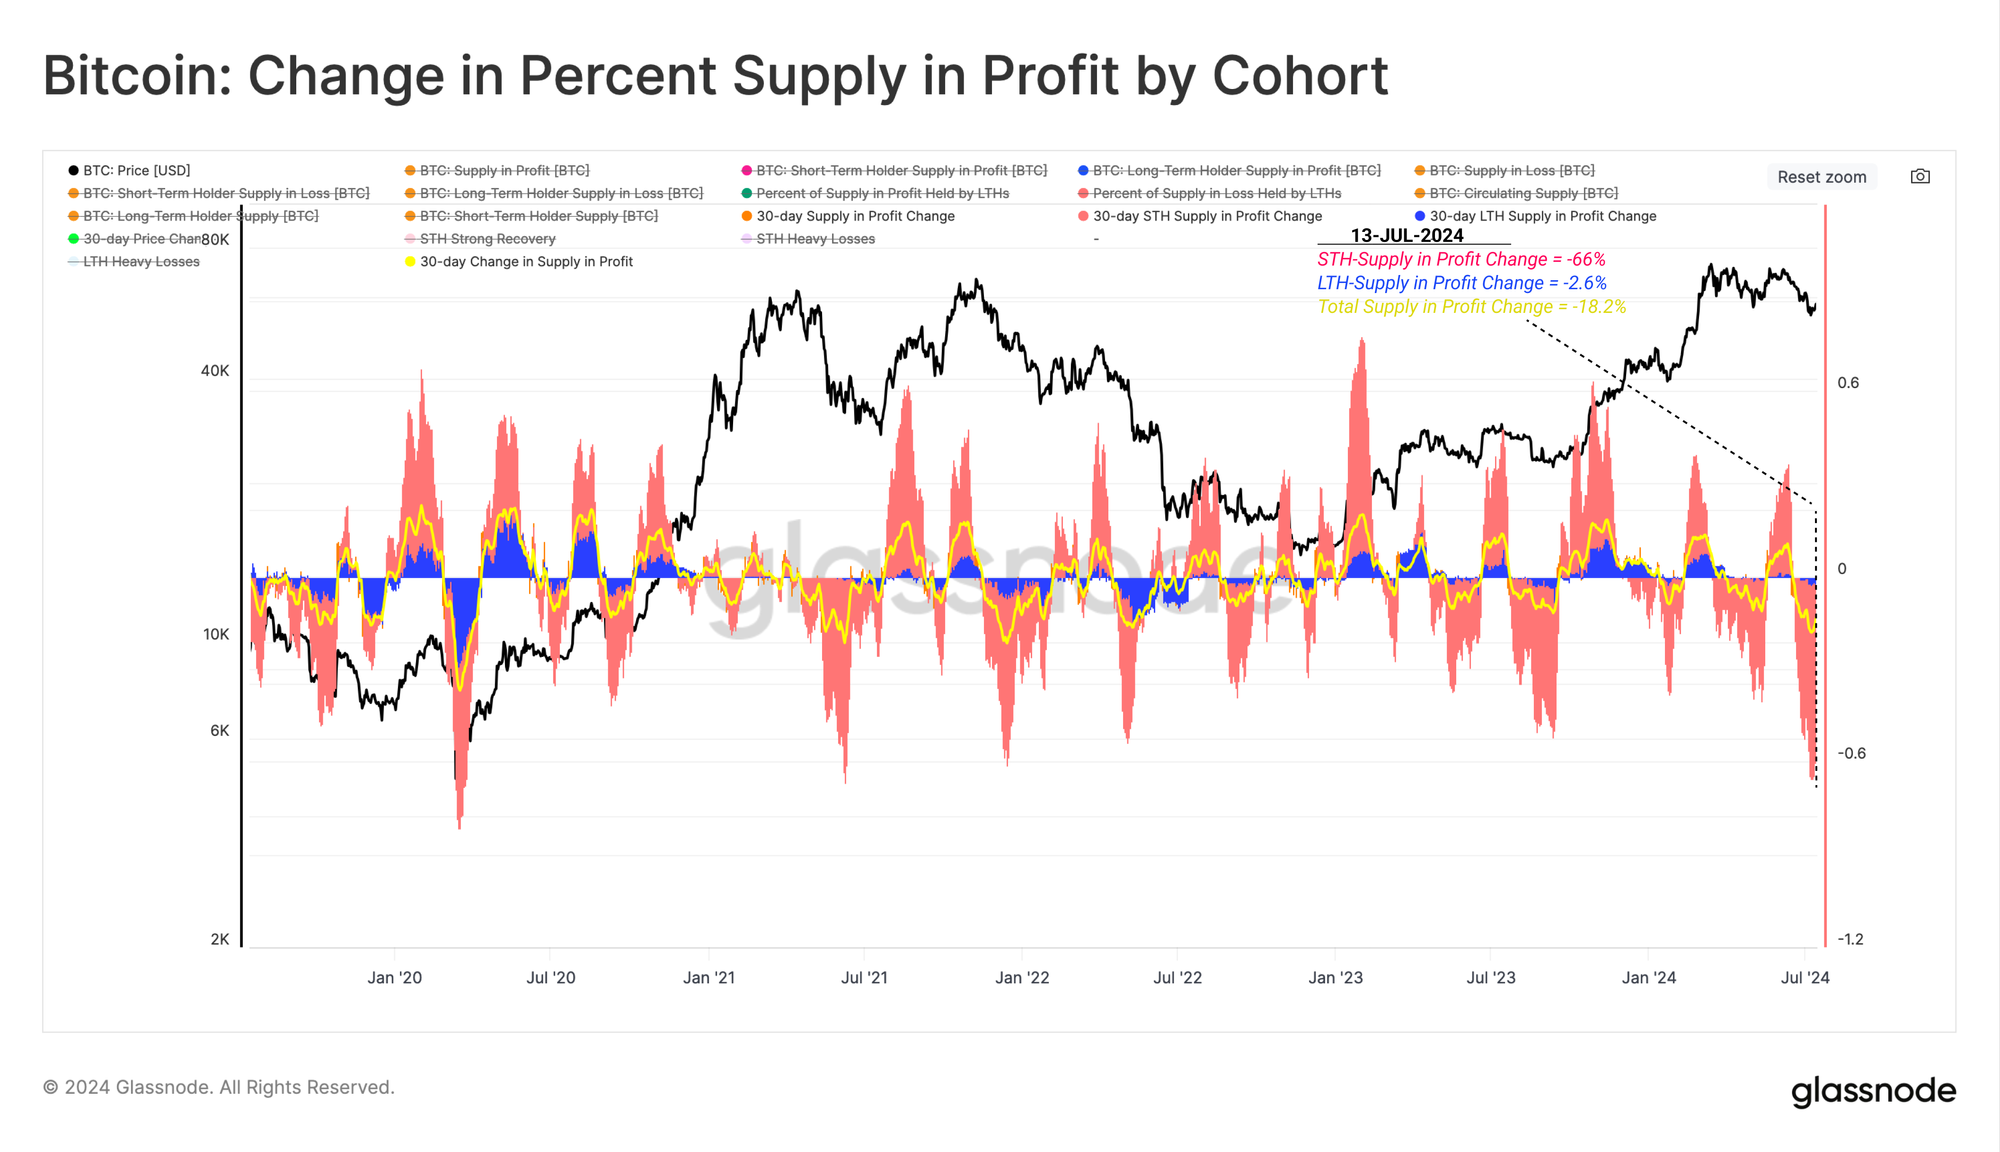
By segregating the percent of the coin supply in profit by Long and Short-Term Holders, we can evaluate the impact of the price contraction on these two cohorts.
Across the last 30-days, the Short-Term Holder (STH) cohort experienced a dramatic decline in profitability, with more than -66% of their supply moving into an unrealized loss. This is one of the largest declines in STH profitability on record.
This suggests that a significant number of “top buyers; have seen their portfolio profitability challenged in recent weeks.
However, for the opposing cohort, the Long-Term Holders, they have experienced a negligible shift in the proportion of their supply held in profit. This demonstrates that relatively few investors from the heights of the 2021 bull still hold onto their coins.
Overall, this indicates that the STH cohort remain the primary group who are most likely to respond to market volatility, with their average cost basis is currently at around 64.3k.
Summary and Conclusion
Examining the magnitude of major sell-side forces, Miners have historically been a primary source of sell-side pressure, however, we note a diminishing return on their market impact with each successive halving. Alternatively, the relevance of ETF Flows and Centralized Exchanges on price action grows convincingly.
The Bitcoin market absorbed a significant 48k BTC across the last month as the German Government achieved a full distribution of their balance sheet. This complete exhaustion of the German Government sell-side pressure has provided the market with ample relief, whilst initial glimmers of a renewed demand-side have stimulated positive price action.
Short-Term Holders have endured a challenging month with the recent correction placing a substantial portion of their coin supply into a position of loss. Alternatively, mature investors remained steadfast, experiencing a near negligible decline in profitability, highlighting their impressive conviction and robust market positioning.
Disclaimer: This report does not provide any investment advice. All data is provided for information and educational purposes only. No investment decision shall be based on the information provided here and you are solely responsible for your own investment decisions.
Exchange balances presented are derived from Glassnode’s comprehensive database of address labels, which are amassed through both officially published exchange information and proprietary clustering algorithms. While we strive to ensure the utmost accuracy in representing exchange balances, it is important to note that these figures might not always encapsulate the entirety of an exchange’s reserves, particularly when exchanges refrain from disclosing their official addresses. We urge users to exercise caution and discretion when utilizing these metrics. Glassnode shall not be held responsible for any discrepancies or potential inaccuracies. Please read our Transparency Notice when using exchange data.
- Join our Telegram channel
- For on-chain metrics, dashboards, and alerts, visit Glassnode Studio
- For automated alerts on core on-chain metrics and activity on exchanges, visit our Glassnode Alerts Twitter