Testing The Range Bands
Bitcoin prices have rebounded strongly, rallying over $68k and catalyzing an uptick in perpetual futures activity. The appreciation in price has also provided much-needed relief for the Short-Term Holder cohort, with 75% of their coins now held in profit.


Executive Summary:
- Binance, Bybit and OKX remain the industry leaders for perpetual swap markets, accounting for around 84% of the total open interest.
- We introduce a novel model to track the sensitivity of leverage and Open Interest in Futures markets relative to changes in the spot Bitcoin price.
- Price has climbed back above the Short-Term Holder cost basis, which has provided much-needed relief for new investors, with over 75% of their supply moving back into profit.
Perpetual Pivots
The perpetual futures markets are the deepest and most liquid trading venue for digital assets. The trade volume is often orders of magnitude greater than spot markets, and it is a preferred instrument for executing trades, speculative positions, and arbitrage strategies.
In this section, we aim to introduce a framework which utilizes the perpetual futures market to identify market pivot points. It seeks to identify points where over-leveraged speculators are liquidated during a bull market correction.
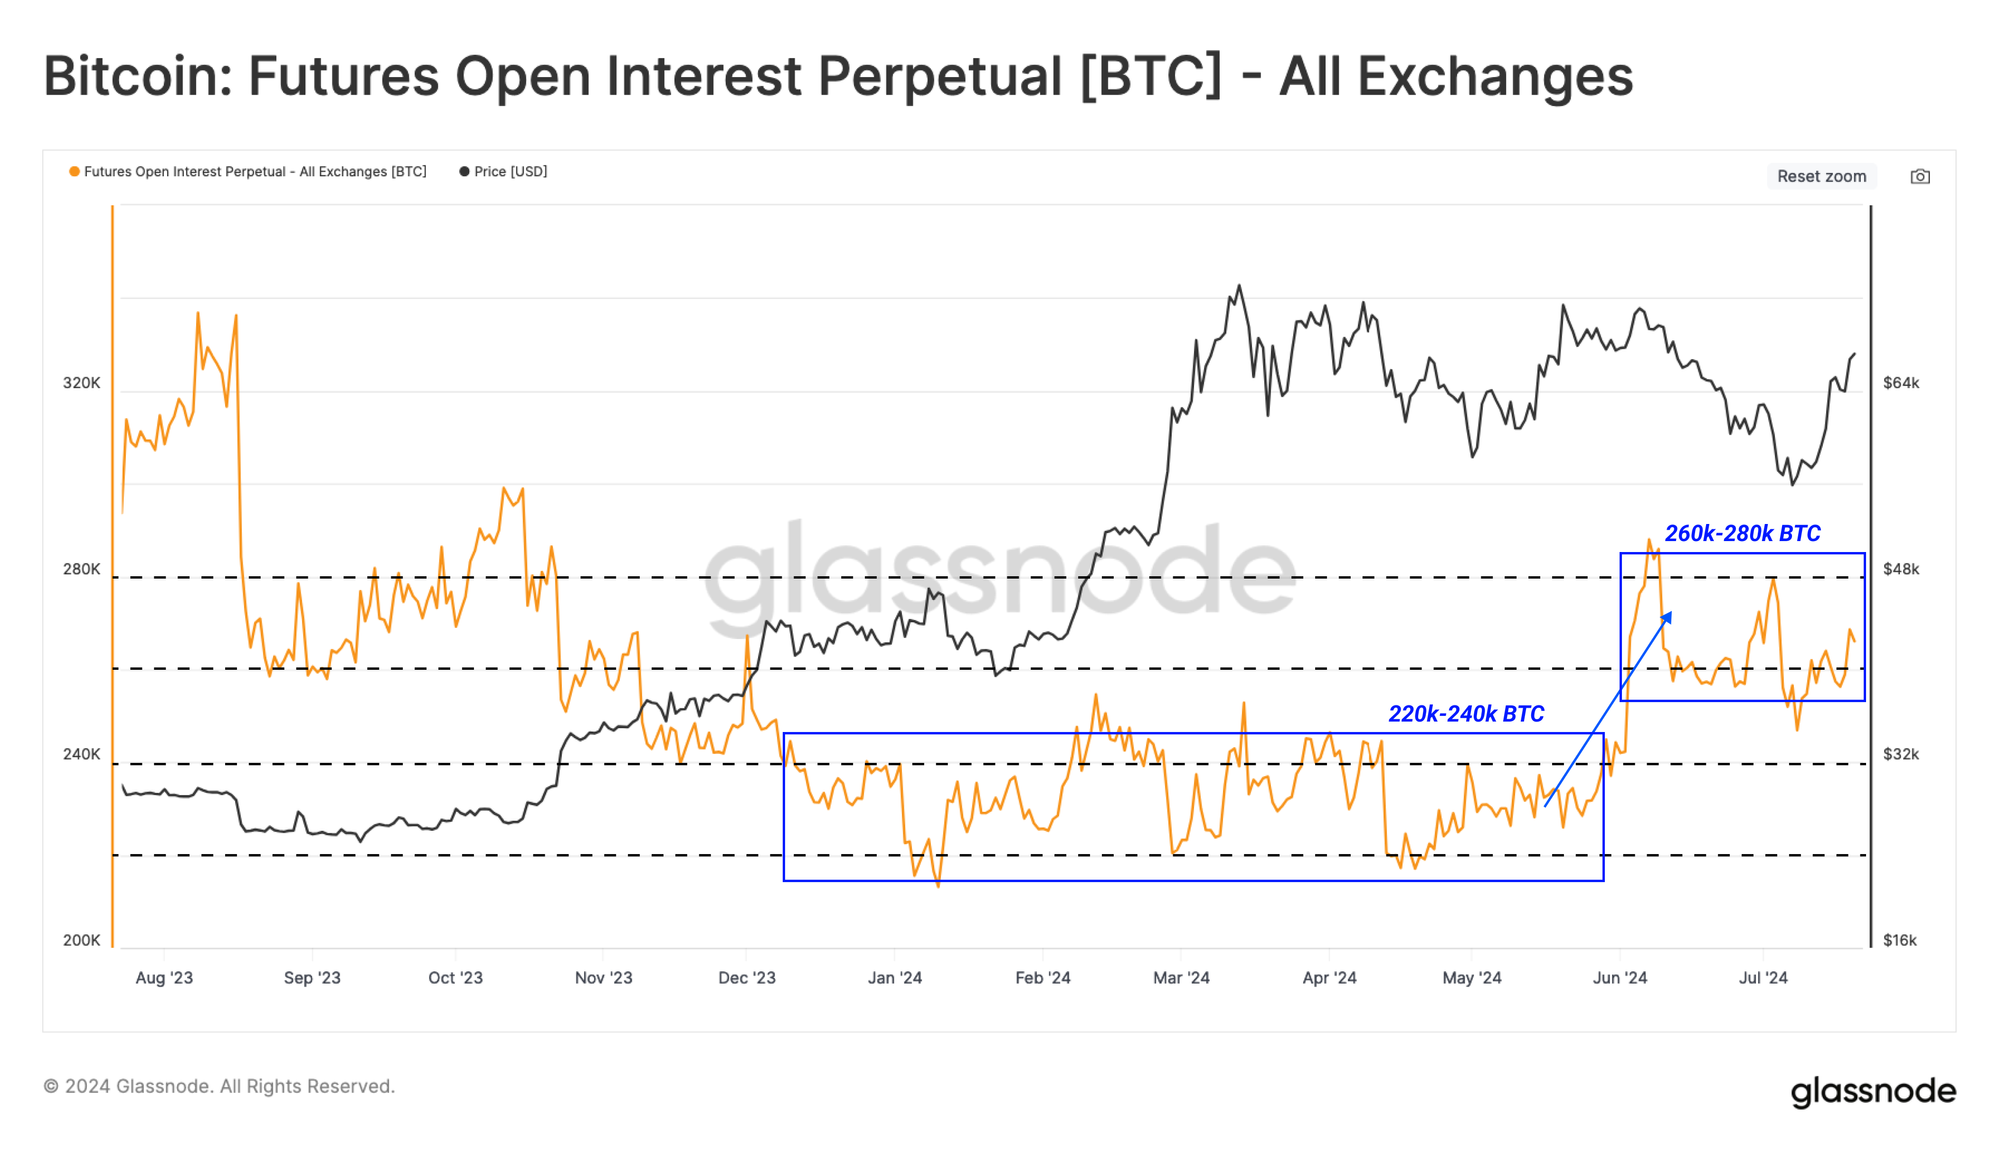
In 2024, open interest across perpetual futures has ranged between 220k and 240k BTC. This value often decreases quickly during deleveraging events and increases during more speculative periods. More recently, open interest has risen into the 260k to 280k BTC range, indicating an elevated appetite for speculation since early June.
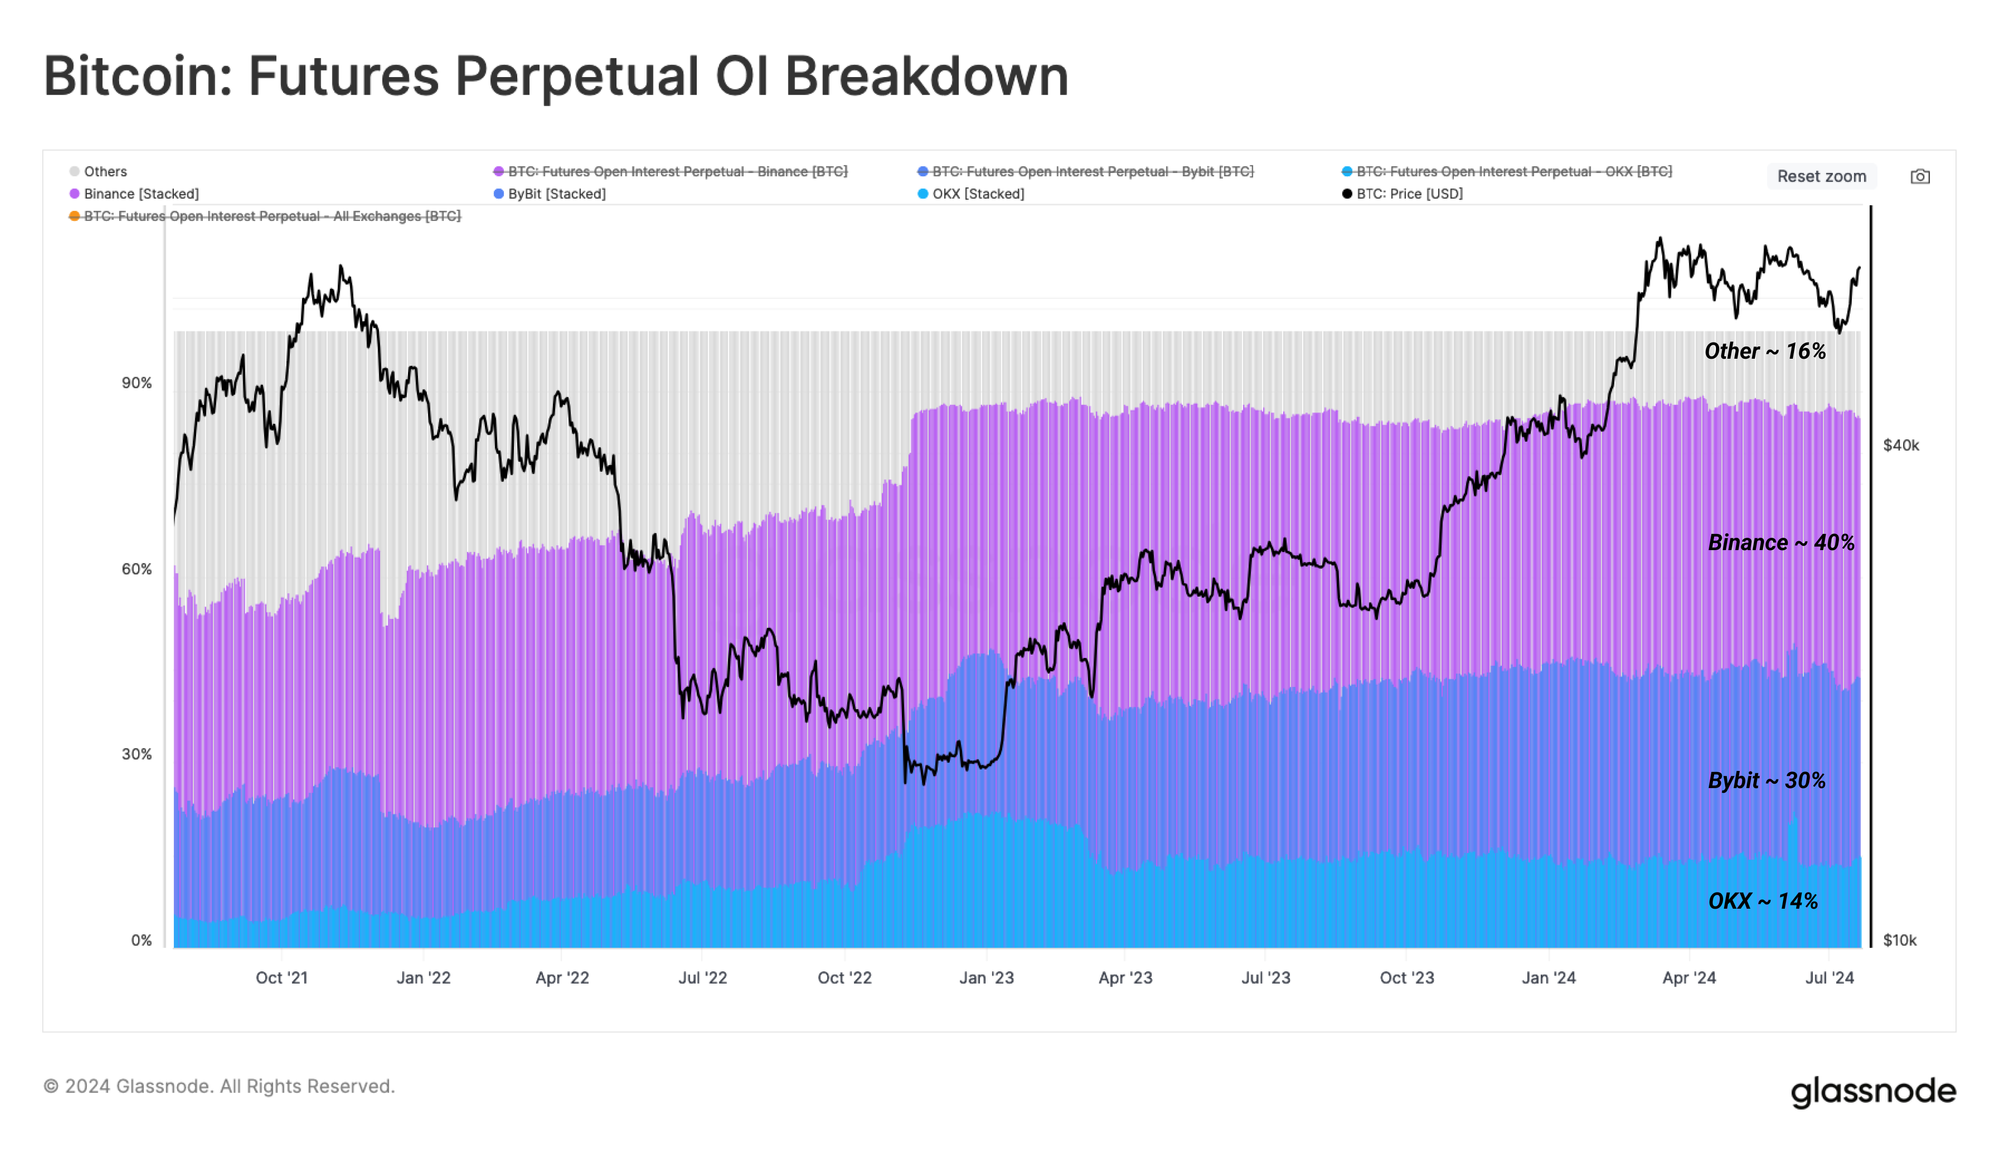
To better understand the mechanics of the perpetual markets, we have measured the share of the top three exchanges by open interest.
As shown below, Binance, Bybit and OKX comprise around 84% of the market share, and will therefore, focus on metrics related to these exchanges for our analysis.
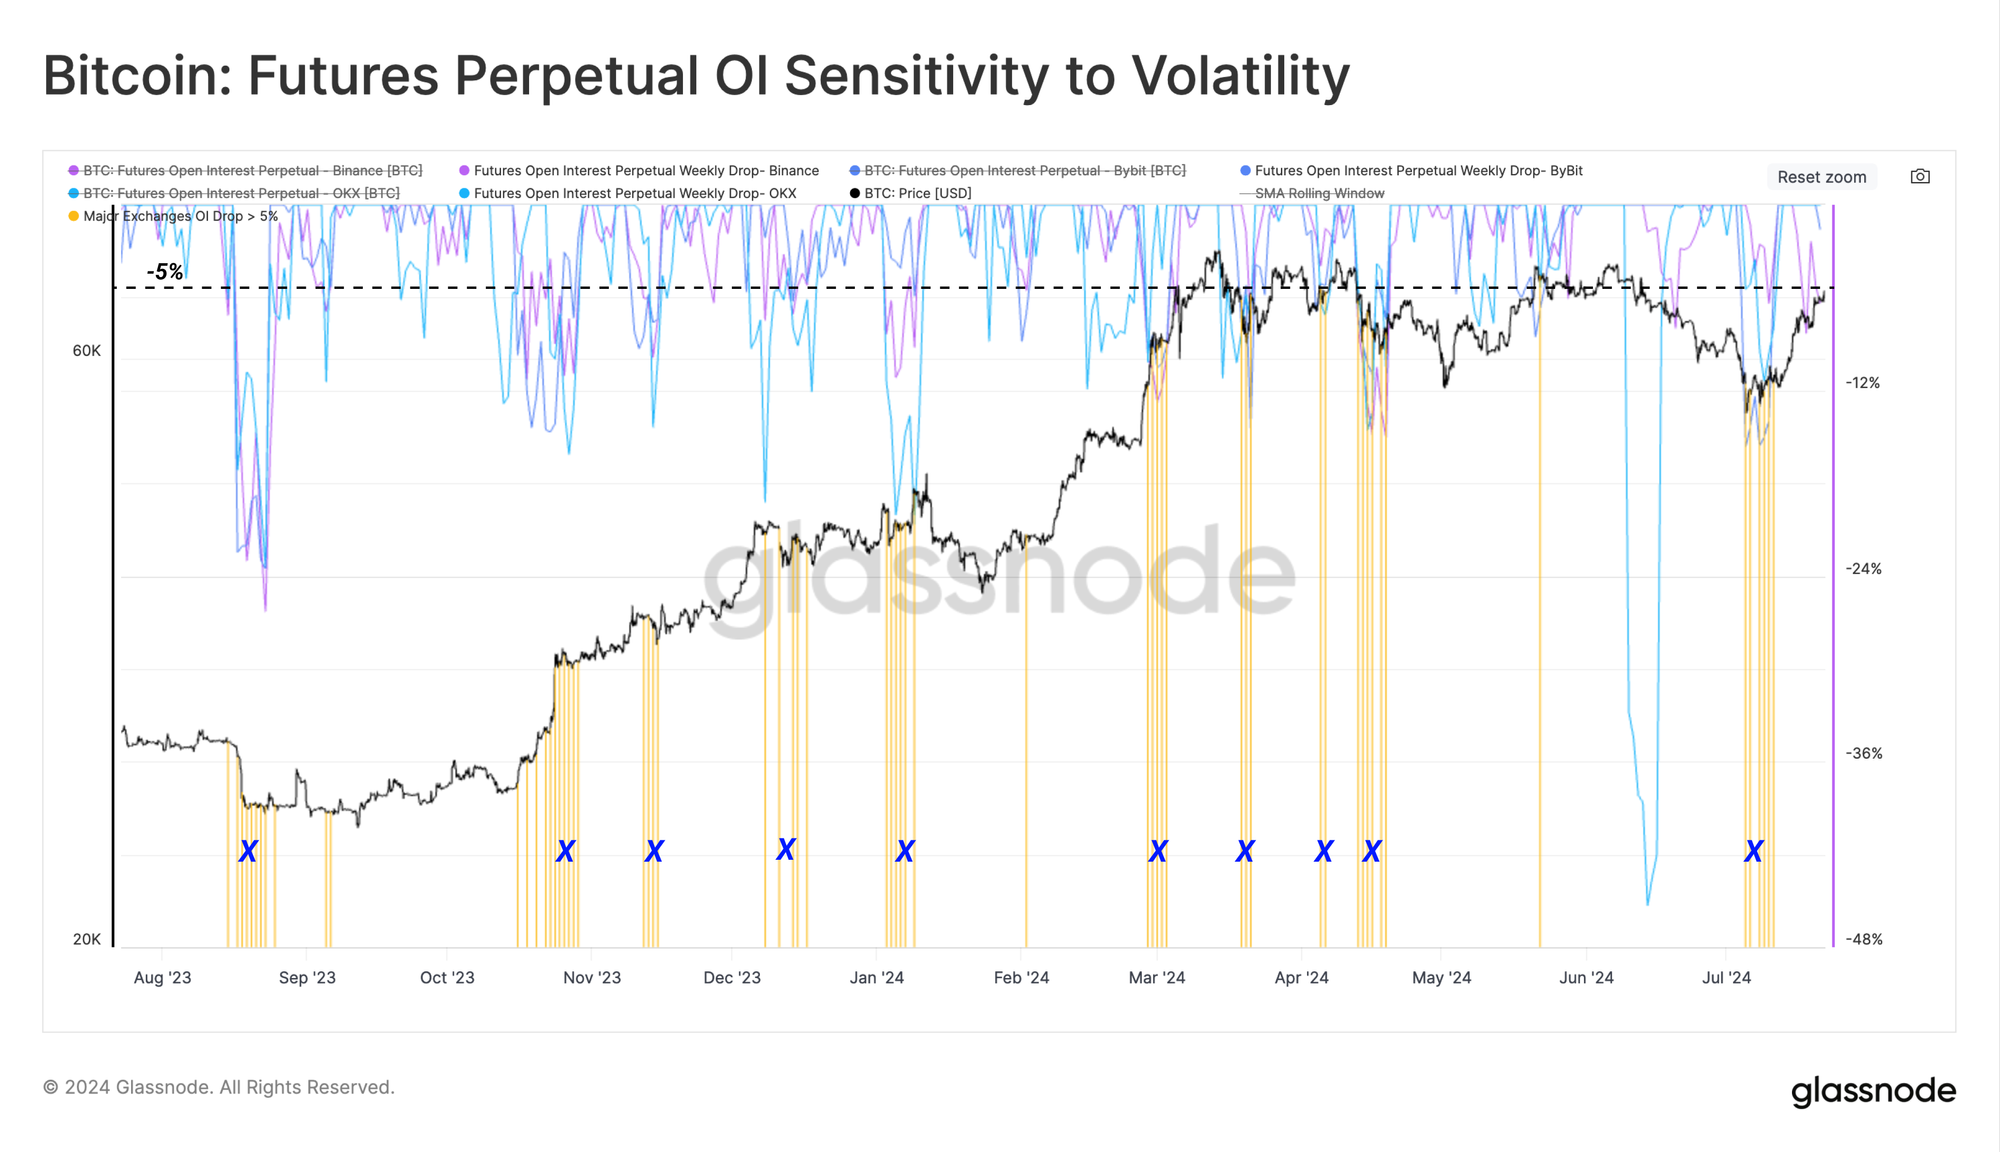
A pivot point in the perpetual market usually involves a considerable reduction in open interest, often a direct result of margin call liquidations of traders holding highly leveraged positions.
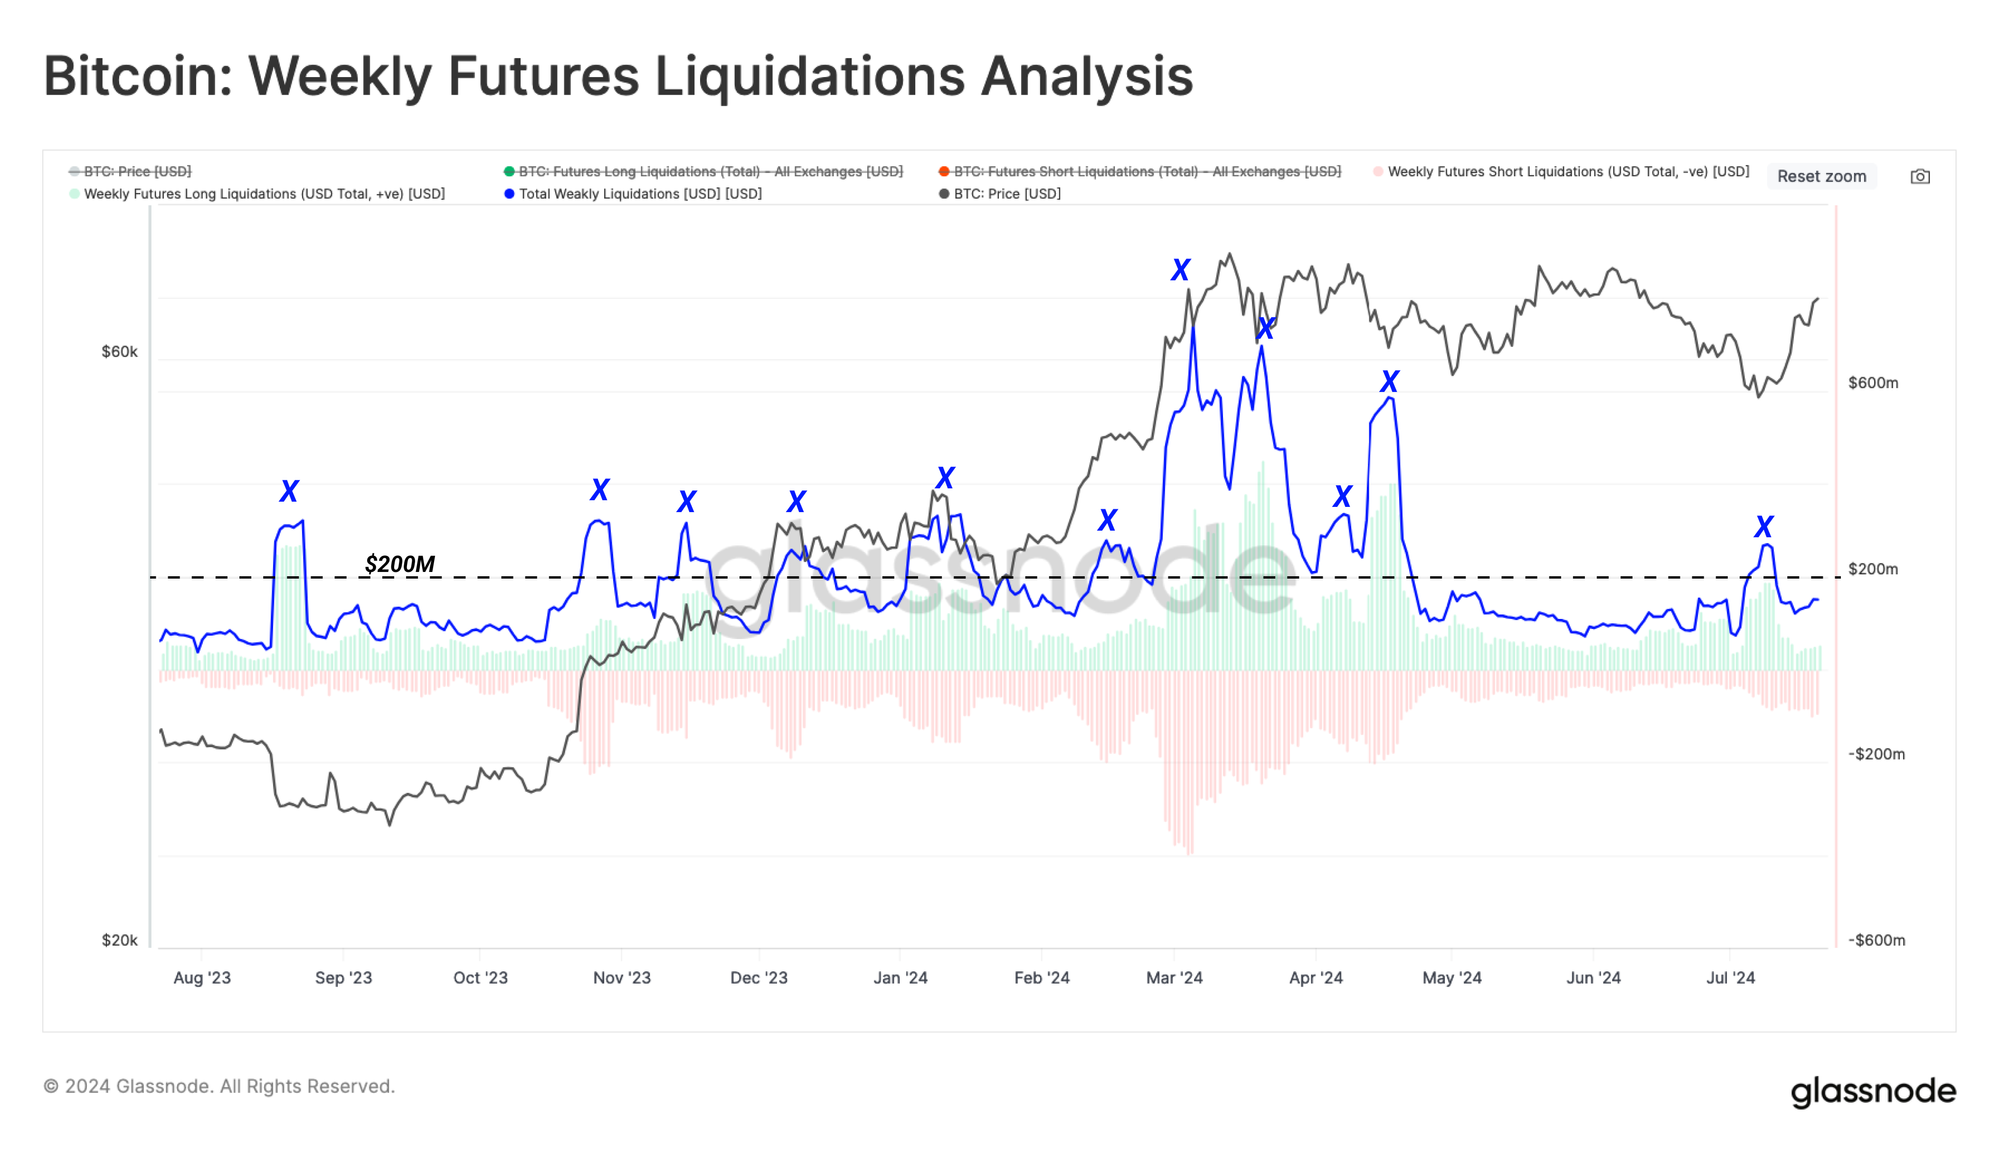
The chart below highlights periods where open Interest of the top three exchanges dropped more than 5% over a weekly period. Over the last 12 months, we have encountered ten of these perpetual futures flush-out events.
To assess the size of contracts forcefully closed, we measure the total liquidation volume during these deleveraging events. The chart below shows that the overall liquidation volume (both long and short) surged above the typical bull market baseline of $200M/day. This demonstrates the role of margin call liquidations in the open interest decline noted in the chart above.
Directional Bias
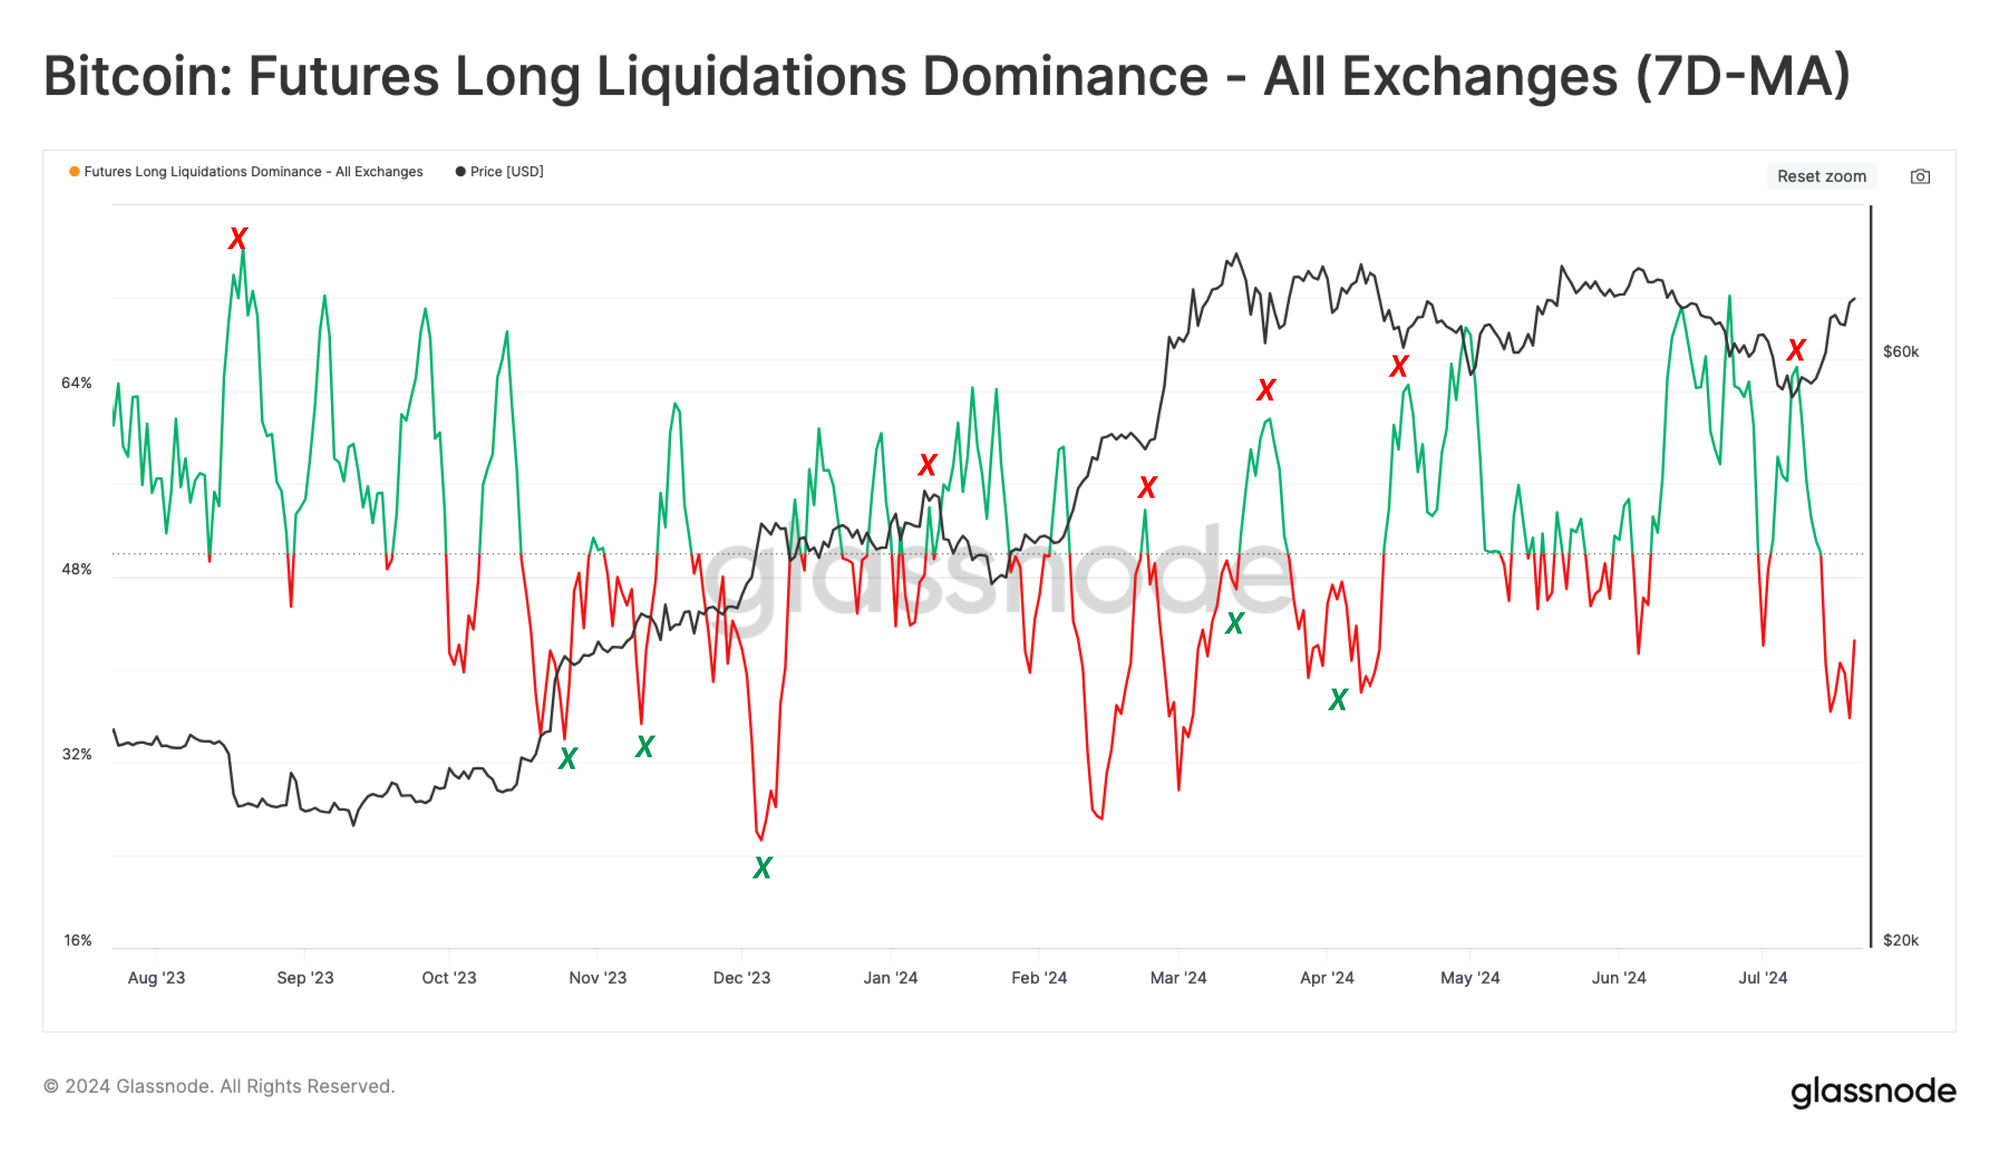
During market turmoil, deleveraging events can occur when the market moves in either direction. However, in this instance, we are exclusively isolating for potential pivot points during the bull market corrections and have therefore segregated the liquidations into two subsets:
- 🟢 Long-Dominant Liquidations where more than 50% of liquidated positions were on the long side of the contract
- 🔴 Short-Dominant Liquidations where more than 50% of liquidated positions were on the short side of the contract
During the recent sell-off to $55k, we can see an ideal long liquidation candidate pivot point was recorded. Here, over-leveraged long positions were liquidated, which led to a sharp decline in open interest across the top three perpetual futures exchanges.
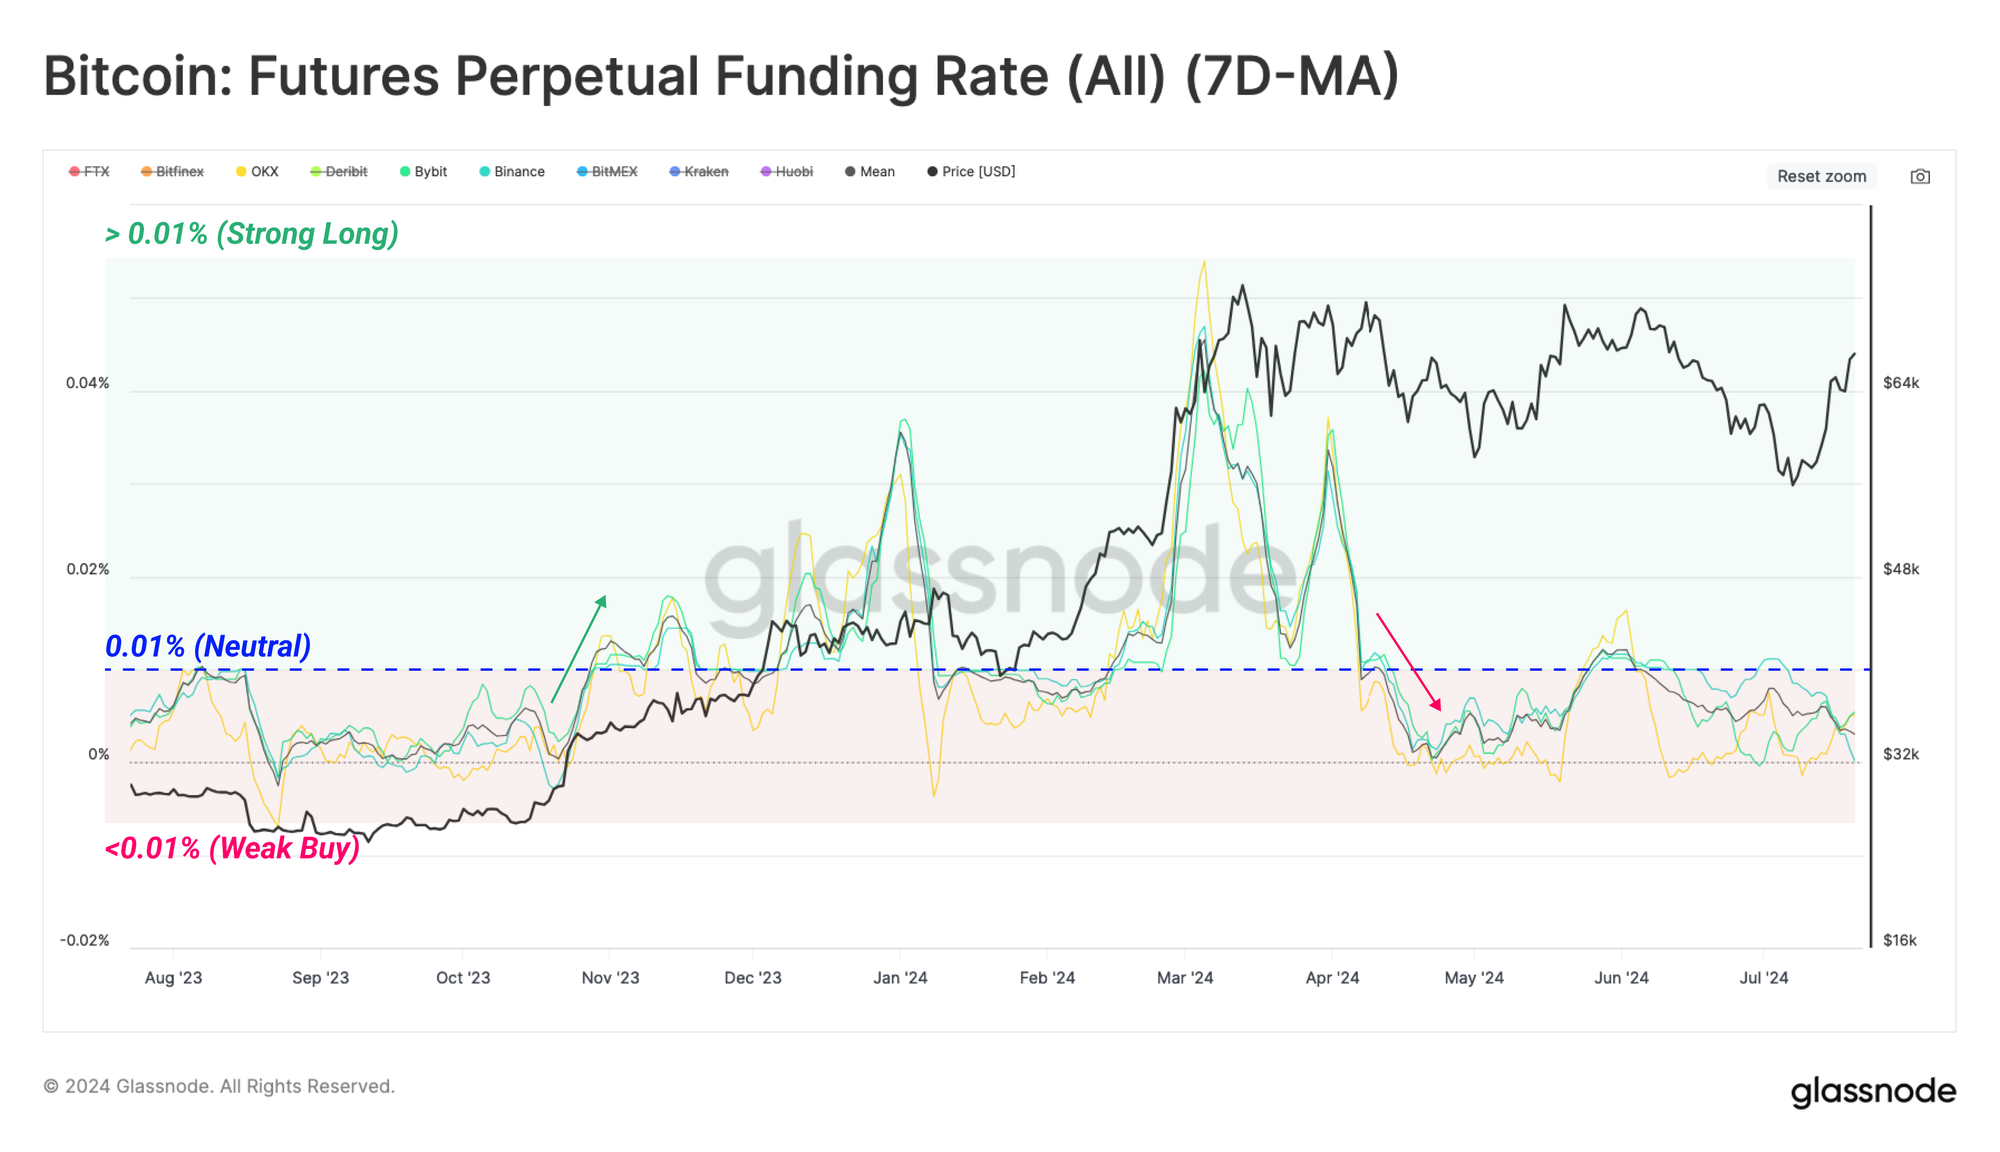
Next, we can establish a framework to spot these pivot points using the perpetual funding rate. This approach utilizes the 7-day moving average of funding rates across the top three exchanges.
This is an extremely insightful metric which provides information on the directional bias of positions within perpetual markets. When the weekly average of the funding rate is above the neutral level (0.01% per 8 hours), it suggests there is a large demand from market takers to open a long position.
After setting the current ATH at $73k in March 2024, there has been waning demand for long positions across perpetual markets. Alongside this, the second attempt at rallying above $73k in May saw sentiment briefly switch to positive. However, the overall sentiment regime has remained neutral to negative since then.
The latest rally from the $54k region has been a great example of over-leveraged long positions being liquidated near the local lows. Funding rates residing below the 0.01% neutral level suggest that there has not been a rush for new long positions to open since the July low was established.
Short-Term Profitability Improves
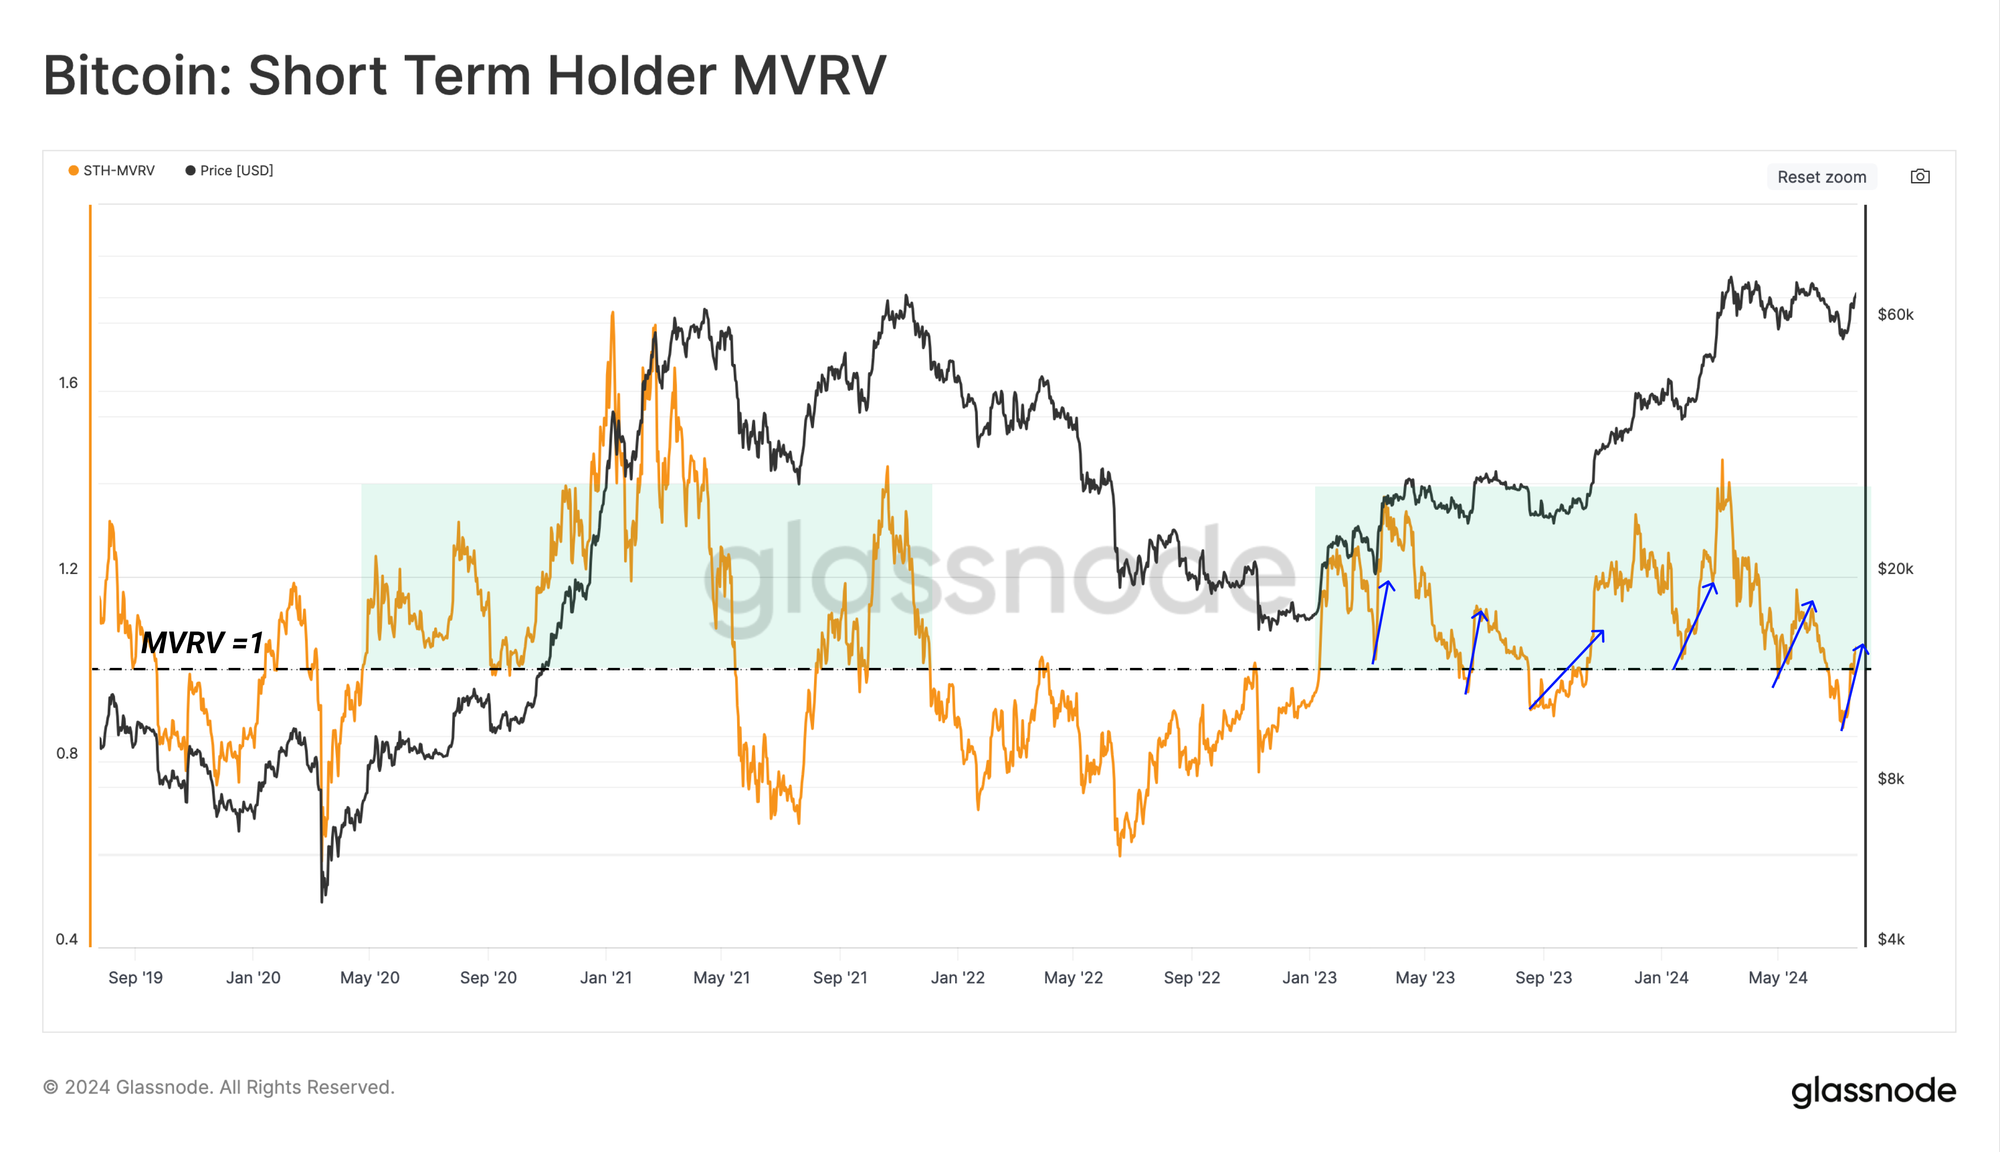
The recent price surge has also been a welcome relief for Bitcoin Short-Term Holders (STHs), a proxy for new demand and recent buyers. This cohort saw over 90% of their supply fall into a loss in late July, putting them into a financially stressful position.
This rally has now broken back above the STH cost basis and returned 75% of their held supply to an unrealized profit. This can be seen within the STH-MVRV metric, which has now recovered above the break-even level of 1.0.
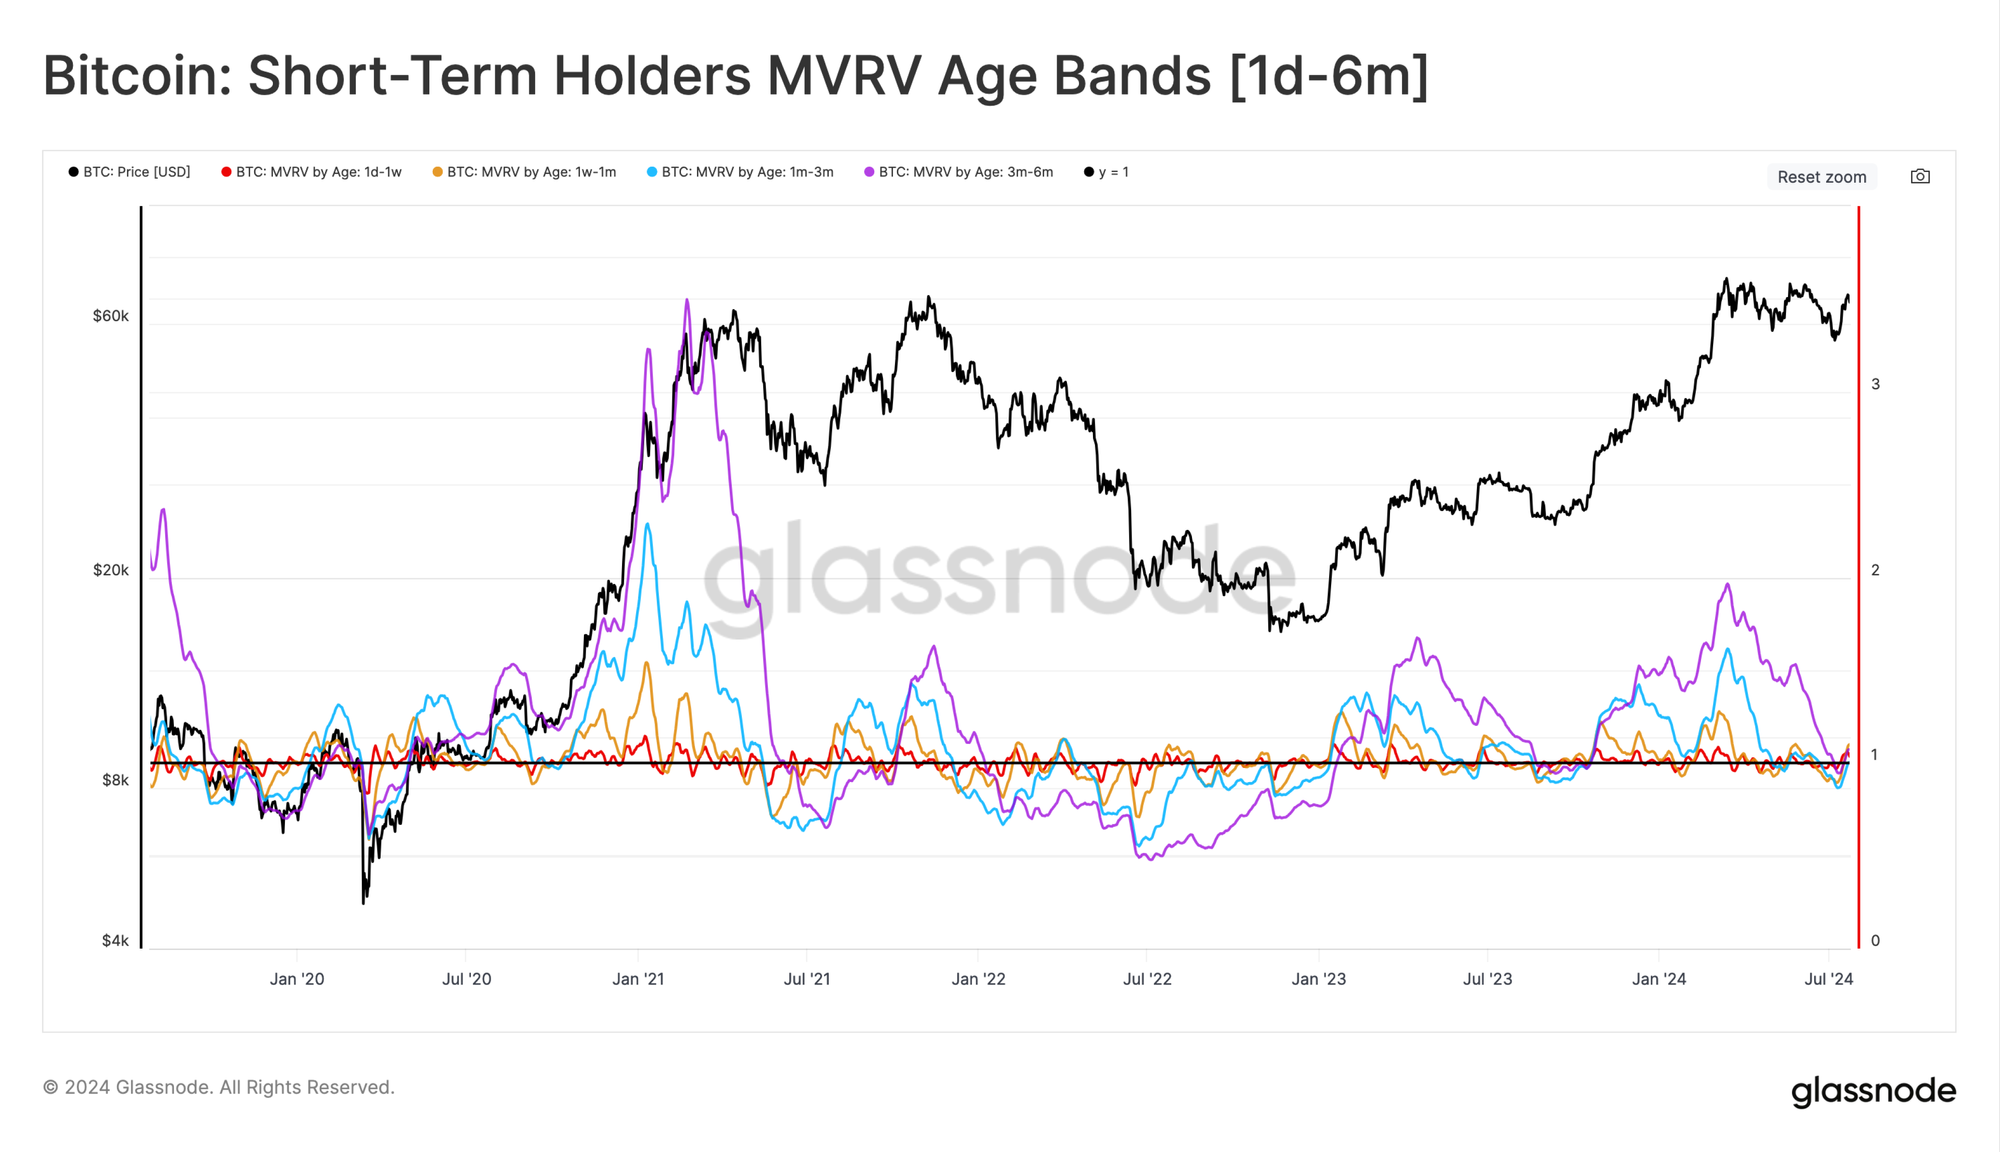
We can increase the granularity of this assessment by inspecting the individual age breakdowns of the Short-Term Holder MVRV metric. We can use this lens to see how profitability has changed across sub-groups of recent buyers. The ages we analyze range from very recent buyers (1-day to 1-week), right through to those on the brink of transitioning into Long-term Holder status (3 to 6-months).
- 🔴 1d-1w MVRV: 1.05
- 🟠 1w-1m MVRV: 1.1
- 🔵 1m-3m MVRV: 1.0
- 🟣 3m-6m MVRV: 1.07
At present, all constituents of the Short-Term Holder cohort have returned to positive profitability, which highlights the strength of the prevailing uptrend. This is likely to be positive for overall investor sentiment.
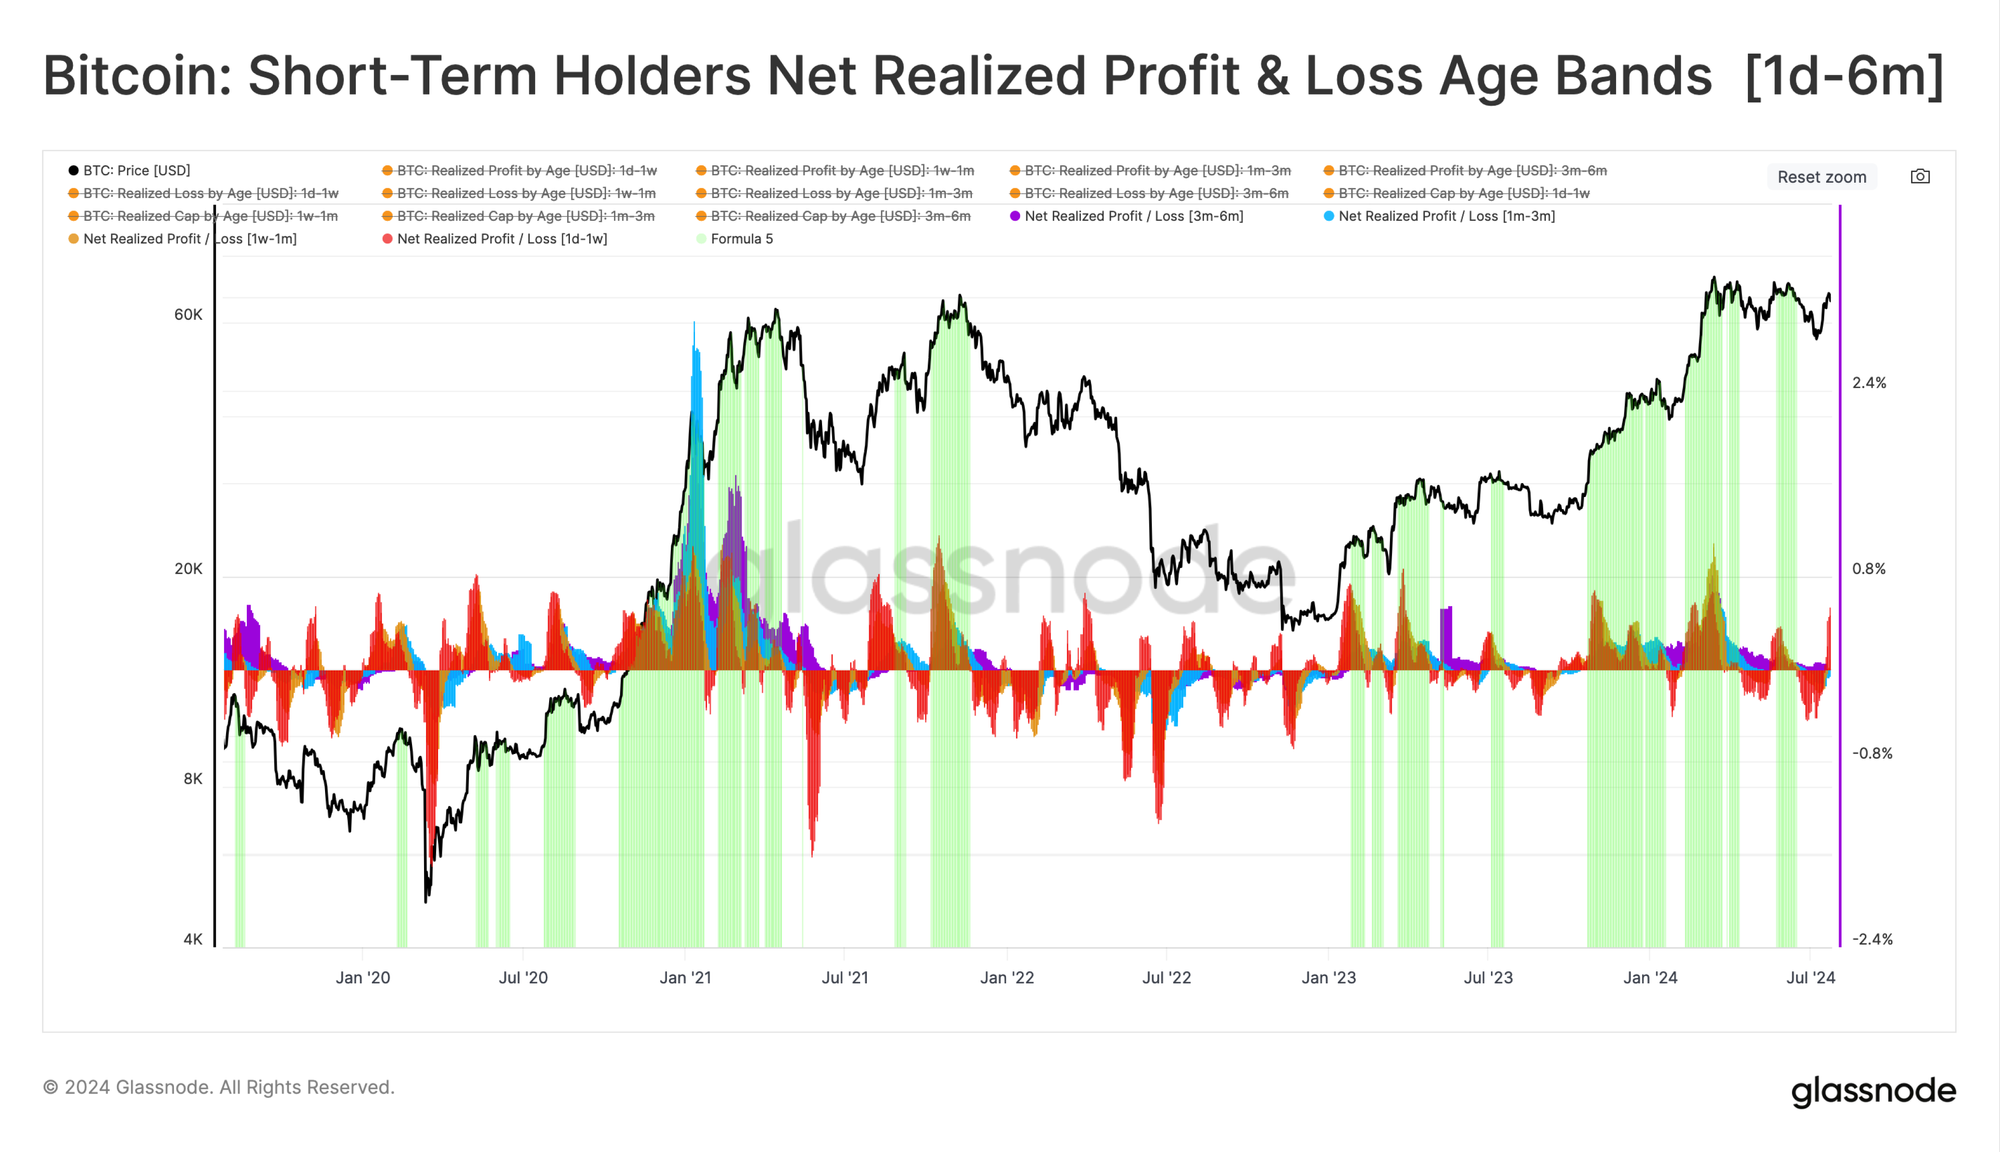
Finally, we can evaluate the net realized profit/loss for each sub-cohort, which can be considered a measure of net capital flows. This metric also shows signs of constructive improvement, with most age constituents experiencing a positive capital flow, with the only exception being bar the 1m-3m cohort.
This 1m-3m cohort has carried the brunt of the recent range-bound and downside price action and is also one of the larger age bands in this study.
Summary and Conclusions
Perpetual futures markets are the most liquid and deep instruments within the digital asset markets, making them a valuable market information source. As BTC prices traded down into the $53k region, it resulted in a meaningful deleveraging event, as many long-biased traders were liquidated near the lows.
The recovery price bounce has also been very strong, returning a majority of Short-Term Holders to an unrealized profit. This has provided much-needed financial relief and is supported by a period of net positive capital inflows over recent weeks.
Disclaimer: This report does not provide any investment advice. All data is provided for information and educational purposes only. No investment decision shall be based on the information provided here and you are solely responsible for your own investment decisions.
Exchange balances presented are derived from Glassnode’s comprehensive database of address labels, which are amassed through both officially published exchange information and proprietary clustering algorithms. While we strive to ensure the utmost accuracy in representing exchange balances, it is important to note that these figures might not always encapsulate the entirety of an exchange’s reserves, particularly when exchanges refrain from disclosing their official addresses. We urge users to exercise caution and discretion when utilizing these metrics. Glassnode shall not be held responsible for any discrepancies or potential inaccuracies. Please read our Transparency Notice when using exchange data.
- Join our Telegram channel
- For on-chain metrics, dashboards, and alerts, visit Glassnode Studio
- For automated alerts on core on-chain metrics and activity on exchanges, visit our Glassnode Alerts Twitter