Investor Confidence Slides
With almost all Short-Term Holders now underwater on their position, sentiment has shifted towards the negative. In this report, we explore several measures to track investor sentiment. We develop indicators which assess divergences between the market and observed investor behavior.


Executive Summary
- We review the market position relative to two on-chain pricing models, both of which are intersected during past cycle lows, and in the March 2020 sell-off.
- Patterns of accumulation and distribution tend to align with local highs and lows, and we demonstrate how this plays out in on-chain data.
- A super-majority of Short-Term Holders are now underwater on their position, with a new indicator suggesting negative sentiment dominates this cohort at present.
Finding Floors
The Bitcoin market continues to languish around $26k, after prices failed to hold above the cycle midpoint level at around $31.4k. Both attempts in April and July effectively set a double top pattern in prices. Amongst other indicators related to Short-Term Holders covered last week (WoC 37), this may suggest the market is experiencing an early stage shift in market psychology and confidence.
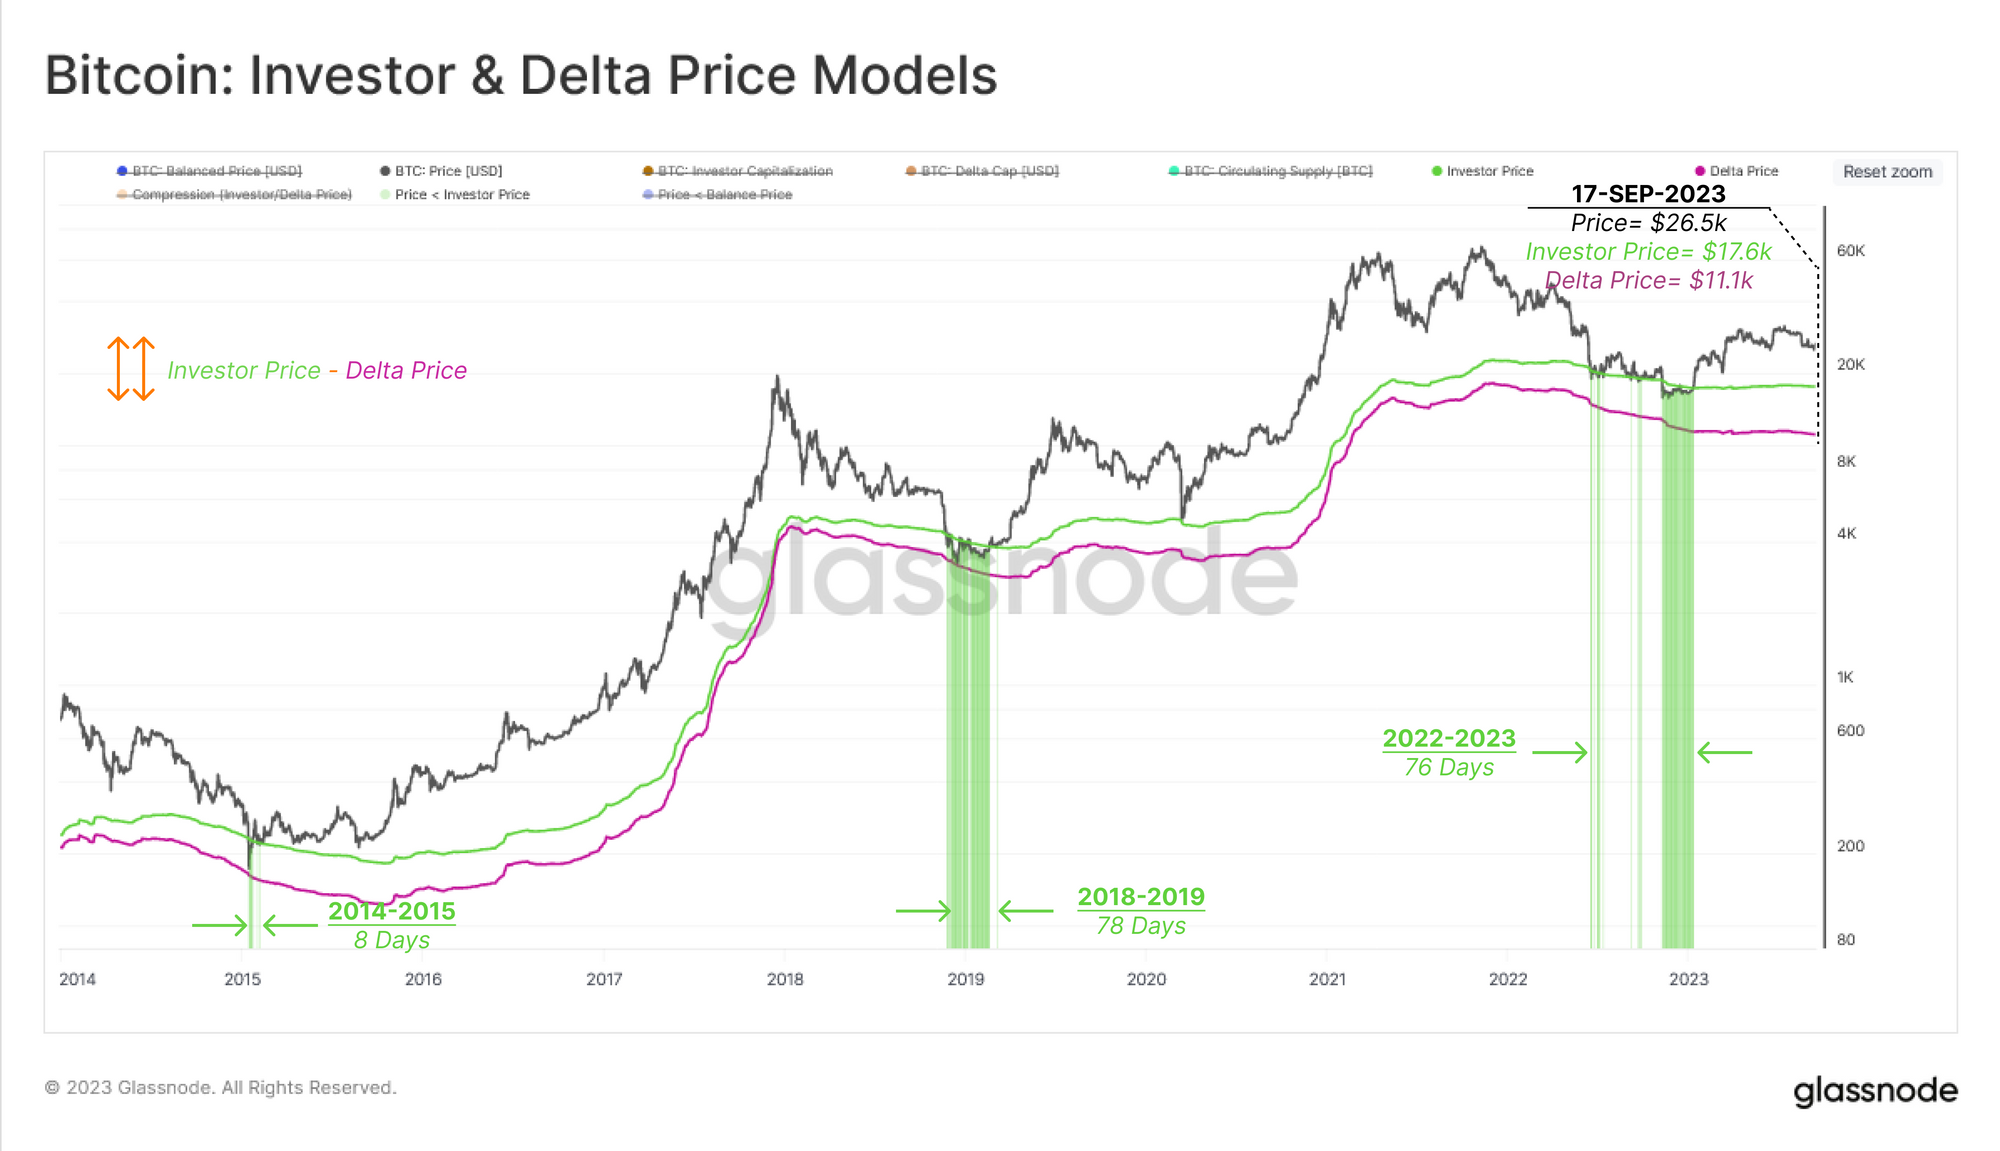
The chart below presents two pricing models:
- 🟢 Investor Price ($17.6k) which reflects the average acquisition price for all coins excluding those acquired by miners (i.e. in secondary markets).
- 🟣 Delta Price ($11.1k) which is a combined on-chain and technical pricing model, often used to model cycle floors.
Price action across both the 2018-19 and 2022-23 cycles spent a similar amount of time trading within the bounds of these price models at the lows. Of note is that the market revisited the Investor Price level during the chaos of the March 2020 sell-off.
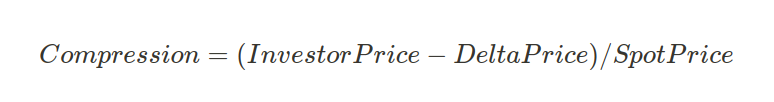
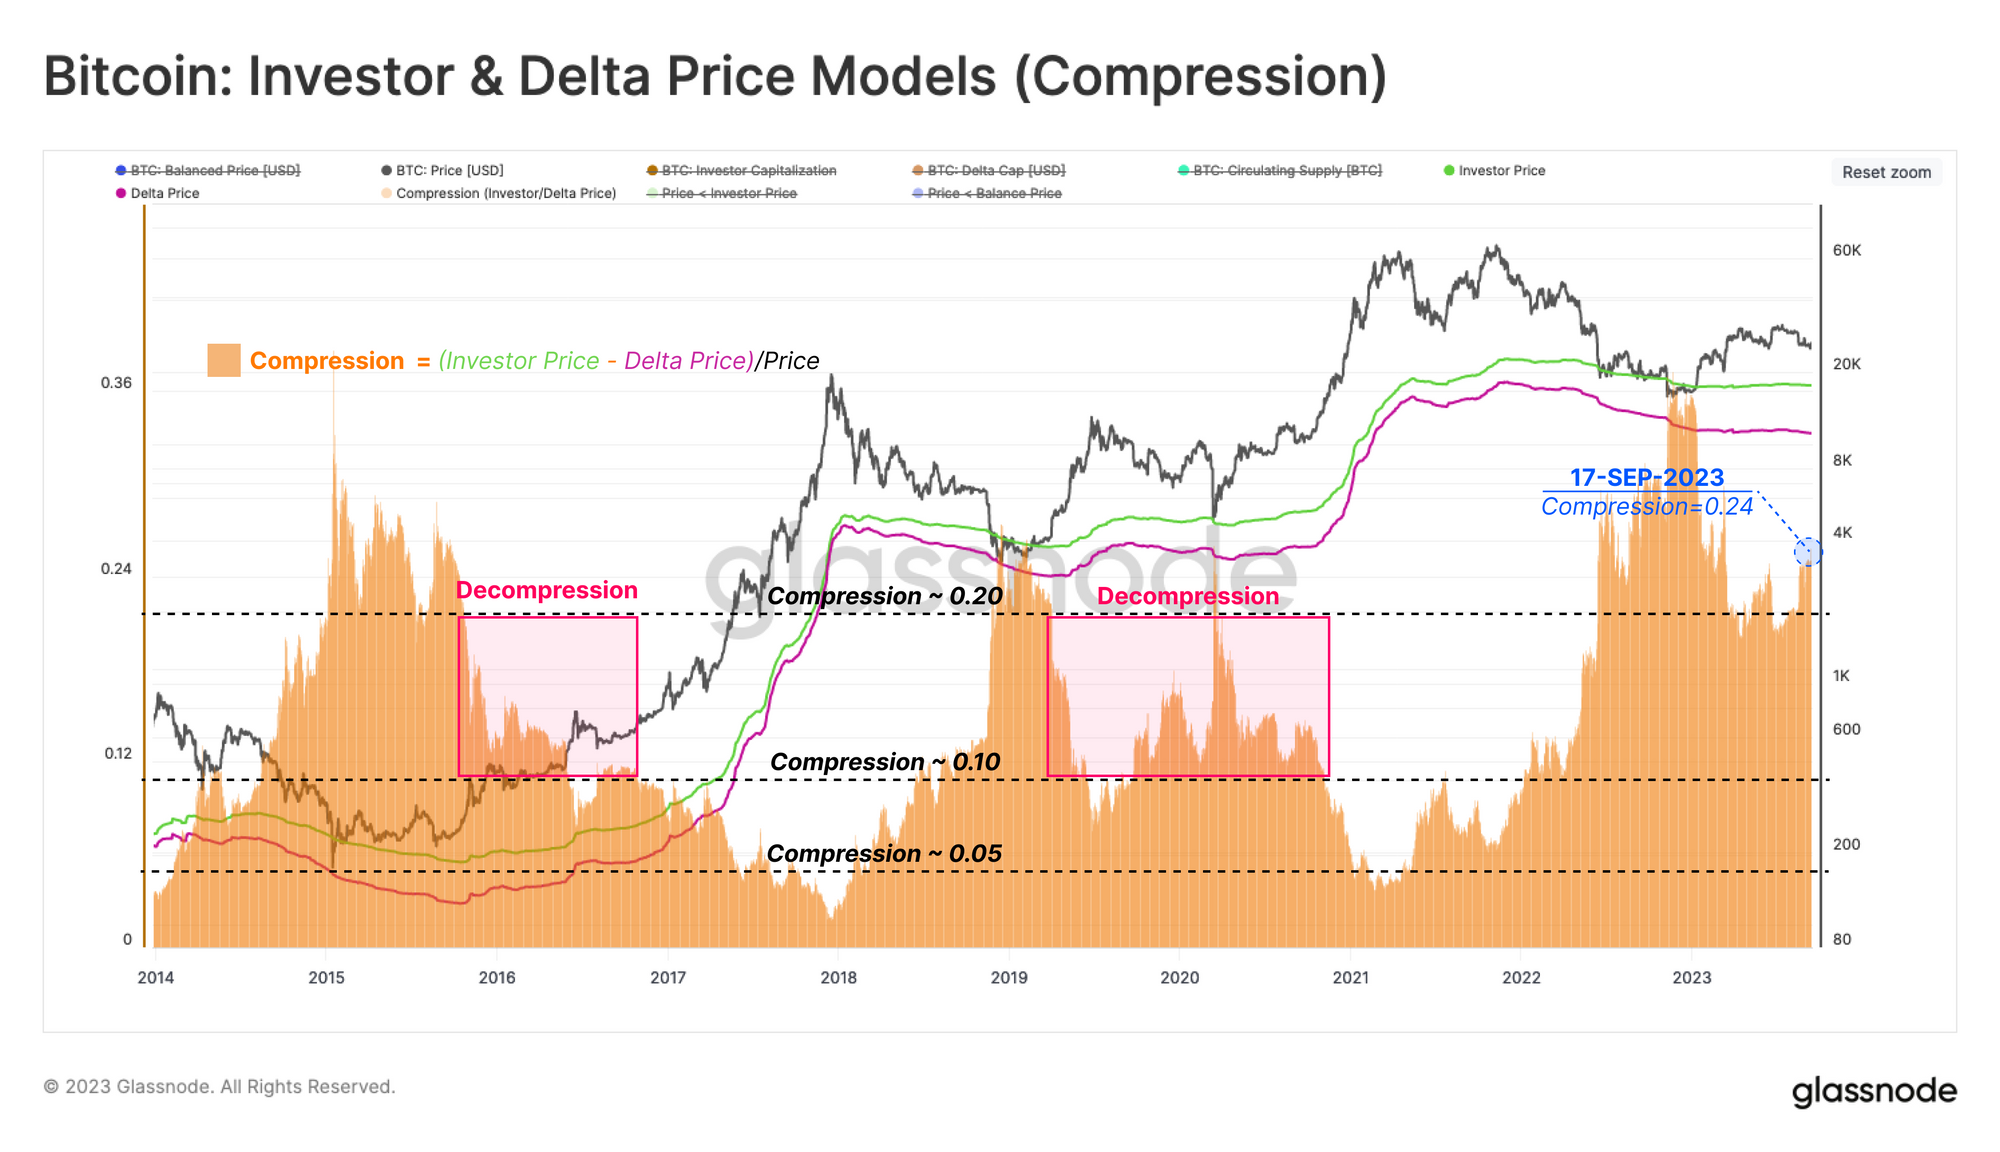
In addition to the duration spent between these models, we can also measure the compression and expansion between these price models as a gauge for the market recovery. The distance between these models will compress near cycle tops as large volumes of capital flow into the market. Conversely, divergence indicates a softer inflow of capital, where declining prices becomes the driving factor.
This model can be used to monitor the transition from the deepest phase of a bear market back towards a market recovery. From this we can see that the prevailing market structure is similar in nature to the the decompression phase seen in 2016, and also in 2019.
Capital Rotation Cycles
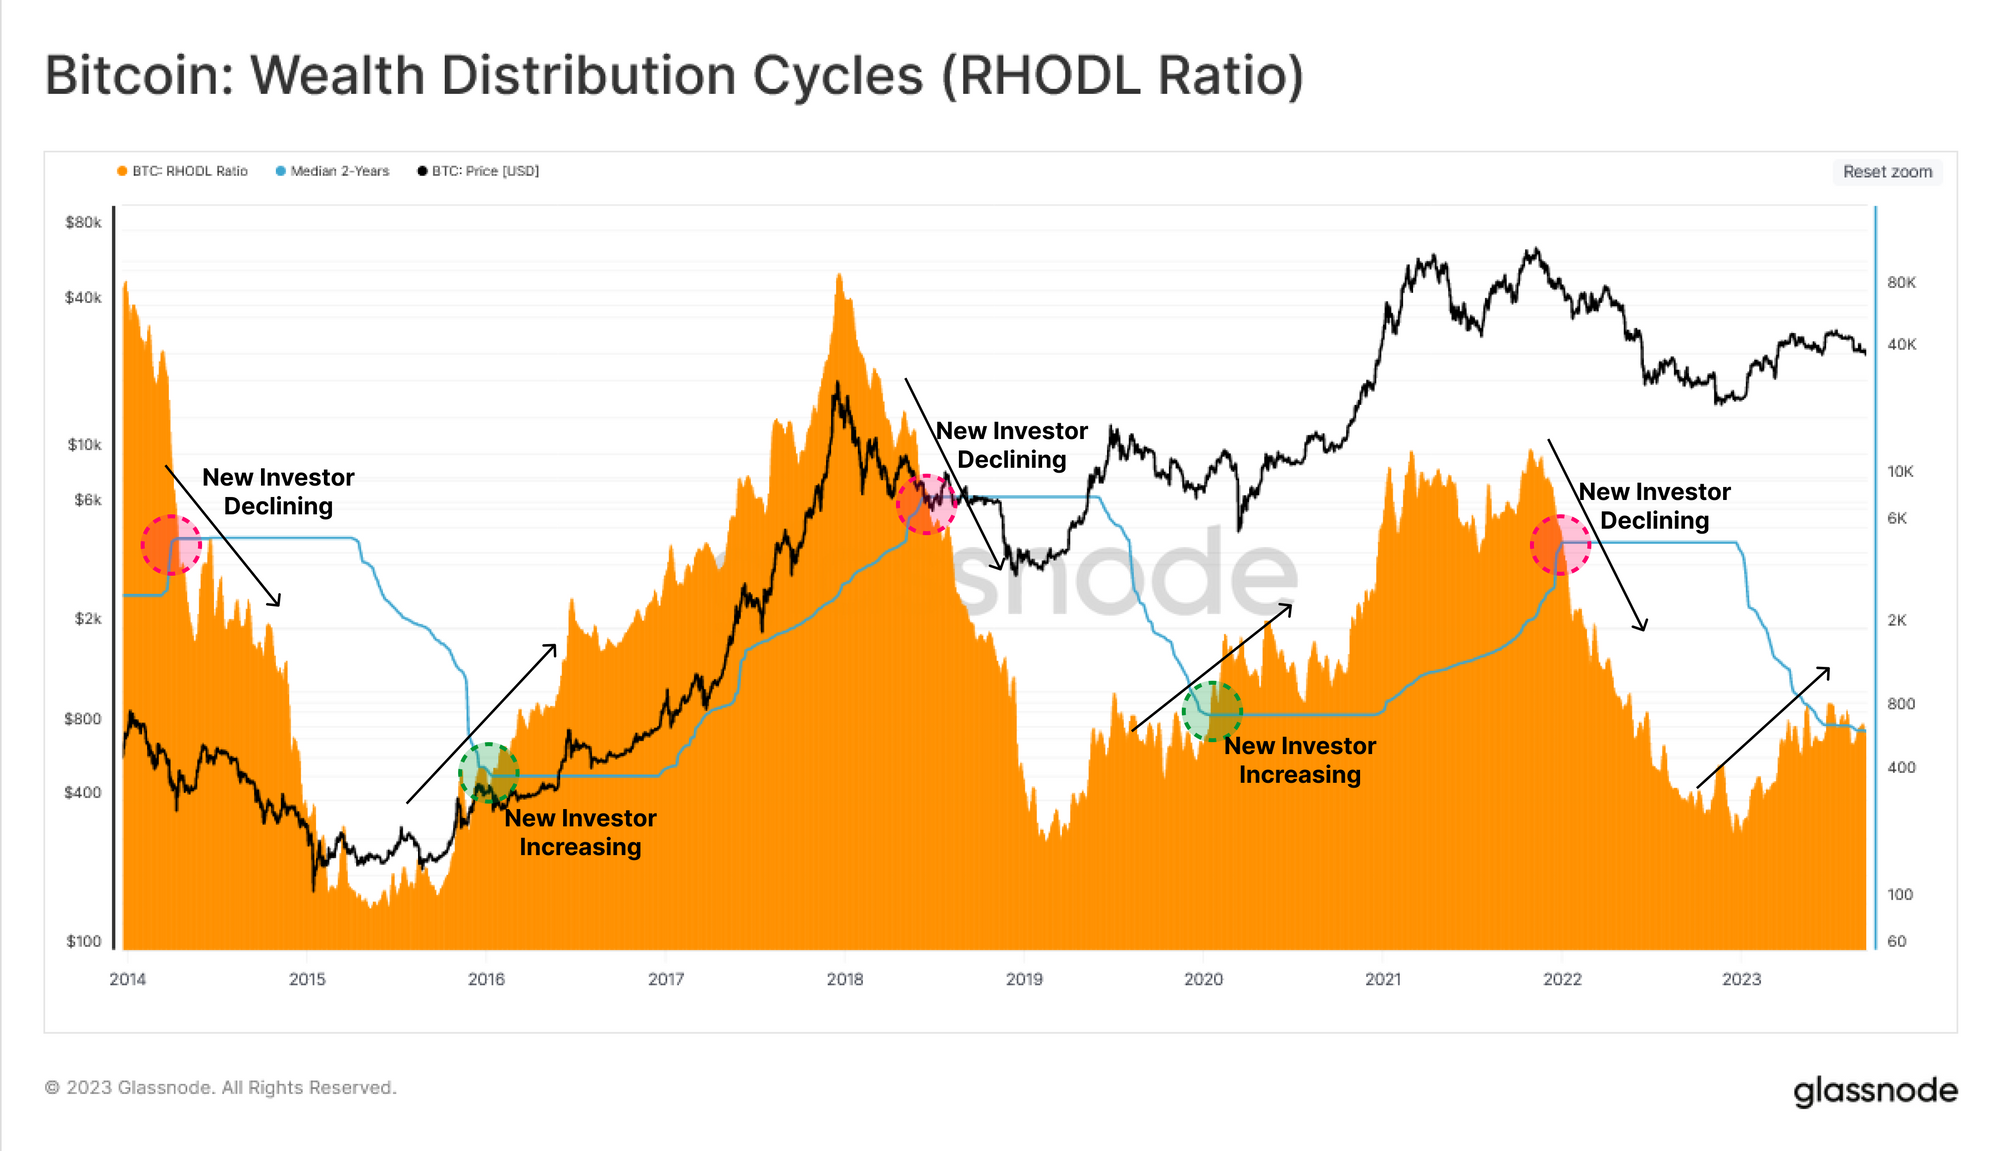
The Realized HODL Ratio (RHODL) is a market indicator that tracks the balance of invested wealth held within recently moved coins (<1-week) and more mature HODLers (1-2 years). In the next chart, we have applied a 2-year (half cycle) Median 🔵 as a threshold value for periods where capital flow regimes transition between bull and bear market structure.
We can see that by this measure, 2023 has seen a modest influx of new investors, however, the RHODL Ratio is only just contesting with the 2-year median level. The influx of new investors is positive but relatively weak in momentum.
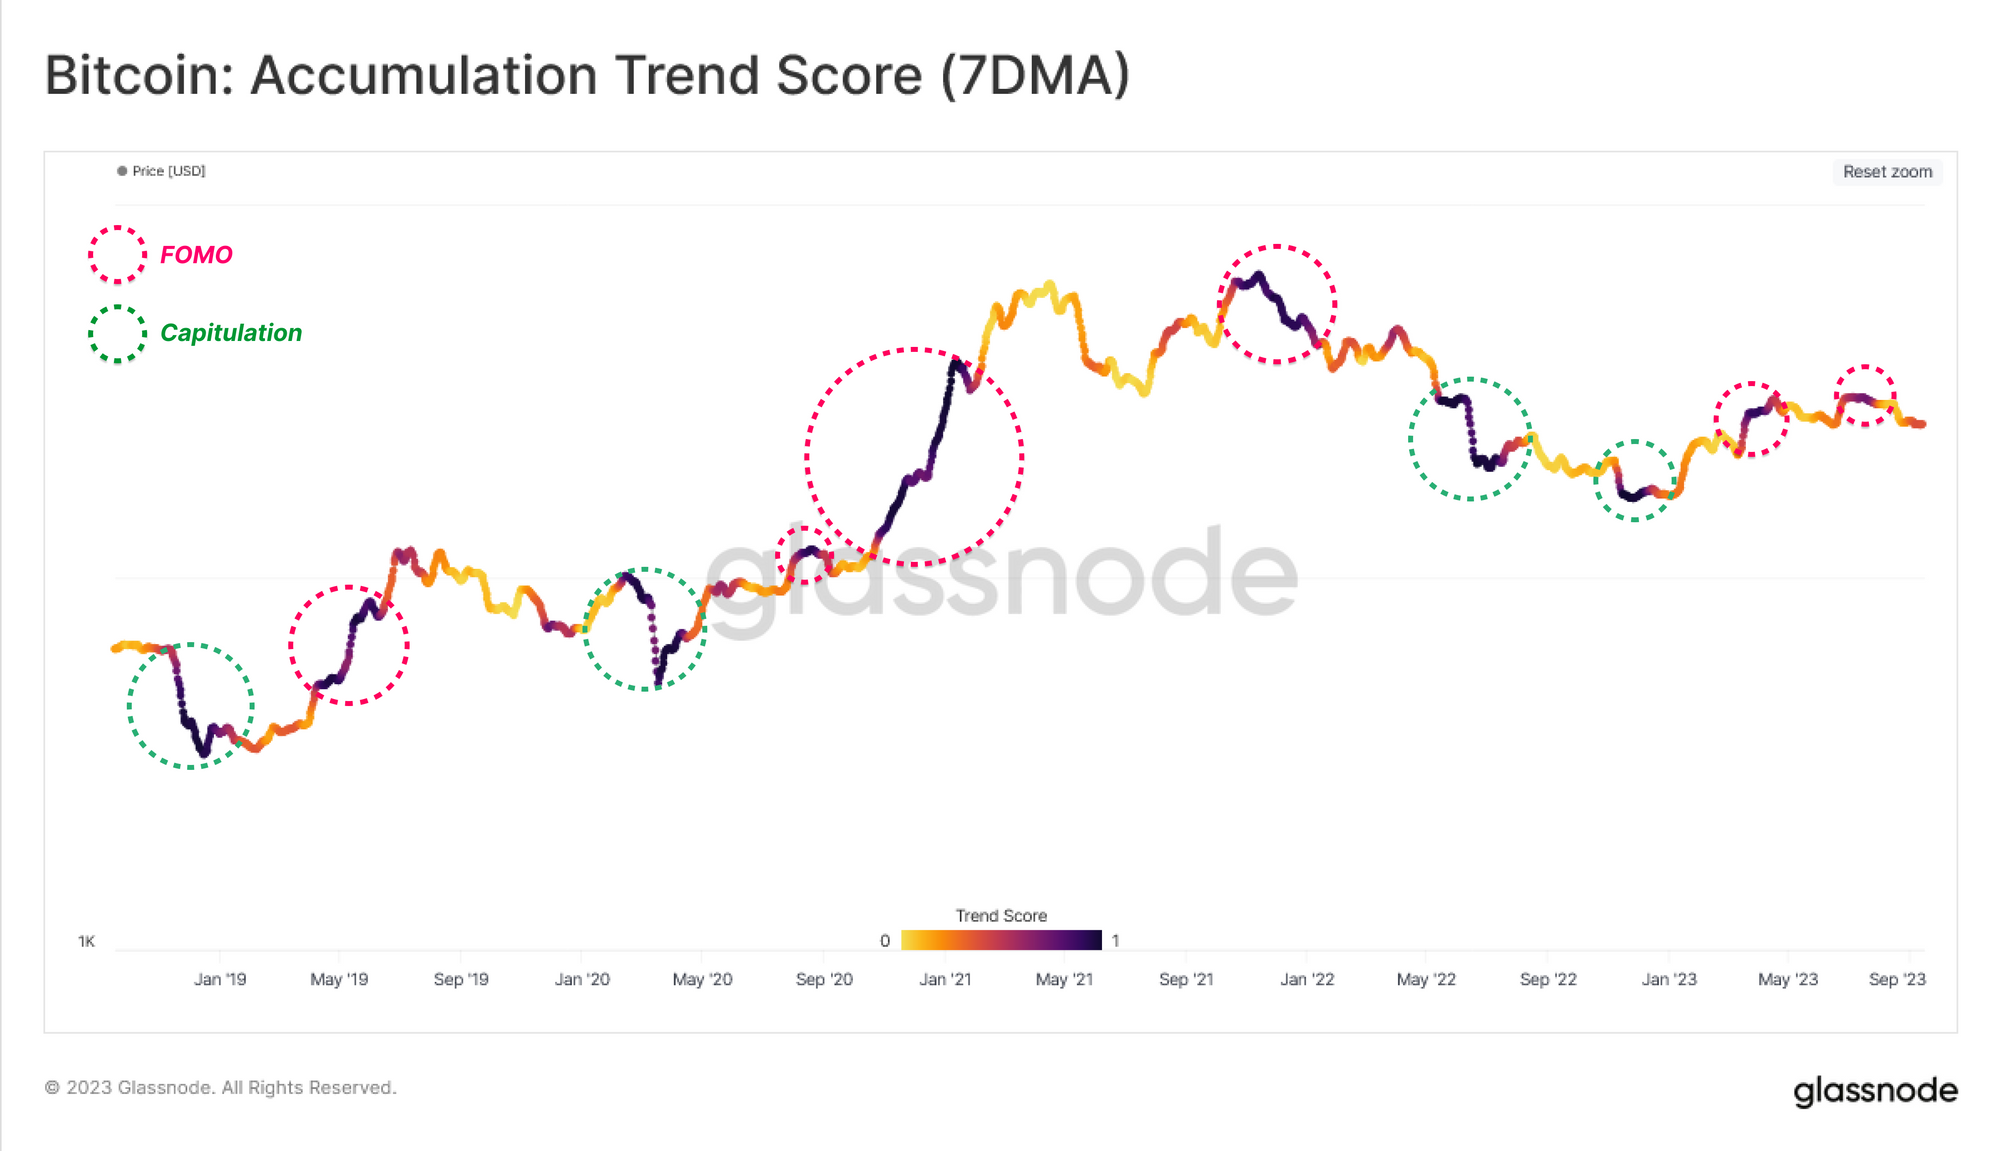
We can also visualize this positive but soft inflow of capital by leveraging the Accumulation Trend Score. This tool reflects the relative balance change of active investors over the past 30 days.
Here we can see that the 2023 recovery rally was fuelled by significant accumulation into the local tops above $30k. This describes a degree of FOMO 🔴 by investors. This is in contrast to capitulation events in the second half of 2022, where new investors seized the opportunity and accumulated at the lows 🟢.
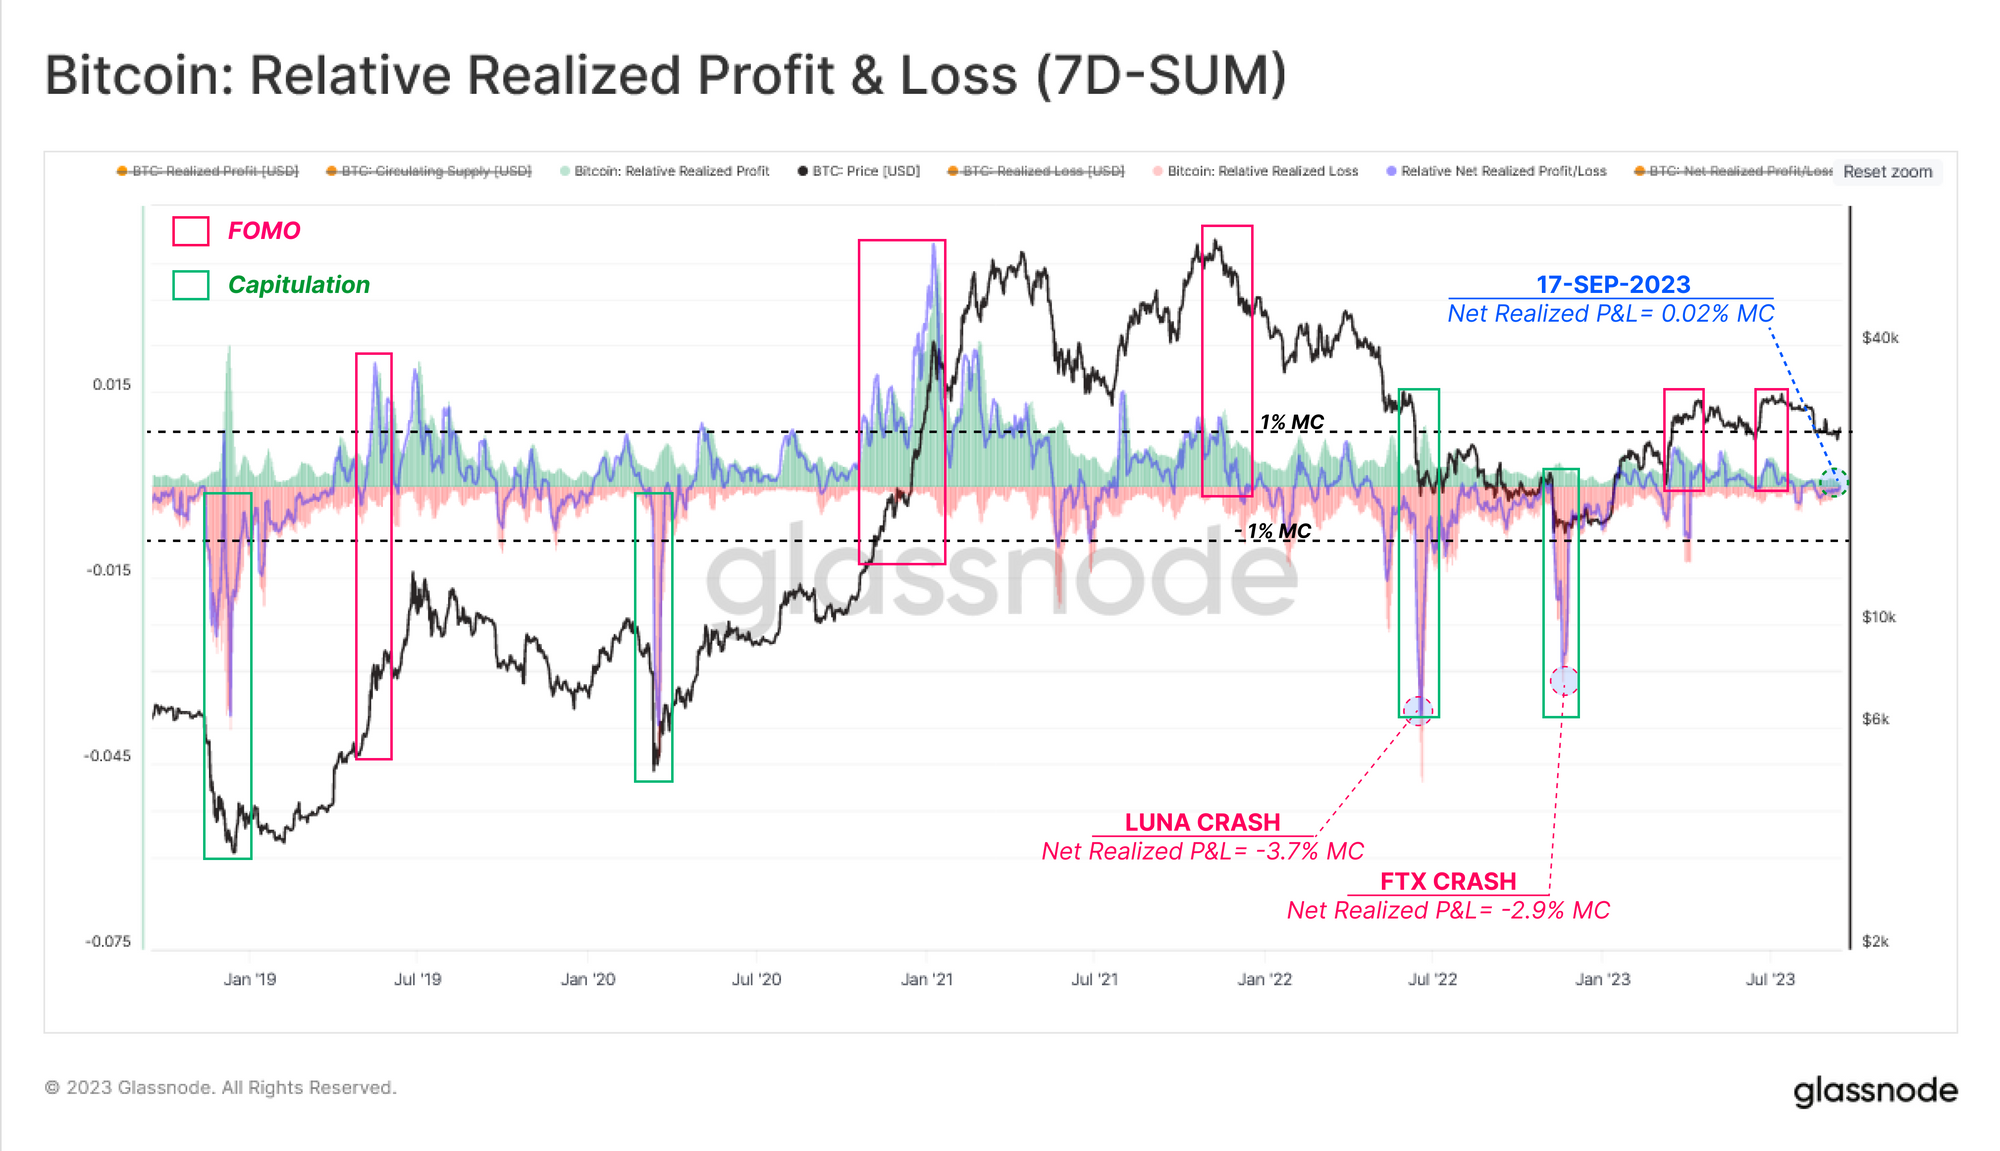
Zooming into this behaviour near recent market tops, we can use the Realized Profit and Loss indicators to assess sudden changes in investor profitability. Realized profit and loss metrics measure the change in the the value of all spent coins, comparing the value at disposal to the value at acquisition. The chart below shows the weekly sum of realized profit 🟩 and loss 🟥, normalized by Market Cap to compare across cycles.
Here, we can see that a confluence emerges between these periods of intense accumulation, and elevated profit-taking. Both were present at the local tops in 2023, and a similar confluence exists at the 2021 market peaks in Jan and Dec.
Underwater Holders
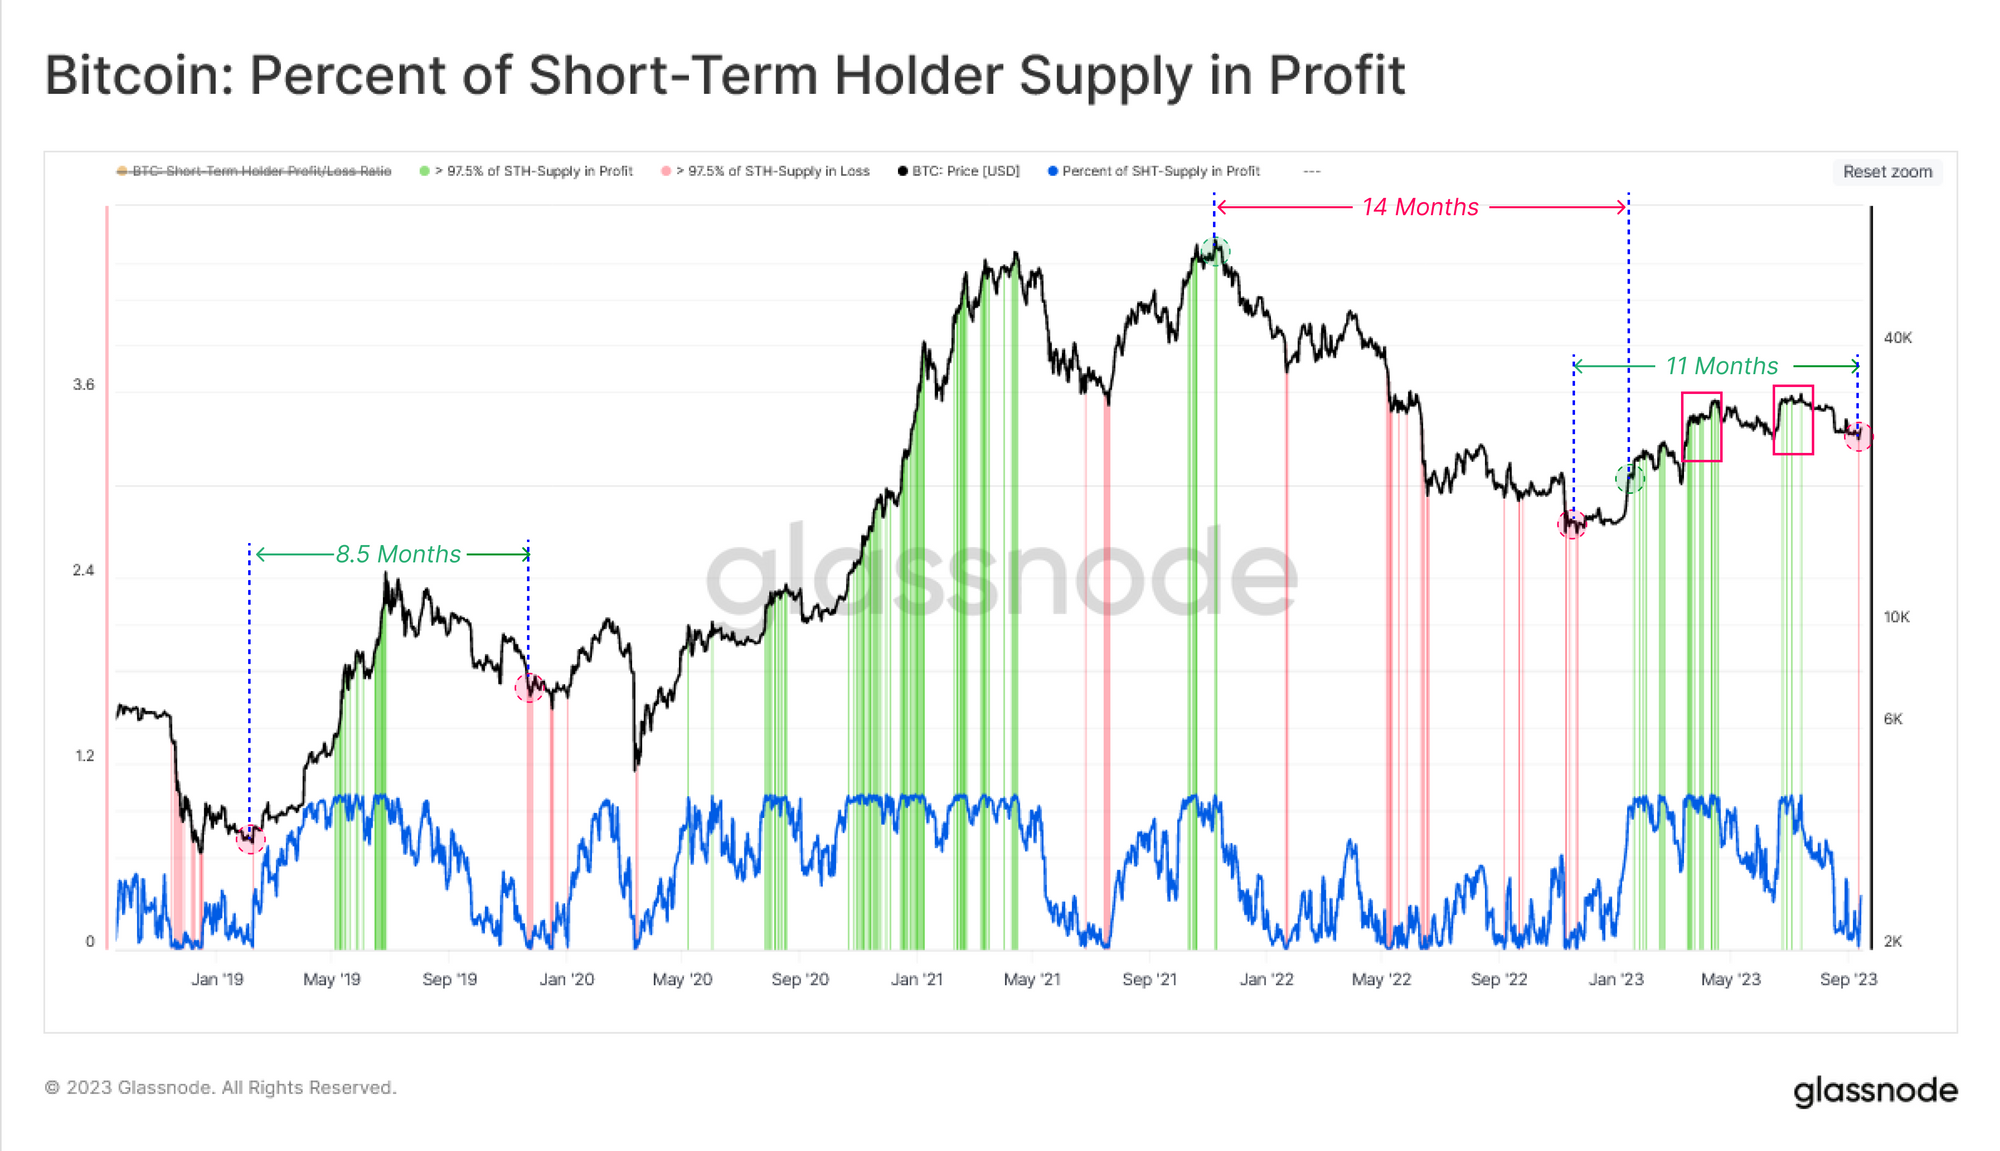
In last week's edition, we reviewed a set of metrics exploring how a significant proportion of Short-Term Holders are now holding coins at a loss, shown below as a percentage of STH Supply in Profit 🔵.
During bear markets, when more than 97.5% of the supply acquired by new investors are at loss 🟥, the chance of seller exhaustion increases exponentially. On the other hand, when more than 97.5% of short-term holder supply is in profit, these players tend to take advantage of the opportunity and exit at break-even or with a profit 🟩.
During the rally above $30k, this metric reached complete profit saturation for the first time since the Nov-2021 all-time high. However, since selling off below $26k in recent weeks, more than 97.5% of STH supply is now held at a loss, being the deepest level since FTX collapsed.
With so many Short-Term Holders now underwater, we can assess their position using two powerful metrics:
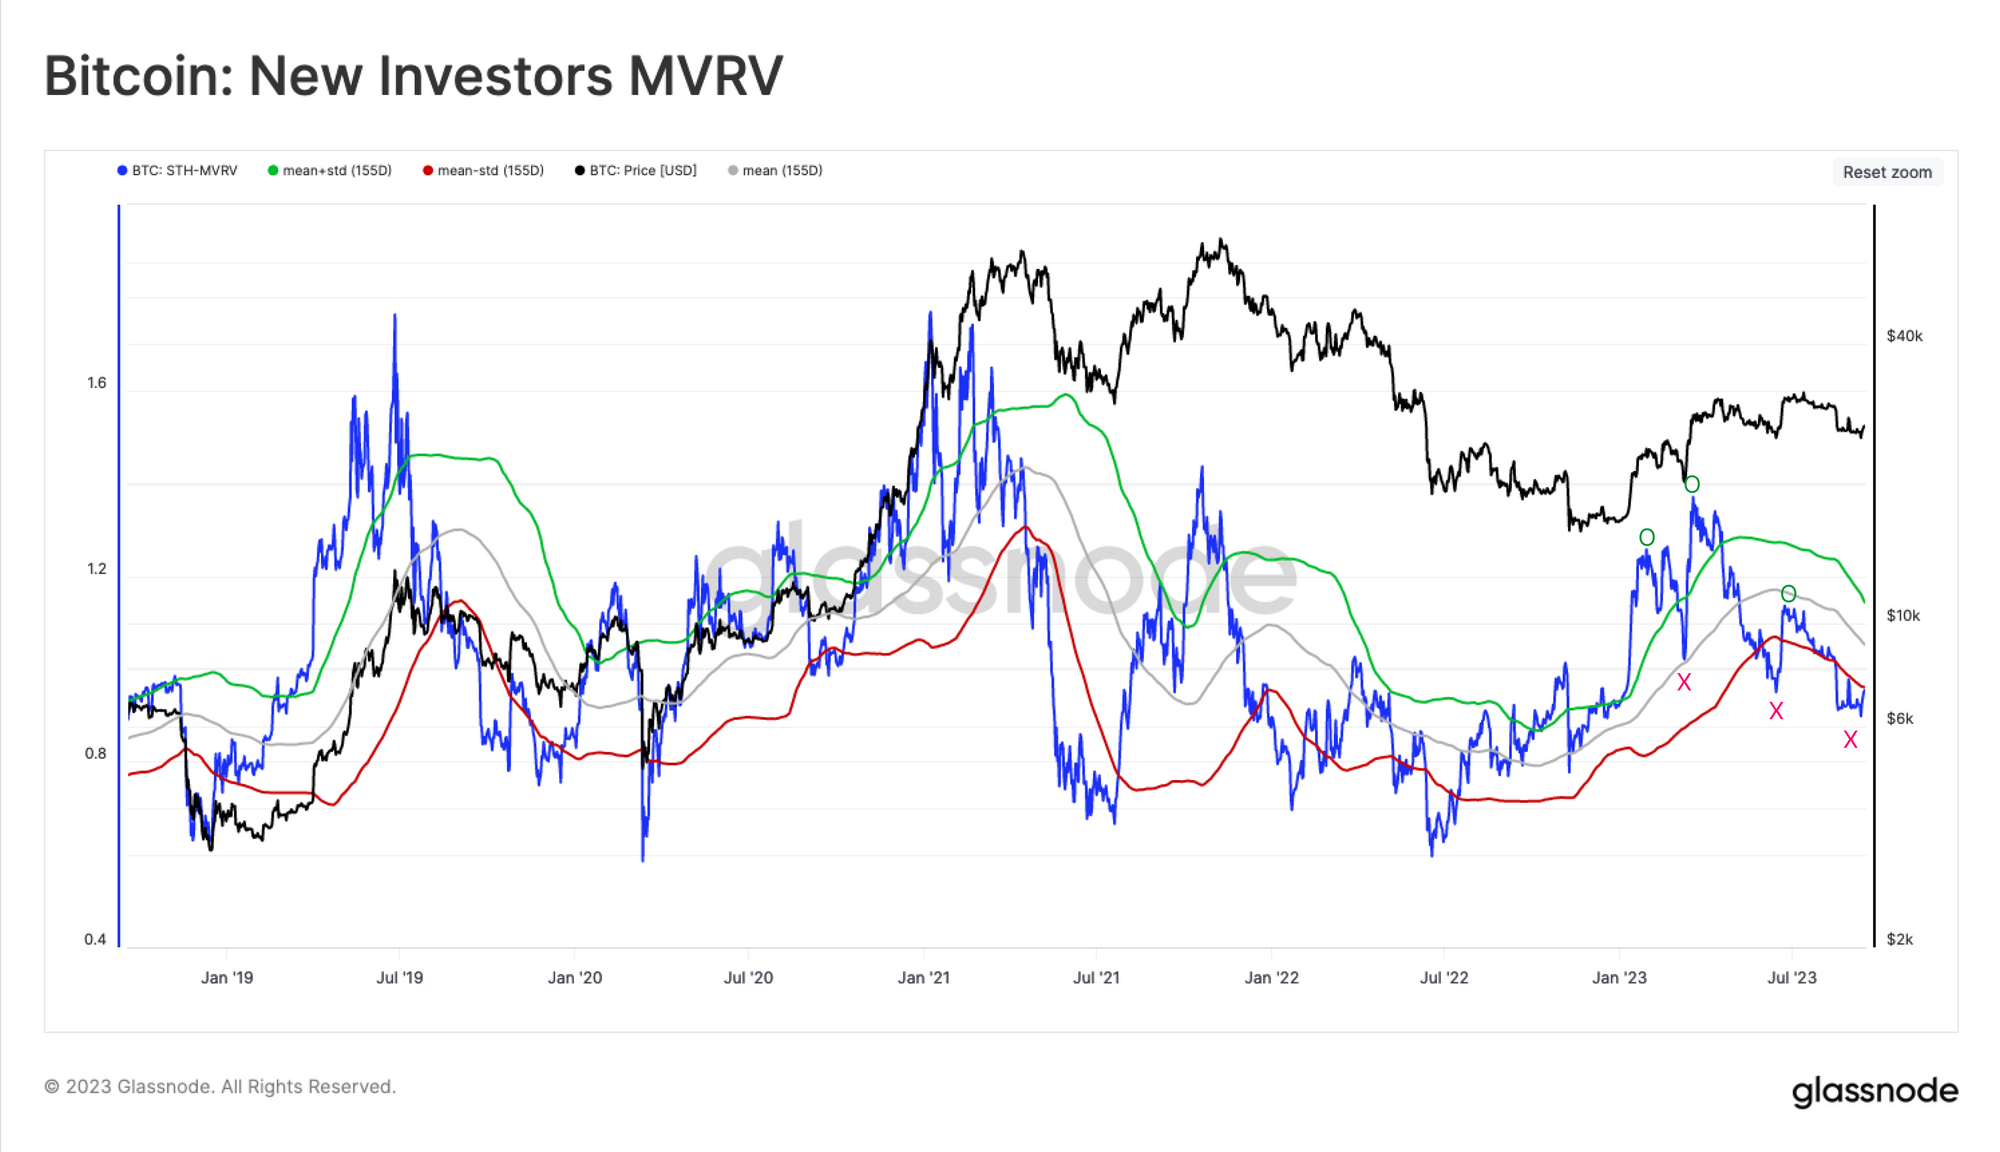
- STH-MVRV which describes the magnitude of Unrealized Profit/Loss held, and a gauge on the financial incentive to sell.
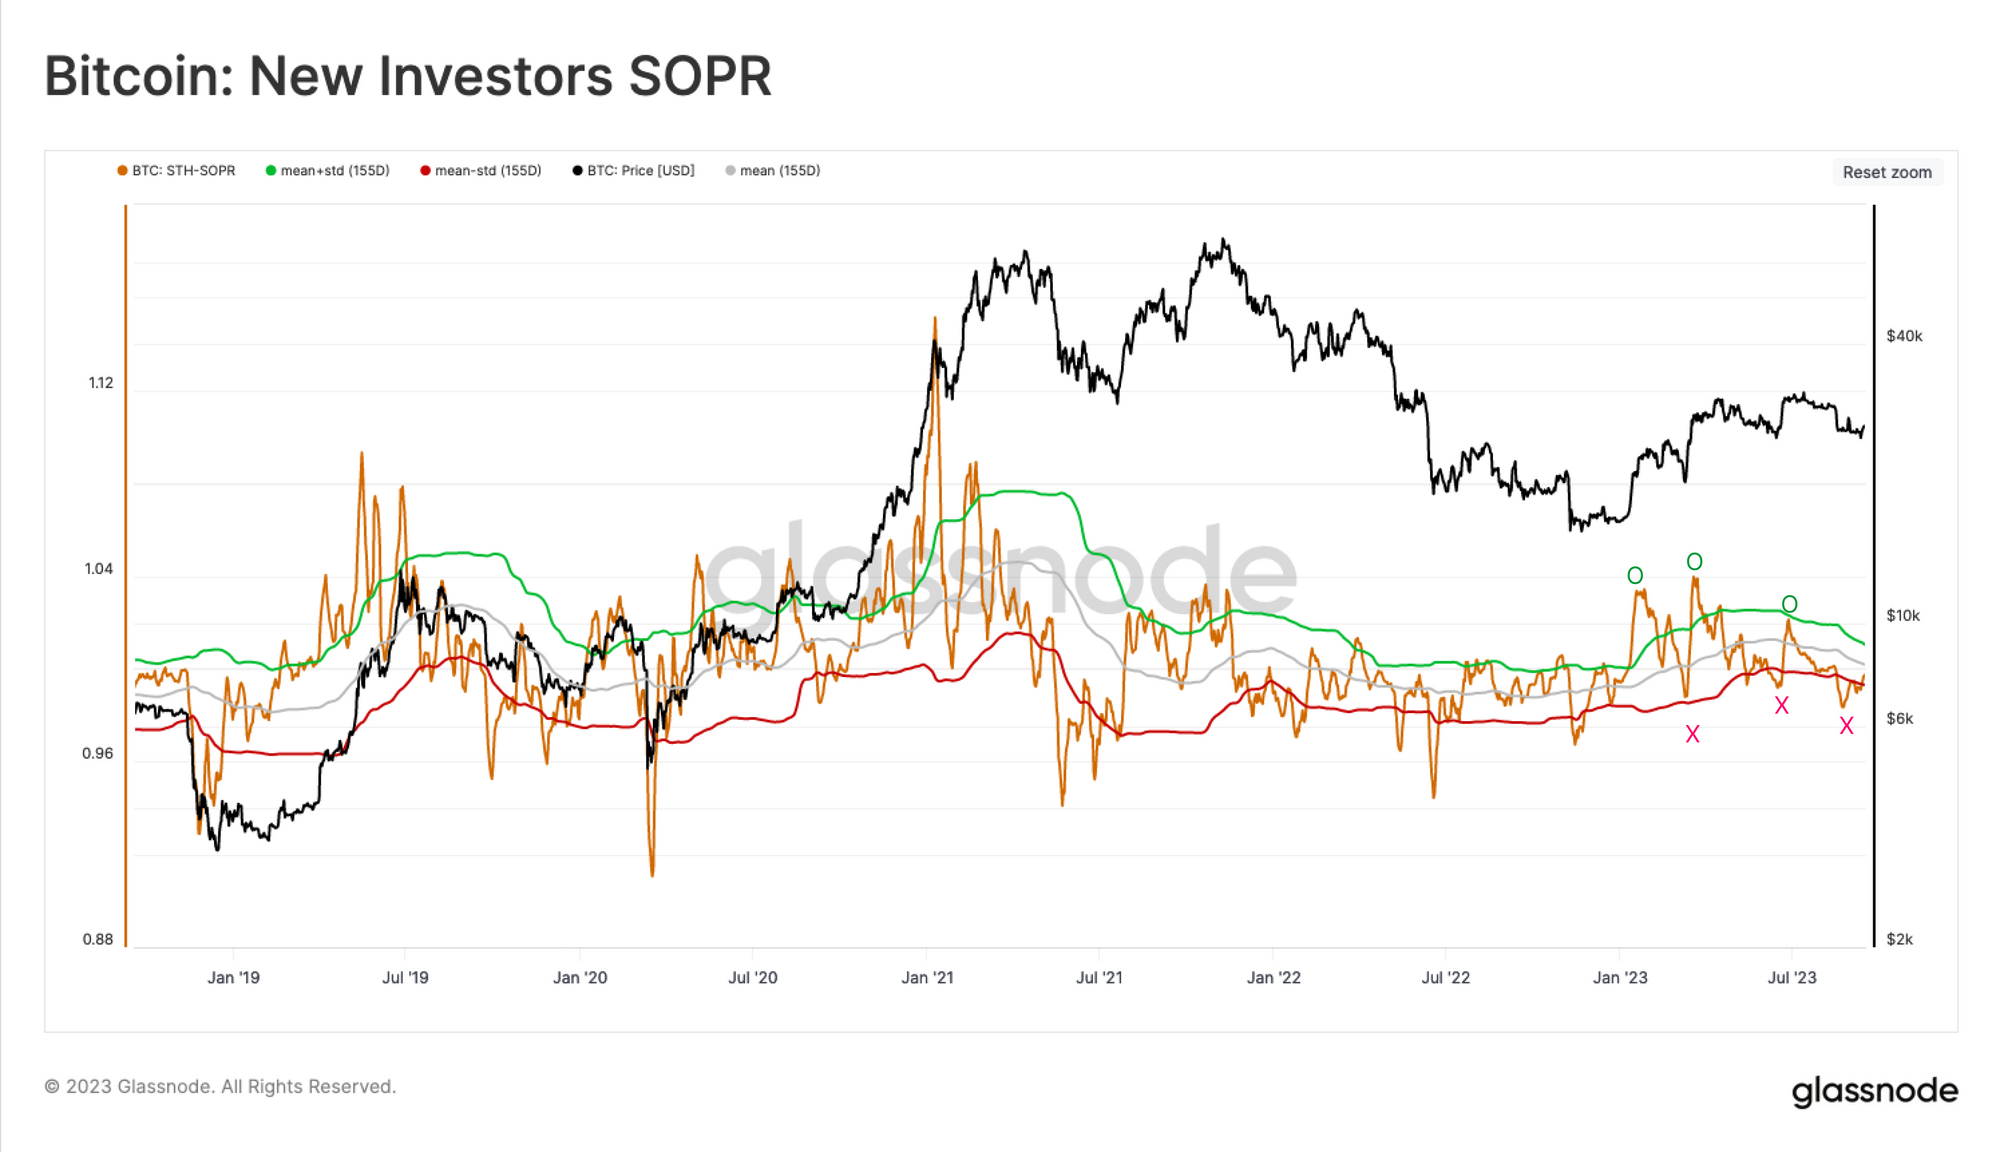
- STH-SOPR which describes the magnitude of Realized Profit/Loss locked in, providing a gauge on actualized sell-side pressure.
Starting with STH-MVRV, we can assess extremes in this indicator relative to its 155-day average️, as well as an Upper Band (mean plus one standard deviation) 🟢 and a Lower Band (mean minus one standard deviation) 🔴.
We can see that several of the recent market highs and lows occurred alongside significant deviations outside these boundaries. This indicates that recent investors were in a statistically large degree of profit or loss at the time.
We can see similar behaviour in the STH-SOPR indicator, which indicates that these investors were also taking action, opting to take profits near the highs and sell coins at a statistically meaningful loss near the lows.
Shifting Confidence
Now that we have established a relationship between abrupt changes in implied (unrealized) profitability and the shift in spending by STHs (realized profitability), we will now introduce a method to assess the trend direction of this relationship.
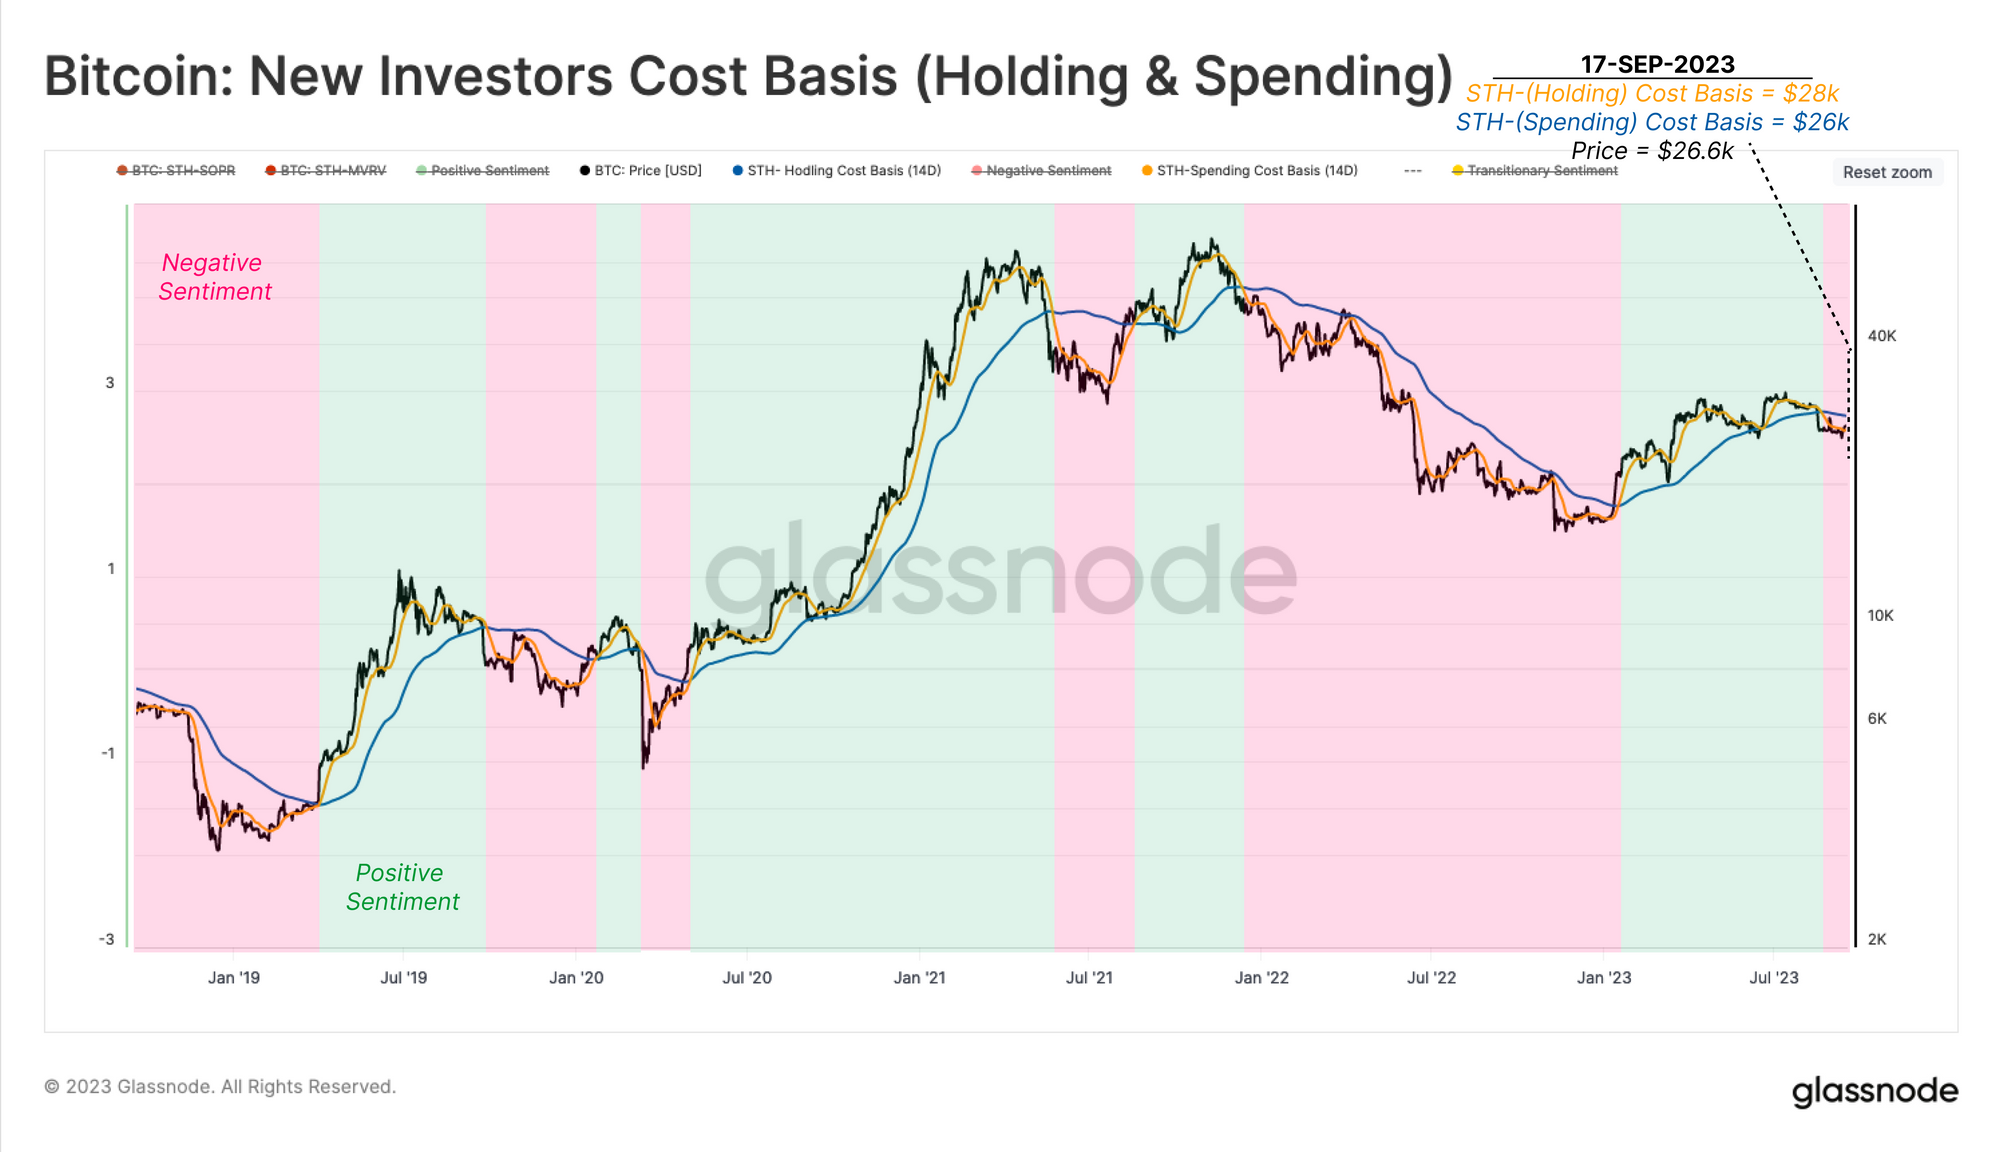
The aim is to gauge the tides of shifting sentiment for new investors, constructed by looking at the deviation between the cost basis of two subgroups; holders and spenders.
- 🟥 Negative Sentiment is when the cost basis of spenders is lower than holders.
- 🟩 Positive Sentiment is when the cost basis of the spenders is higher than holders.
From this perspective, we can see that the cost basis of STHs who are spending fell below the cost basis of holders as the market sold off from $29k to $26k in mid-August. This suggests a degree of panic and negative sentiment has taken hold in the near term.
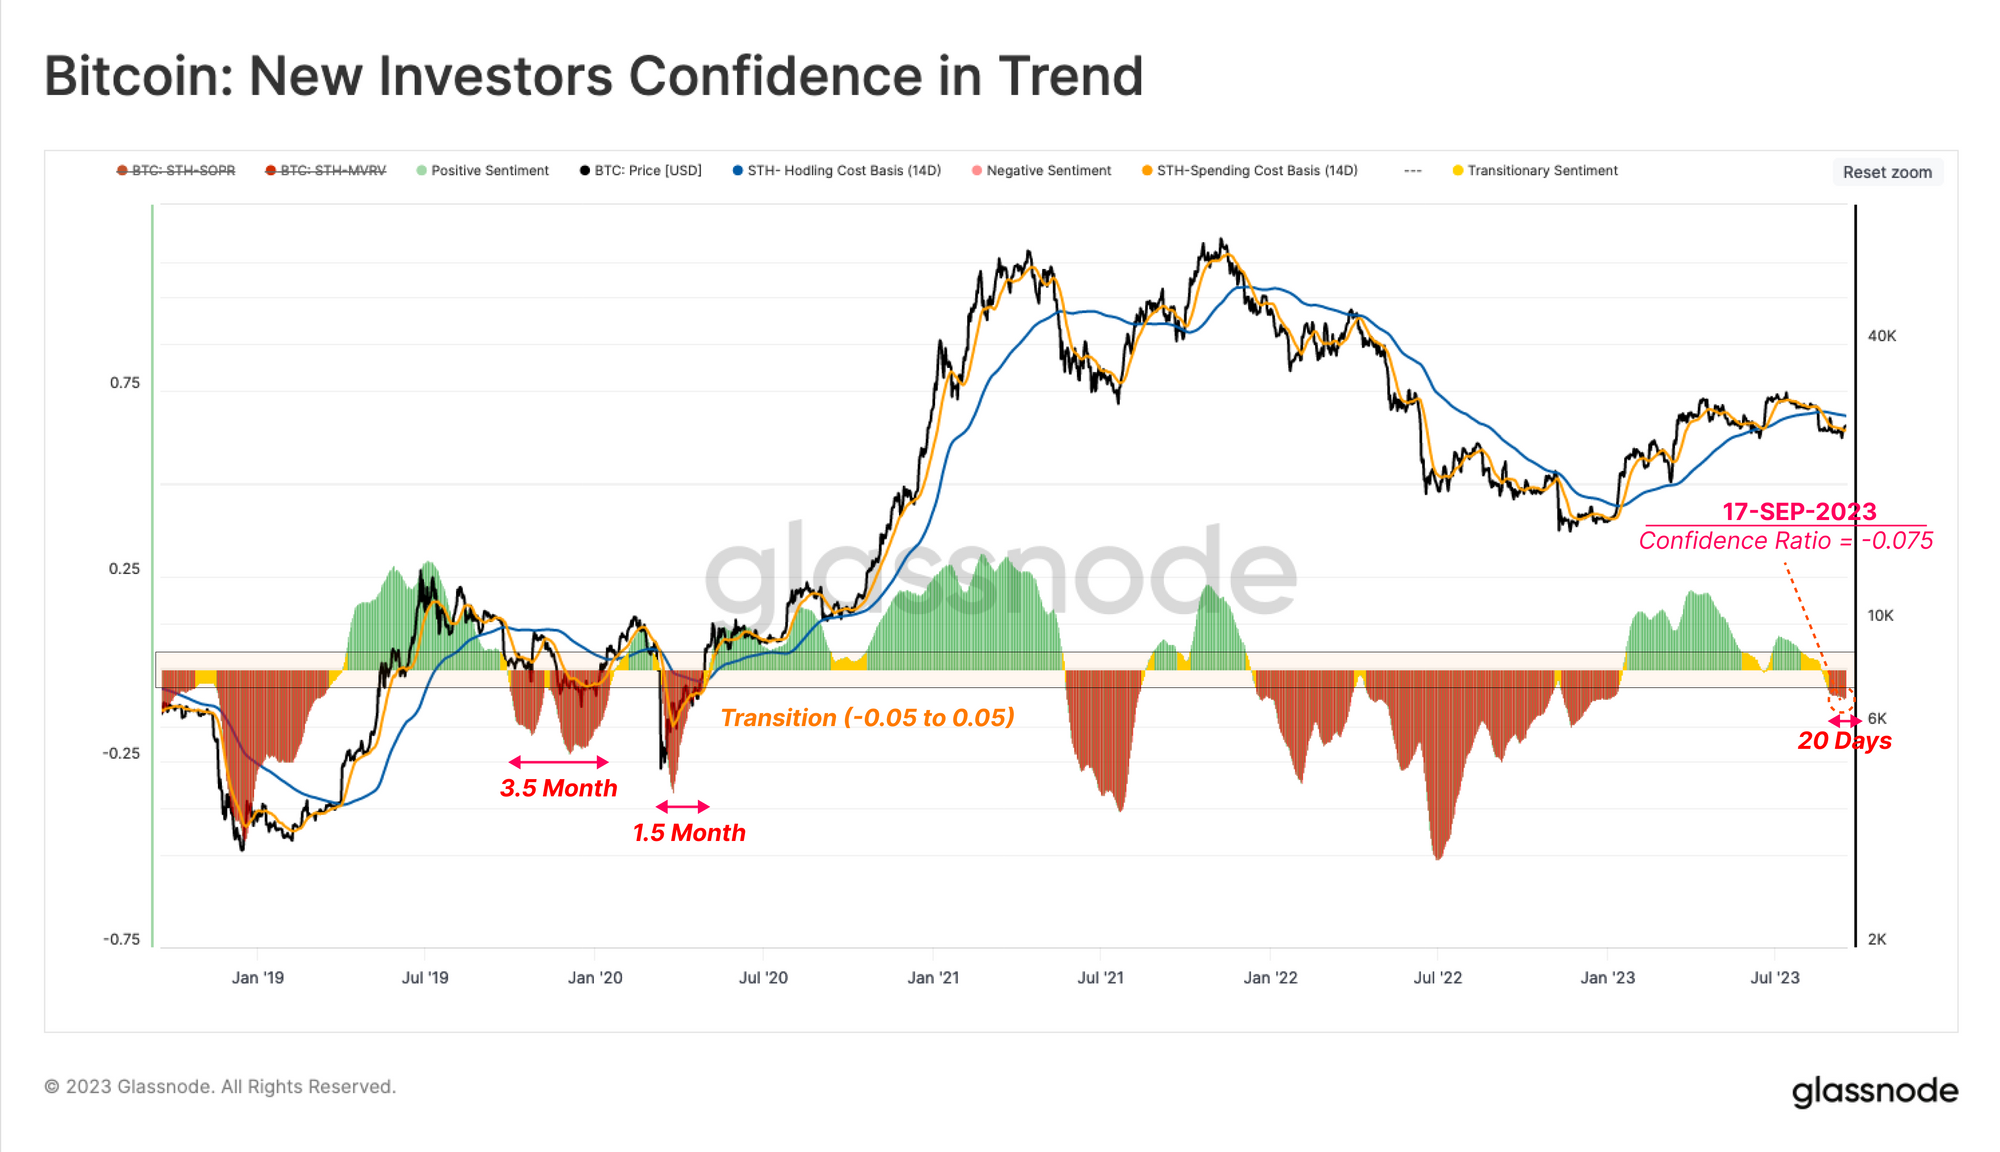
To better visualize this indicator, we have normalized this metric by the spot price.

Remarkably, the macro range for this indicator is largely bounded between extremes of -0.25 to 0.25, with occasional out of range spikes at market extreme pivot point. Here we will also disregard the neutral transitional range of -0.05 to 0.05 🟧 (which is arbitrary)
The first key insight is that intervals of negative sentiment during the recovery from the bear market typically last between 1.5 to 3.5 months. As noted, the market recently entered the first negative sentiment interval since the end of 2022.
Analysts can consider this tool when monitoring for positive shifts in STH sentiment. Should the trend start rising back towards the transitional and then positive territory (> -0.05), it would suggest that capital is starting to flow back into the market, and holders are back in a more favourable position.
Summary and Conclusions
The Bitcoin market is experiencing a non-trivial shift in sentiment, with almost all Short-Term Holders now underwater on their supply. This has resulted in a negative shift in sentiment, with investors spending now having a lower cost basis than the rest of the cohort. This suggests a degree of panic is dominating this group, which is the first time since FTX collapsed.
Several metrics suggest that 2023 has seen a positive, but low momentum influx of new capital and new investors. This speaks to the persistent uncertainty coming from the macro-economic conditions, regulatory pressures, and tightness of liquidity across all markets.