Capital Flows, Exchanges and Altseason
Liquidity across the Digital Asset landscape continues to rescind. In this edition we assess the activity of both the On and Off-chain environment, and produce a new framework to help identify peak Altseason regimes.


Introduction
- The On-Chain landscape remains extremely illiquid with waning capital flows, low network settlement and HODLing remaining the primary dynamic.
- Off-Chain, Exchange activity also remains significantly quiet when measuring from the lens of volume, profit and loss, highlighting the lack of exchange interaction across all cohorts.
- We introduce a new model to assess both Risk-On and Risk-Off environments, and to identify periods of extreme Altseason Mania through the framework of capital rotation.

Dormant Coins
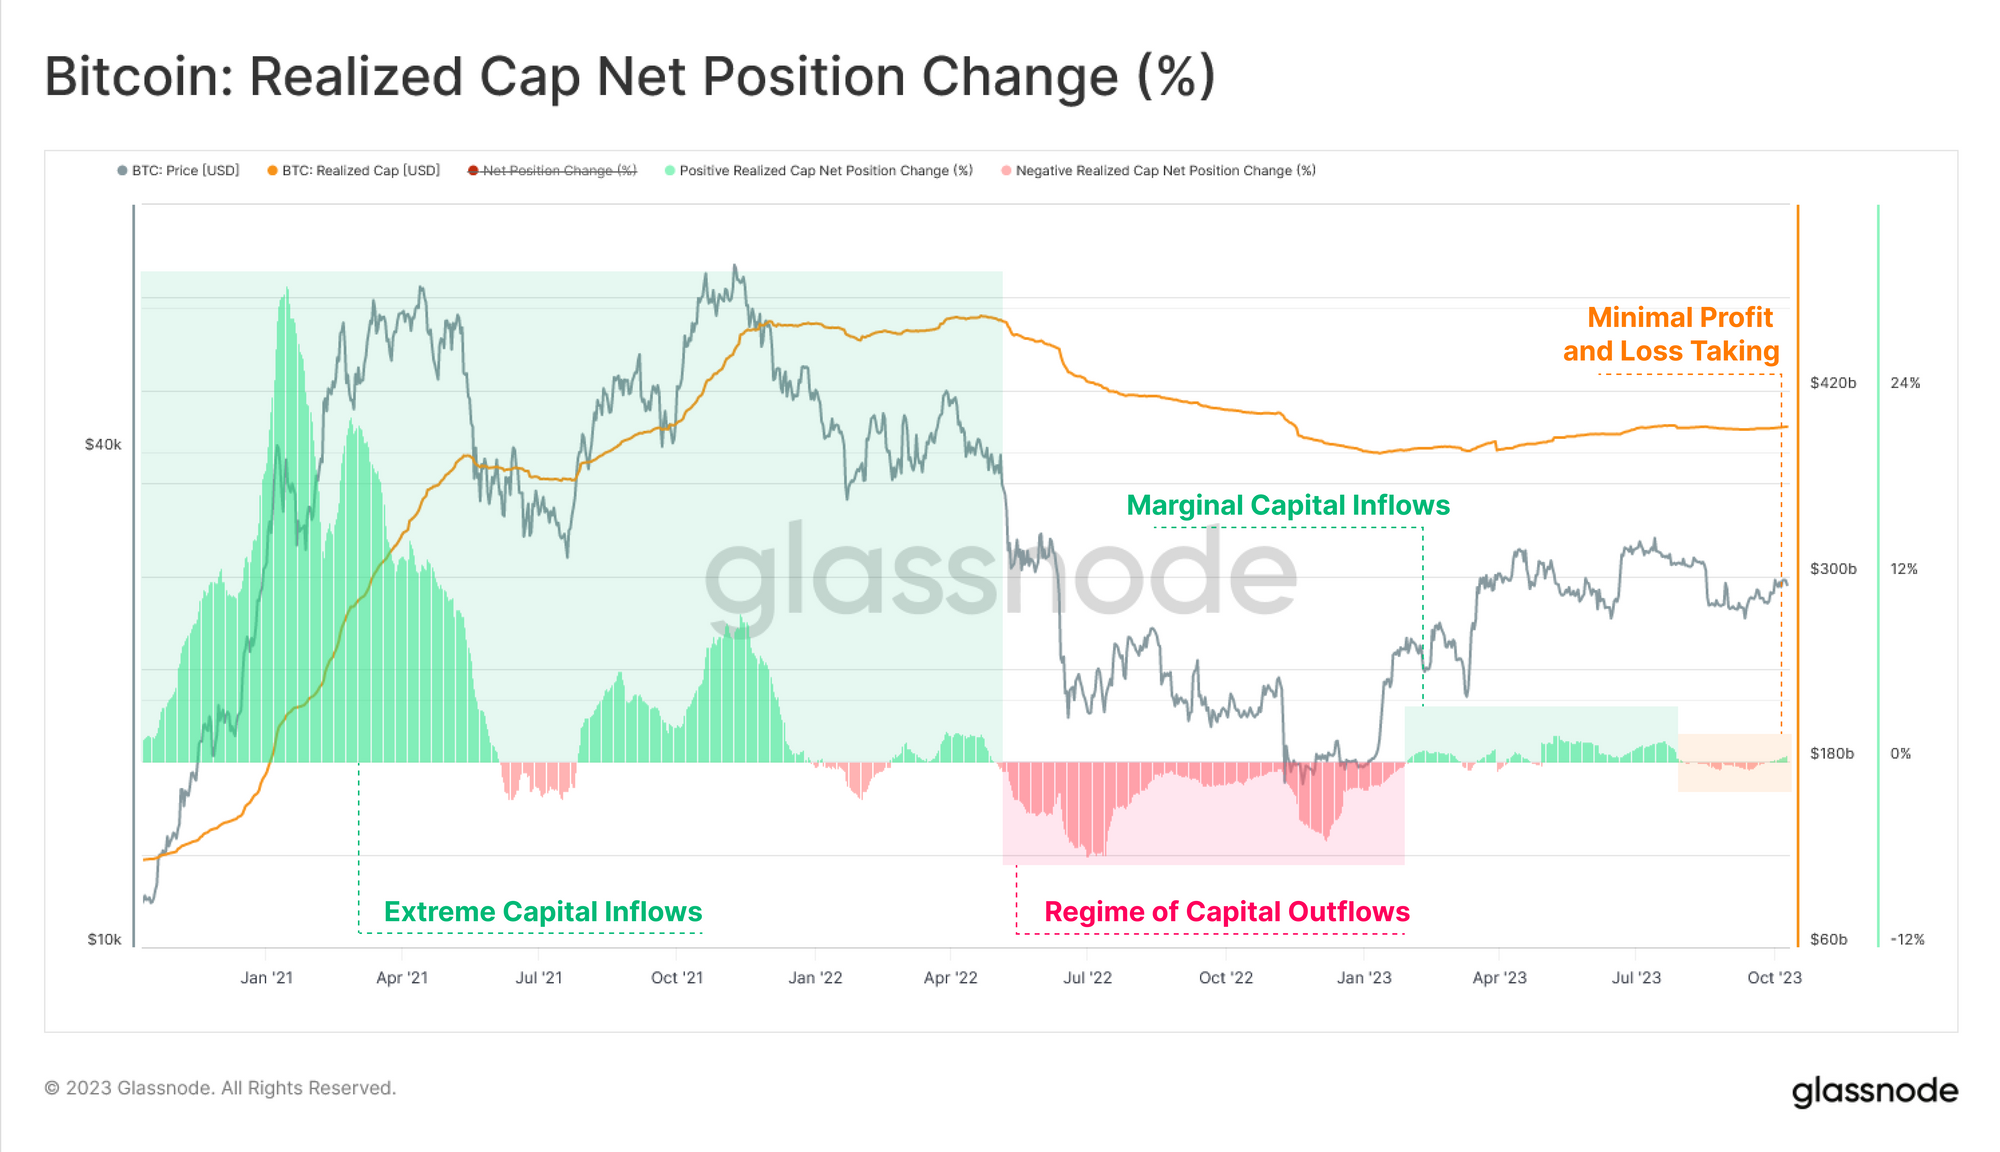
We shall start with an evaluation of the current structure of the Realized Cap. Following a brief and modest period of capital inflows to Bitcoin through the first half of the year, the Realized Cap has stabilized, reaching a point of relative indecision.
As the Realized Cap trades sideways, it suggests that very few coins transferred on-chain are experiencing a significant net change in their acquisition price (i.e. minimal profit or loss taking events).
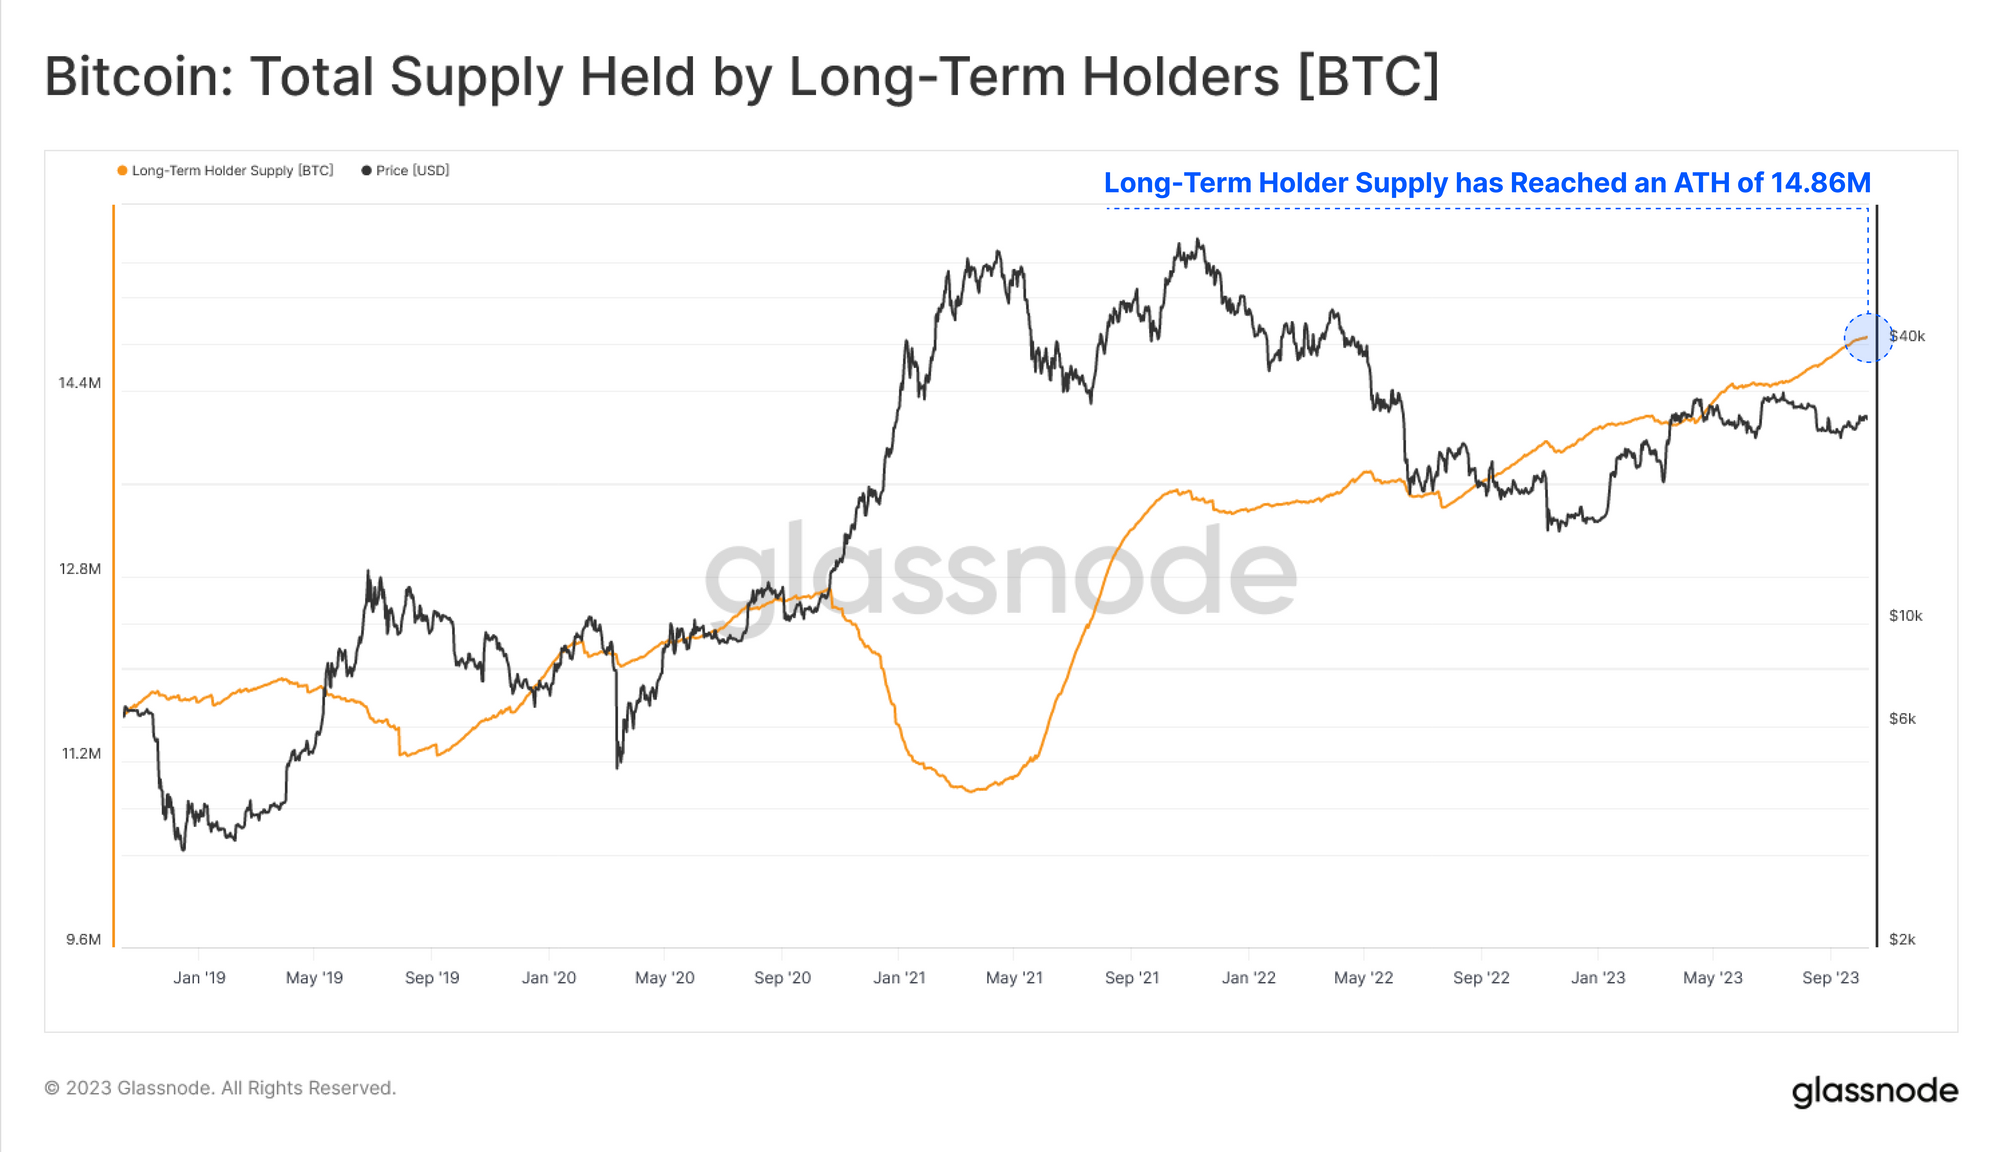
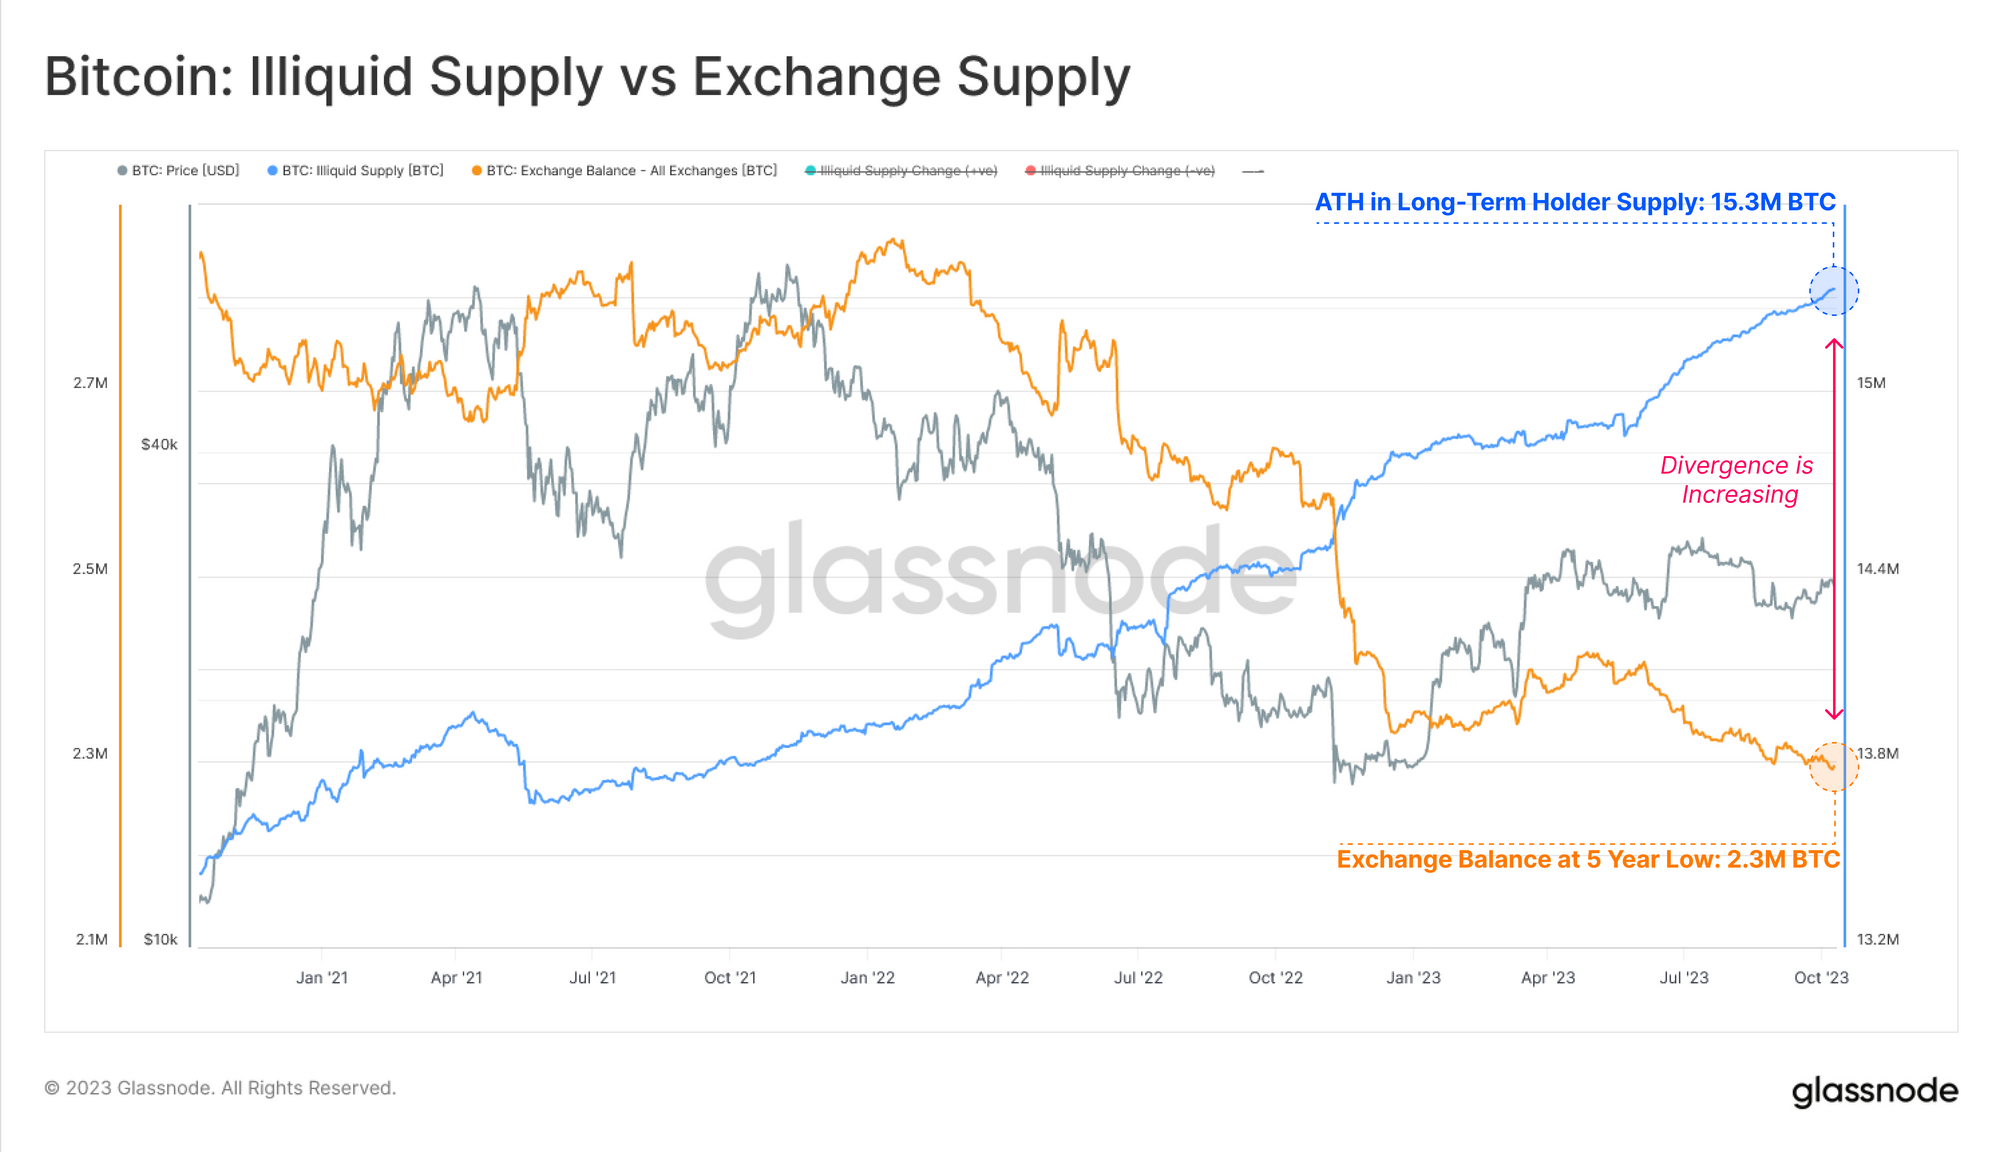
We can see this from the perspective of Long-Term Holder Supply, which continues to reach new all-time-highs over 14.859M BTC. This is equivalent to 76.1% of the circulating supply which has not transacted in the last 5-months.
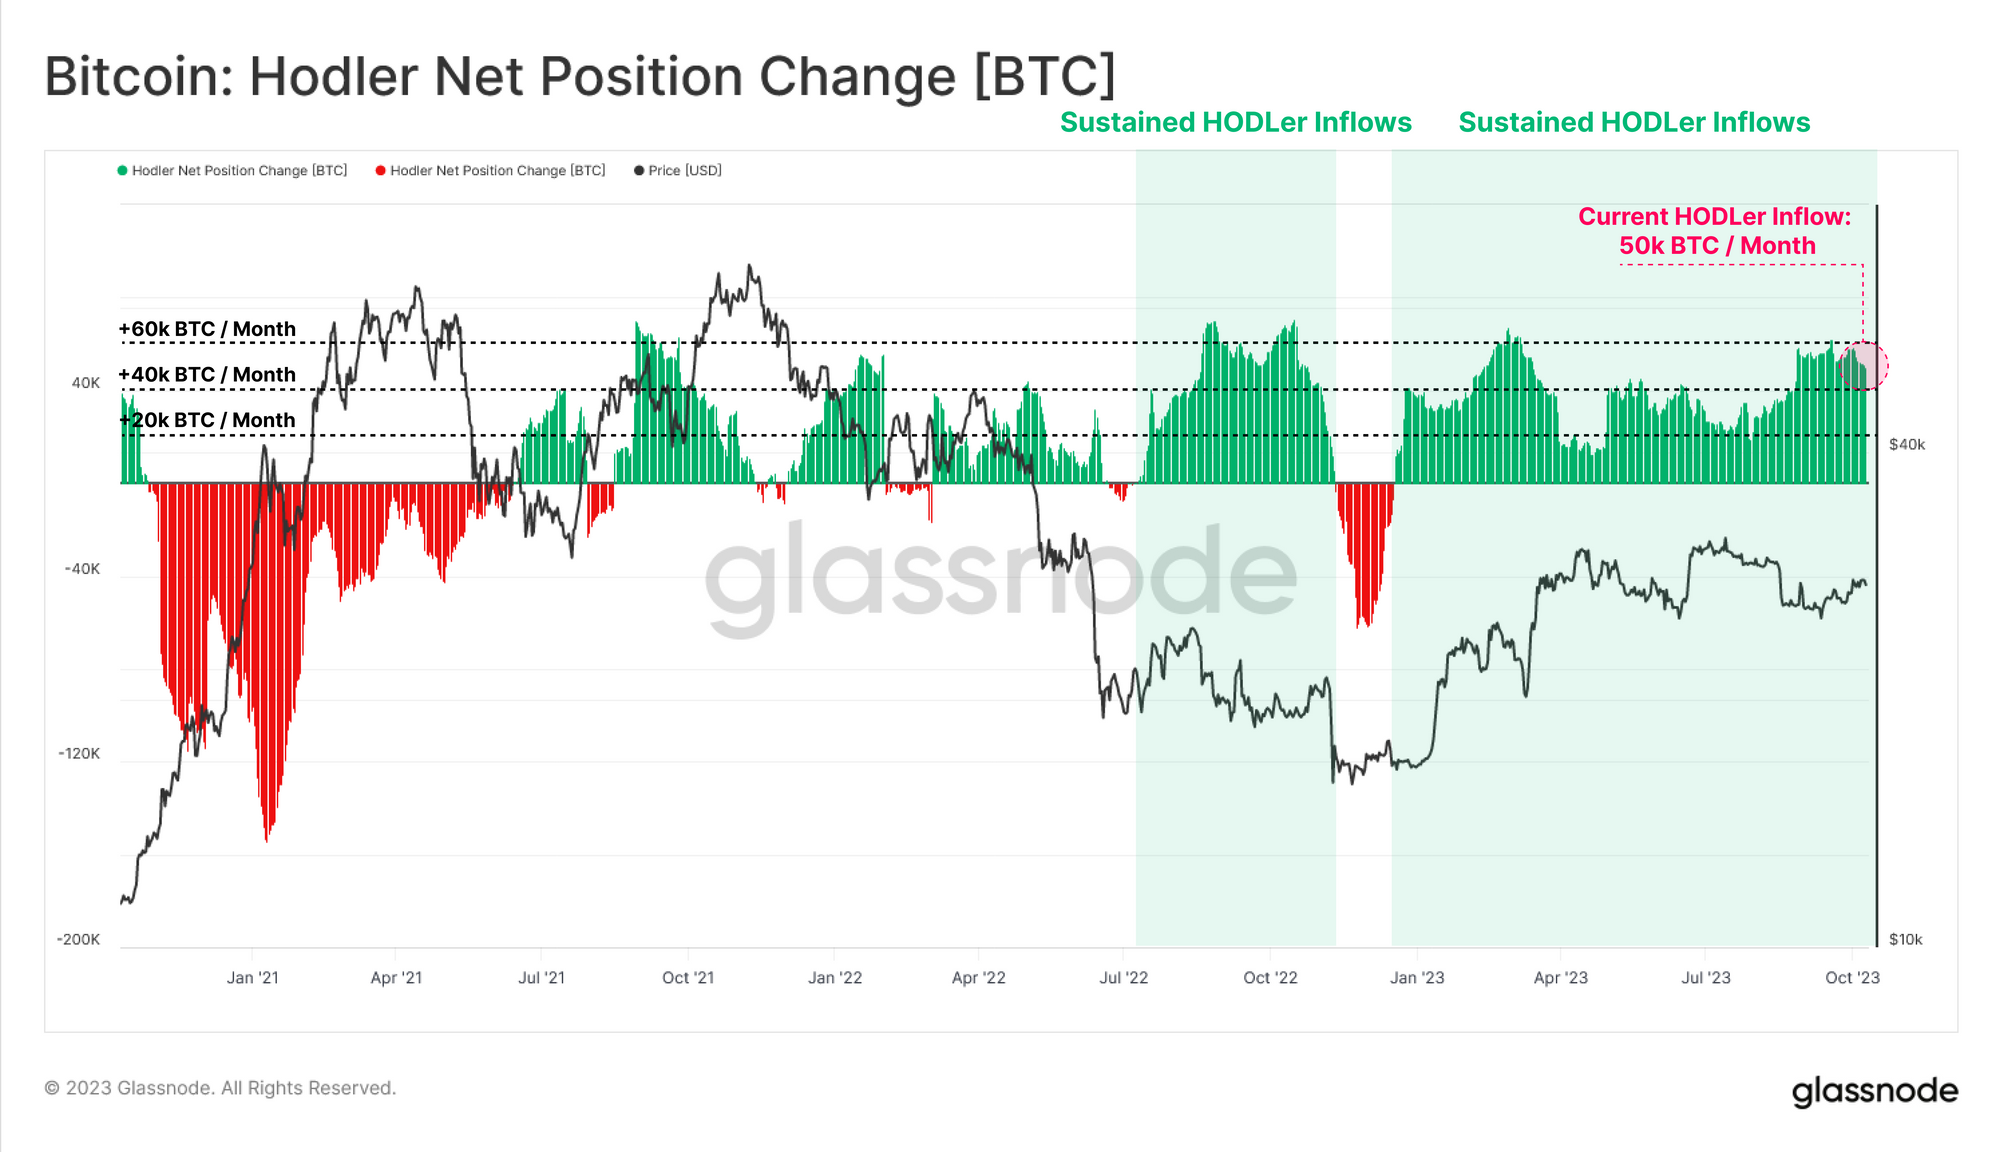
The HODLer Net Position Change metric tells a similar story, where the market is experiencing a sustained regime of coin dormancy. Over +50k BTC per month are currently being Vaulted by HODLers, suggesting both a tightening supply, and a widespread reluctance to transact.

Supply Tightens
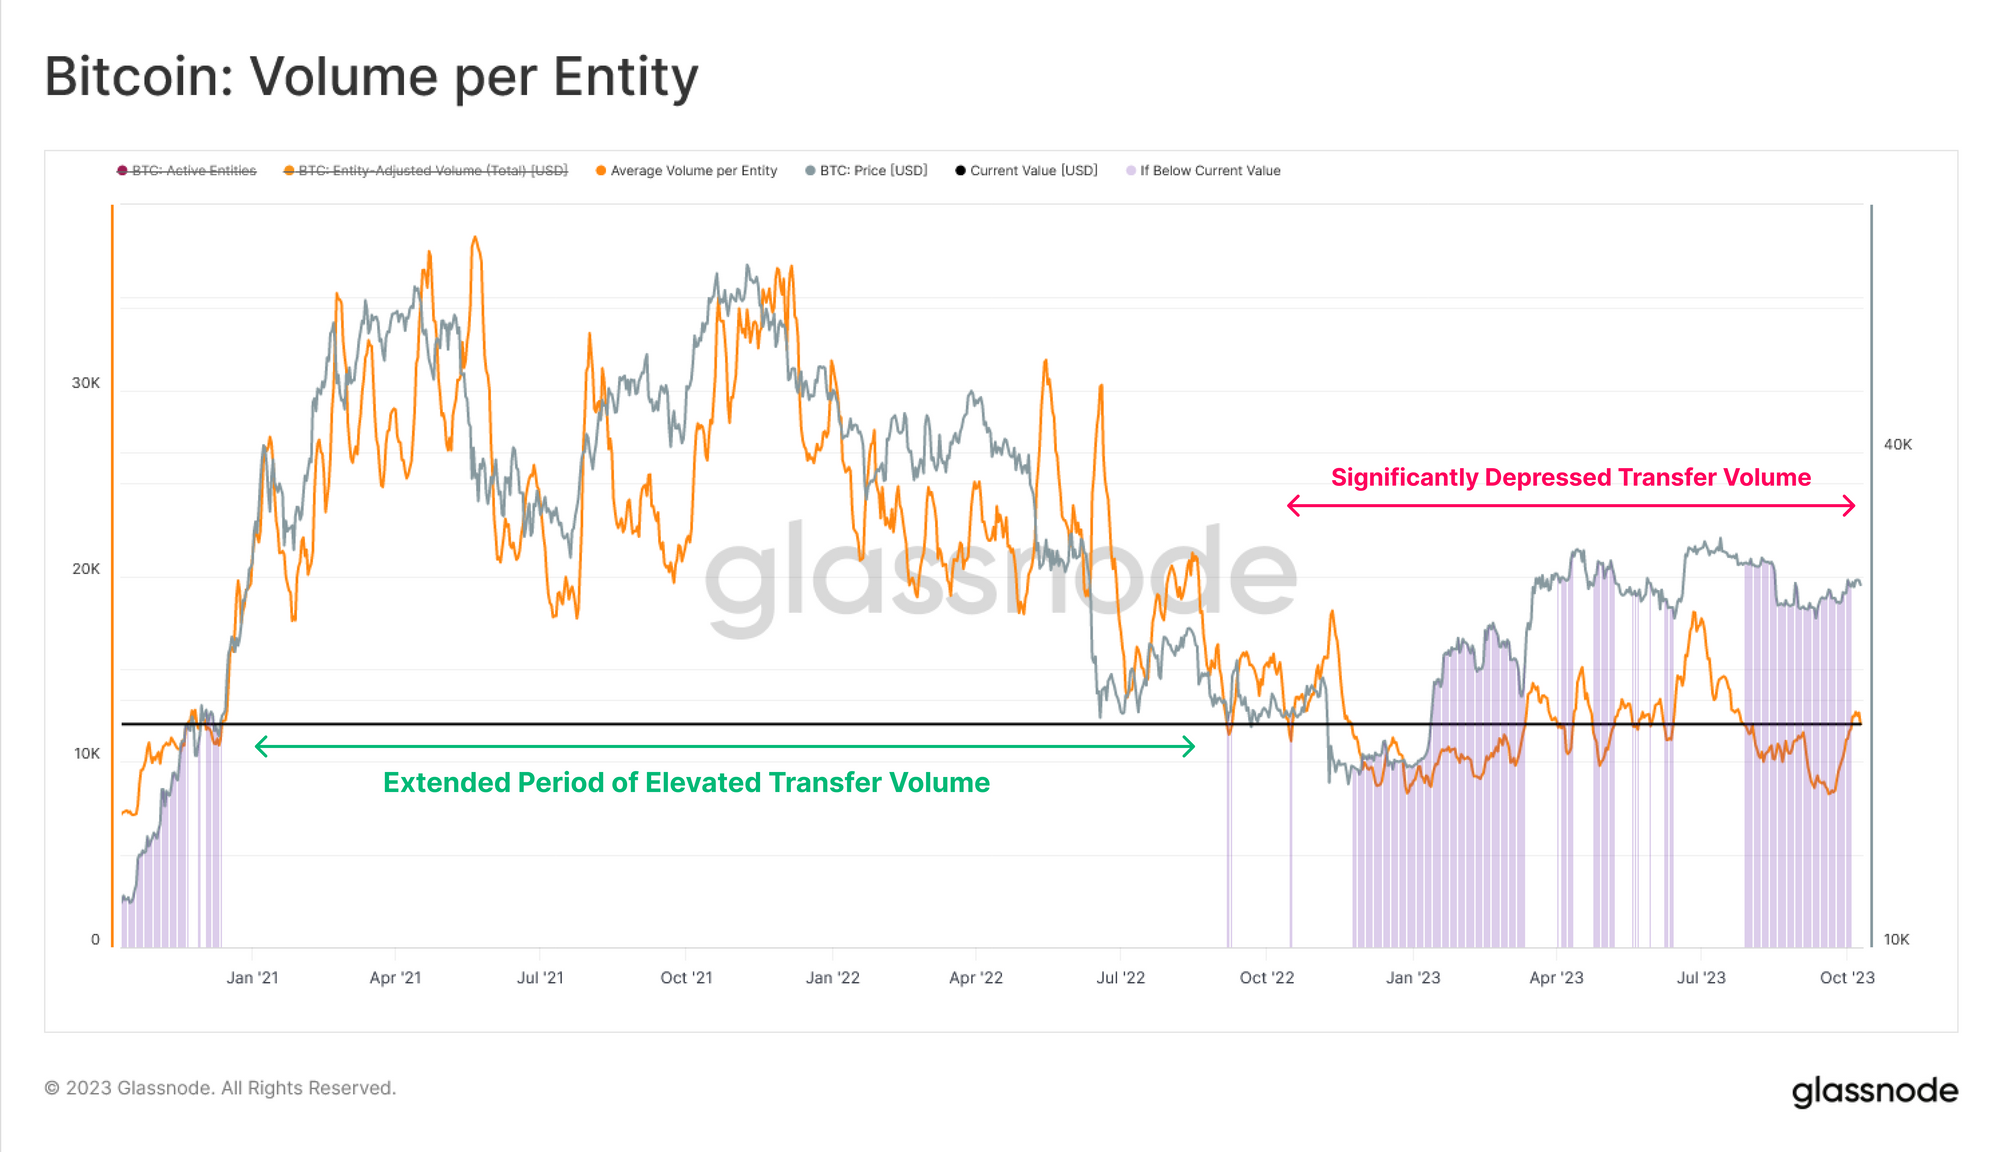
This observation is reinforced by an assessment the the Average BTC Volume Transferred per Active Entity, which has fallen to a value of $12.2k (approx 0.44 BTC). This metric has returned to levels seen in late 2017 (end of the bull run) and again in late 2020 (prior to the last cycle bull run).
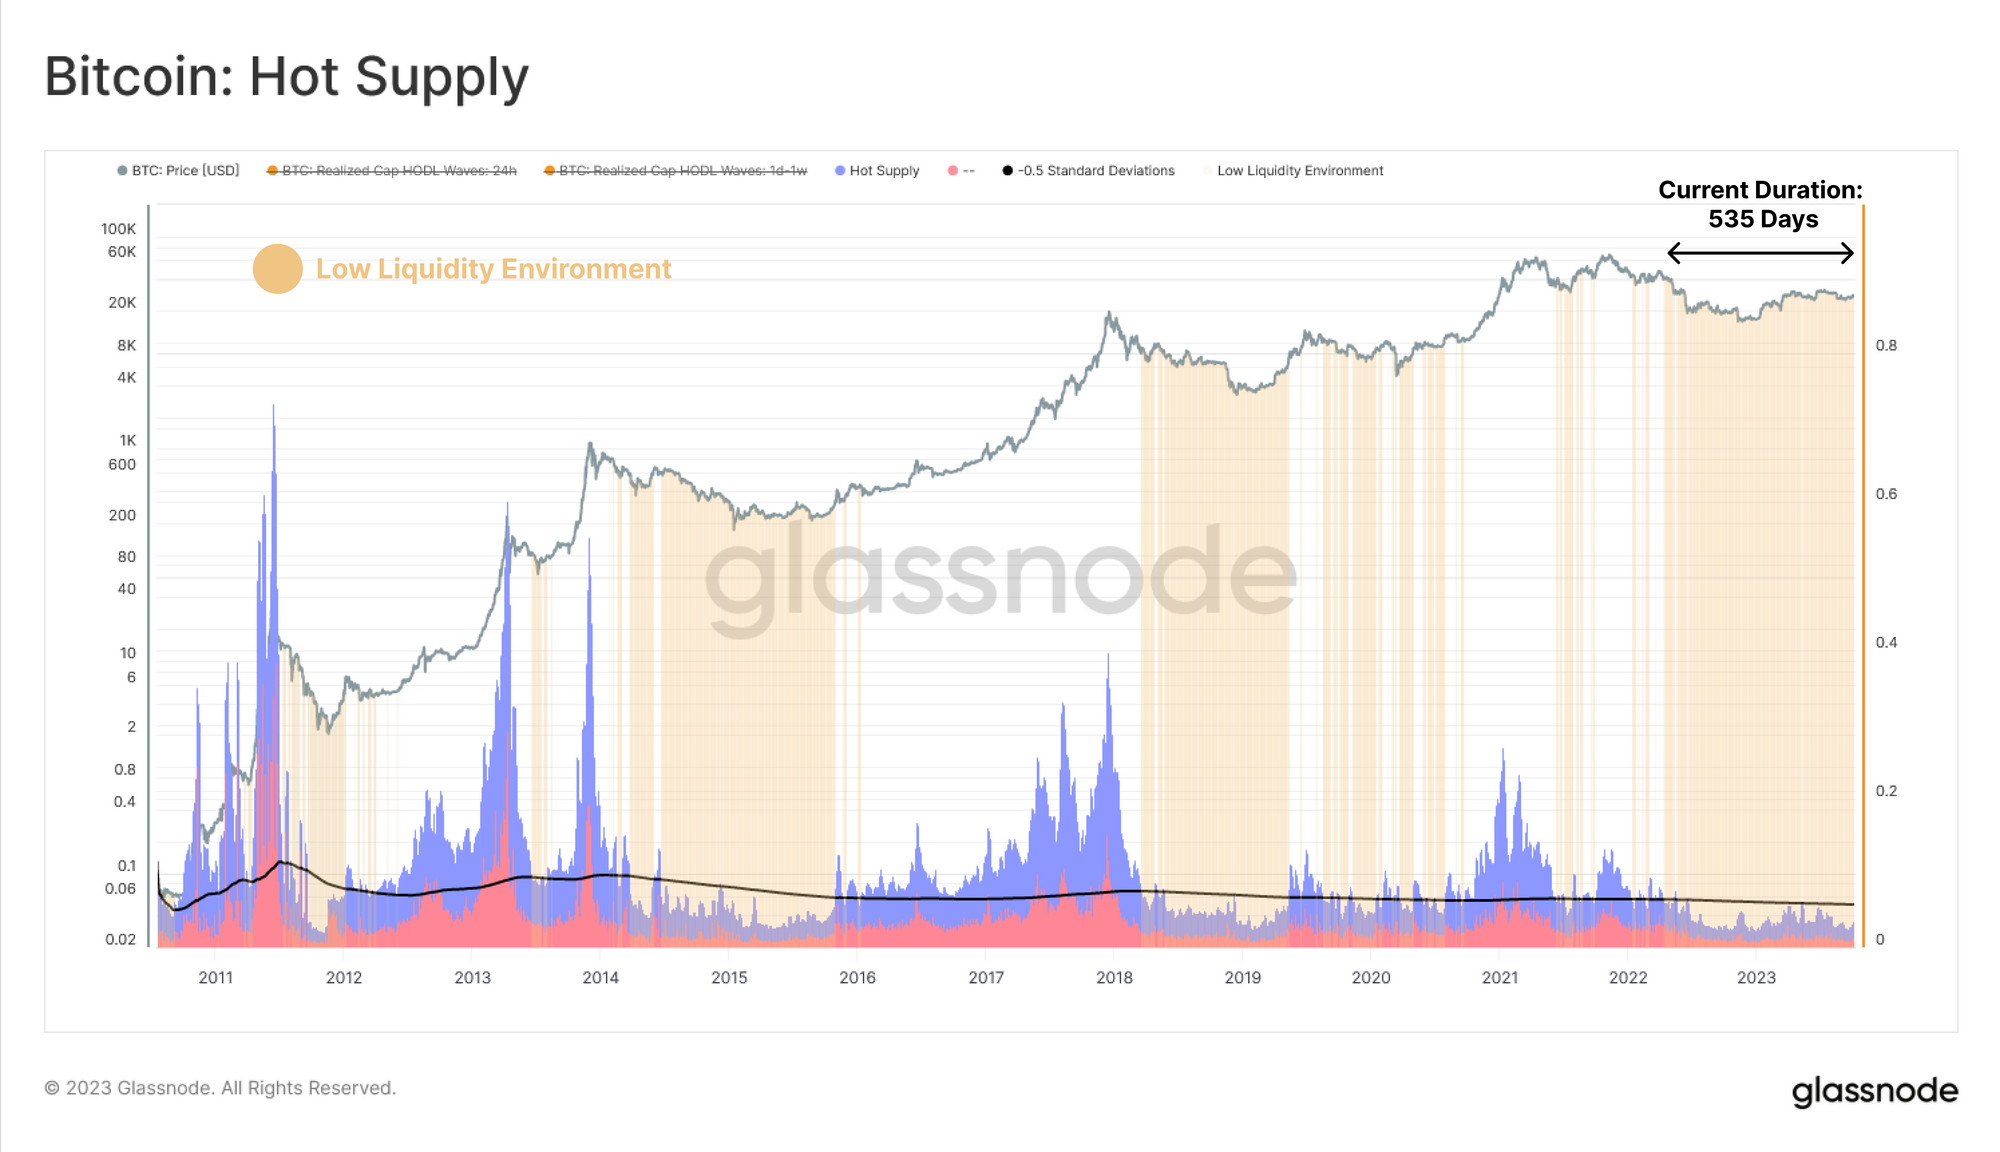
This lull in market liquidity is strikingly apparent when evaluating the ‘Hot Supply’ metric, being the volume of coins which have transacted within the last week. To demonstrate just how quiet the Bitcoin supply is, we compare Hot Supply to its long-term mean minus 0.5 standard deviations.
From this, we construct a framework to highlights periods of low and contracting market liquidity, where Hot Supply is below this Mean - 0.5SD level. These highlighted areas show that the current liquidity conditions remain similar to the 2014-15 and 2018-19 bear markets, having been in this condition for 535-days.
The volume of Illiquid Supply is also climbing, moving in the opposite direction to aggregate Exchange Balances.
This divergence is another piece of evidence that coins continue to be withdrawn from exchanges, moving into illiquid HODLer owned wallets, where they are generally ageing into Long-Term Holder status.
Exchanges
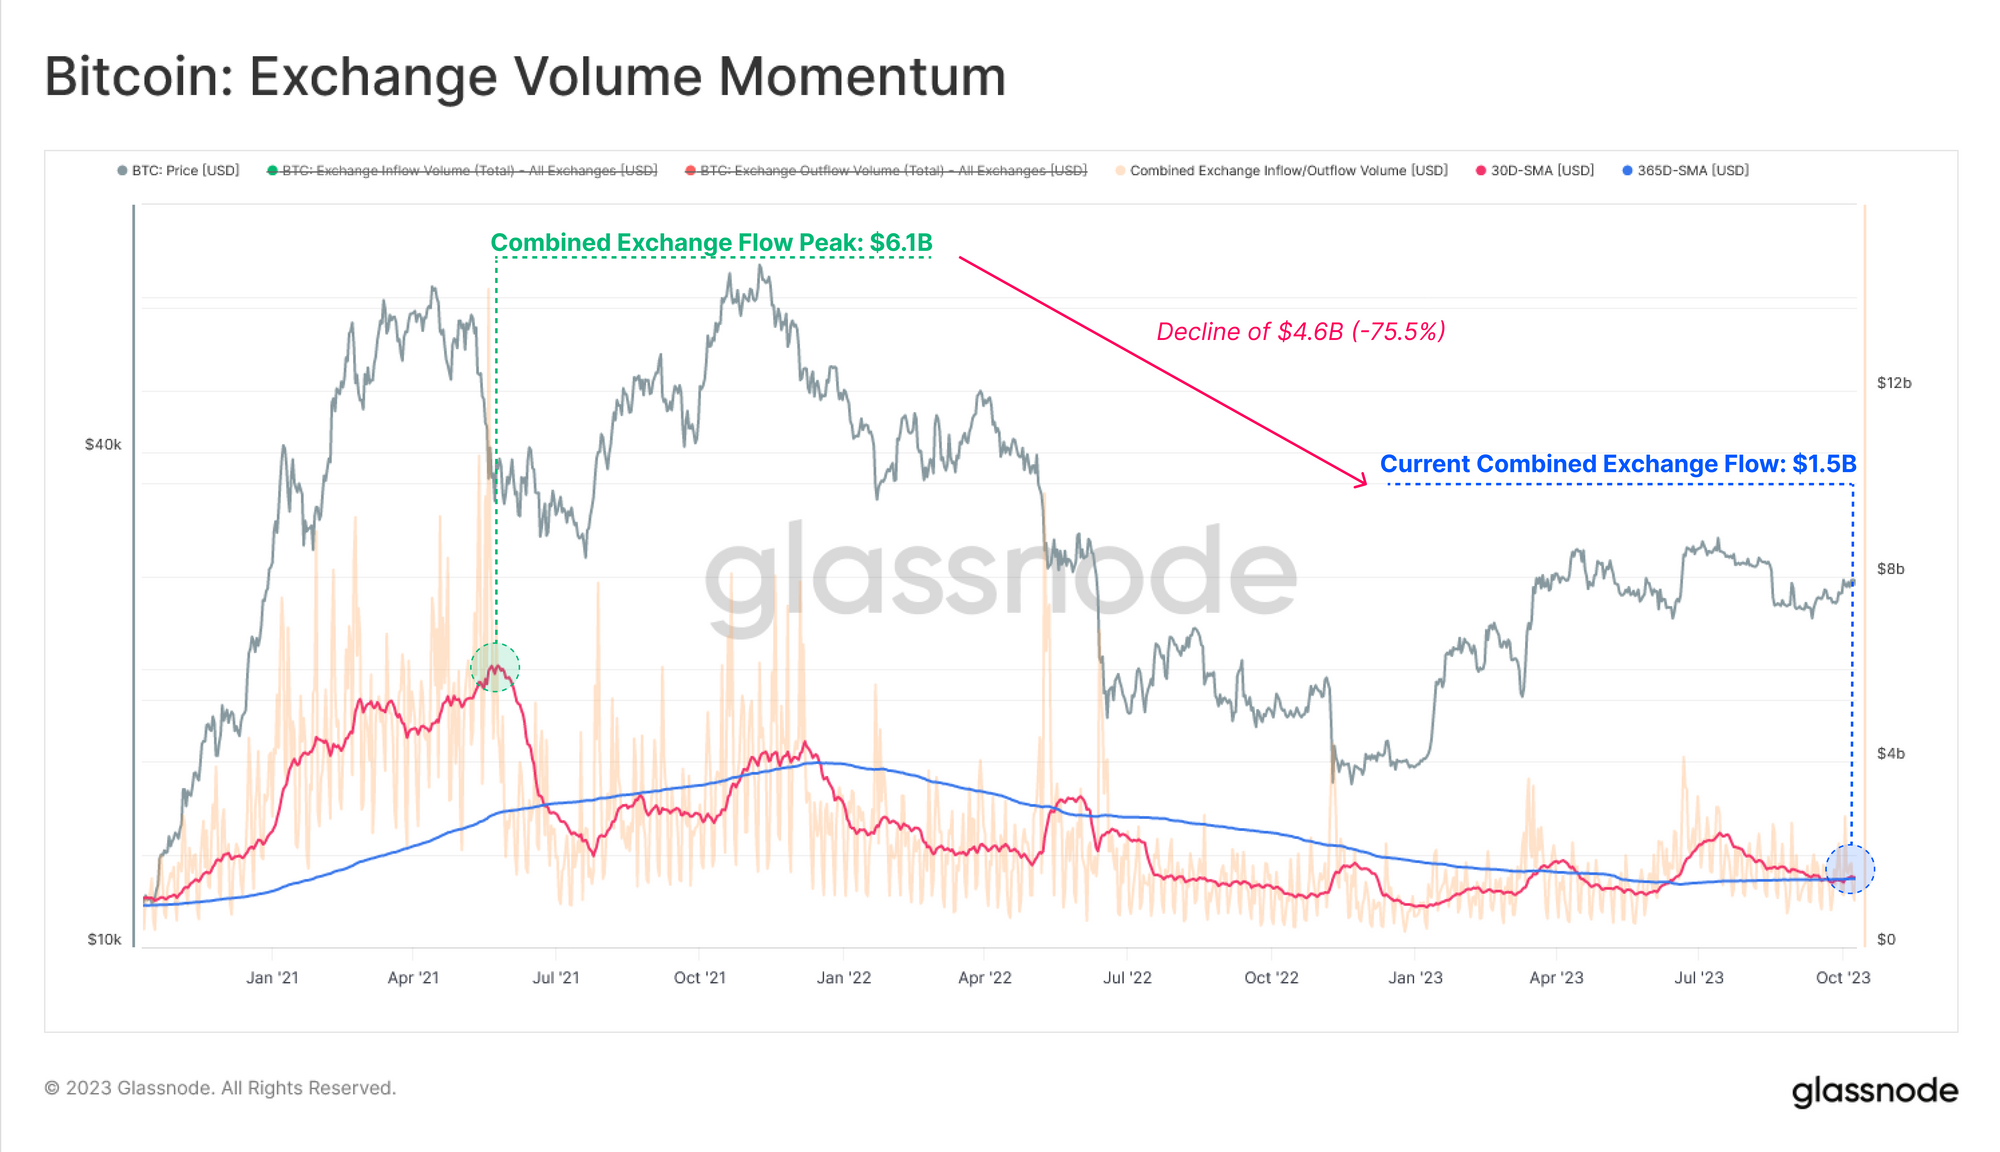
We have established that the on-chain BTC supply remains exceptionally dormant, with both value transferred and the influx of new capital being historically muted. With Exchanges remaining the primary venues for trade, we can profile flows in and out as a gauge for investor activity.
The 30-day and 365-day average of total exchange volumes (inflows plus outflows) is hovering around $1.5B, which is a substantial decline (75.5%) relative to the ATH of $6B set in May 2021.
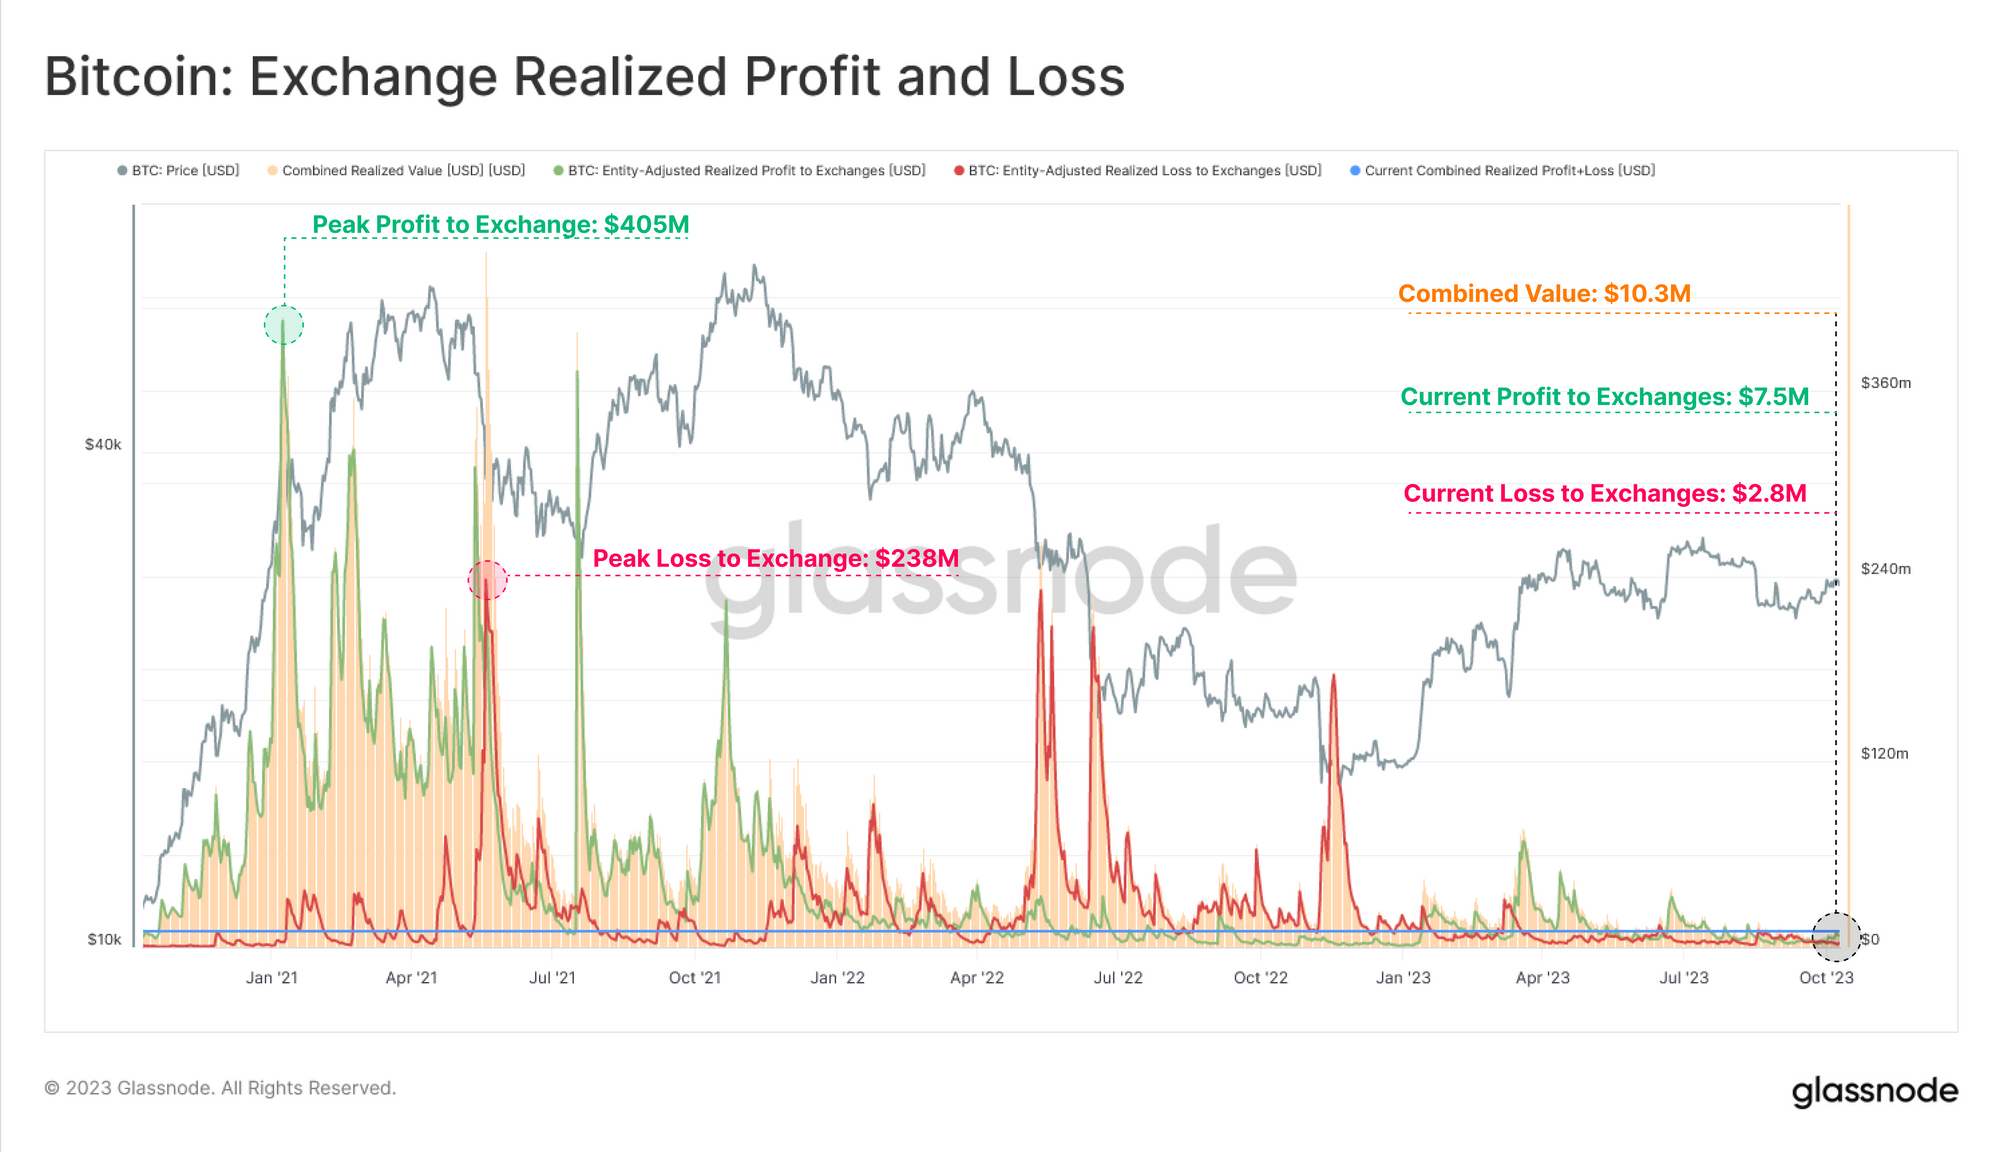
The volume of Profit and Loss realized by coins sent to Exchange Addresses has also experienced a complete detox from the 2021-22 cycle, with both measures hitting the lowest levels seen since 2020.
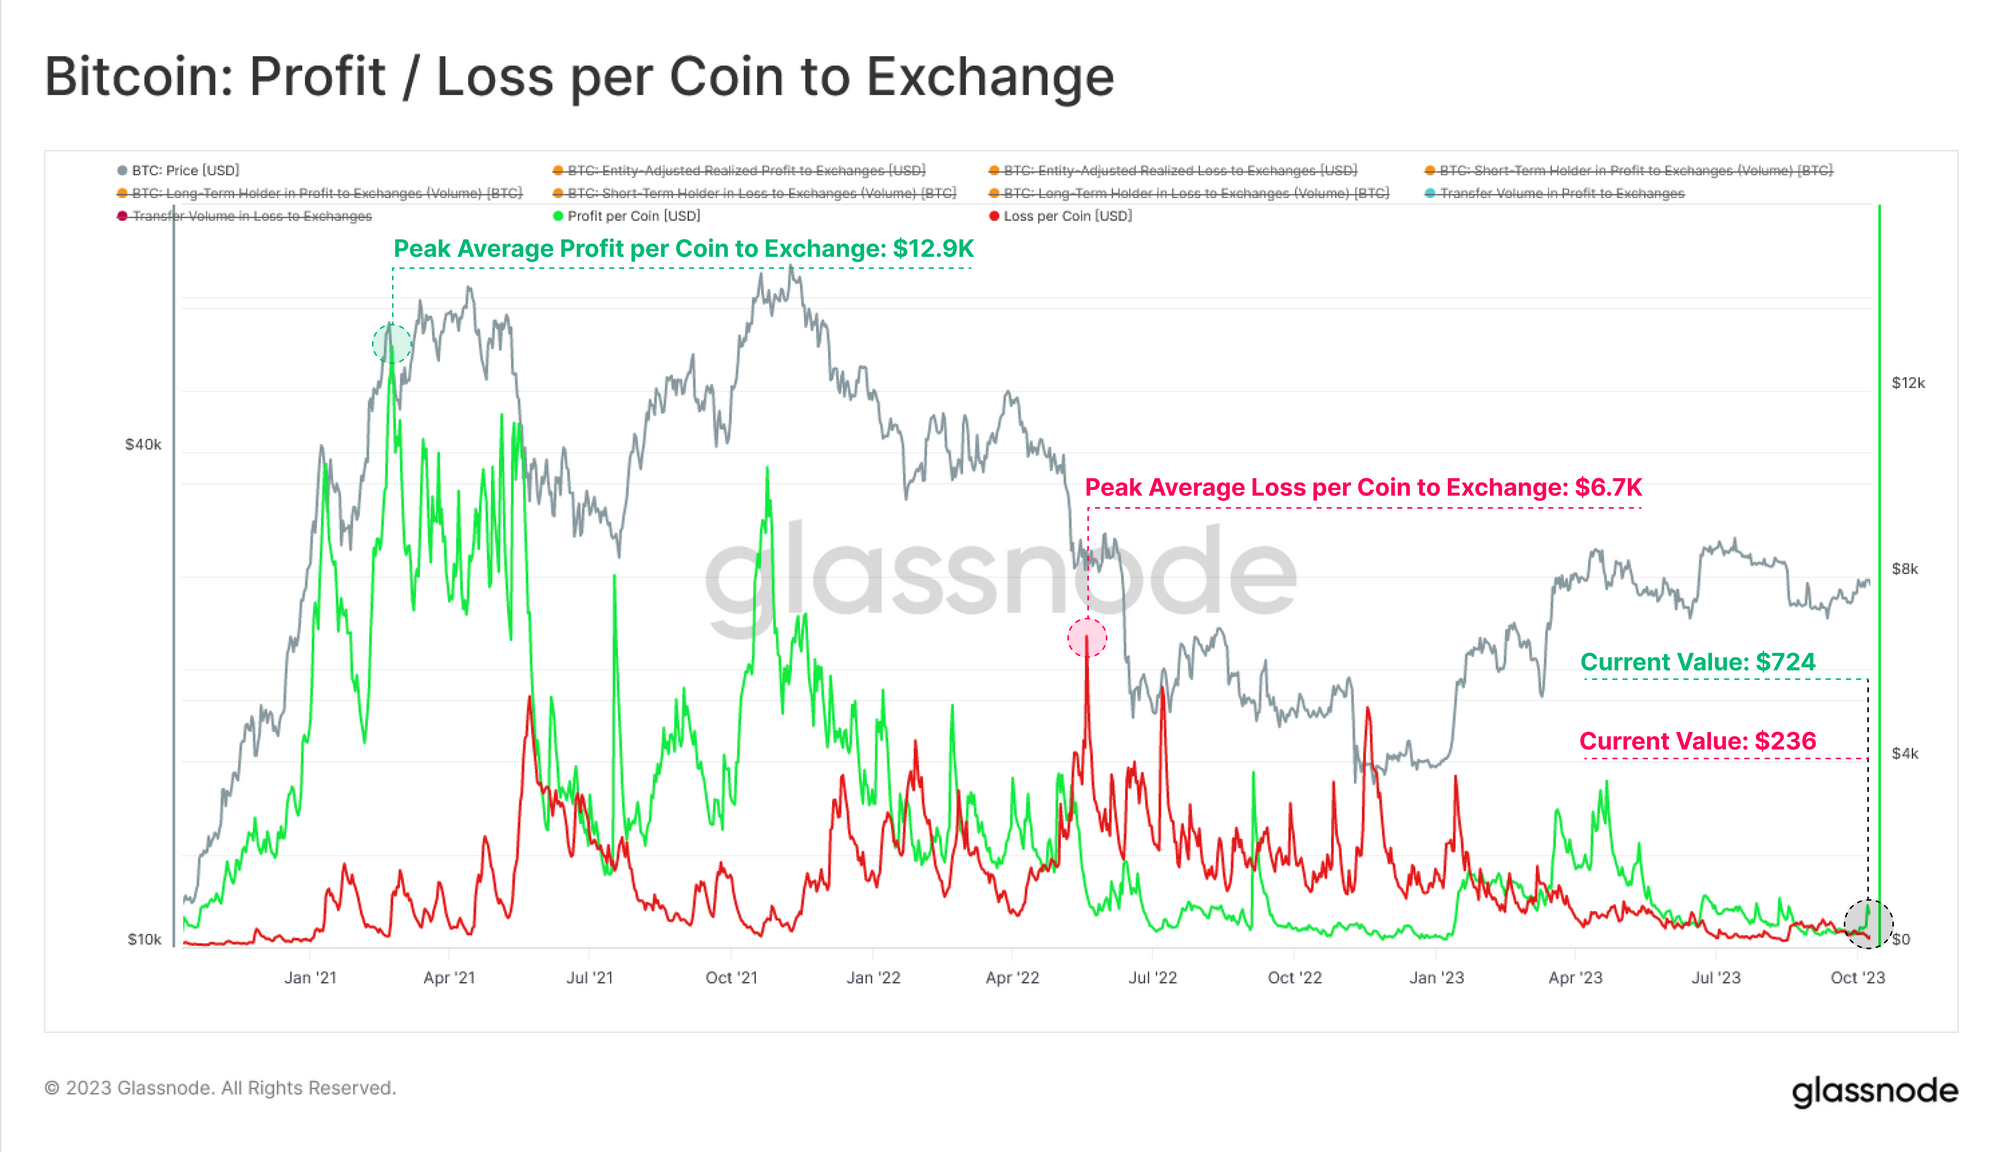
The average Profit or Loss realized per coin has also reached cycle lows, reinforcing the observation that the majority of coins being traded were last transacted at a similar price to today. We also note that profits are equal to losses, suggesting a state of equilibrium has been reached (an indicator for heightened volatility ahead).
With the majority of coins transacting in close proximity to their original cost basis, this describes a market where active investors are either price insensitive HODLers, or traders jostling for a marginally better position.
Modelling Altseason
With so little occurring on-chain, this next section will explore a more fundamental concept, being the rotation of capital which often referred to as ‘alt-season’. From this we will construct a novel tool to assess periods where ‘alt-season’ capital rotation appears to be underway.
Historically, Bitcoin tends to lead the digital asset market, with market confidence then flowing towards Ethereum, and then further out on the risk curve from there.
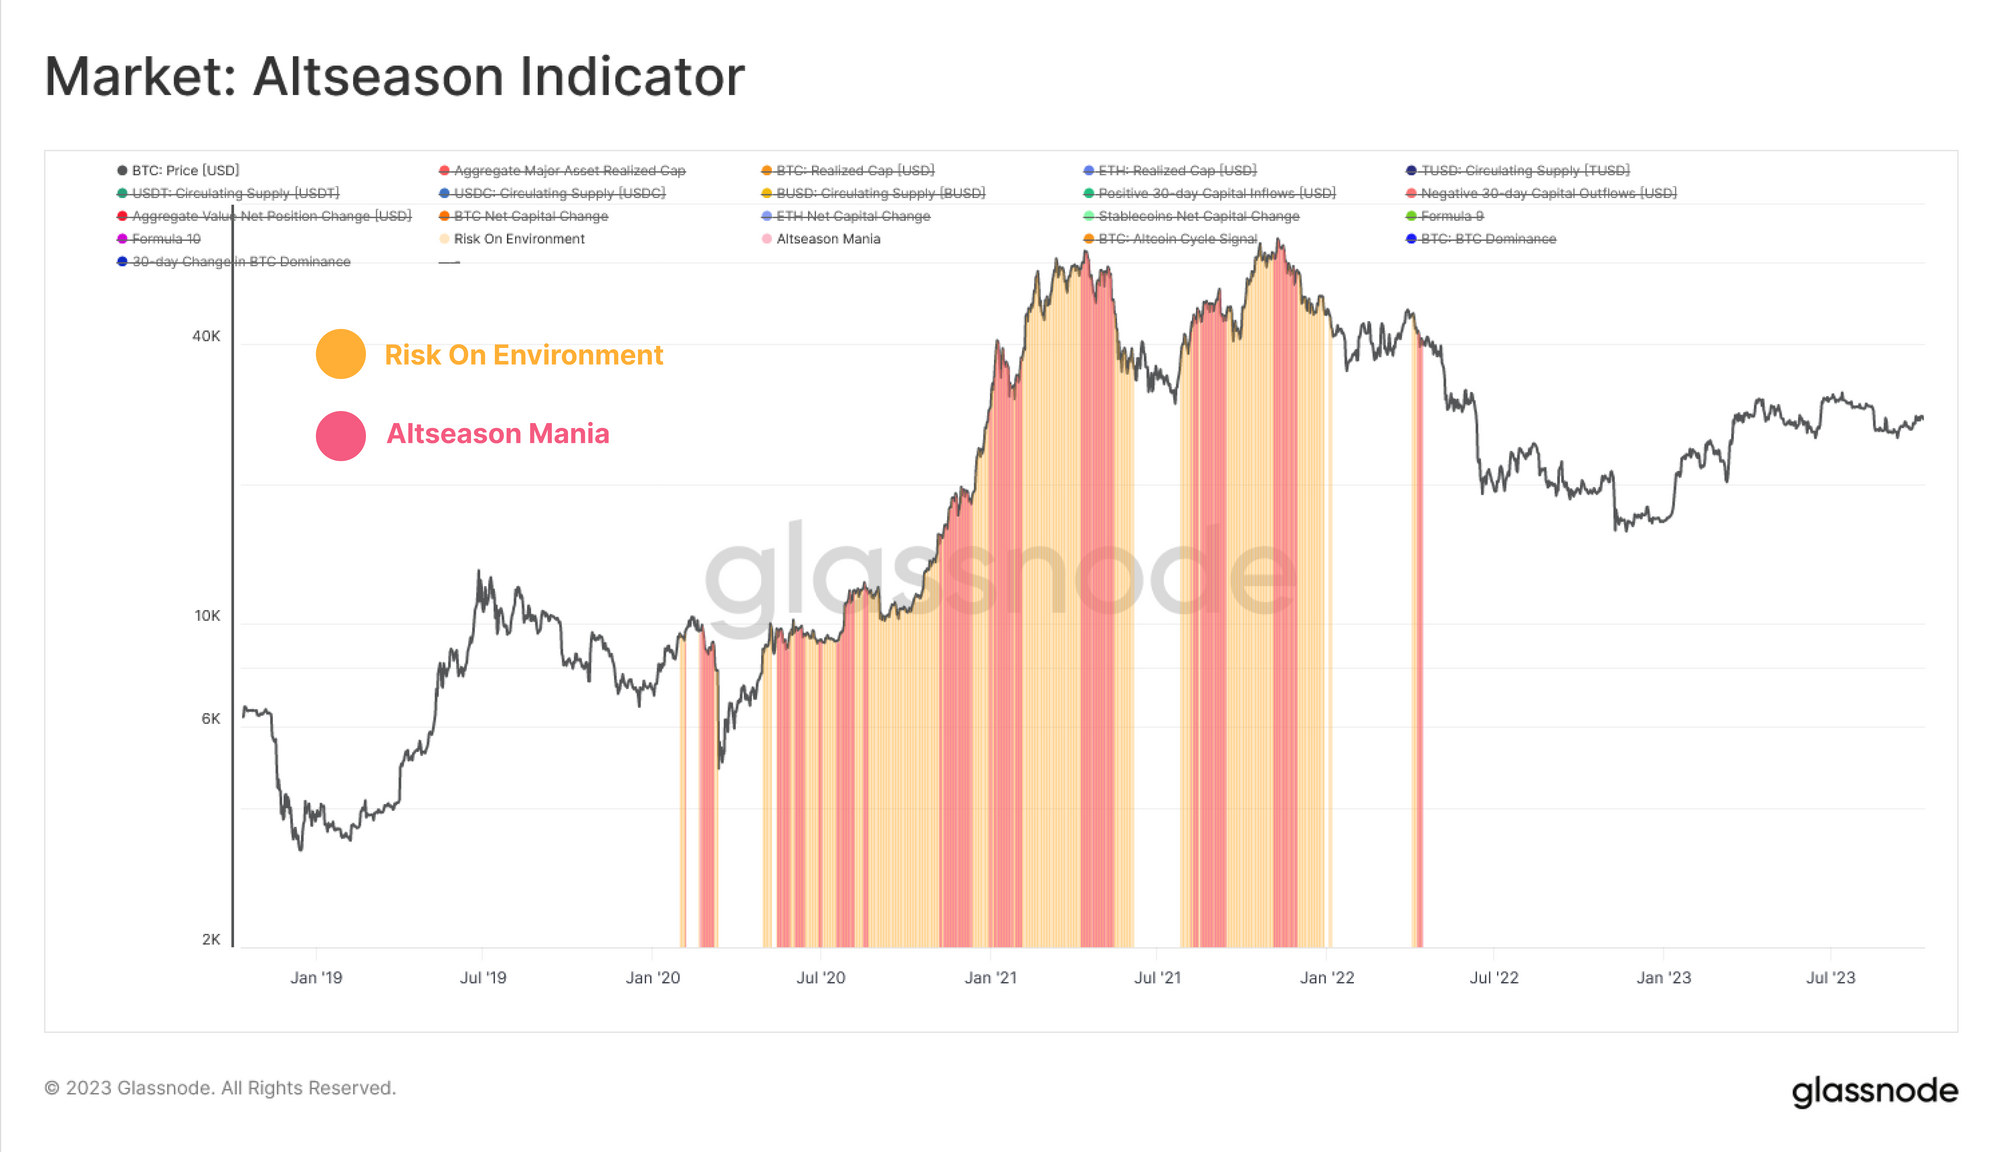
A powerful tool to visualise this capital rotation is using the 30-day change in the Realized Cap for 🟠 BTC and 🔵 ETH, and the total supply of 🟢 Stablecoins (as a proxy for USD quote capital, often deployed for speculation).
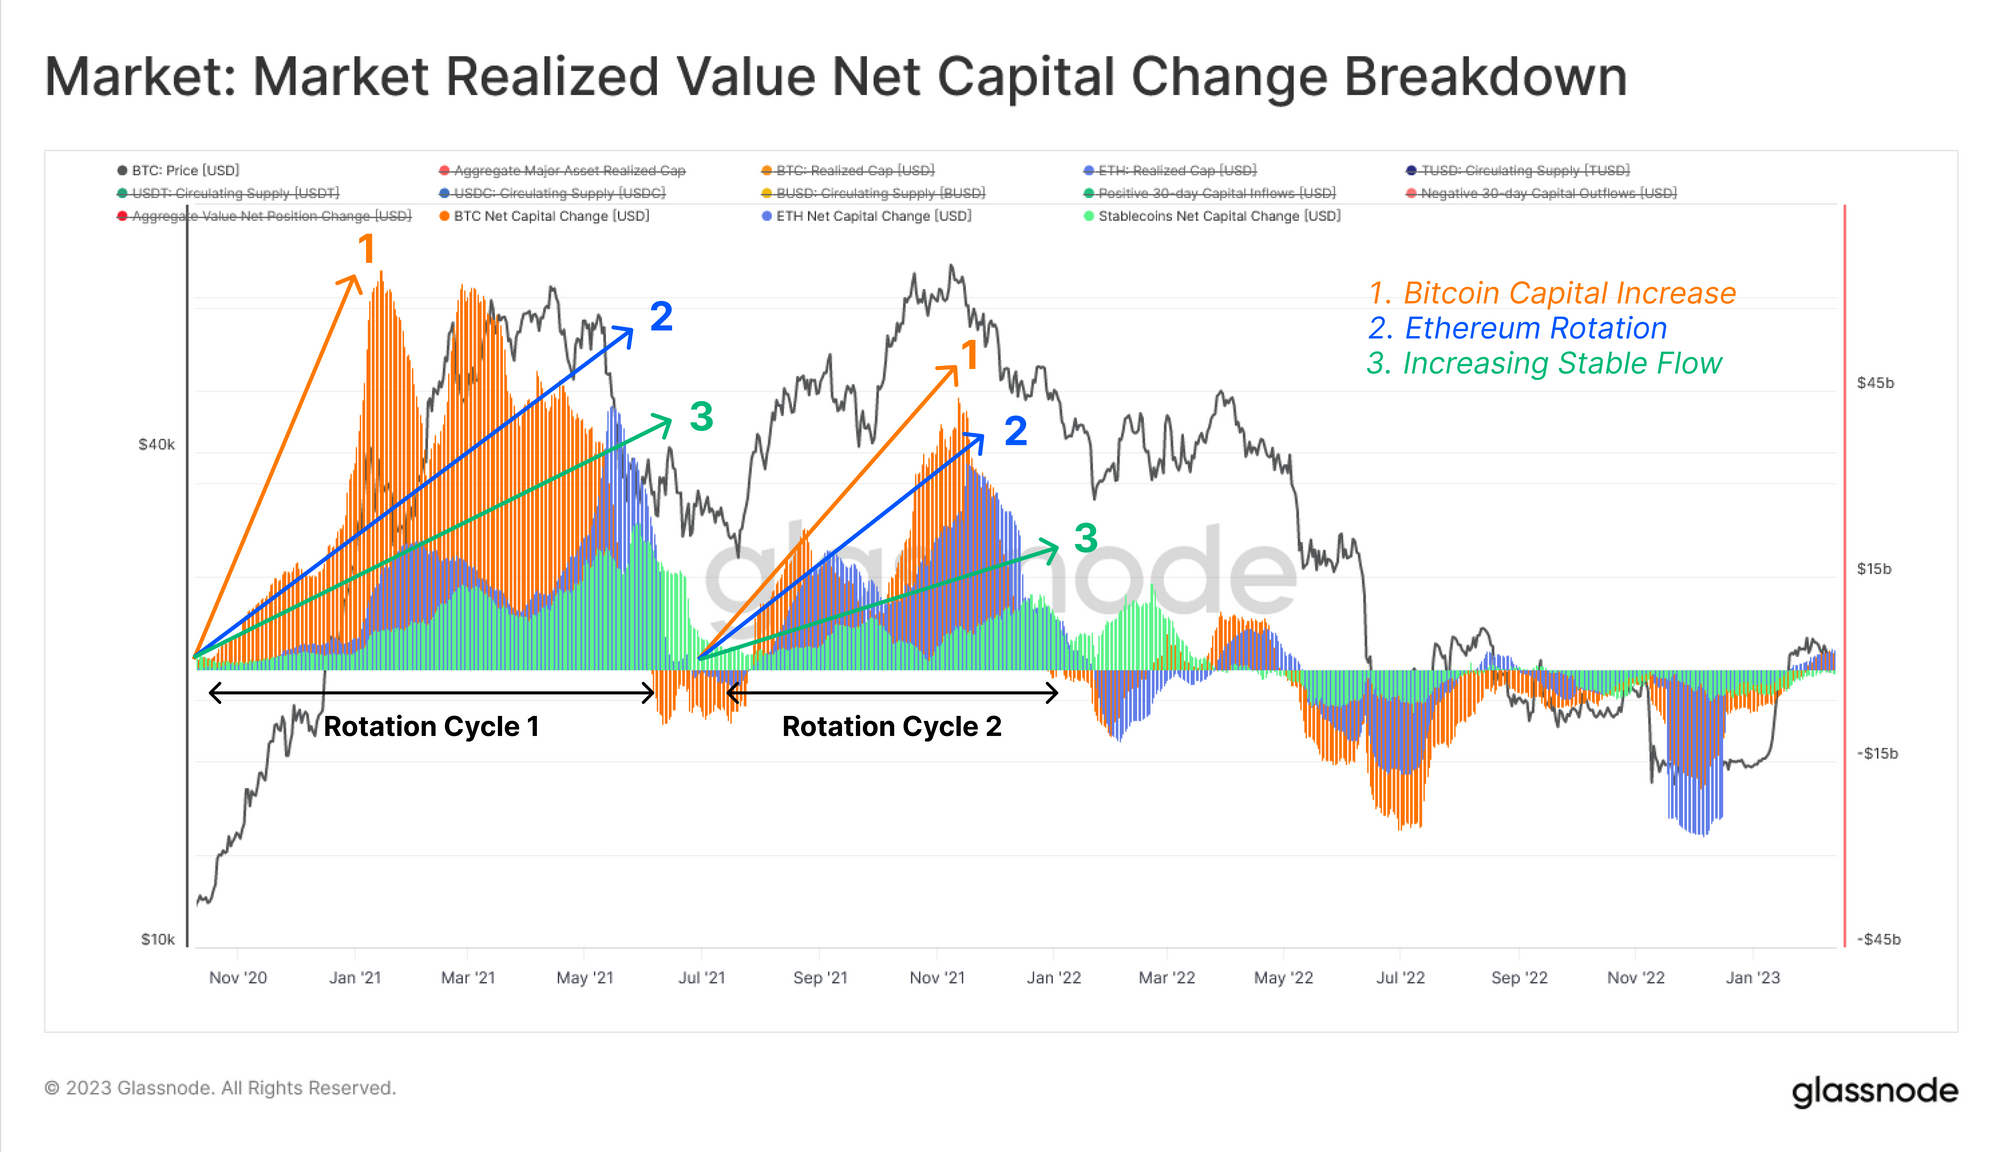
In order to normalize these net position change metrics, we convert this 30-day change to a relative percentage of the Realized Cap (BTC and ETH) or total supply (Stablecoins).
Next, we construct a simple model to identify whether the market is within a risk-on, or a risk-off environment, respectively:
- 🟢 Risk-on is defined when all three of these major assets are exhibiting net capital inflows.
- 🔴 Risk-off is defined if any of the three major assets starts to exhibit net capital outflows.
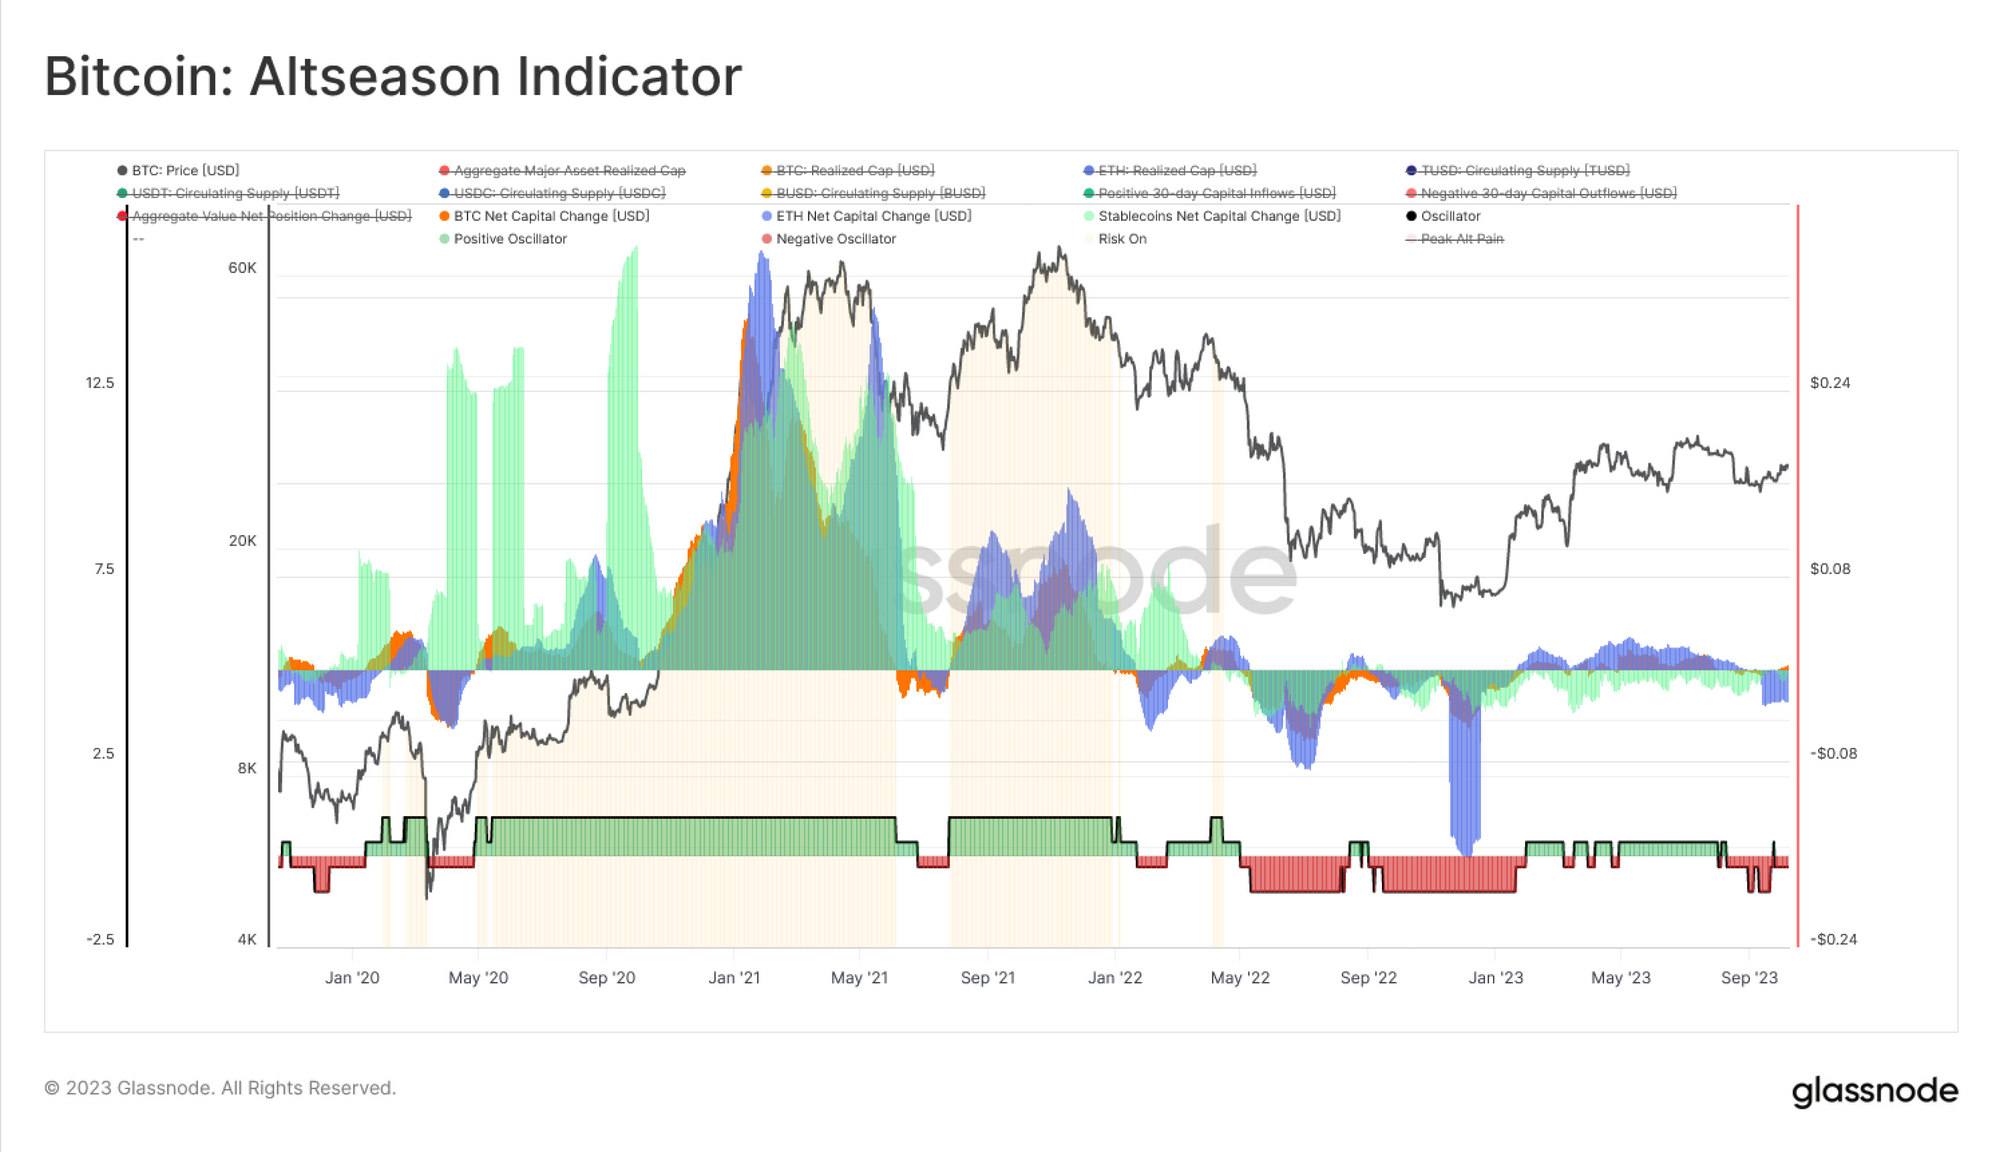
With this broad view of risk on/off environments defined, we can apply one more constraint to filter for periods of explosive Altseason mania within a primary uptrend. With all three majors exhibiting positive capital flows, we then filter only for events where capital is rotating towards to Ethereum and Stablecoins.
This model is accomplished by looking for a positive and increasing 30-day change in the ETH Realized Cap and Stablecoin Total Supply (i.e a positive second derivative). This model simulates the waterfall effect of capital rotating from larger caps, into small caps.
The conditions are as follows:
- Risk on remains when all three majors are exhibiting capital inflows
- Peak Risk on ‘Altseason Mania’ is defined where the capital flows into both Ethereum and Stablecoins is positive and increasing.
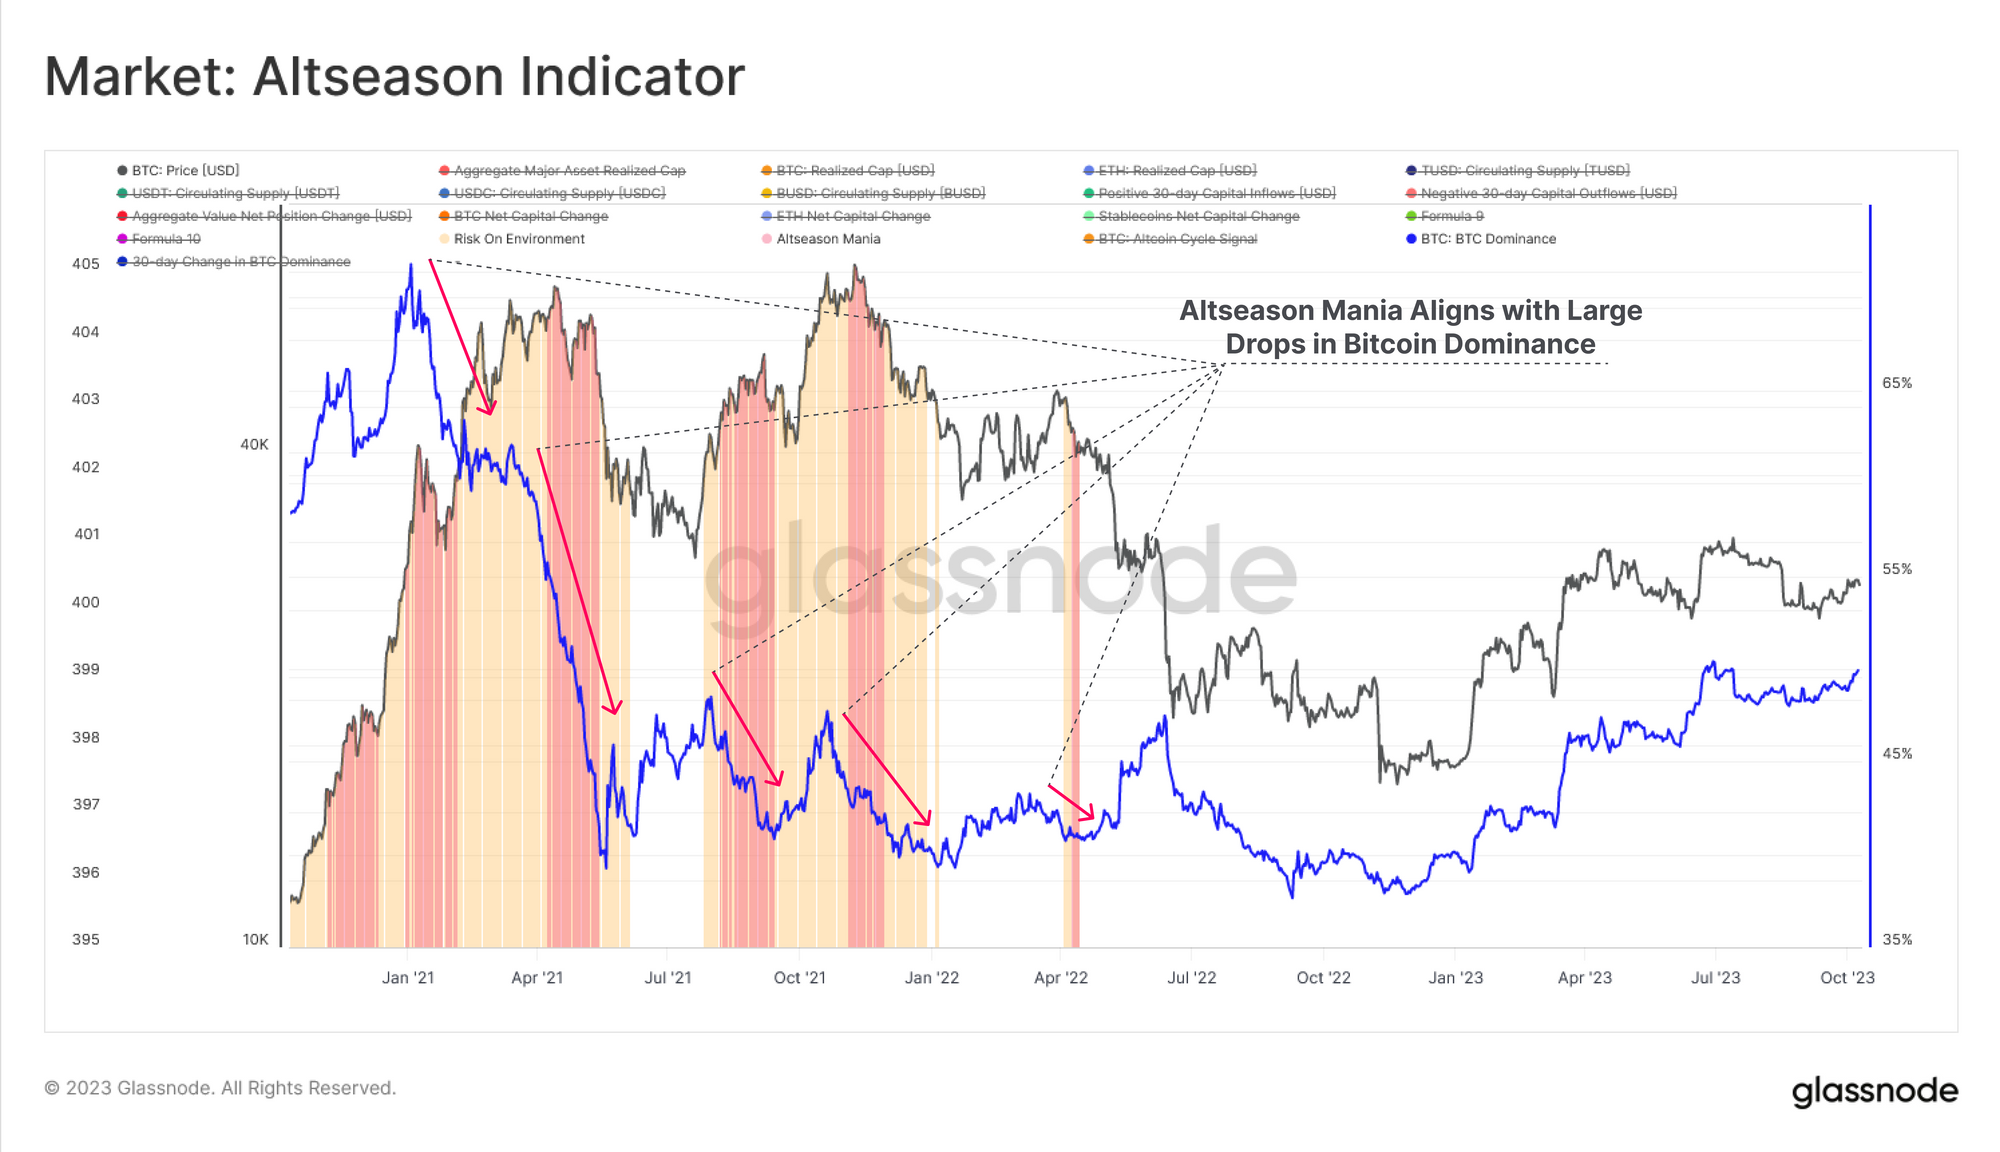
For a sanity check, we can compare this indicator to the 30-day change in Bitcoin Dominance where we note that peaks in this altcoin mania indicator also align with large reductions in Bitcoin Market Cap Dominance.
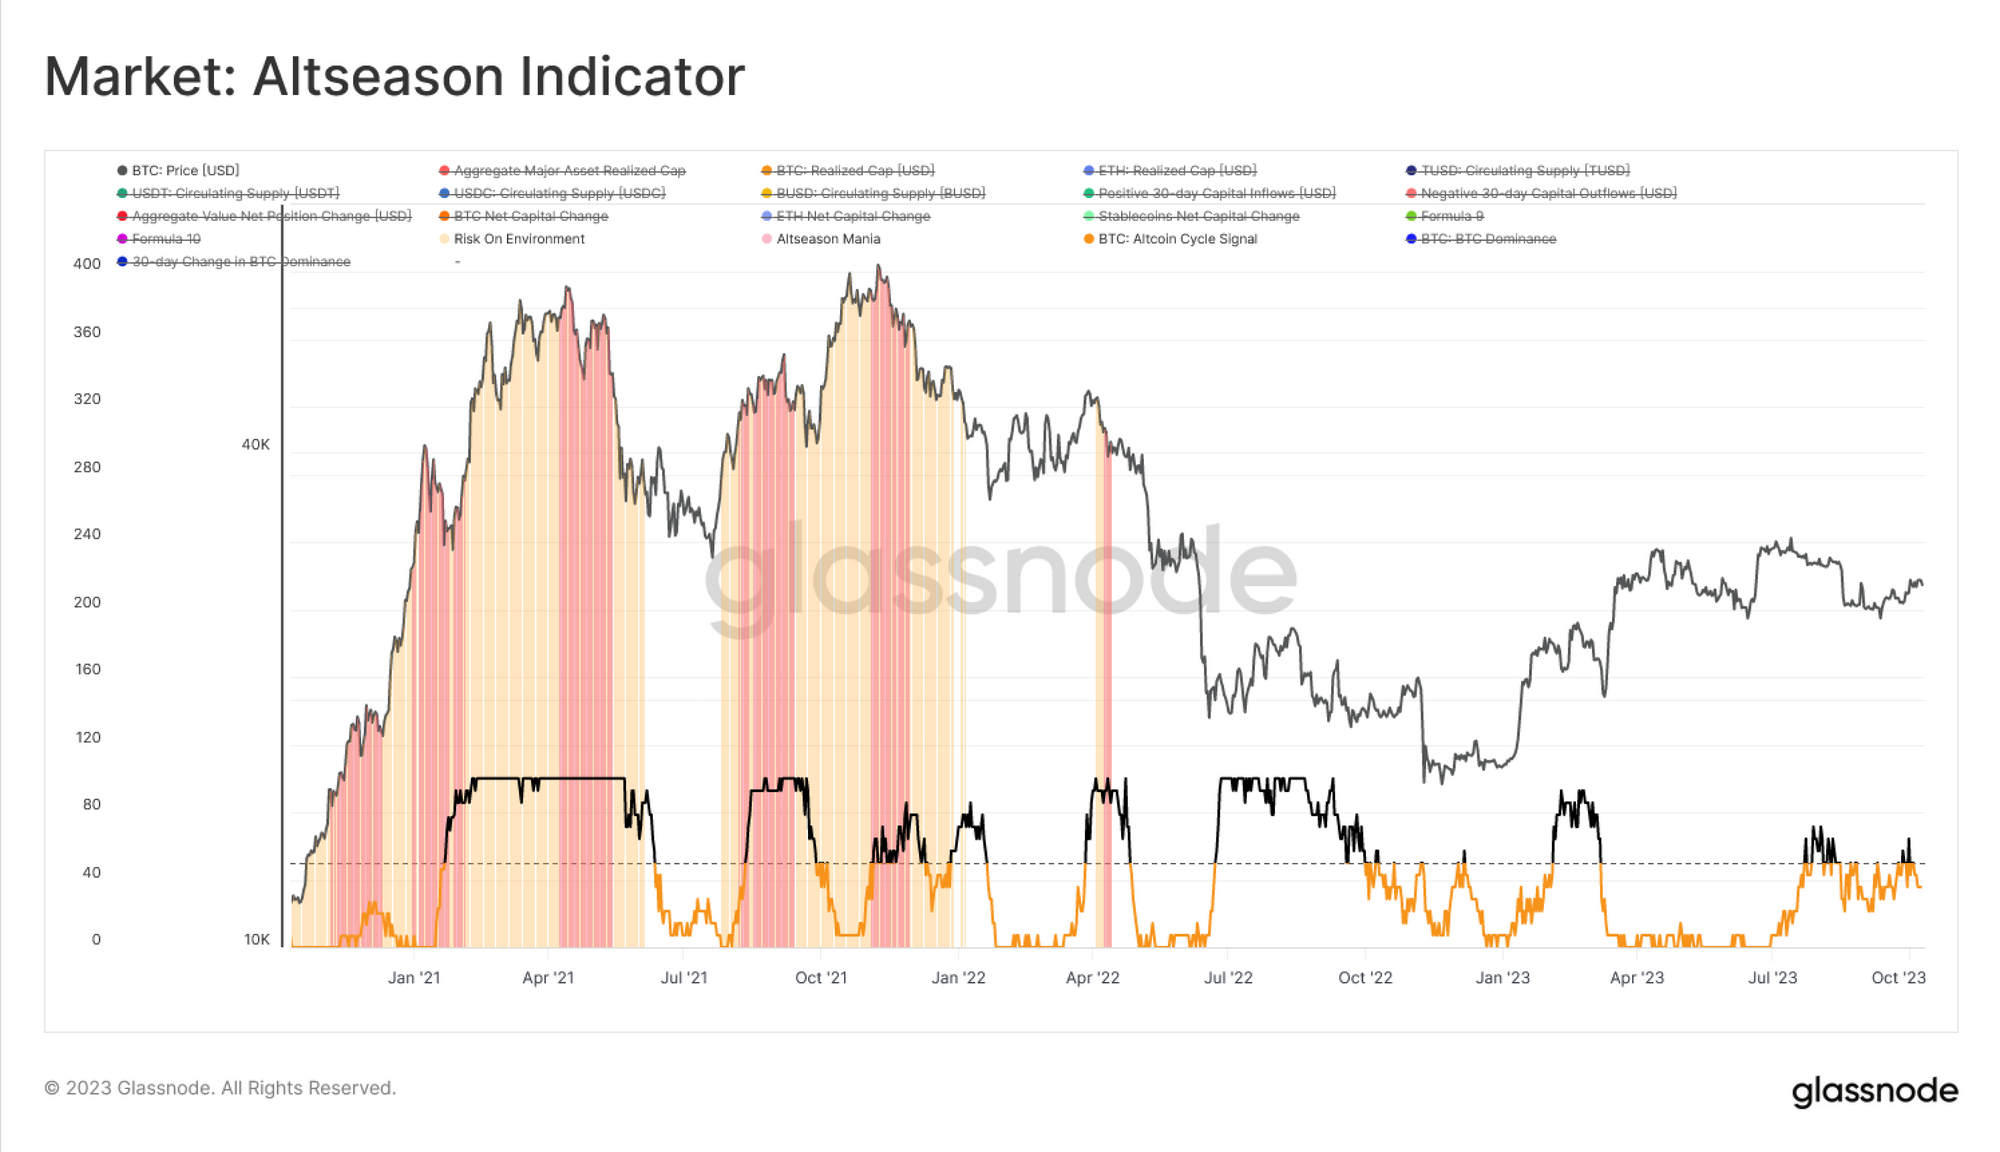
As a final comparison, we can compare it to the Swissblock Altcoin Cycle Signal, where we can see similar peaks (value of 100) in the indicator aligned with capital rotation towards Ethereum and Stablecoins.
Summary and Conclusions
Liquidity continues to dry up across the digital assets as network settlement, Exchange interaction and capital flows reside at cycle lows, heavily underscoring the current acute apathy experienced by the market.
The Long-Term Holder cohort remains resolute as their supply continues to ascend to new ATHs whilst HODLer Growth remains robust, tightening the active tradeable supply.
Despite large fluctuations in valuation for Altcoins, a symptom of the prevailing low liquidity environment, our new Altcoin framework which simulates the waterfall effect of capital rotation suggests a Risk On regime is not in play, providing confluence to the lack of liquidity available to digital assets.
Disclaimer: This report does not provide any investment advice. All data is provided for information and educational purposes only. No investment decision shall be based on the information provided here and you are solely responsible for your own investment decisions.
- Join our Telegram channel
- Follow us and reach out on Twitter
- Visit Glassnode Forum for long-form discussions and analysis.
- For on-chain metrics, dashboards, and alerts, visit Glassnode Studio
- For automated alerts on core on-chain metrics and activity on exchanges, visit our Glassnode Alerts Twitter
