The Week Onchain (Week 50, 2021)

Bitcoin bulls attempt to hold the $50k price level as strong demand pulls coins out of exchanges. However, network profitability suggests this may be the bull/bear line in the sand.

The Week Onchain (Week 50, 2021)

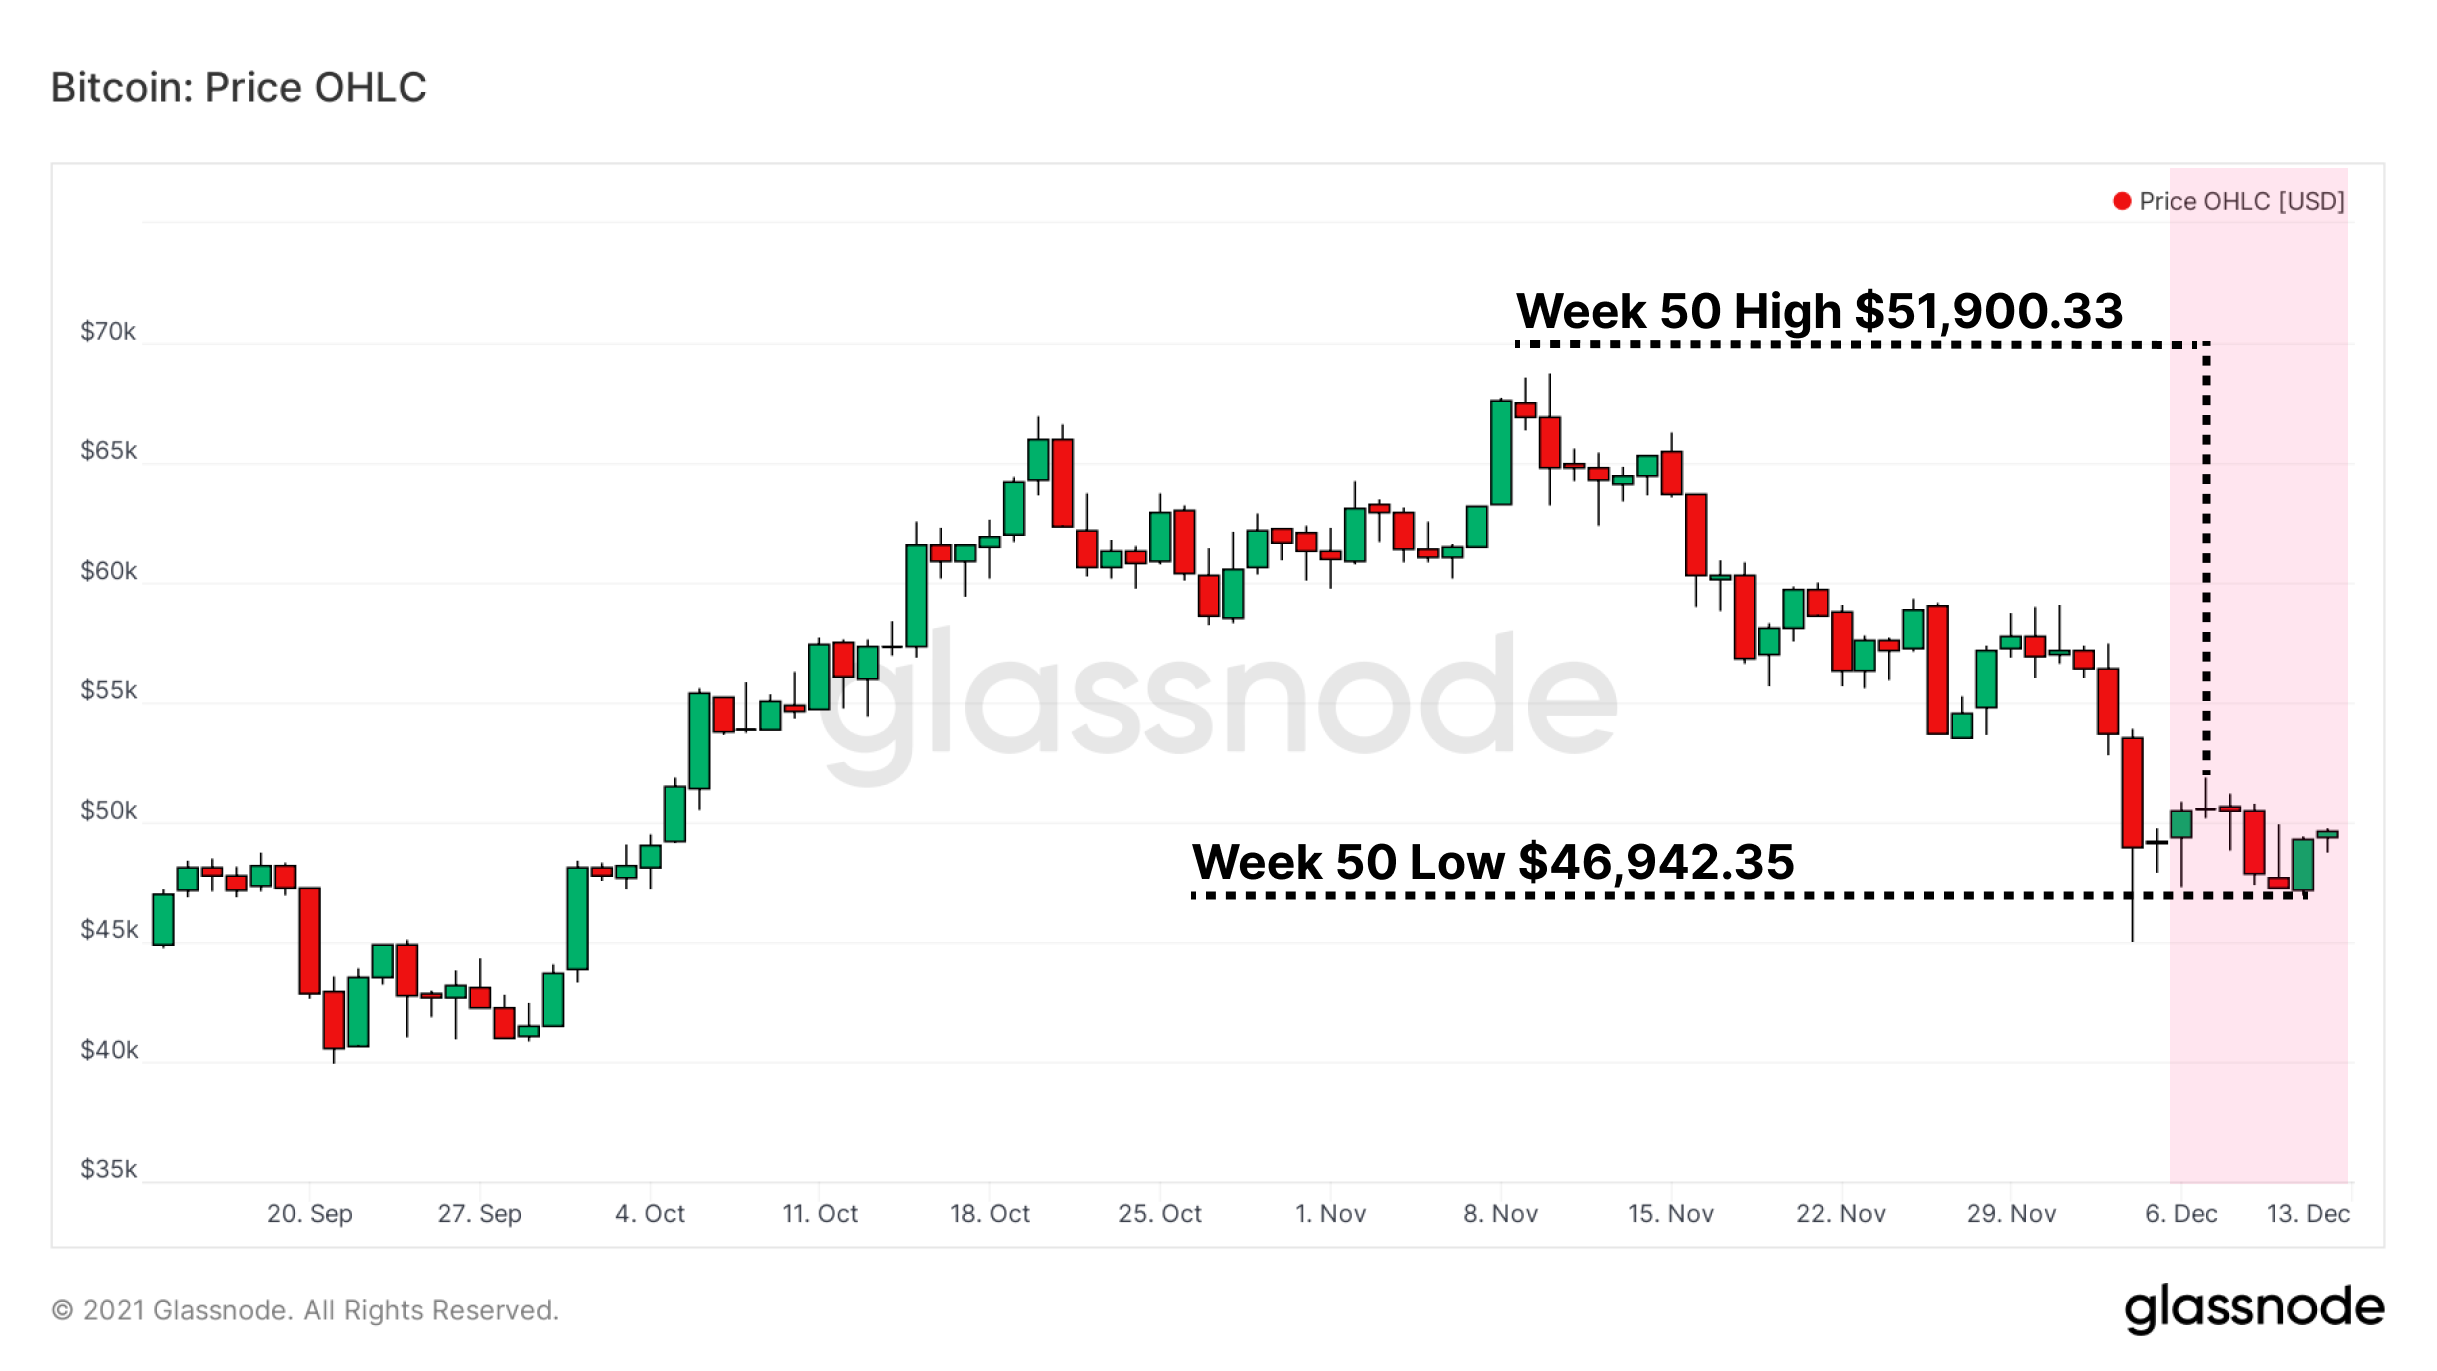
The Bitcoin market has attempted to regain its footing, following a tumultuous and volatile deleveraging event last week. Bitcoin prices were largely range-bound, opening at $49,368, and trading between a high of $51,900, and a low of $46,942.

After significant market volatility like last week's deleveraging event, it's valuable to assess the broad investor response, changes in spending patterns and sentiment, and new emergent trends that are observable in on-chain and derivative data. To achieve this goal, this week's newsletter will make comparisons between the recent deleveraging, and the market structure experienced through May to July.

Discussion of the points above will aim to provide context to the current state of Bitcoin markets, and where we are within the Bitcoin accumulation and distribution game.

Live Chart

Week On-chain Dashboard

The Week On-chain Newsletter now has a live dashboard for all featured charts here. We have also started production for Week On-chain video analysis to provide a deeper dive into the thesis and logic behind each weeks analysis. Visit and subscribe to our YouTube channel, and visit our Video Portal to see our video content.


Realization of Profits and Loss

After large price drawdowns it's natural for some holders to Realize Losses, out of fear that the market is due for further downside, or in capitulation as well below the holder's cost basis.

We're currently observing an acceleration of Realized Losses among holders, trending above $1 Billion daily on two occasions during this correction. While Realized Losses only directly show underwater supply being spent, we typically assume this reflects an upper bound magnitude on new sell pressure, as coins enter back into liquid circulation.

If we compare the current deleveraging to the one in May, we can see:

  • May-July 2021 drawdown shows a deceleration in Realized Losses after the initial capitulation event, as top buyers transferred coins to exchanges for sale.
  • Oct-Dec 2021 drawdown shows an acceleration in Realized Losses indicating a more trigger friendly, and cautious approach by the market, potentially indicative of nervousness of further downside.
Live Chart

However a key difference between these two events can be seen in Exchange Net Flows and the impact on overall exchange balances. In May-July, exchanges saw an enormous influx of some +168k BTC on net over a span of three months. In the current Oct-Dec correction, we have seen a total of 49k BTC flow out of exchanges, making for quite the contrast.

Live Chart

Looking to exchange Net Flow Volumes (on a 7D EMA basis), we can see that the current market is firmly in a regime of net outflows, with 3k to 5k BTC in daily outflows common. Overall, whilst significant losses are most certainly being realized on-chain, they are being met with a significant, and arguably overwhelming demand.

Live Chart

We can also look to market momentum using the 28-day Market Realised Gradient (MRG). This tool measures the relative momentum between price action (Market Cap) and capital flows onchain (Realized Cap). High or descending values have historically provided a signal to take caution, and low or ascending values have historically provided a signal for a more risk-on approach.

Current MRG values display Bitcoin as being in an oversold state, with historically low MRG values. However, the metric has yet to fully level out and plateau, indicating that price and capital flows are both still attempting to reestablish a healthy equilibrium. Early confirmation would be found on a technical break higher, and full confirmation with a break back above the zero bound.

Live Chart

The other side of the onchain equation are investors realizing profits, whom are most often longer-term holders. The magnitude of Realized Profits is in a similar decline to that seen in the first half of 2021 suggesting that fewer profitable coins are spent as the correction proceeds. This is partly due to lower prices, but also signals that in-profit holders are not as interested in spending at current levels.

However, declining realized profits in Jan-May occurred alongside a topping price pattern, suggesting weaker demand as time moved on. Declining realized profits during a correction, as seen in May-July, and at present, likely indicate a returning conviction, and reducing desire to divest at these prices.

A significant return to elevated values in this metric, especially if accompanied by price weakness would be cause for concern however, as it would likely indicate deteriorating conviction among the in-profit cohort, and a fear of further downside.

Live Chart

The Aftermath of Deleveraging

As the Bitcoin market matures, derivative products have become an increasingly relevant influence on price action. Following a deleveraging event, it is also important to assess whether the market is adding more leverage, as traders 'long the dip', or whether the market remains cautious in response to the volatility.

This influence of futures markets on price is particularly dominant during periods where Futures Open Interest climbs above the 380k BTC level. It becomes particularly concerning after a strong price run up and the extended period of Realized Profit prints we observed earlier as:

  • Strong hands and traders transfer coins to newer holders, whom have a higher cost basis and are more sensitive to volatility.
  • High Futures Open Interest provides fuel for a volatile, futures-driven move.

These factors were both prevalent in the May and November tops, which resulted in a cleansing of Futures Open Interest back to ~340k BTC. Note however that Open Interest has climbed by around 5k BTC over the last week. A key metric to watch from here on is whether open interest starts to climb aggressively This would indicate a higher chance that liquidation levels and stop-losses are clustering around the current trading range, and increased expectations of derivative led volatility.

Live Chart

Perpetual futures funding rates are a core data-point for assessing the markets directional bias. Funding Rates help peg the price of these futures as closely to the spot Bitcoin price as possible by:

  • Making longs pay shorts (green) when Perpetual Futures price > spot price
  • Making shorts pay longs (red) when spot price > Perpetual Futures price

Extreme values in Funding Rates have historically signaled peak euphoria, or misery for market participants, often correlating with local market highs and lows, respectively. Before the drawdown last week, we witnessed a local euphoria, evident in the large relative spike in Funding Rates, almost precisely at the market ATH. At the lows of the week, we experienced the opposite, with the first negative print since the $40k lows in October.

While some of this is due to the deleveraging event that took place, two things are worth considering:

  • Leveraged traders were forced to close their positions, clearing out stop-losses and liquidation levels down to $45k (and even lower on some exchanges).
  • Funding rates are only slightly positive at present, and are not climbing significantly. This adds further evidence that a large majority of 'excessive' leverage has been cleared from the market. Similar to Open Interest, this is a metric worth keeping an eye on.
Live Chart

Futures Volume also spiked during the event, which has historically provided notable pivot points in price action. On the most recent impulse Futures Volume in aggregate was ~2 Million BTC.

While this sum in Futures Volume is significant, it remains relatively small compared to both the May and September 2021 drawdowns. Furthermore, it is part of a consistent decline in overall volume that has been established since May.

This seems counter-intuitive as price has more than doubled to ATHs since then, and price increases would seem like an appropriate pairing with increased trading volumes. Note also that volumes are also down on a USD basis versus early 2021, so it's not a function of higher prices equating to less BTC traded.

This change could therefore be a combination of:

  • Futures traders having a lower risk appetite after the historic May 2021 drawdown.
  • Traders taking their funds to other markets such as altcoins.
  • A view the Bitcoin markets are still in fact in a longer term macro consolidation, digesting the appreciation, volatility and rapidly changing global events since this time last year.
Live Chart

After a deleveraging event, it is typical that spot markets (and thus on-chain data) return as the dominant forcing function for dictating price movements. A useful tool for identifying this transition between derivative led and spot/onchain led market structure is to look at Perpetual Futures Open Interest as a proportion of the Bitcoin Market Cap:

  • High values (>1.3%) signal derivatives dominance
  • Low values (<1.1%) signal spot dominance

While these values have not reverted to historically low levels such as those seen in May, they've returned to much healthier levels, previously seen throughout the late 2021 move from $30k to $60k+. This further supports that a meaningful deleveraging event has occurred, and the market appears to be responding with caution, rather than levering up once again.

Live Chart

Finally, we will close out with investor profitability. We can use Net Unrealized Profit/Loss (NUPL) as a gauge for when additional sell-side may be activated should Bitcoin prices languish, or decline further. The historical battleground for bulls and bears sits at a network-wide profitability of 50%, meaning half of the Bitcoin Market Cap is held as unrealized profit.

  • In bear trends this zone provides resistance, as holders are increasingly willing to cut their positions at moderate profit, as can be seen in the May to July price action.
  • In bull trends this zone provides support from holders looking add to their profitable positions, as can be seen through August to November.

Per this chart, the current leg down in price seems to resemble a correction within a larger bull trend - a stark contrast to May where NUPL sliced cleanly through the 50% level. However, the transition between this area marks the difference between Belief-denial (green coloration) and Optimism-Anxiety (yellow coloration), an appropriate description for current holder sentiment at present.

As the Bitcoin market consolidates, it appears that derivatives markets have taken more of a back-seat relative to spot markets, and a meaningful deleveraging event has occurred. There are signs conviction is returning to spot investors and demand remains significant, however the market still sits atop a key level of psychological support as seen in the NUPL metric. It is possible that this trading range is defining the bull-bear line in the sand, and a key risk is whether a possible transition into less favourable conditions occurs should it fail to hold.

Live Chart

Product Updates


Disclaimer: This report does not provide any investment advice. All data is provided for information purposes only. No investment decision shall be based on the information provided here and you are solely responsible for your own investment decisions.